THE ILLINOIS MATHEMATICS TEACHER - ICTM Home vol 55 no 1 - 2004...The Illinois Mathematics Teacher...
42
THE ILLINOIS MATHEMATICS TEACHER EDITORS Marilyn Hasty and Tammy Voepel Southern Illinois University Edwardsville Edwardsville, IL 62026 REVIEWERS Ms. Angela G. Andrews Ms. Carole Bauer Ms. Edna Bazik Mr. William Beggs Mr. Dane Camp Mr. Bill Carroll Ms. Allison Claus Ms. Karen Daniels Mr. Ron Davis Ms. Sandra Dawson Ms. Lesley Ebel Mr. Alan Foster Ms. Debra Gerdes Mr. Charles Hamberg Mr. James Herrington Ms. Kathleen Hickey Mr. Alan Holverson Mr. John Johnson Ms. Lucille Kozanecki Ms. Lorelei Lahsin Ms. Maureen Laude Ms. Susan McMillan Ms. Diane Metzger Ms. Diane Milauskas Mr. George Milauskas Mr. John Miller Mr. Jack Mummert Ms. Jackie Murawska Ms. Patricia G. Nichols Ms. Barbara O’Donnell Ms. Jacqueline Palmquist Mr. Randy Pippen Ms. Susan Pippen Ms. Anne Marie Sherry Ms. Aurelia E. Skiba Ms. Jean Smith Mr. Larry Stonecipher Ms. Mary Thomas Ms. Lynn Tremmel Ms. Fern Tribbey Mr. Bob Urbain Mr. Ron Vavrinek Ms. Nadine Verderber Mr. R. Mark Wall Ms. Sue Younker ICTM GOVERNING BOARD 2004 Bob Urbain, President Rich Wyllie, Treasurer Gwen Zimmermann, Secretary Ann Hanson, Executive Director Sue Pippen, Past President Fern Tribbey, Historian Dane Camp, Board Chair Directors: Virginia Kent, Sandra Graham, Early Childhood-6 (2002-2005) 9-12 (2001-2004) Cathie Lewis, Diane Metzger, Early Childhood-6 (2003-2006) Community College (2001-2004) Edna Bazik, Claire Krukenberg, 5-8 (2002-2005) University (2002-2005) Patricia Guinne, Chuck Hamberg, 5-8 (2001-2004) Director-At-Large (2002-2005) Lanis Lenker, Dane Camp, 9-12 (2003-2006) Director-At-Large (2001-2004) Judith Olsen, Director-At-Large (2003-2006) The Illinois Mathematics Teacher is devoted to teachers of mathematics at ALL levels. The contents of the Illinois Mathematics Teacher may be quoted or reprinted with formal acknowledgement of the source and a letter to the editor that a quote has been used. (Note: Occasionally copyrighted material is used with permission. Such material is clearly marked and may not be reprinted.)
Transcript of THE ILLINOIS MATHEMATICS TEACHER - ICTM Home vol 55 no 1 - 2004...The Illinois Mathematics Teacher...
THE ILLINOIS MATHEMATICS TEACHER
EDITORS Marilyn Hasty and Tammy Voepel
Southern Illinois University Edwardsville Edwardsville, IL 62026
REVIEWERS
Ms. Angela G. Andrews Ms. Carole Bauer Ms. Edna Bazik Mr. William Beggs Mr. Dane Camp Mr. Bill Carroll Ms. Allison Claus Ms. Karen Daniels Mr. Ron Davis Ms. Sandra Dawson Ms. Lesley Ebel Mr. Alan Foster
Ms. Debra Gerdes Mr. Charles Hamberg Mr. James Herrington Ms. Kathleen Hickey Mr. Alan Holverson Mr. John Johnson Ms. Lucille Kozanecki Ms. Lorelei Lahsin Ms. Maureen Laude Ms. Susan McMillan Ms. Diane Metzger
Ms. Diane Milauskas Mr. George Milauskas Mr. John Miller Mr. Jack Mummert Ms. Jackie Murawska Ms. Patricia G. Nichols Ms. Barbara O’Donnell Ms. Jacqueline Palmquist Mr. Randy Pippen Ms. Susan Pippen Ms. Anne Marie Sherry
Ms. Aurelia E. Skiba Ms. Jean Smith Mr. Larry Stonecipher Ms. Mary Thomas Ms. Lynn Tremmel Ms. Fern Tribbey Mr. Bob Urbain Mr. Ron Vavrinek Ms. Nadine Verderber Mr. R. Mark Wall Ms. Sue Younker
ICTM GOVERNING BOARD 2004 Bob Urbain, President Rich Wyllie, Treasurer Gwen Zimmermann, Secretary Ann Hanson, Executive Director Sue Pippen, Past President Fern Tribbey, Historian Dane Camp, Board Chair Directors: Virginia Kent, Sandra Graham, Early Childhood-6 (2002-2005) 9-12 (2001-2004) Cathie Lewis, Diane Metzger, Early Childhood-6 (2003-2006) Community College (2001-2004) Edna Bazik, Claire Krukenberg, 5-8 (2002-2005) University (2002-2005) Patricia Guinne, Chuck Hamberg, 5-8 (2001-2004) Director-At-Large (2002-2005) Lanis Lenker, Dane Camp, 9-12 (2003-2006) Director-At-Large (2001-2004) Judith Olsen, Director-At-Large (2003-2006) The Illinois Mathematics Teacher is devoted to teachers of mathematics at ALL levels. The contents of the Illinois Mathematics Teacher may be quoted or reprinted with formal acknowledgement of the source and a letter to the editor that a quote has been used. (Note: Occasionally copyrighted material is used with permission. Such material is clearly marked and may not be reprinted.)

Illinois Mathematics Teacher – Summer, 2004...............................................................................1
THE ILLINOIS MATHEMATICS TEACHER Volume 55, No. 1 Summer, 2004
Table of Contents Pitching Proportional Reasoning......................................................................................... 3 John Miller - Proportions Circular Clock Movements: A Geometric Application ..................................................... 9 Duncan and Litwiller – Geometry The Elementary Math Learning Stations Day:................................................................. 10 A Performance Assessment for Elementary Teacher Education Students Nancy Gaylen – Preservice Teachers and Elementary Student Created AL-Abacus leads to Place Value Understanding and.......................... 18 Mathematical Discourse Harteg and Monical – Number Sense A Not So Typical Percent Review....................................................................................... 23 Amber Samuilis – Percent Activity Questioning Our Support for Preservice and New Teachers .......................................... 26 Barbara O’Donnell – General Interest Instant Insanity .................................................................................................................... 32 Doug Earls – Logic, Problem Solving The transformation of )(xf ................................................................................................ 38 Dane Camp - Poetry Reviewer Application........................................................................................................... 39

Illinois Mathematics Teacher – Summer, 2004...............................................................................2
From the Editors… Welcome to the Summer issue of the Illinois Mathematics Teacher. We hope you are enjoying your summer vacation. This issue of the IMT once again contains many useful and interesting articles and activities covering a wide range of topics. John Miller has an activity to help teach proportions using baseball. There is a quick geometry application involving clocks. Nancy Gaylen describes a way to involve preservice teachers and elementary students. The article on the AL-Abacus will help students with number sense and introduce some math history. If you are covering percents in your class, check out the activity that Amber Samuilis uses to review the material. The article by Barbara O’Donnell offers interesting information in the form of a case study of a specific preservice teacher. Finally, if you find yourself in need of some “brain stretching” during your leisurely summer vacation, be sure to check out Instant Insanity and prepare to get hooked. As usual, included in this issue is a form for becoming a reviewer for the IMT. In order to ensure that the articles are of interest to our readers, we send them to reviewers to get their approval. Also, there is a membership application form on the inside back cover. We would appreciate hearing from any of you out there who are reading the journal. We would especially like to hear about any activities from the IMT that you have used with your students. Your comments and constructive criticism are heartily solicited. Thank you for sharing.
Marilyn and Tammy editors Guidelines for Submitting Manuscripts Prospective authors should send: • Five (5) copies of your article, typed, double-spaced, 1-inch margins. Put your name and
address only in the cover letter. No identifying information should be contained in copies of the manuscript. Articles should be no more than ten pages in length, including any graphics or supplementary materials.
• A diskette with your article, including any graphics. We prefer that the article be written in Microsoft Word and that it be saved on an IBM-compatible disk. Graphics should be computer-generated or drawn in black ink and fit on an "11"8 2
1 × page. • Your name, address, phone, and e-mail (if available) should be included in a cover letter. • A photo of yourself (Illinois authors only), color or black/white. • Articles may be submitted electronically to [email protected].
To: Marilyn Hasty and Tammy Voepel Mathematics Department Box 1653 Southern Illinois University Edwardsville Edwardsville, IL 62026-1653

Illinois Mathematics Teacher – Summer, 2004...............................................................................3
Pitching Proportional Reasoning John Miller [email protected] Glenview, Illinois 60025
What do ratios, rates, and proportions have in common with a one-armed pitcher? The answer is a story. And the story begins with this challenge: “School mathematics experiences at all levels should include opportunities to learn about mathematics by working on problems arising in contexts outside mathematics” (NCTM, 2000). Middle school students, in particular, prefer real-life problems and situations. Connecting with these students in contexts outside mathematics can be especially effective. This article discusses some of the specific teaching challenges involved and provides lesson ideas to help middle school students understand and develop proportional reasoning. A story involving the baseball statistic ERA (Earned Run Average) provides the outside context. Teaching Challenges
On the one hand, young adolescents are curious about their world and are willing to learn new things they consider useful to solve real-life problems (Forte & Schurr, 1993). On the other hand, mathematics knowledge tends to be separated from its uses in the real world (Wilson, Brent G., Teslow, James L., & Taylor, Lyn, 1993). Why is making real-world connections in mathematics so difficult?
The answer to that question may encompass the curriculum, standardized testing, and the underlying subject matter itself. No subject is inherently more measurable than math. Measurement, after all, is a basic mathematical cornerstone. In a no child left behind world, standardized test scores are increasingly important measures
of education. Curriculums are designed to prepare students to do well on standardized tests. Ultimately, this means preparing individual students to work neatly packaged exercises in a timed setting, by themselves. Factor in teaching time constraints, and it’s not surprising that making real-life connections can get pushed to the back of the line.
Certainly, teaching standard math concepts and their related algorithms, problem-solving skills, and even test-taking strategies are important. As Chaplin and Anderson (2003) point out, however, creating classroom situations that extend students knowledge and help them recognize mathematical structures in different contexts are key to building transfer and generalization. Transfer and generalization, after all, are the ultimate goals of education. The question becomes: How can this best be achieved? In the case of proportional reasoning, the answer can involve a story. Start with a Story Stories provide opportunities to illustrate math concepts in real-world settings that are appealing and can be powerful (Murphy, 1999). From our own experiences, we know that stories are powerful learning tools. And the story of Jim Abbott is a good one. (See the page after the article.) You don’t have to be a baseball fan to relate to Jim Abbott as a person and as a role model. Reading his story, even in the abbreviated version presented here, can build a bridge to connect proportional reasoning with this real-life person. His

Illinois Mathematics Teacher – Summer, 2004...............................................................................4
story may also reinforce school goals regarding character and good citizenship. Access Prior Knowledge
After students read the story, ask them what they know about the measure ERA. A web diagram or K-W-L chart can help facilitate this discussion. From the story itself, they learn that ERA is an abbreviation for a pitcher’s Earned Run Average. All students should recognize the term average. Some students may be familiar with this statistic and know that earned runs are “runs that are the pitcher’s fault.” That is, earned runs are the result of hits or walks, not fielding errors. In a general sense, ERA is the average number of earned runs a pitcher gives up in a game. A pitcher with an ERA of 3.00, for example, gives up an average of 3 earned runs “per game.”
Build Background
It may be helpful to display baseball cards or sports articles referencing ERA. Students may observe that ERA is always expressed as a decimal, rounded to the nearest hundredth, such as 3.94 or 4.18. An ERA of 3.00 or less is considered excellent. This provides a context for Jim Abbott’s 1991 ERA: 2.89. Since ERA measures the average number of earned runs a pitcher gives up in a game, ask students what measures can be used to determine the length of a baseball game. Possible answers may include time, innings, and outs.
Help students understand that the two quantities being compared, earned runs and games, have different units of measure. Baseball games are usually measured in innings, and a standard game is nine innings. Therefore, ERA is a rate comparing two different units, earned runs allowed and innings pitched. This rate is more complex than the ratio for pitch count, for instance,
where both balls and strikes are measured in the same unit (number of pitches).
Although a standard game is nine innings long, it often involves more than one pitcher. Suppose a pitcher allows one earned run in three innings. What is his ERA for that game? Allow students to work with a partner to find the answer (3.00). Then have volunteers explain how they solved the problem. Some students will see that allowing one earned run in three innings is equivalent to allowing three earned runs in nine innings (one standard game). Tell students that they are really using a mathematical proportion, which is a comparison of two equal ratios.
Introduce Proportional Reasoning
Explain that proportions are similar to equivalent fractions. They know, for example that 1
3 = 39 . In the case of a
proportion, however, the numbers represent ratios comparing two quantities:
1 run
3 innings = 3 runs
9 innings .
A pitcher’s ERA can be calculated based on nine innings because nine innings is the standard length of a baseball game. If a pitcher allows one earned run in three innings, this is proportional to allowing three earned runs in nine innings. Therefore, a pitcher who allows one earned run in three innings would have an ERA of 3.00 for that game. It may be helpful to set up and then have students complete the following table to illustrate an ERA of 3.00. (Student completed items are shown in parentheses.) 3.00 ERA Earned Runs
1 2 3 4 5 6
Innings Pitched
3 (6) 9 (12) (15) (18)

Illinois Mathematics Teacher – Summer, 2004...............................................................................5
Generalizing the Proportion The lesson can be ended here or, if the situation is appropriate, be extended to generalize proportional thinking about calculating ERA. Challenge students to use proportional reasoning to answer this question: What is the ERA for a pitcher who allows three earned runs in six innings? Again, ask volunteers to explain their answers. For example, someone may say that a pitcher who allows three earned runs in six innings is allowing an average of one earned run every two innings, which would be proportional to four and one half earned runs in nine innings. Therefore, the pitcher’s ERA is 4.50.
This reasoning can be represented mathematically as follows.
3 Earned Runs
6 Innings Pitched = 1 Earned Run
2 Innings Pitched =
4.50 Earned Runs9 Innings Pitched
At this point, you can help students understand the following general proportion for ERA.
Total Earned Runs Total Innings Pitched =
ERA9
Explain that because a proportion is an equation, they may use the Multiplication Property of Equality to develop a general equation for ERA. Guide or challenge students to solve the above equation for ERA.
9 × Total Earned Runs
Total Innings Pitched = 9 × ERA
9 or
9 × Total Earned Runs
Total Innings Pitched = ERA
Have students use this equation to
check the answer to the earlier question
about the ERA of a pitcher who allowed three earned runs in six innings.
ERA = 9 × 36 =
276 = 4.50
It may be helpful to have students work other examples. Following the article there is an ERA worksheet that can be assigned for fun or extra credit, to reinforce the ideas discussed. Extending Connections The lesson also provides many opportunities for extensions into reading or writing. Not surprisingly, there are several biographies about Jim Abbott available in differing lengths and reading levels, and you may want to make copies available to students interested in reading more about him. His story is also included as parts of two other books about people who overcome disabilities: • Top 10 Physically Challenged Athletes
by Jeff Savage (Enslow Publishers: 2000);
• Extraordinary People with Disabilites by Deborah Kent (Children’s Press: 1996).
In Perspective Proportional reasoning spans mathematical standards related to number and operations, algebra, geometry, measurement, and data analysis and probability. It is one of the most important abilities for students to develop during middle school (Langrall & Swafford, 2000). As Lamon (1993b) points out, limiting discussions of proportional thinking to well-known measures such as speed and price may actually allow students to substitute memorization of formulas for real understanding of the concepts involved.

Illinois Mathematics Teacher – Summer, 2004...............................................................................6
Discussing ERA provides a real-life connection with which students can readily identify. Transfer is further built in by tying the mathematics to a powerful story with a positive message. The lesson itself can easily be knit into an ongoing curriculum fabric. The payoff may include both a teachable moment and students better prepared to use proportional reasoning when taking standardized tests. References Chapin, Suzanne H. and Anderson,
Canavan. “Formal Proportional Reasoning.” Mathematics Teaching in the Middle School (April 2003): 420-425.
Forte, Imogene and Schurr, Sandra. The Definitive Middle School Guide. Nashville, TN: Incentive Publications, Inc., 1993: 27.
Lamon, Susan J. “Ratio and Proportion: Connecting Content and Children’s Thinking.” Journal for Research in
Mathematics (January 1993b): 41-61.
Langrall, Cynthia W. and Swafford, Jane. “Three Balloons for Two Dollars: Developing Proportional Reasoning.” Mathematics Teaching in the Middle School (December 2000): 254–261.
Murphy, Stuart J. “Learning Math Through Stories.” School Library Journal (March 1999): 122-123.
National Council of Teachers of Mathematics (NCTM). Principles and Standards for School Mathematics. Reston, VA: NCTM, 2000: 65-66.
Wilson, Brent G., Teslow, James L., and Taylor, Lyn. “Instructional Design Perspectives on Mathematics Education with Reference to Vygotsky’s Theory of Social Cognition.” Focus on Learning Problems in Mathematics. (Spr-Sum 1993): 65-85.
Answers to Exercises on Following Activity
2. 4.50 3. 2.25 4. 3.58, 1.88, 3.16, 4.38, 2.32, 3.01
5. Durocher and Johnson 6. Hernandez
7. 3.09 8. 2.50
9. Sample answer: Use compatible numbers. 30 earned runs in 90 innings would give an ERA of
3.00, so his ERA is about 3.00.
10. 1.12

Illinois Mathematics Teacher – Summer, 2004...............................................................................7
Jim Abbott was a star quarterback
and a star pitcher on his high school teams
in Flint, Michigan. After high school, he
went on to become a star pitcher at the
University of Michigan. In 1988, he helped
lead Team USA to the Olympic Gold Medal
in baseball, pitching a complete game
victory in the final game against Japan.
From Olympic hero, the Los Angeles
Angels brought Jim directly to the major
leagues in 1989, without his ever having
played minor league baseball. Jim didn’t
disappoint, winning 12 games in his rookie
season. In 1991, he had his best major
league season, winning 18 games and
posting a 2.89 ERA (Earned Run Average).
After four strong seasons with the
Angels, the New York Yankees traded for
Jim in 1993. On September 4th of that year,
Jim pitched a no-hitter against the Cleveland
Indians. This would be the highlight of his
major league career.
Jim Abbott was a star pitcher in high
school, in college, in the Olympics, and for
several years in the major leagues. What
makes his story so amazing, though, is that
he was born with a small right arm and no
right hand. When he pitched, he would keep
his baseball glove tucked in his short right
arm and throw the ball with his left arm.
After releasing the pitch, he would quickly
slide the glove onto his good hand so that he
could field his position. He even taught
himself to bat, using a modified one-handed
batting stance.
But that’s not the end to the story.
By 1997, Jim’s pitching skills had
diminished. Rather than quit or complain, he
allowed himself to be sent to the minor
leagues for the first time. He never lost his
positive attitude. Although no longer a star,
he earned his way back to the major leagues.
You see, he had learned long before not to
let adversity get him down.
For when the One Great Scorer comes To write against your name, He marks not that you won or lost– But how you played the game.
Grantland Rice
Illinois Mathematics Teacher – Summer, 2004...............................................................................8
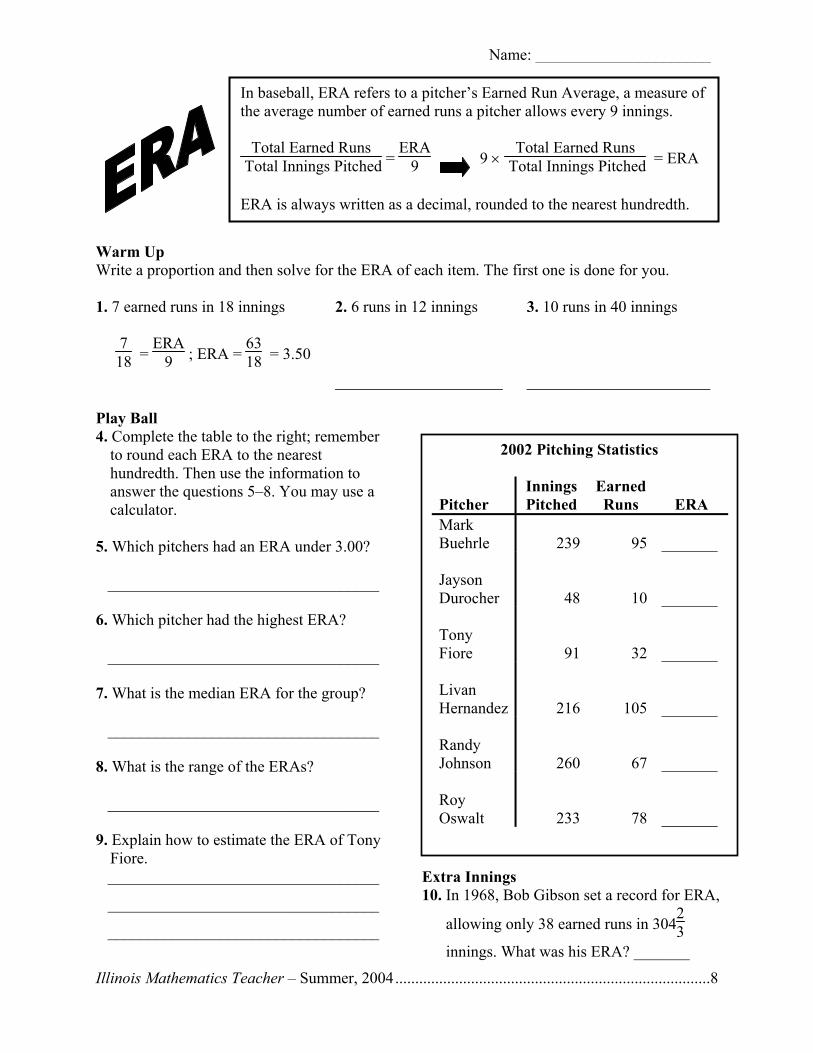
Warm Up Write a proportion and then solve for the ERA of each item. The first one is done for you. 1. 7 earned runs in 18 innings 2. 6 runs in 12 innings 3. 10 runs in 40 innings
718 =
ERA9 ; ERA =
6318 = 3.50
_____________________ _______________________ Play Ball 4. Complete the table to the right; remember
to round each ERA to the nearest hundredth. Then use the information to answer the questions 5–8. You may use a calculator.
5. Which pitchers had an ERA under 3.00? __________________________________ 6. Which pitcher had the highest ERA? __________________________________ 7. What is the median ERA for the group? __________________________________ 8. What is the range of the ERAs? __________________________________ 9. Explain how to estimate the ERA of Tony
Fiore. __________________________________
__________________________________
__________________________________
In baseball, ERA refers to a pitcher’s Earned Run Average, a measure of the average number of earned runs a pitcher allows every 9 innings.
Total Earned Runs Total Innings Pitched =
ERA9 9 ×
Total Earned Runs Total Innings Pitched = ERA
ERA is always written as a decimal, rounded to the nearest hundredth.
Name: ______________________
2002 Pitching Statistics Pitcher
Innings Pitched
Earned Runs
ERA
Mark Buehrle
239
95
_______
Jayson Durocher
48
10
_______
Tony Fiore
91
32
_______
Livan Hernandez
216
105
_______
Randy Johnson
260
67
_______
Roy Oswalt
233
78
_______
Extra Innings 10. In 1968, Bob Gibson set a record for ERA,
allowing only 38 earned runs in 30423
innings. What was his ERA? _______

Illinois Mathematics Teacher – Summer, 2004...............................................................................9
Circular Clock Movements: A Geometric Application David R. Duncan and Bonnie H. Litwiller [email protected] and [email protected] University of Northern Iowa Cedar Falls, Iowa 50614-0506 The authors were recently looking at an ornamental battery operated wall clock. The second-hand “jumped” each second instead of moving at a constant rate. It appeared as though the minute-hand could also be seen to move whenever the second-hand jumped one second. Was this possible or was it an optical illusion? To answer this question we must determine how far the end of the minute-hand travels each second. The minute-hand measured three inches from its endpoint to where it was attached to the clock. The circumference of the circle described by the end of the minute-hand in one hour is ( )32π
or approximately 18.8 inches; that is, in one hour the end of the minute-hand travels 18.8 inches. In one second the tip of the minute-
hand travels 0052.03600
8.18= inches. Since
this value is difficult to visualize, we decided to use metric measures, which have standard names for small units of measures. Thus, 0.0052 inches = 2.54 (0.0052) or 0.013 centimeters or 0.13 millimeters.
This is approximately 81 millimeter. This is
close to the width of a millimeter mark on a meter stick and is large enough to detect from a distance of about 2 meters from the clock. If the motion of the second-hand (and consequently the minute-hand) were continuous, as is the case for most electrical clocks, it would be extremely difficult to detect movement in the minute-hand for small periods of time. However, when the
motion is “saved-up” for a second and then performed all at once, it can be detected. To further analyze this situation, we ask how much angular motion in the viewer’s o360 field of vision is subtended by this 0.13 millimeter motion of the minute hand. Since the viewer is 2 meters from the clock, the circumference of the viewer’s field of vision at that radius distance is
( ) ππ 422 = meters = π4000 millimeters or about 12,560 millimeters. The subtended angle in this field of vision is then
( ) "13'22.00037.0360560,1213.0
===
o .
While very small, this angular change is discernable if the viewer is looking closely. If the viewer were to stand further away, such as ten meters, the subtended
angular change would be 360000,2013.0
π
degrees or 2.7". In our experiment, we found this difficult to discern. Challenge for the reader and his/her students: Perform similar analyses for other clocks of this type, with the viewer being at various distances. Form and test hypotheses concerning minute hand lengths and distances of the viewer from the clock, using both direct observation and theoretical calculations.

Illinois Mathematics Teacher – Summer, 2004.............................................................................10
The Elementary Math Learning Stations Day: A Performance Assessment for Elementary Teacher Education Students Nancy I. Gaylen [email protected] Millikin University Decatur, Illinois 62522 Introduction
The performance assessment given to teacher education students in an elementary mathematics methods class at Millikin University in Decatur, Illinois was to create a mathematics learning station for ethnically diverse, urban children in grades 3-4-5 that would demonstrate the interrelations of mathematics at different grade level bands. As Richard Stiggins explains in his book Student-Involved Classroom Assessment, “With performance assessments, we observe students while they are performing or we examine the products they create and evaluate the level of proficiency demonstrated.” (Stiggins, 1997, p. 184) In NCTM’s publication, Making Change in Mathematics Education, they make a viable case for performance assessment: “Proponents of reformed assessment use qualitative as well as quantitative data, and they focus more on describing student progress then on categorizing individuals or predicting future success. Thus there is a move away from a reliance on multiple-choice tests and toward an increased use of performance assessments, open-ended questions, group projects, portfolios, journal writing, oral reports, and observations.” (NCTM, 1998, p. 99)
Furthermore, new certification policies written by state legislatures mandate that teacher education institutions preparing individuals for a license to teach, develop programs where candidates demonstrate
competency in professional teaching standards. In order for a candidate to be recommended for a probationary teaching license, the candidate must show a proficient level of competency in all of the professional teaching standards. There are many ways that students can show competency and one way is to participate in a performance assessment within a teacher education course. “Performance assessments involve students in activities that require them to demonstrate mastery of certain performance skills or their ability to create products that meet certain standards of quality.” (Stiggins, p. 184) A performance assessment is a very effective way to evaluate a student’s content knowledge at the end of a teacher education course because it requires the student to synthesize their knowledge in an integrated style. Performance assessments are an integral part of a pre-service teacher’s growth and understanding.
This article will explain how one performance assessment was used in an elementary mathematics methods course at Millikin University in Decatur, Illinois as a means of demonstrating competency in some of the course objectives.
How the Performance Assessment Works
“Prospective teachers must be taught in a manner similar to how they are to teach-by exploring, conjecturing, communicating, and reasoning.” (NCTM, 1989, p. 253) A performance assessment that is given at the

Illinois Mathematics Teacher – Summer, 2004.............................................................................11
end of a course gives a student an opportunity to demonstrate their knowledge of course content through application of that knowledge in a real teaching situation. “NCTM’s Assessment Standards for School Mathematics takes a more inclusive view, identifying “evaluating students’ achievement” as just one of four purposes of assessment (NCTM, 1995). Other purposes are monitoring students’ progress, making instructional decisions, and evaluating programs.” (NCTM, 1995, p.25) The purpose of the performance assessment was to demonstrate competency in the following course objectives taken from the elementary mathematics methods course:
1. Recognize how and demonstrate
understanding about the ways in which learners’ cultural background, life and learning histories, developmental needs, learning disabilities, learning styles, cognitive approaches, attitudes about mathematics, and ideas about math concepts and beliefs can influence learning.
2. Employ a wide range of
techniques to teach and assess mathematics for learners having diverse needs and behavioral issues, diverse backgrounds, multi-ages, developmental levels, language literacy and skills.
3. Teach and assess mathematical
topics such as number systems and number sequences, geometry, measurement, statistics and probability, functions and use of variables.
All course objectives for the
elementary mathematics methods course are aligned with NCTM Professional Standards
for Teaching Mathematics (NCTM, 1992) as well as the NCTM Curriculum and Evaluation Standards for School Mathematics grades K-4 (NCTM, 1989). The course objectives are also aligned with the Illinois Professional Teaching Standards. (see Appendix A). Students were required to use all of these sets of standards when they constructed learning stations, which would become their performance assessment.
The Math Learning Stations Day would occur over a two day period for 90 minutes each day. The two 90 minute sessions would provide the teacher education students the opportunity to demonstrate teacher education competencies by facilitating their Math Learning Station for children. Before the Math Learning Stations Day, the professor collaborated with the elementary teachers whose children would be attending. The teachers told the professor what concepts and skills their children were working on. In planning and designing learning stations, the students understood the premise that, “Children need to understand that mathematics is an integral part of real-world situations and activities in other curricular areas.” (NCTM, 1989, p. 18) Therefore, each station had to include activities that integrated other areas of curriculum with the chosen mathematical concept.
Besides alignment with NCTM curriculum standards, other parameters of the assignment included the following:
1. The mini lesson conducted at the
learning station should employ teaching methods and student tasks that align with the specified mathematics curriculum of the elementary school visited.
2. The mini lesson activities should be
cognitively and developmentally

Illinois Mathematics Teacher – Summer, 2004.............................................................................12
appropriate for 8-11 year old children.
3. The facilitator designs activities that
consider a child’s varying learning styles.
4. The learning station is conceptual in
its learning approach and offers different contexts, procedures, formats, and situations.
5. The learning station activities allow
students to experience mathematical concepts at different cognitive levels.
6. The learning station activities
integrate other areas of the curriculum with the mathematical concept.
7. The learning station accommodates a
small group of children comfortably and is attractive, organized, and managed efficiently by the facilitator.
8. The facilitator assesses student
learning using a rubric that is designed to show how the student understands the concept of the learning station.
Preparing for the Performance Assessment
The professor of the elementary mathematics methods course arranged for six different classrooms (grades 3,4,and 5) from a local elementary school to attend the Math Learning Stations Day over a two day period for 90 minutes each day. The elementary school chosen for the Learning Stations Day was an urban elementary school located in Decatur, Illinois. The school population was of lower socio-economic status and ethnically diverse. The
students’ mathematics knowledge, based on state test scores was one to three grade levels below their chronological grade.
The teacher education students were responsible for designing the mini lesson within the learning station, acquiring materials that would be needed to accomplish the activities and designing a rubric that would assess the children’s knowledge of the mini lesson’s concept. The professor helped students acquire consumable materials for their learning stations in advance through private foundation funds.
The Math Learning Stations Day was set up in the school gymnasium. The teacher education students designed how the learning stations were built, physically arranged and set up in the gymnasium, and decided how children would be organized and grouped in order to rotate to each of the learning stations. Teacher Education students arrived at the elementary school well ahead of schedule to set up their stations that had been developed and tried out among their peers in the previous week’s class sessions. Some of the concepts chosen for the mini lessons within the learning stations were: telling time, binary number systems in other cultures, symmetrical patterns, one dimensional to three dimensional construction, graphing on an x and y axis, measuring by volume as well as linearly, heart rate ratios, musical tonality, budgeting money, scientific methodology, and fractions. Teacher Education Students are Assessed While Children Learn Mathematical Concepts
When the children arrived at the gymnasium, they were mixed up into working groups so that they would get to know other peers from other classrooms. College students gave general guidelines for

Illinois Mathematics Teacher – Summer, 2004.............................................................................13
working at the math stations as well as expectations for behavior. The professor of the course began observing the college students at this time and noted the professional standards that the students were demonstrating. According to R. Stiggins, “The great strength of this assessment methodology lies in its ability to ask students to perform in certain ways and to provide a dependable means of evaluating that performance.” (Stiggins, 1997, p. 191) This assessment was on how teacher education students can assess small groups of students in mathematical concepts. They were also assessed on how well they could diagnose a child’s mathematical understanding, and facilitate the child’s learning at an appropriate level. While the college students facilitated the learning stations, the professor observed the teaching strategies of the college students. The professor observed the college students responding to the diverse needs of the children. For example, college students used inquiry techniques to assess developmental levels, and they assessed learning styles by offering a variety of learning activities. The professor also observed the college students managing the learning environment cooperatively with their peers, effectively rotating the children through the stations after each group came to closure. The professor’s evaluation rubric reflected these methodology goals and students were rated on a scale from 1-4, one being unacceptable and 4 being exemplary.
Integration of the curriculum within the centers was strong. For example, a center focusing on the binary number system integrated the ancient Mayan culture, hieroglyphics, and the Spanish language. Another center teaching the concept of converting one-dimension into three dimensions integrated endangered wildlife information, environmental protection
initiatives, and city and county planning procedures dealing with development.
Different learning styles were accommodated by having children manipulate beans, construct models using snap cubes, design and make jewelry, graph by walking on an x and y axis taped on the floor, use compasses to orient direction, use oral language skills by presenting solutions to problems and explanations for methods, reading for understanding, and writing to synthesize information.
Each center had several activities that could accommodate the different cognitive levels of various children. These activities served as diagnostic, formative and summative assessments for the teacher education students practicing their teaching methods. For example, at the learning center that taught the concept of telling time, the center’s facilitator could see the various cognitive levels of the children. The children did problems involving the hour and half hour, or getting more difficult with multi-day problems, different time zones, or adding travel distance as another variable. Through inquiry and experimentation, the children chose what level of activity they wanted to start with and then were guided further by the learning center facilitator. Each learning center provided the participant with an opportunity to produce something that they could take with them and give to their classroom teacher. As observed by G. Wiggins (1993) in his work Assessing Student Performance, “Proponents of performance assessment contend that, just as high-fidelity musical reproductions provide rich and accurate representations of the original music, so too can performance assessments provide high-resolution representations of those forms of achievement that stretch into life beyond school.” These products helped the classroom teachers see what was accomplished during the sessions and the

Illinois Mathematics Teacher – Summer, 2004.............................................................................14
various levels of understanding of the mathematical concepts among their children. The classroom teachers also benefited by the Math Stations Day by being able to watch their classroom children interact with other children from other classrooms, and watch their children being taught by teacher education students. The teachers also enjoyed meeting with other professionals within their school community.
Observed Outcomes of the Performance Assessment
It is important for professors to analyze college students’ field work and determine if the work is a complete picture of what the pre-service teacher knows and is able to do in the chosen setting. For this performance assessment, the professor analyzed college students’ ability to develop and use integrated learning stations in a multi-age environment. The following observed outcomes of the performance assessment show that the Math Stations Day was a success:
1. Objectives of the course were
demonstrated successfully at level 3, proficient, and level 4, exemplary by all college students in the math methods course.
2. Children learned mathematical
concepts in a different environment other than their regular classroom.
3. Classroom teachers could observe
and assess their children’s learning by watching college students and children at the centers.
4. Children practiced their social skills
as they met peers from other classrooms.
5. Teachers from one classroom met and collaborated with teachers from another classroom.
6. College students had an opportunity
to teach and assess children in a self-designed learning environment.
7. Self-reflection of the teaching and
learning process by the methods students demonstrated an ability to synthesize and evaluate professionally.
Teacher Education Students Self-Evaluative Reflection of the Performance Assessment
An important part of a performance assessment for professors and teacher education students is the self-reflection process that occurs after the actual performance is complete. The synthesizing that occurs during self-reflection is a higher level of critical thinking that will help teacher education students evaluate their work. Engaging in reflective practice during their teacher education coursework helps ensure that the reflection process becomes second nature when they become classroom teachers. This synthesis is required by the Illinois Professional Teaching Standards, number 10 Reflection and Professional Growth, which states: “The teacher is a reflective practitioner who continually evaluates how choices and actions affect students, parents, and other professionals in the learning community and actively seeks opportunities to grow professionally.” Effective teaching results from practitioners who are consistently reflecting about their teaching and the learning of their students. The professor and the college students engaged in this reflection phase together to mutually benefit from each other’s comments.

Illinois Mathematics Teacher – Summer, 2004.............................................................................15
College students evaluated their performance during the following class session of the math methods course. Individually, they wrote how they addressed each of the assessment objectives in their experience with children at the Math Learning Stations Day. After students finished their written self-evaluations, they engaged in a general discussion. The students shared with each other how they thought they demonstrated the professional standards for teaching mathematics. They also discussed the children’s learning. The college students explained to each other how they pre-assessed the children’s abilities and learning styles and how the children reacted to the learning activities. The professor asked the students how they knew that the children learned the proposed activity objectives. The class compared the various work samples that the children produced and discussed the level of understanding that the work demonstrated. The thank-you notes that arrived a week later also gave the college students a good indication of what the children responded to most favorably and what they remembered.
Conclusion
Participating in a performance assessment to demonstrate knowledge and understanding of how to teach elementary mathematics is a very rewarding way that pre-service teachers can accomplish the objectives of a teacher education course and be more effectively evaluated. Any time that an individual can engage in an authentic experience, the outcomes are much more meaningful and relevant because they show that the student can transfer learned theory into effective practice. Working with a
variety of multi-aged and multi-ethnic children whose learning styles and abilities are varied and diverse gives students the ultimate opportunity in testing their ability to diagnose and facilitate learning. The experience is also internalized for successful use later, if a synthesizing reflective process follows the teaching experience. The Elementary Math Stations Day provided a satisfying teaching experience for pre-service teachers and provided the professor of the math methods course an accurate picture of how students demonstrated national and state professional standards. References NCTM Professional Standards for Teaching
Mathematics. Reston, Virginia: NCTM, 1991
NCTM Curriculum and Evaluation
Standards for School Mathematics. Reston, Virginia: NCTM, 1989
Student Involved Classroom Assessment.
Richard J. Stiggins 3rd edition, 1997, Merrill Prentice Hall, Columbus Ohio.
Making Change in Mathematics Education
Learning From the Field. NCTM, Reston, Virginia, 1998.
National Council of Teachers of
Mathematics Assessment Standards for School Mathematics, Reston, Virginia, NCTM, 1995.
Assessing Student Performances. G.
Wiggins, 1993, Jossey-Bass, San Francisco, CA.

Illinois Mathematics Teacher – Summer, 2004.............................................................................16
Appendix A: Illinois Professional Teaching Standards STANDARD 1 - Content Knowledge
The teacher understands the central concepts, methods of inquiry, and structures of the discipline(s) and creates learning experiences that make the content meaningful to all students.
STANDARD 2 - Human Development and Learning
The teacher understands how individuals grow, develop and learn and provides learning opportunities that support the intellectual, social, and personal development of all students.
STANDARD 3 – Diversity
The teacher understands how students differ in their approaches to learning and creates instructional opportunities that are adapted to diverse learners.
STANDARD 4 - Planning for Instruction
The teacher understands instructional planning and designs instruction based upon knowledge of the discipline, students, the community, and curriculum goals.
STANDARD 5 - Learning Environment
The teacher uses an understanding of individual and group motivation and behavior to create a learning environment that encourages positive social interaction, active engagement in learning, and self-motivation.

Illinois Mathematics Teacher – Summer, 2004.............................................................................17
STANDARD 6 - Instructional Delivery
The teacher understands and uses a variety of instructional strategies to encourage students’ development of critical thinking, problem solving, and performance skills.
STANDARD 7 – Communication
The teacher uses knowledge of effective written, verbal, nonverbal, and visual communication techniques to foster active inquiry, collaboration, and supportive interaction in the classroom.
STANDARD 8 – Assessment
The teacher understands various formal and informal assessment strategies and uses them to support the continuous development of all students.
STANDARD 9 - Collaborative Relationships
The teacher understands the role of the community in education and develops and maintains collaborative relationships with colleagues, parents/guardians, and the community to support student learning and well-being.
STANDARD 10 - Reflection and Professional Growth
The teacher is a reflective practitioner who continually evaluates how choices and actions affect students, parents, and other professionals in the learning community and actively seeks opportunities to grow professionally.
STANDARD 11 - Professional Conduct and Leadership
The teacher understands education as a profession, maintains standards of professional conduct, and provides leadership to improve student learning and well-being.

Illinois Mathematics Teacher – Summer, 2004.............................................................................18
Student Created AL-Abacus leads to Place Value Understanding and Mathematical Discourse Kim Hartweg [email protected] Macomb, Il. 61455
Laurie Monical Hamilton, Illinois 62341
Introduction
In an on-line graduate course through Western Illinois University, elementary mathematics teachers were asked to assess their students in the areas of place value, number sense, and mathematical discourse. Laurie Monical, a fourth grade teacher at Hamilton Elementary School in Hamilton, Illinois, discovered that even though her students could perform traditional addition and subtraction calculations, they were still lacking in their basic understanding of place value. After studying various approaches to teaching students mathematics with an emphasis on the constructivist learning approach, Mrs. Monical read an article about using an abacus to help students develop their own understanding of place value. She decided to create a unit where students could learn about the abacus and its history while also addressing the place value needs of her students. This became a cooperative staff development effort that led to the creation of this article that was written by Mrs. Laurie Monical in collaboration with Dr. Kim Hartweg, a mathematics professor at Western Illinois University. Brackets were used to distinguish comments made by Dr. Hartweg regarding the integration of this unit into the elementary mathematics classroom.
In an attempt to assess students, to improve students’ place value understanding, and to incorporate research findings, I presented traditional addition problems to my fourth grade students using
a left to right algorithm for addition. I wanted students to realize that addition could be performed by decomposing numbers and adding left to right by using place value understanding. For example, 53 + 42 could be thought of as 50 +40 + 3 + 2. However, I was disappointed that most of my fourth graders did not want to attempt or even listen to a technique that was different from the traditional addition algorithm for fear that it “would mess them up.” [Students wanted to add the 2 plus the 3 and the 5 plus the 4 to arrive at their solution of 95. Laurie was trying to get them to see that the 5 and the 4 was really 50 + 40. It was interesting to learn committed students were in a method they had learned and that worked for them even though they lacked the understanding and the place value meaning behind the operation. One of the course articles Laurie chose to read was “Using Language and Visualization to Teach Place Value.” She decided that students might become better at understanding place value ideas as well as basic addition and subtraction facts if they could begin to visualize numbers. One suggestion from the article included the use of the AL Abacus. Mrs. Monical describes her search for an abacus that would best meet the needs of her students and would be more cost effective while allowing each student the opportunity to create his/her own abacus for future place value and number sense discussions.] I found the AL Abacus and the traditional Chinese abacus in my search. I decided that the AL Abacus, based on an abacus math program by Joan Cotter, would

Illinois Mathematics Teacher – Summer, 2004.............................................................................19
be the easiest for my students, because of it’s base ten format. [The AL abacus is similar to a traditional abacus but is grouped in 5s and 10s on one side and tens, hundreds and thousands on the other side (See Figure 1 below).] After ordering an abacus for myself from http://www.alabacus.com and doing an extensive search for affordable abacuses for the students, I decided to have students create their own as part of an art project. This became a classroom project that developed into an integrated unit as students became interested in the history of the abacus. Dr. Hartweg agreed to participate in the student created abacus project and assisted with the integrated unit.
Figure 1
Supplies were purchased at a local retail store, in the craft section for about $12.00. The supplies consisted of popsicle sticks, dowel rods, beads (30 each of two colors for each student), and wood glue. [Not much has changed over the years…Teachers continue to subsidize education in order to provide positive learning experiences for their students.] I cut the 36-inch dowel rods into six-inch pieces and placed them into student baggies with the materials as described in Table 1. It was necessary to complete the art project over a couple of days in order to allow the glue time to dry.
On the first day of the art project, students took two Popsicle sticks and six dowel rods out of their bags. The students used Elmers glue to cover one side of the first Popsicle stick and then laid their dowel rods into the glue equally spaced so as to allow enough room for the beads to go on. While this activity would lend itself well to measurement, we decided to just ‘eye it’ for the sake of time. [Mrs. Monical made a purposeful decision regarding the necessity of exactness and decided that was not one of the objectives desired at this time.] After the rods were in place, I used wood glue to cover the dowel rods and placed the second Popsicle stick on top for a cover (see Figure 2). We let these dry and then wrote names on the corners of each. The students waited in anticipation of what we would do next.
On day two of the art project, Dr.
Hartweg came in and we had students get out the beads and sort them in groups of five by their colors (see Figure 3 on next page). Dr. Hartweg questioned the students about the amount of beads they had and how they could figure this out without counting each bead individually. Most students used counting by fives to determine the number of beads for each color. [Counting by fives was not an automatic conclusion reached by most of the students. A few leading questions were asked of some students such
Table 1. Supplies per Student Baggie 6 – six inch dowel rods 4 – popsicle sticks 30 – beads of one color 30- bead of the second color
Figure 2. Two Popsicle sticks with six dowel rods glued in between.

Illinois Mathematics Teacher – Summer, 2004.............................................................................20
as, ‘How many groups do you have?’ and ‘How many beads are there in one group?’ This was a quick assessment made by observing and talking with students as they worked.]
After sorting, the students were
instructed to start at the left hand side of the rods and put five of one color on the first three dowel rods. The students then put five of the opposite colored beads on the next three dowel rods. Students guessed correctly that the remaining beads would be placed in fives using opposite colors for the top. [It’s always interesting to see how students build on previous experience and are able to correctly predict what will happen next.] Students finished their abacus by gluing the remaining two Popsicle sticks to the unfinished side in the same manner as described in day one. While the abacus dried, students were asked to write instructions describing how they made their abacus, draw a picture of their abacus, and make a prediction for how they might use their abacus in math. [The inclusion of writing and the alternative representation of the abacus was designed to further students’
understanding as well as serve as an assessment.] Figure 4 (on the next page) shows Dalton’s drawing and description for creating an abacus, Jimmy’s instructions and prediction for using the abacus in math as ‘it helps you because [it’s] grouped in 5’s and 10’s’ and Abby’s drawing and her prediction that the abacus ‘will help keep track of where we are.’ Other student predictions included: 1) Logan – ‘I think we can count numbers easier,’ 2) Gina – ‘It will help in math to multiply,’ 3) Lauren – ‘Like on 5 + 5 we would go and take five and five off it and it would be 10,’ 4) Bridget – ‘Five green plus two purple equals 7 altogether,’ and 5) Danie – ‘It’s a calculator in the old days.’” [Students’ predictions informed the teacher of their readiness to accept the use of the abacus for number and operation applications.]
The activities for Day Three focused on Chinese number characters. I was able to find examples and directions for making various numbers in Chinese (see Table 2 on the next page) at http://www.edhelper.com/ ChineseNumbersIntro.htm. After studying the Chinese numeration system students were to create Chinese lanterns. Directions for creating the Chinese lanterns can be found at http://www.enchantedlearning.com/ crafts/chinesenewyear/lantern/. For each lantern strip they had to write equations in Chinese characters that equaled ten [This was an interesting cultural connection where the reversibility question of ten was applied.] The students found the Chinese characters in math to be difficult but interesting. They discovered that unlike our system, special characters were used to represent tens, hundred, thousands, and ten thousands. They had to work hard on several of the numbers, especially the number zero. [The comparing and contrasting of the written number system led to better understanding for the next day’s lesson as well.]
Figure 3. Logan organizes his beads.

Illinois Mathematics Teacher – Summer, 2004.............................................................................21
Figure 3. Student’s Drawings, Descriptions, and Predictions
Table 2. Chinese Number Characters
0 zero 1 one 2 two 3 three 4 four 5 five 6 six 7 seven 8 eight 9 nine 10 ten 100 one
hundred
On Day Four of this unit, we discussed the history of the abacus and provided various examples of different styles used throughout the world. This led into a discussion based on another on-line course article, “Teaching Addition and Subtraction: A Chinese Perspective,” which described the way in which Asian languages treated numbers. Table 3 shows the counting of numbers from 1 to 30. [Some people believe that the structure of the Asian system leads to stronger place valued understanding by children.]
Table 3. Asian Counting From 1-30
One Ten one Two-ten one Two Ten two Two-ten two Three Ten three Two-ten three Four Ten four Two-ten four Five Ten five Two-ten Five Six Ten Six Two-ten Six Seven Ten Seven Two-ten Seven Eight Ten Eight Two-ten Eight Nine Ten Nine Two-ten Nine Ten Two-Ten Three-Ten
My class thought this was a great
way to count. Students thought ‘little kids’ would understand numbers better if they learned that way. We practiced the numbers in this manner and they started to have a better idea of place value. [Students thought it was easier to show the number 37 on their abacus when it was read three-tens seven.] Then the students each tried to find the

Illinois Mathematics Teacher – Summer, 2004.............................................................................22
solution for 54 + 23 on the abacus without any other instruction. They had many different ways of attempting this. Finally I did some problems with them using a large abacus. They were excited because they could do math from left to right and actually thought it was easier this way on the abacus. This was quite a break through after their insistence from the previous week that working problems in any way other than how they were taught would confuse them. [It was exciting to see this “break through” as students were able to visualize or model their thinking with the use of the AL Abacus. Students became more confident in their solutions and even began to look for different methods to arrive at the same solution in order to share with their classmates.] We will continue using the abacus throughout the year for addition, subtraction, multiplication, and division in order to work on place value meaning behind the operations. The students are anxious to use their own abacus to share with their “buddies” in the second grade so that they can learn how to do math in an “easier way”. This unit will also be integrated into other curricular areas as students will make Chinese dragons, paint a story using Chinese characters, and even eat fortune cookies. This activity has helped to create a better understanding of the number system and place value. My students have also had the opportunity to study and experience a different culture. They even want to give math answers in Chinese. I have gained knowledge of the abacus and its place in mathematics instruction. [This cooperative learning experience has been beneficial to all involved. The students were able to
recognize and discover mental/visual techniques for adding and subtracting that relied more on place value understanding. Learning the history behind the abacus and the Asian number system further enhanced students’ understanding of place value and provided a pleasant cultural experience. The teacher was able to assess her students understanding of place value throughout the unit and apply information gleaned from class articles to better meet the needs of her students. The university professor was able to further the on-line class environment by assisting with the classroom learning experience. The reflective analysis of the on-line class articles together with teacher action and student involvement provided a rich learning experience for all.] References and Resources Chinese Numeration System. edHelper.com
[On-line]. Available at http://www. edhelper.com/ChineseNumbersIntro.htm.
Cotter, J. (2000). Using Language and Visualization to Teach Place Value. Teaching Children Mathematics.
Kinder Crafts Chinese Lantern. Enchanted Learning [On-line]. Available at http://www.enchantedlearning.com/crafts/chinesenewyear/lantern.
Right Start Mathematics. A Home School and Classroom Mathematics Program [On-line]. Available at http://www.alabacus.com .
Sun, W. & Zhang, J. (2001). Teaching Addition and Subtraction Facts: A Chinese Perspective. Teaching Children Mathematics, TCM 2001 Sept.

Illinois Mathematics Teacher – Summer, 2004.............................................................................23
A Not So Typical Percent Review Amber L. Samuilis [email protected] Wheaton IL, 60187
At the end of a percent chapter in Algebra 1, I wanted to get away from the routine review worksheet. So I decided to come up with a story-like problem that reviewed all the key concepts of the chapter. The problem deals with the students winning a small lottery. At this point there are two forms. One form has the students invest their money into a simple interest account before spending any money. The other form has the students spending some of their money and investing the remainder at a later time. At the end of the activity the students
share their findings and notice it is better to invest early and spend later. The unit objectives were to understand and solve problems involving percents, proportions, percent of change, simple interest, and mixture problems. This review sheet covered all of those objectives through the process of the story. My students responded well to the review sheet. It not only gave them an opportunity to apply the percent chapter to a real-life application, but also reminded them of the major topics that were discussed throughout the chapter that they were to be tested on.
The Small Lottery (form 1)
You win $20,000 and listed below is what you did with your money. Your mission is to figure out how much you'll end up with!!! 1. You decided that you should invest your money, just to raise it a little. You put your money
into two simple interest accounts. Some of the money went into an account gaining 8.5% annual interest and the remaining into an account gaining 12% annual interest. Your goal is to earn the same amount of interest in both accounts over a two-year period. How much should you invest into each account? Approximate to the nearest cent. At 8.5%=_________________ At 12% =_________________
2. How much interest did you make in each account at the end of the two-year period?
Interest made in each account:___________________ What is your total after the two-year investment?_______________
3. At the end of the two years you take your money out of the bank and go on shopping spree.
You buy each of your friends a present and it wiped out 11.5% of your money. How much did you spend on gifts? How much do you have remaining? Money spent on gifts:__________________ Total:___________

Illinois Mathematics Teacher – Summer, 2004.............................................................................24
4. Now that you shopped till you dropped, you're on your way home and you pass the Dodge dealer. They are having an overstock explosion and are slashing their prices. So you decide to buy the Dodge Avenger that was listed at $19,705 and is now reduced to $14,925. What percent are you saving? How much money do you have remaining? Percent :____________________ Total:____________
5. The taxes, title, and insurance are extra. The tax rate on the Avenger is 6.75%, the title is
$40.00 and insurance for one year is $1,200. How much do you have to pay for taxes? How much money do you have remaining after buying the car? Amount of taxes:________________ Total:_____________
6. Finally you get home and you forgot you have to watch 11 little geniuses. They love Kool-
Aid, but only a particular way. Their Kool-Aid mixture should contain 5.5% sugar. If you had previously made 11 cups of Kool-Aid that contained 2% sugar and another batch of Kool-Aid that contained 8% sugar, how much of the second mixture would you have to add to the first mixture to obtain the 5.5% sugar mixture?
How many cups:________________ 7. You get paid $7.00 per genius. You did such a nice job that you also get a 15% tip. How
much did you get to watch them? Now how much money do you have remaining? Paid:__________________ Total:_____________
8. You are now feeling awfully generous and you decide to donate 23% of your remaining
money to the math department in your local high school so the teachers could have calculators for everyone in their class. How much money did you donate? How much do you have remaining ? Donated:________________ Total:_____________
9. Finally you’re tired of spending money so you are going to prepare for retirement. You
invest your remaining money into a great account gaining 17% in simple interest. If you leave it there for 40 years, how much total money will you have when you take it out in 2043? Amount gained after 40 years:_________________ Total:_____________
The Small Lottery (form 2) You win $20,000 and listed below is what you did with your money. Your mission is to figure out how much you'll end up with!!! 1. You decide the first item up for business is to go on a shopping spree. You buy each of your
friends a present and it wiped out 11.5% of your money. How much did you spend on gifts? How much do you have remaining? Money spent on gifts:__________________ Total:___________

Illinois Mathematics Teacher – Summer, 2004.............................................................................25
2. Now that you shopped till you dropped, you're on your way home and you pass the Dodge dealer. They are having an overstock explosion and are slashing their prices. So you decide to buy the Dodge Avenger that was listed at $19,705 and is now reduced to $14,925. What percent are you saving? How much money do you have remaining after you buy the car? Percent: ____________________ Total:____________
3. The taxes, title, and insurance are extra. The tax rate on the avenger is 6.75%, the title is $40.00 and insurance for one year is $1,200. How much do you have to pay for taxes? How much money do you have remaining? Amount of taxes:________________ Total:_____________
4. You decided that you shouldn't spend all of your money. So you invest your money into two
simple interest accounts. You put some of the money into an account gaining 8.5% annual interest and the remaining part into an account gaining 12% annual interest. Your goal is to earn the same amount of interest in both accounts over a two-year period. How much should you invest into each account? Approximate to the nearest cent. At 8.5%=_________________ At 12% =_________________
5. How much interest did you make in each account at the end of the two-year period?
Interest made in each account___________________ What is your total after the two-year investment?_______________________
6. Finally you get home and you forgot you have to watch 11 little geniuses. They love Kool-
Aid, but only a particular way. Their Kool-Aid mixture should contain 5.5% sugar. If you had previously made 11 cups of Kool-Aid that contained 2% sugar and another batch of Kool-Aid that contained 8% sugar, how much of the second mixture would you have to add to the first mixture to obtain the 5.5% sugar mixture?
How many cups:________________ 7. You get paid $7.00 per genius. You did such a nice job that you also get a 15% tip. How
much did you get to watch them? Now how much money do you have remaining? Paid:__________________ Total:_____________
8. You are now feeling awfully generous and you decide to donate 23% of your remaining
money to the math department in your local high school so the teachers could have calculators for everyone in their class. How much money did you donate? How much do you have remaining? Donated:________________ Total:_____________
9. Finally you’re tired of spending money so you are going to prepare for retirement. You
invest your remaining money into a great account gaining 17% in simple interest. If you leave it there for 40 years, how much total money will you have when you take it out in 2043? Amount gained after 40 years:_________________ Total:____________

Illinois Mathematics Teacher – Summer, 2004.............................................................................26
Questioning Our Support for Preservice and New Teachers Barbara O’Donnell [email protected] Southern Illinois University Edwardsville Edwardsville, Illinois 62026
Why do new teachers stumble when they teach mathematics? Why do they often lose confidence in their ability to teach? Why do they avoid using teaching through the process strands promoted by the NCTM Standards? Why do they often leave the profession disenchanted? New and experienced teachers, cooperating teachers, university supervisors, mentors of new teachers, math methods teachers, and even preservice teachers are often troubled by these questions. Katy’s story helped me understand the challenges preservice and beginning teachers face in their first years of teaching. Katy was one of eight preservice teachers who participated in an action research study that focused on how preservice teachers from diverse mathematical backgrounds learn to cope with the pressures of teaching mathematics and what personal strategies they use to succeed. Katy was a student in my mathematics methods course where peer teaching coupled with field experiences provided opportunities to practice planning and teaching a variety of mathematical concepts. Preservice teachers were required to plan and teach 5 peer teaching lessons, serve as students for other peer teachers, and critique their performance as teachers as well as that of their peers with a class-constructed evaluation tool. I followed her progress through a series of interviews, observations, and journals to find interesting and unsettling insights.
Meet Katy
Katy is a typical mathematics methods student in her last year of teacher preparation. She has high hopes of becoming an elementary teacher, like her father. Katy is representative of “typical” students entering a mathematics methods course in terms of her content knowledge and tentative feelings about mathematical learning. In her autobiography, she states, “Math for me in elementary school was never much of a problem… I always received good grades.” She confides that she learned mathematics alone through “memorizing rules and doing worksheets,” and because of this is “not a confident mathematician, [and I] need the practice and experience [of teaching] to help me grow.” Katy feels that she has a minimal understanding of many important concepts that elementary teachers need to understand. She agrees that she is constantly “relearning math to understand and remember concepts that I learned before.” For the most part, preservice teachers like Katy have a limited understanding of mathematical concepts (Ball, 1988, 1990, 1991; Brown, Cooney, & Jones, 1990; Flodin, McDiarmid, & Weimers, 1990; National Research Council, 2001; Steele & Widman, 1997; Stevens & Wenner, 1996). Although many preservice teachers know mathematical facts and procedures, learning opportunities (P-16) often fail to help preservice teachers gain a full understanding of the very concepts they will be required to teach (National Research Council, 2001). Perceived knowledge deficits in

Illinois Mathematics Teacher – Summer, 2004.............................................................................27
mathematical content and teaching skills often erode preservice and new teachers’ confidence in their ability to teach a subject they do not fully understand (Karp, 1991; Levine, 1993) and they approach the teaching of mathematics with less than ideal attitudes (Frank, 1990; Sloan, Vinson, Haynes, & Gresham, 1997). We, members of the teaching profession, have an obligation to support preservice and new teachers in their math teaching. As Katy’s story unfolds over a semester, consider the following questions and possible interventions. Do we help preservice and new teachers understand the value of rehearsal? Katy’s first lesson on exploring volume tells of her remarkable start in the class. She concocted a first grade lesson based on two exploratory activities that asked students to estimate and compare the volume of containers of various sizes and shapes. After ordering them by size, students were required to find a way to determine the accuracy of their answers by using only one of the containers and some rice. Katy enacted the lesson very well, as she states, “I felt like I was prepared so I came in confident I guess, even though I was scared and nervous. I knew exactly how I wanted the lesson to go.” Usually first lessons are not as successful as Katy’s, so I asked her how she prepared for her lesson. Katy identified three problems she needed to solve in order for her lesson to go smoothly. First, she questioned how she could teach the lesson “so I don’t have too many instructions and don’t do too much telling.” Second, she wanted her students to discover the concepts. Third, she was concerned about the sequence of activities. She attacked these problems in a number of ways. She relates, “I thought about this lesson for a week… I tried to think of every
way to do it.” Then Katy took planning one step further; she rehearsed her lesson. She states, “I used rice, beans… and I filled quite a number of containers until I found the best ones. My whole kitchen table was covered with containers and beans.” In addition to her rehearsal, Katy also consulted with her lesson partner, her father, a kindergarten teacher and me. Katy’s only regret about her lesson was that she should have done a more thorough job of reviewing the concepts her students discovered. Katy’s use of rehearsal ensured a successful lesson. She realized that just reading through the activity and planning without physical and mental rehearsal would lead to a poorly constructed and executed lesson. As mentors of preservice and inservice teachers, we need to help them understand the advantages of rehearsal through demonstration and sharing our self- talk as we plan and prepare for our lessons. We often take for granted that they understand the benefits of something as simple as rehearsal. Do we adequately help preservice and new teachers think through lessons in detail? Do we help preservice and new teachers learn how to collaborate? Katy did not experience the same success with her second lesson on finding the average student using mean and mode. Katy and another peer teacher teamed to teach this lesson because of time constraints and the complexity of the lesson. Katy remarked, “… we didn’t mull it over like the first one… a lot of stuff we just hadn’t thought about… I didn’t know what my partner was planning on doing.” When asked what indicators made her question the lesson’s success, Katy remarked, “I got a lot more questions in the second lesson. ‘How should we do this?’ We hadn’t thought about how we would do some parts of the

Illinois Mathematics Teacher – Summer, 2004.............................................................................28
lesson… that is why it didn’t feel like it went so well.” In her reflective lesson response, Katy adds:
I will think my instruction through more next time. I will try not to be overwhelmed when I get questions. I feel as if I didn’t explain good enough. I need to evaluate the kinds of questions… Questions aren’t necessarily negative.
Communication is essential to clarify roles and responsibilities when team teaching. The team did not determine what sections of the lesson they would teach and stumbled through the lesson, repeatedly interrupting each other. To compound a difficult situation, neither team member adequately examined or rehearsed the lesson, so students’ misinterpretations and questions caught them off guard.
Cooperating teachers, mentor teachers, and methods teachers should share their perspectives and methods of analyzing a lesson for student misconceptions. They should share the questions that must be answered when planning a lesson: What concept needs to be addressed? What activity will best help all students understand this concept? Are these examples appropriate for the students being taught? What part of the lesson will some students misinterpret? How can I keep this lesson challenging from start to finish for all students? Is this lesson better taught in a whole group or should I break into small groups for some of the time? What questions can I ask to make sure students understand the concepts? Preservice teachers need to realize that all teachers struggle with questions like these continually.
Do we adequately prepare preservice and new teachers to match the curriculum with where children are?
To enhance the learning in their block of methods classes, preservice teachers were asked to perform course assignments in local school district classrooms. Katy was assigned to a fourth grade field placement classroom one morning a week throughout the semester with a full week scheduled near the middle of the semester and another full week at the end. Katy’s field experiences were less than ideal. She was asked to perform the usual tasks like designing bulletin boards or running off worksheets, but was seldom given the opportunity to work with children. During her intensive teaching week, she repeated her second peer teaching lesson in her field experience classroom and experienced many problems, “I was being bombarded with questions… so I felt like I was explaining things that I have already gone over.” When asked what factors contributed to her problems, she replied,
… they are not used to doing activities… they do worksheets and… never use manipulatives… they [students] are either in a large group or doing individual seat work. When I come in and do activities or group work, there is chaos.
Katy also identified two additional elements that contributed to problems with the lesson. First, her lesson was taught out of context. The class was not studying measurement or data concepts and the lesson relied on understanding both. Second, she had little opportunity to accurately assess what her students would be able to do since she rarely worked with the students in her class. Katy’s cooperating teacher tried to allay her feelings of failure, confirming that her students were not used to cooperative learning activities and being able to move

Illinois Mathematics Teacher – Summer, 2004.............................................................................29
about the class to do projects, but Katy was not comforted by her words. Preservice teachers need to learn about children’s mathematical thinking through interaction with students on conceptual tasks. Katy was busy running copies, cutting out bulletin board designs, and grading papers, while other preservice teachers were working with small groups of students on assessment tasks, helping individual students with difficult assignments, and even teaching whole class lessons. Communication between Katy’s university supervisor and cooperating teacher could have prevented this problem. Clear expectations for participation need to be agreed upon by the university supervisor, methods teachers, and the classroom teacher, so the preservice teachers’ roles and responsibilities are defined. Once this is done, they need to be monitored and maintained. Katy and her cooperating teacher also needed to improve their communication. She needed to share her teaching plans with her cooperating teacher, and together, they should have scrutinized their feasibility. Honesty can also be an issue. Many mentor teachers are worried that criticism of preservice or new teachers’ work will lower self-esteem, but a failed lesson can be much more devastating, as in Katy’s case. Joint preparation and a candid debriefing of each lesson are suggested ways to avoid this situation. Sometimes there is a disconnect between teaching practices used in the field and those advocated in methods courses. Preservice teachers are instructed to think about and teach according to the NCTM Principles and Standards for School Mathematics (2000) in their methods classes. The process strands of problem solving, reasoning and proof, communication, connections, and representation are stressed. Cooperating
teachers and mentor teachers need to ask themselves: Do I structure investigations that will help students understand mathematical concepts? Do I ask student to discuss and justify their answers? Do I ask students to work cooperatively to solve problems? Do I help students make connections between related concepts? Do I use models and manipulatives to help students make sense of mathematical concepts? If these practices are not used in the field experiences classrooms, preservice teachers with limited teaching experience will not be able to successfully impose new practices. Cooperating teachers need to honestly assess their methods of teaching and align their practices with the process strands. Do we help preservice and new teachers understand and value content knowledge? Katy’s last lesson involved the probability concept of drawing with and without replacement. Since this was our last day of class, Katy approached me to ask if we would get to her lesson. When she realized we would, she was visibly upset because she had not planned for it. As usual Katy came to class early, so I handed her resource books with possible lessons she could use for reference and she quickly planned her lesson. Katy reflected in her journal, “My lesson went okay but not great. It proved to me how important planning and [having] time to think about a lesson is to teaching. I didn’t feel confident going in or coming out of the lesson.” Fortunately for Katy, she knew enough mathematical content to understand the lessons and had some time to prepare. Many preservice and new teachers would have struggled with the teaching of less familiar concepts without support. Through rehearsal strategies, Katy was able to remember the concepts she was taught in

Illinois Mathematics Teacher – Summer, 2004.............................................................................30
previous years, but other cases in the study were not as successful and their teaching often confused students. Before teaching, all teachers need to fully understand their topic, be able to analyze how children will best learn this mathematical concept, anticipate children’s reactions (understanding as well as misconceptions), and create appropriate interventions. Methods teachers and cooperating teachers need to provide resources and build in measures to check for concept understanding. Questioning, requiring knowledge packages, concept webs, and/or detailed meta-cognitive journals about concepts are a few ways to determine content knowledge so resources can be provided. Conclusions How could a strong starter like Katy change so drastically over a semester’s time? What caused her to change from a well planned, confident teacher, using successful rehearsal strategies, to a mediocre teacher gradually losing faith in her abilities? A reoccurring theme is that Katy lost sight of the value of rehearsal. Although she was successful using it in her first lesson, she didn’t connect her success to her preparation process. Mentor teachers can help by emphasizing that rehearsal is a tool that even veteran teachers use. Second, Katy could not relate her teaching to the needs and prior knowledge of her students. Through no fault of her own, she did not have experiences that would lead her to understanding how children think and reason mathematically. Successful teaching depends on constructing tasks that help children make sense of concepts. Communication is another pervading issue. Conversations about planning and effective teaching practices needed to occur continually. Katy needed her cooperating teacher’s insights into students’ background
knowledge and long-term goals. Katy was also a victim of a communication lapse between cooperating teacher and university supervisor. Her roles and responsibilities in her field experience classroom should have been defined and discussed. Katy also confessed that she had a minimal understanding of what she was teaching. Through rehearsal, learning about children’s mathematical thinking, conversations, and other professional development activities, preservice and new teachers can make connections to their prior knowledge and bring forgotten or misunderstood concepts into focus. I ask you to consider what Katy’s story has to tell us and reflect on your role in the math education community. What can you do to prevent Katy’s story from happening to another new teacher? References Ball, D. L. (1988, March). Unlearning to
teach mathematics (Issue Paper No. 88-1). East Lansing, MI: National Center for Research on Teacher Education.
Ball, D. L. (1990). The mathematical
understandings that prospective teachers bring to teacher education. Elementary School Journal, 90, 449-466.
Ball, D. L. (1991). Research on teaching
mathematics: Making subject matter knowledge part of the equation. In J. Brophy (Ed.), Advances in research on teaching, Vol.2: Teachers’ knowledge of subject matter as it relates to their teaching practice (pp. 1-48). Greenwich, CT: JAI Press.

Illinois Mathematics Teacher – Summer, 2004.............................................................................31
Brown, S., Cooney, T. J., & Jones, D. (1990). Mathematics teacher education. In W. R. Houston (Ed.), Handbook of research on teacher education (pp. 639-656). New York: Macmillan.
Flodin, R. E., McDiarmid, G. W., &
Weimers, N. (1990, February). Learning about mathematics in elementary methods courses (Research Report No. 90-1). East Lansing, MI: National Center for Research on Teacher Education.
Frank, M. L. (1990). What myths about
mathematics are held and conveyed by teachers? Arithmetic Teacher, 37(5), 10-12.
Karp, K. S. (1991). Elementary school
teachers’ attitudes toward mathematics: The impact on students’ autonomous learning skills. School Science and Mathematics, 91(6), 265-270.
Levine, G. (1993, October). Prior
mathematics history, anticipated mathematics teaching style, and anxiety for teaching mathematics among preservice elementary school teachers. Paper presented at the meeting of the International Group for the Psychology of Mathematics Education, North American Chapter, Asilomar, CA.
National Council of Teachers of
Mathematics. (2000). Principles and standards for school mathematics. Reston, VA: Author.
National Research Council (2001). Adding it up. Washington, DC: National Academy Press.
Sloan, T. R., Vinson, B., Haynes, J., &
Gresham, R. (1997, November). A comparison of pre- and post-levels of mathematics anxiety among preservice teacher candidates enrolled in a mathematics methods course. Paper presented at the meeting of the Midsouth Education Research Association. Nashville, TN.
Steele, D. F., & Widman, T. F. (1997).
Teachers’ conceptions about mathematics and mathematics teaching and learning. School Science and Mathematics, 97(4), 184-191.
Stevens, C., & Wenner, G. (1996).
Elementary preservice teachers’ knowledge and beliefs regarding science and math. School Science and Mathematics, 96(1), 2-9.

Illinois Mathematics Teacher – Summer, 2004.............................................................................32
Instant Insanity Doug Earls [email protected] Prophetstown, IL 61277
Many years ago I was introduced to a terrific way to teach students a little about graph theory and have a lot of fun at the same time. The unit explains how to solve the famous puzzle called “Instant Insanity”. This puzzle has been around for nearly a century and involves setting up four blocks in a tower so each of the four sides shows a different color. There are 41,472 ways to randomly set up the four blocks, so trying to do it by trial and error can drive a person crazy (hence the name). There is a mathematical method for setting up the blocks, which makes the puzzle easy to solve.
The strategy for solving the puzzle involves the use of graph theory. I’ve successfully introduced this to students of all ability levels. The amount of time necessary for this project can vary from a few days to a couple of weeks, depending on whether you want the students to make their own blocks. I use it as an end of the week fun day, giving my weekly quiz and then letting the students “play with blocks,” thus stretching the unit over several weeks. So if you want to have some fun in your math class, introduce Instant Insanity to your students.
Graph theory involves points (or vertices) that may or may not be connected by lines (or edges). Applications of graph theory include transportation systems and computer networks. In Instant Insanity the colors of each block will be represented by points and the lines connecting points will represent the colors that are on opposite faces of the blocks. Each block will be represented by a single graph, and then these four graphs will be combined into one.
Here is how the three dimensional block is represented in two dimensions:
What follows is the complete solution for a sample set of blocks:
The graph for each of these blocks is shown below and on the next page. Each line connecting colors shows that those colors are on opposite sides of that block. If a pair of sides has the same color, draw a loop connecting that color to itself.
Block 1 Block 2
Block 3 Block 4
Block 1 Block 2

Illinois Mathematics Teacher – Summer, 2004.............................................................................33
Next combine these four graphs into one graph, labeling each line with the number of the block from which it came. Here is what the combined graph for our sample blocks would look like:
From this combined graph construct two graphs, each of which must be one of the possible designs shown below.
Each of these graphs must use one line from each of the four blocks and no line may be used more than once. (This is the only difficult part of the unit for most students and there are several practice problems for this concept on worksheets two and three.) These graphs represent the colors that will be on the front/back sides of the tower and on the left/right sides of the tower. Then draw arrows on the lines so that following the arrows will take you around the figure. Arrows on loops can go in either direction. Label these graphs ‘Front to Back’ and ‘Left to Right.’ These two graphs for our sample blocks are shown below.
Use the above designs to fill in the tables below. For example block one has the arrow pointing from green to yellow for front to back and from red to red for left to right.
Now set the blocks up according to the table. Set block one up with green on the front, yellow on the back, red on the left and red on the right. Then put block two on top of block one with blue on the front, green on the back, blue on the left and yellow on the right. Block three will go on top of block two with red on the front, blue on the back, green on the left and blue on the right. Finally, put block four on top of block three with yellow on the front, red on the back, yellow on the left and green on the right. Congratulations! You have solved Instant Insanity.
Worksheets for students to practice making the combined graph of all twelve lines, making various designs from the combined graph and finding two designs from the combined graph are on the following pages. More detailed teacher suggestions and directions, more worksheets, quizzes, a test, solutions for everything and directions to have the students design and construct their own blocks are available from me by e-mail at [email protected].
Block 3 Block 4

Illinois Mathematics Teacher – Summer, 2004.............................................................................34
INSTANT INSANITY – WORKSHEET ONE
FOR EACH SET OF BLOCKS GIVEN, MAKE THE COMBINED GRAPH BY DRAWING (AND
LABELING)THE LINES WHICH CONNECT COLORS THAT ARE ON OPPOSITE SIDES OF EACH BLOCK
1. BLOCK ONE BLOCK TWO BLOCK THREE BLOCK FOUR
B . . R
Y . . G
2. BLOCK ONE BLOCK TWO BLOCK THREE BLOCK FOUR
W . . O
P . . B
O
W P
W
B W O W O B B
O
P
B O P W B
B
B
P
O
O
P
G
Y R
R
G Y B R Y G R
B
Y
B Y R B B
G
G
G
R
B
B

Illinois Mathematics Teacher – Summer, 2004.............................................................................35
INSTANT INSANITY – WORKSHEET TWO
PAGE 1 1. USE THE LINES IN THE DIAGRAM TO MAKE THE INDICATED DESIGN USING ONE LINE FROM EACH BLOCK, LABELING EACH LINE WITH THE APPROPRIATE BLOCK NUMBER 1 4 3 1 4 2 4 1 3 3 R 2 2 a) B W b) B W c) B W d) B W R G R G R G R G
WB
G

Illinois Mathematics Teacher – Summer, 2004.............................................................................36
INSTANT INSANITY – WORKSHEET TWO PAGE 2
2. USE THE LINES IN THE DIAGRAM TO MAKE THE INDICATED DESIGN USING ONE LINE FROM EACH BLOCK, LABELING EACH LINE WITH THE APPROPRIATE BLOCK NUMBER 1 3 4 2 3 2 1 3 2 4 1 Y B 4 a) G P b) G P c) G P d) G P Y B Y B Y B Y B
PG

Illinois Mathematics Teacher – Summer, 2004.............................................................................37
INSTANT INSANITY – WORKSHEET THREE
USE THE LINES IN EACH DIAGRAM TO MAKE TWO OF THE DESIGNATED DESIGNS, USING ONE LINE FROM EACH BLOCK IN EACH DESIGN BUT NOT USING THE SAME LINE MORE THAN ONCE 4 3 2 4 3 4 1 R 1 4 2 2 4 1 3 1 4 2 3 2 3 2 4 4 1 2 1 2 3 3 4 1 1 1 R G B P 3 3 2
1. B . . Y 2. G . . P 3. R . . O
R . . G Y . . B B . . P -----------------------------------------------------------------------------------------------------------------------------------------
B . . Y G . . P R . . O
R . . G Y . . B B . . P
Y B P
Y
G
B
O

Illinois Mathematics Teacher – Summer, 2004.............................................................................38
The transformation of )(xf By Dane Camp
If you add to a function you’ll give it a lift,
for the graph will be moved with a vertical shift.
But if you multiply take a closer look and see,
the graph’s stretched by that factor vertically,
and negating the function will cause a reflection,
across the x-axis in an up-down direction.
But if you add before the function’s used, hey
the shift’s horizontal the opposite way!
And multiplication by a factor inside reveals,
the graph’s being stretched by the reciprocal’s
and negating the values before f is applied
reflects across the y-axis – it flips side to side!
Illinois Mathematics Teacher – Summer, 2004.............................................................................39
Do you want to decide what is printed in The Illinois Mathematics Teacher? If so, we would be interested in having you as a reviewer for the articles received by the IMT. Simply complete the form below, tear out this page, fold and secure at the indicated places, stamp, and then return it to us. We would love to include you in the list of reviewers. If you are currently a reviewer, we would like to have you complete the form as well so that all our information is up to date. Thanks, and we hope to be hearing from you soon. Name ______________________________________________ Check preferred mailing address, please complete both columns. ____ Home Address ____ Work Address _______________________________ _______________________________ _______________________________ _______________________________ _______________________________ _______________________________ (City) (City) _______________________________ _______________________________ (State) (Zip Code) (State) (Zip Code) _______________________________ _______________________________ (Phone Number) (Phone Number) _______________________________ _______________________________ (Best time to call) (Best time to call) _______________________________ _______________________________ (E-mail address) (E-mail address) Please check as many of the following areas as you are interested in reviewing. ________ EC-3 ________ Calculus ________ 4-6 ________ Statistics ________ Jr. High/Middle School ________ College ________ Algebra ________ Technology ________ Geometry ________ Teacher Education ________ Trigonometry ________ General Interest ________ Precalculus ________ Other _____________________

Illinois Mathematics Teacher – Summer, 2004.............................................................................40
-------------------------------------------------- fold here ------------------------------------------------------ ____________________________ ____________________________ ____________________________
Marilyn Hasty and Tammy Voepel Mathematics Dept. SIUE Box 1653 Edwardsville, IL 62025-1653
-------------------------------------------------- fold here ------------------------------------------------------
Please put stamp here
Tape here to close

MEMBERSHIP APPLICATION FORM ____ New Member ____ Reinstatement ____Renewal ____Change of Address Name: _______________________________________________________________ Check preferred mailing address, please complete both columns. ____ Home Address ____ Work Address _______________________________ _______________________________ _______________________________ _______________________________ _______________________________ _______________________________ (City) (City) _______________________________ _______________________________ (State) (Zip Code) (State) (Zip Code) _______________________________ _______________________________ (Phone Number) (Phone Number) _______________________________ _______________________________ (E-mail address) (E-mail address) ****************************************************************************** Profession (check one) Interests (check up to three) ____ EC-3 Teacher ____ Remedial ____ 4-6 Teacher ____ Gifted ____ Jr. High/Middle Teacher ____ Teacher Education ____ Sr. High Teacher ____ Assessment ____ Special Education Teacher ____Certification ____ Community College ____ Multicultural Evaluation ____ College/University ____ Professional Development ____ Administration ____ Scholarship ____ Student ____ Technology ____ Retired ____ Research ____ Institutional Member ____ Math Contests ____ Other _______________ ____ Other ****************************************************************************** Dues for ICTM Membership Dues Money enclosed: $___________ ____ Regular member ICTM Scholarship Fund $___________ One Year $ 25 Math Contest Fund $___________ Two Years $ 45 Total Enclosed: $___________ Five Years $100 Send this application and a check or money ____ Student Member order payable to the Illinois Council of One Year $ 15 Teachers of Mathematics ____ Retired Member Mail to: One Year $ 20 ICTM Membership Five Years $ 80 P.O. Box 5438 Buffalo Grove, IL 60089-5438 ____ Institutional Member, one year $70 If recruited as a new member by a current member, please list the recruiter’s name