The Illinois General Assembly, 1992-2003: Leadership ... · The Illinois General Assembly,...
74
The Illinois General Assembly, 1992-2003: Leadership Control, Continuity, and Partisanship By Christopher Z. Mooney, Institute of Government and Public Affairs, University of Illinois at Springfield Tim Storey, National Conference of State Legislatures *We would like to thank Bradley Bonnette for his help in collecting data for this project. Joint Project on Term Limits 2004 National Conference of State Legislatures Council of State Governments State Legislative Leaders’ Foundation 7700 East First Place Denver, CO 80230-7143 (303) 364-7700 • fax (303) 364-7800 444 North Capitol Street, N.W., Suite 515 Washington, D.C. 20001 (202) 624-5400 • fax (202) 737-1069 http://www.ncsl.org © 2005 by the National Conference of State Legislatures. All rights reserved.
Transcript of The Illinois General Assembly, 1992-2003: Leadership ... · The Illinois General Assembly,...

The Illinois General Assembly, 1992-2003: Leadership Control, Continuity, and Partisanship
By Christopher Z. Mooney, Institute of Government and Public Affairs, University of Illinois
at Springfield Tim Storey, National Conference of State Legislatures
*We would like to thank Bradley Bonnette for his help in collecting data for this project.
Joint Project on Term Limits 2004
National Conference of State Legislatures
Council of State Governments
State Legislative Leaders’ Foundation
7700 East First Place
Denver, CO 80230-7143 (303) 364-7700 • fax (303) 364-7800
444 North Capitol Street, N.W., Suite 515
Washington, D.C. 20001 (202) 624-5400 • fax (202) 737-1069
http://www.ncsl.org
© 2005 by the National Conference of State Legislatures. All rights reserved.
Abstract From 1992 to 2003, 21 states adopted term limits for their legislators. These limits were
predicted by proponents and detractors alike to have a variety of impacts on legislators
and legislatures. Illinois does not have state legislative term limits. By describing the
Illinois General Assembly (along with other control state legislatures) from 1992 to 2003,
we can begin to assess which changes in term-limited state legislatures were due to term
limits and which were merely secular trends in these institutions across the country.
Through dozens of interviews with long-time observers of the body and documentary
data, we found that the Illinois General Assembly has been fairly stable in many ways
since 1992, being especially characterized by a strong and centralized party leadership
structure, gradual change where change has occurred, and strong party competition. The
basic contours of the General Assembly during the study period were defined in large
part by Illinois’s individualistic political culture, the 1981 Cutback Amendment, partisan
decennial legislative redistricting, and the idiosyncrasies and lengthy tenure of certain
key officials.
1

How has the Illinois General Assembly changed since 1992? In a period when
21 states adopted legislative term limits, with all the potential impacts that that reform
may have had on legislators and legislatures, what has changed in and around the non-
term-limited Illinois body? We describe the Illinois General Assembly since 1992 as a
control-state case study to help highlight the changes in term-limited state legislatures
that were due to term limits and those that were due merely to secular trends in these
institutions across the country.
We identify three overarching characteristics of the Illinois General Assembly
since 1992: centralized leadership control, strong partisanship, and gradual or little
overall change. We find that these basic characteristics of the General Assembly were
instigated by a series of events in the early 1980s and that, by 1992, the patterns were
strong and predictable. Because of this stability, Illinois makes a good control-state case
study against which to evaluate the effects of term limits on other state legislatures.
Research Methodology
In 2003, we conducted a series of in-person interviews with informed observers of
the Illinois General Assembly, typically with both authors present. Most of these
interviews were conducted in two waves. In July and August, we interviewed 15
legislative staff, journalists, lobbyists, and former legislators, and during the legislature’s
November session, we interviewed 15 state legislators. Each interviewee was identified
by our informal advisory committee as an observer of the legislature since at least 1992.
The interviews consisted of open-ended questions and lasted between 30 and 90 minutes.
The Appendix A lists the interviews. These interviewees were assured that they would
2

not be quoted directly in any written report, so our descriptions of their comments are
unattributed paraphrases of their sentiments. We were struck by the consistency of the
reports we received on a range of questions from a wide variety of interviewees. When
there was a difference of opinion among the interviewees, we note it.
While the design of this project requires us to rely on these interview data for a
substantial portion of our report, it is important to note the inherent bias in them. First,
there is a sample selection bias, in that another type of people will remain in and around
the state legislature for over 15 years, and a certain type will come and go in that period.
To the extent that the experiences and impressions of these types of people differ, the
information we rely on from the former type of person for this report will be biased.
Second, even assuming that longevity does not bias the sample of our respondents, the
reliance on the memories of these people of events sometimes years distant raises
questions of bias due to selective memory and changes in impressions and opinions over
time. These potential biases need to be considered in assessing our conclusions. For
example, the comments we often heard that lobbyists, staffers, and legislators are “getting
younger every year” may be due to this bias rather than an actual change in the age of
these people. To supplement our interview data and help guard against potential bias in
them, we gathered documentary data on various features of the General Assembly from a
variety of sources. Much of this data gathering was conducted by Brad Bonnette, a
research assistant at the University of Illinois at Springfield and former intern at the
General Assembly’s Legislative Research Unit.
3

Basic Characteristics of the Illinois General Assembly, 1992-2003
The Illinois General Assembly has been fairly stable in many ways since 1992,
being especially characterized by three features: a strong and centralized party leadership
structure, gradual change where change has occurred, and strong party competition. We
return to these characteristics throughout this report.
To understand the Illinois General Assembly in 1992-2003, we must understand
the genesis of these three overarching characteristics. The four sources of these
characteristics are: Illinois’s individualistic political culture, the 1980 Cutback
Amendment, partisan decennial redistricting since 1980, and the idiosyncrasies and
lengthy tenure of key officials.
Individualistic Political Culture
While Elazar’s (1984, chap. 5) characterization of the American states’ political
cultures has been criticized on a variety of grounds (e.g., Nardulli 1990; Wirt 1991; Hero
and Tolbert 1996), it remains one of the most used and cited characterizations of state
politics in the political science literature, largely because of its face validity for observers
of many states’ politics. Nowhere is this face validity stronger than in Illinois, the state
where Elazar began his study of political culture (Redfield 2001; Gove and Nowlan
1996). Elazar characterized Illinois as an individualistic political culture, where, among
other things, politics is primarily about who gets what and who wins elections so that
they can reward their supporters once in office. Those interested in ideological and
technical debate about policy and the value of fighting (and perhaps losing) the good
4

fight would best be advised to head north to pursue their political career in the moralistic
political culture of Wisconsin.
Working in tandem with this emphasis on winning elections and the spoils system
is a high level of partisan conflict that has characterized the state at least since the
beginning of the 20th century (Gove and Nowlan 1996). In the late 20th century, this
partisan conflict rooted in spoils politics was intensified by the close division between the
Republican and Democratic parties statewide. While only Republicans served as
governor from 1977 to 2003, the electoral margin in several of these gubernatorial
elections was very small, and the state legislative chambers during that time were
typically had both close partisan splits and different majority party control. Indeed, from
1977-2003, in only two years (1995-97) were both chambers of the legislature and the
governor’s office controlled by the same party. Thus, Illinois state politics has long been
characterized by an emphasis on winning elections and close partisan competition.
The 1980 Cutback Amendment
In 1980, Illinois voters approved the only major statewide initiative ever adopted
under the 1970 Constitution- the Cutback Amendment (Everson et al. 1982; Wheeler
2000; Van der Slik and Redfield 1989, 37-40). Prior to this amendment, the 177
members of the Illinois House of Representatives were each elected from a three-member
district under a cumulative voting scheme that allowed a voter to vote for up to three of
the four candidates on the ballot (one state senator was also elected from each of these
districts). Each party could put only two of these four House candidates on the ballot.
5

Thus, in almost every House district, at least one Republican and one Democrat were
elected.
The “minority” member from each district (that is, the person whose party lost the
other two seats in that district) oftentimes provided a perspective different than that of
those elected from districts where his or her party was in the majority. These minority
members could also be harder for their own legislative party leadership to control
because they had developed an idiosyncratic, small, but loyal, voter base in their districts.
These minority members were often the most colorful characters in the House, the
mavericks whose passing from the scene in the 1980s and 1990s long-time observers
sometimes lament.
Advocated by reformers who capitalized on voter anger at legislators’ increasing
their pay dramatically in a lame duck session the late 1970s (Telcser 1976), the Cutback
Amendment did three things to the Illinois House of Representatives: its size was reduced
by one-third to 118 members, its members were to be elected from single-member
districts (two in each senate district), and cumulative voting was eliminated in favor of
the traditional system of single-candidate choice. There were at least three important
impacts of these changes. First, partisanship increased because the new single-member
House districts were more homogenous, polarizing the parties in the legislature. Second,
the end of cumulative voting and multi-member districts meant the end of a minority
member in each House district and, thus, the loss of their unique perspective. Third, the
party leadership in the House could control their members better both because these
members were naturally more homogenous, given the smaller, more similar districts they
represented, and because each member now had to win a majority in his or her district to
6
be elected, making campaigns more expensive and a primary election threat (perhaps
instigated by the legislative leadership) more real.
Decennial Legislative Redistricting since 1980
The 1970 Illinois state constitution established a decennial redistricting procedure
designed to force the political parties to compromise in the likely event of divided control
of government (Gove 2001). If a redistricting bill could not pass the General Assembly
and be signed by the governor, a bipartisan commission would be set up to draw a
redistricting plan. If that commission could not agree on a plan by a given date, a tie-
breaking member of the commission would be chosen by lot by the Secretary of State
from two names presented by the parties. In effect, this would give the party who won
the lottery complete control over drawing the legislative map. Behind this gun-behind-
the-door procedure was the hope that the prospect of living for 10 years with legislative
districts drawn solely by the opposition would force the parties to compromise on a
redistricting plan (Edgar 2001). While this scheme worked as planned for the 1972
redistricting, in 1982, in a game of political chicken, the parties preferred to take their
chances in the all-or-nothing lottery than to compromise on a map. The result was that
the Democrats won the lottery and were able to draw a map that was advantageous for
their interests. The same stalemate-and-lottery outcome occurred in 1992, with the
Republicans winning the lottery and drawing the map, and in 2002, when the Democrats
won again.
These partisan redistrictings affected the General Assembly in a variety of ways
relevant to the three major characteristics of the General Assembly since 1992. Since the
7

legislative maps were drawn for partisan advantage, the process inflamed partisan
conflict and helped polarize the parties. The majority of districts were drawn to be safe
for one party or the other, which increased partisanship in the legislature since same-party
members were elected from increasingly similar districts while other-party members were
elected from increasingly dissimilar districts. Legislative party leadership power was
increased because they controlled the redistricting, giving them immense leverage with
sitting members seeking favorable districts. Furthermore, since most districts were
drawn to be safe for one party, there were only a handful of swing districts. Leaders have
targeted these swing districts as battlegrounds for proxy fights between the state parties,
funneling huge amounts of campaign money and staff into them. On such a stage,
individual candidates typically become mere pawns of their leadership, and as a result,
these members are beholden to their leaders’ wishes in the legislature. Finally, since
most legislative districts are drawn to give the parties safe wins, and since the goal of the
party drawing the map is to give itself a majority in each chamber throughout the decade,
once the map is drawn, very little changes in the partisan composition of the legislature
throughout the decade it is in force.
Continuity of Key People in the Process
Finally, the basic characteristics of the Illinois General Assembly in the study
period were also established in the 1980s with the ascension to top party legislative
leadership posts of men who would hold these positions through at least 2002. While the
leadership in all four legislative caucuses was remarkably stable from 1992-2003 (indeed,
the top party legislative leaders were the same throughout this period), in the early 1980s,
8

the two most important leaders of this period came to power- Michael Madigan,
Democratic Speaker of the House, and James “Pate” Philip, Republican President of the
Senate. These strong and talented leaders dominated their caucuses and chambers during
most of the study period.1 By rising to power in the early 1980s after a lengthy
legislative apprenticeship, they were able to learn their positions and consolidate power
so that by the beginning of our study period, they each had developed a powerful role in
their respective chambers and Illinois policymaking that was relatively consistent from
1992 to 2003.
Other Factors That Might Cause Change in the Legislature
Our interviewees identified several other events that caused change in the Illinois
General Assembly in the past few decades: change of the governor and the party of the
governor, change of the majority party of a chamber, change of a legislative party leader,
and major legislative turnover caused by the decennial redistricting. But very few of
these events took place during the study period until its very end. A new governor was
elected in 1998, but he was a Republican like his predecessor. There were two changes
in party control of a chamber, when the Republicans briefly wrested control of the House
from the Democrats in 1994 and lost it again in 1996. But during this entire period until
2003, each of the top party caucus leaders remained the same. The first election based on
the 1990 census districting took place in 1992, and so there was no re-districting until the
very end of the study period. In short, these potential change-agent events were largely
non-issues in the bulk of the study period.
1 Representative Madigan was the minority leader when the Republicans held a majority in the House in 1995 and 1996.
9
Partisanship, Leadership Power, and Gradual Change
Thus, these four developments shaped the Illinois General Assembly in our study
period, 1992-2003. A political culture that emphasized winning elections above all else,
the shift to single-member districts, and successive partisan redistricting led to a high, but
stable, level of partisan conflict in the General Assembly. Legislative party leadership
was a steady, dominant force because of its control of redistricting, personnel stability at
the top, the skill of the people in leadership positions, and the partisan nature of the
political culture and the General Assembly. And given that these events and conditions
were well established by 1992, and were only reinforced by the major political events of
1992-2003, the key characteristics of the General Assembly were relatively stable during
the study period.
Given this background, in the next sections, we go into more detail about the
specific aspects of the General Assembly that are directly relevant to hypotheses about
the potential impacts of terms limits: legislative leadership; elections, campaigns, and
representation; the composition of the legislature; legislative committees; staff and staff
agencies; norms and internal relations; lobbyists and lobbying; policy and budget;
balance of power; and adaptation and institutional maintenance. We describe the general
patterns of these aspects of the Illinois legislative process in the study period,
emphasizing whether or not and how they changed during this period.
10

Legislative Leadership
The single most important feature of the Illinois General Assembly in 1992-2003
is the dominance of the legislative party leadership, especially the majority party
leadership. Indeed, in every interview, no matter what question we asked first, the
interviewee invariably answered it in terms of party leadership. The entire legislature and
legislative process is oriented to this leadership control, as are all the actors involved,
including rank-and-file legislators, lobbyists, the media, and executive branch officials.
It was believed by all our interviewees that a majority party leader could get virtually
anything he wanted out of his chamber in the study period and that anything of
importance in a chamber was controlled by that leader. For example, more than one
respondent cited the same bill of two years prior as an example of where the Speaker of
the House wanted a bill to fail, but it actually passed. So rare was this event that it was
remembered clearly by all observers of the General Assembly. As we describe the
various aspects of the General Assembly below, we will continually come back to the
impact and dominance of the legislative leadership on most of them.
One important reason for this leadership dominance in the study period is the fact
that the same person served as the top leader in each of the caucuses from 1992-2002.
Furthermore, all but one of these leaders held his position from the early 1980s. This
longevity allowed these leaders to retire any political debts that they incurred in gaining
their positions initially, to accumulate obligations from others, to learn the process and
the position, and to adjust the system to benefit them (Jewell and Whicker 1994).
Throughout the study period, these leaders were especially effective in co-opting
potential rivals for power (whether from individual rank-and-file members or groups of
11

them) by judicious appointments to their leadership teams of six to seven (Senate) or nine
to ten (House) members. Leadership team appointments were used in part to show that
the leader cared about the important regional, racial, and economic interests in a caucus.
Some of these positions offered real power and input into the process, and all of them
offered prestige and a significant salary increase.
The leaders also accumulated power in other ways. First, they directly controlled
all of the professional staff in each chamber. Individual legislators did not hire any
professional staff, nor were any staff assigned permanently to a committee. Members
were assigned staff at their leader’s discretion, but it was always clear to the staff, rank-
and-file legislators, and leaders for whom staff worked—their leader. Second, the leaders
dominated the electoral process, especially in terms of campaign finance. While many
states’ legislative leaders developed their own campaign finance funds in the 1980s and
1990s (Loftus 1994), those in Illinois did so to an extreme, for several reasons (Redfield
2001). Their long tenure in these positions allowed them to develop effective fundraising
operations. The lack of limits on the amount or source of campaign contributions in
Illinois allowed these leaders to solicit very large sums from interest groups, unions, and
corporations. The fact that these leaders dominated the legislative process gave those
interested in having an impact on policy great incentive to contribute to the leaders’
funds. Leaders were also deeply involved in targeting races for the heavy mobilization of
campaign funds and staff and in recruiting candidates for legislative races (see the next
section for more details).
A third way these leaders accumulated power was through their influence in the
state budget process. Throughout the study period, the four leaders (or at least the two
12

majority leaders) controlled the legislative side of the final budget negotiations with the
governor at the end of the legislative session. This meant that any legislator or other
interested party needed the ear of at least one of the leaders to have his or her interests
represented in these all-important budget negotiations. In addition, the leaders controlled
the distribution of the district-specific project funds (i.e., pork barrel spending)
throughout this period.
Finally, the majority leaders dominated the formal legislative process by
controlling the assignment of bills to committees and the consideration of amendments on
2nd Reading (through the Rules Committees, which the majority leaders controlled) and
by serving as the presiding floor officers, a role that has traditionally been used
effectively by both Speakers and Presidents in the Illinois General Assembly. Both the
majority and minority party leaders also controlled the assignment of their respective
legislators to committee seats, a power that was used both to reward and punish members
(thereby enhancing leadership power) and to set committee agendas and balances of
power.
Changes in leadership power during the study period were subtle, gradual, and,
for the most part, unidirectional toward more concentrated leadership power. Leadership
controlled staff increasingly directly throughout this period, consolidating
decisionmaking and control in the leader and his top aides at the expense of the
leadership team, committee chairs, and rank-and-file legislators. The leaders increased
their candidate recruitment and targeting activity. They became bolder in encouraging
and supporting candidates running in primaries, not only for open seats, but even against
sitting members who had somehow displeased them. At the extreme, the leader of the
13

House Democrats actually became the State Democratic Party chairman in 1998, a move
that not only signaled his special interest in elections but that also gave him extra
wherewithal with which to control House elections.2 Throughout the study period, the
legislative leaders, especially in the House, became increasingly focused on campaigns
and less interested in the legislative process. In particular, several interviewees felt that
after regaining the majority in the 1996 election, House Speaker Madigan began to pay
attention to the legislative process only when it mattered for maintaining his majority or
raising campaign contributions. This is not to say that the leaders did not care about
lawmaking, but rather that, in the individualistic political culture of Illinois, the priority
was always to win a majority and that lawmaking came to be seen as perhaps somewhat
less important in attaining that goal.
The leaders consolidated their control over the budget process by becoming more
directly involved in final negotiations toward the end of the study period. In the early
1990s, the leaders tended to rely on their top legislative budget experts (usually a close
ally who was a chair of an appropriations committee) in most of the negotiations, but as
the decade ended, the leaders got into the process earlier and more intensely.
Furthermore, beginning in 2000, the legislature passed budgets that included “member
initiatives,” a lump sum for each caucus whose distribution was to be determined by the
respective leaders (with the governor’s approval) during the fiscal year. This gave the
leaders very direct control over this pork barrel spending targeted at individual districts.
Finally, the majority party leadership seemed to exert even greater control over
the lawmaking process as the study period progressed, in such ways as the majority
2 In 2002, House Republican leader Lee Daniels also became the chair of his state party, but he stepped down from that position within a year due to a federal prosecutor’s investigation into the campaign activities of his staff.
14

leader’s office sometimes posting committee hearing notices (something typically and
formerly done by committee chairs) and dictating the number of bills a legislator could
call to the floor for 3rd Reading. Majority party leaders also gained significant control of
the legislative process when, in 1997, the chambers each began requiring that their Rules
Committee (controlled by the majority party leader) approve of each amendment offered
on the floor in 2nd Reading before it could be considered there.
Composition of the Legislature
Our interviewees noted some significant changes in the characteristics of the
members of the Illinois General Assembly in recent decades, but these changes occurred
largely in the 1970s and 1980s. Legislators in the study period were a more diverse group
demographically than they had been in previous decades, especially in terms of Hispanic
representation (tracking the growth of the Hispanic population in Illinois) and gender
(tracking the increase in female state legislators nationally). Our interviewees believed
that there were fewer farmers and lawyers in the State House during the study period and
more fulltime legislators and life insurance and real estate salespersons than prior to
1992.
Between 1992 and 2003, there was little systematic demographic change among
members of the General Assembly. There was a slight increase in women and non-white
state legislators during this period, with the only significant change being a 7.9
percentage point increase in non-white representation following the redistricting of 2002
(Figures 1 and 2). The average age of legislators fluctuated within a five-point range (47-
52 years of age) with no obvious pattern (Figure 3). The two best-represented
15

occupations of members of the General Assembly were lawyer and fulltime legislator.
The percentage of the membership that reported these occupations did not change greatly
or systematically during the study period (Figure 4). On the other hand, Illinois state
legislators were increasingly likely to have a post-graduate degree as the study period
progressed (Figure 5), supporting the impression of our interviewees that legislators have
become more educated in recent years.
FIGURES 1, 2, 3, 4, 5 ABOUT HERE
Reflecting the rise in the number of women and non-white state legislators in
Illinois, many of our interviewees believed that two non-party legislative caucuses had
developed influence in the legislative process during the study period: the Conference of
Women Legislators and the Black Legislative Caucus. Unlike in Congress, caucuses of
this sort are few in the Illinois General Assembly, and their development is recent. But
when these two bi-partisan, bi-chamber groups defined a common interest and held
together, they could have an impact on the process. The existence and tentative clout of
these groups was also seen by our interviewees as giving more clout to their individual
members. At the end of the study period, the Hispanic Caucus was organized formally,
suggesting that this group of legislators saw such organizations as an effective way to
pursue their common interests.
Changes in the partisan and electoral composition of the Illinois General
Assembly in the study period were largely driven by redistricting. Changing district
boundaries disrupts the connection between incumbent and constituent, making those
usually formidable incumbents more vulnerable to electoral challenges and, thereby,
giving more opportunity for membership change (Mooney 2004). Legislative turnover
16

(that is, the percentage of members in their first term) was high following post-
redistricting elections (1992 and 2002) but generally lower after other elections (Figure
6).3 Partisan turnover (that is, change in the party of the candidate winning in a district
from one election to the next) also followed a clear pattern related to redistricting, with
high partisan turnover in 1992 and 2002 and decreasing turnover as the legislative map
aged throughout the 1990s (Figure 7).4 The House and Senate had strikingly similar rates
of partisan turnover in each election. On the other hand, the partisan mix of Illinois state
legislators did not change as systematically during the study period (Figure 8).
Democrats gained seats after the 2002 redistricting (which that party dominated) and
Republicans gained in the House (but not the Senate) in 1994, following the national
trend that year. Neither is there is clear redistricting-related pattern in the average
number of years of in-chamber legislative experience (Figure 9), although the Senate has
a mild trend of increasing experience with the age of a legislative map.
FIGURES 6, 7, 8. 9 ABOUT HERE
Elections, Campaigns, and Representation
In broad terms, election and campaign activity for the Illinois General Assembly
was consistent throughout 1992-2003. These elections were run in single-member
districts drawn so that the great majority of them were homogeneous and safe for one
party, but with perhaps half a dozen (Senate) or a dozen (House) swing districts in each
chamber in any given election. The legislative party leaders acted as campaign generals,
3 There was more turnover in the House than the Senate between redistricting elections, likely because during these elections, only about two-thirds of Senate seats were up for election, whereas every Senate seat was up for election directly after redistricting (as was every House seat in every election). 4 Note that partisan turnover is also increased in post-redistricting elections by the fact that the numbering of these districts can change somewhat as districts are changed.
17

and their top staff as colonels, in identifying which districts to target for contestation and
providing the campaign financing and personnel for these targeted races. The leaders and
their top staff were also very active in recruiting and training potential candidates,
especially in these swing districts. The legislative leaders even occasionally recruited
candidates for primaries to oppose sitting members of their own party who either
displeased the leader in some significant way or, more important, whom the leader
thought was vulnerable in the general election.
Campaign spending on Illinois General Assembly races increased throughout the
study period, just as it did in races in the rest of the country (Figure 10). But more telling
than just average spending is the comparison between two categorically different types of
state legislative races in Illinois—targeted and non-targeted. Targeted races are those
few in each chamber in a given election that the party leaders felt were potentially
competitive.5 Since either party could win such a seat, the parties poured money and
staff resources from around the state into these districts. Most legislative districts were
drawn to be safe for one party, so there were plenty of resources that could be funneled
by the legislative party leaders into those few whose outcome was in doubt. Thus,
targeted races were much more expensive (Figure 11), with the top contributors being the
legislative party leadership.
FIGURES 10, 11 ABOUT HERE
Those drawing the legislative maps for the elections held during the study period
were successful in making most districts safe for one party. The percentage of legislative
5 The identification of which races were targeted in a given election is somewhat subjective, and it may even change during the course of a campaign as polling shows a race is becoming more or less competitive. We identified targeted races through contemporary news reports, informed observers, and an empirical evaluation of campaign finance data.
18

races that were uncontested by one of the major parties started the study period fairly
high (House- 15 percent, Senate- 31 percent) and increased throughout the decade
(Figure 12). Since 1998, with the exception of the House in post-redistricting 2002, over
45 percent state legislative races were uncontested. And even in those races with at least
nominal two-party competition, the average vote margin was never less than 25 percent
for either chamber in any election in the study period (Figure 13). On the other hand,
paralleling their contrast in campaign spending, targeted races had significantly more
competition than non-targeted races (Figure 14). Still, the average two-party vote margin
in these targeted races ranged from 8 to 25 percent, with no systematic change during the
study period. Thus, even while two-party competition in Illinois was very strong at the
statewide level and in the seat margins in the General Assembly during the study period,
it was weak to nonexistent at the legislative district level.
FIGURES 12, 13, 14 ABOUT HERE
The cause-and-effect relationships between campaign expenditures, vote margins,
redistricting, and legislative party leadership influence cannot be sorted out simply by
looking at these data. For example,were targeted races are more competitive because lots
of money was spent on them or did lots of money get spent on them because they were
more competitive? However, our interviews indicate that the causal chain goes as
follows. At the beginning of a decade, the leaders of the party controlling redistricting
designed only a few districts to be competitive between the parties. Party leaders then
conducted polls in potential swing districts before each election to assess the potential
closeness of these races. If a leader and his top staff identified a close race through these
polls, they decided whether to target that district for a fight. If they chose to contest it,
19

they tried to recruit a quality candidate and train him or her to run (assuming that party
had no incumbent in the seat). First and foremost, the leader and his staff looked for a
candidate that could win in the general election. Such a candidate would be well known
in the district, perhaps already serving in a local elected office whose constituency
overlapped a good deal with that of the legislative district. An ideal candidate would
speak well in public, be energetic, and have a good reputation that could withstand
negative campaigning from the other side. Such a candidate would also have plenty of
time for campaigning. And the candidate would be representative of the district in
ideology, race, occupation, and background.
Once such a quality candidate was identified by the leader and his staff (often,
this was the incumbent), the leader assigned campaign staff to the district, typically
including the operational campaign manager. Significant campaigns funds would be
shifted from the leader’s political committee(s) to that of the candidate. In fact, some
legislators who have been involved in a targeted race complained that they felt like mere
pawns in the process, having no input in their own campaign. But few, if any, candidates
in a close race refused their leader’s help, especially because their opponent was likely
getting help from his or her leader.
These campaign funds and staff were not given in a single large exchange at the
beginning of the campaign for the candidate to do with as he or she saw fit. Rather, the
leader would keep a close eye on the race through tracking polls and their staff to assess
the need for ongoing help. If polling showed that the candidate was either a sure winner
or a sure loser, or if the candidate appeared to be handling him or herself badly in the
campaign, the leader’s help would dry up. Alternatively, if the race continued to be close
20

and the other party poured money and resources into the opponent’s campaign, the race
could become an electoral Battle of Verdun, with hundreds of thousands of dollars being
spent in an effort to win a small piece of the legislative puzzle. But since so few districts
were in play in any given election, and since the partisan balance in each chamber
throughout the study period was so close, the outcome of these few targeted races could
have decided the balance of political power in the legislature. There is no evidence of a
systematic change in this pattern of electoral behavior during the study period.
Legislative Committees
In the American legislative process, the two main loci of power are legislative
party leadership and standing legislative committees. If power in this process is a zero-
sum game, then the influence of these two ought to be inversely related. Committees in
state legislatures are typically far less influential in lawmaking than they are in Congress,
and the legislative leadership is more so (Jewell and Whicker 1994; Francis 1989). This
was certainly the case in Illinois throughout the study period and, indeed, at least back to
the mid-20th century (Steiner and Gove 1960, chap. 3). If anything, the average
substantive legislative committee in the General Assembly became even less important in
the process the study period, as leaders’ power grew.
Committees gain influence and respect in the legislative process through the
stability of their membership, leadership, and jurisdiction, serving as a way for
legislatures to gather and interpret information and develop expertise among their
members (Krehbiel 1991). The committees of the Illinois General Assembly were not
stable in any of these ways during the study period. First, the names, jurisdictions, and
21

even existence of committees in the General Assembly were far more fluid than they
typically are in Congress. In the House, the organization of a new General Assembly
after an election in the study period typically brought a change of 20-40 percent to the
committee system, whether through old committees being abolished, new ones being
established, or retained ones having their names and jurisdictions changed significantly
(Figure 15). The level of committee change in the Senate was more variable, being
between 0 and 80 percent after each election. The leadership of these committees was
even more unstable, with between 50 and 100 percent of committees in each General
Assembly being chaired by a legislator who had not chaired that committee in the
previous General Assembly (Figure 16). Committee chair turnover followed a pattern
that parallels redistricting, with virtually complete turnover in each chamber after post-
redistricting elections, followed by a decline in this turnover (even if still at a high level)
through the life of the legislative map. Regardless of the patterns and variation in this
turnover and legislative change, these consistently high levels of instability are both a
symptom and cause of these committees’ having nowhere near the importance in the
legislative process in Illinois that committees do in Congress.
FIGURES 15, 16 ABOUT HERE
Aside from this instability, the committee system in the General Assembly during
the study period was further reduced in influence because it was closely controlled by the
legislative party leadership. Committees were established at the beginning of a General
Assembly by rule, and the majority party leader in each chamber (especially the House)
had great informal control over their number, names, and jurisdictions. Several of our
interviewees believed that these majority party leaders expanded the number of
22

committees and manipulated their names to provide whatever chairpersonships these
leaders needed to satisfy their members and whatever issue domains they needed to
satisfy important groups, public opinion, and their own legislative agendas. According to
our interviewees, the majority party leader might establish a committee for a member to
chair for the sole purpose of helping that chair’s re-election bid. One such case showed
unusual cross-party magnanimity, when a committee was established in the House for the
former minority leader to chair in an area of personal interest to him. This demonstrates
the fluidity of the committee system and the control that legislative leaders have over it.
The legislative leaders also dominated the committee system by controlling
committee appointments. The membership of each committee was established at the
beginning of each General Assembly by the legislative leaders, with the minority leader
typically being allowed to appoint minority party members (with some exceptions at the
pleasure of the majority leader). Seniority mattered little in committee assignments or the
designation of chairs. A leader typically tried to give his members the assignments they
requested, as long as the leader thought the assignment was good for that member’s re-
election. And in extreme cases, where the majority party leader desired an outcome for a
committee’s vote but feared that its current membership would not do as he wished, the
leader simply changed the membership of that committee temporarily, bringing in
“designated hitters” with explicit voting instructions from the leader. Such substitutions
might last for as little as a single day, and while there were not many of them in a given
session and their numbers are hard to document, on important legislation, they were not
unusual. Most of these substitutions were made by a leader to protect a member from
having to make a politically dangerous vote.
23

An important source of power for congressional committees is their designated
policy jurisdictions (King 1997). Committees in the Illinois General Assembly in the
study period had no such permanent or clearly defined jurisdictions, but rather dealt with
whichever bills the Rules Committees (one in each chamber) assigned to them. These
Rules Committees were small and dominated by the legislative leaders, with a majority of
each being from the majority party. In this way, the majority party leader could easily
assign a bill to whichever committee he wished, giving him enormous control over the
outcome.
Our interviewees agreed that committees typically did very little screening of bills
during the study period, with few bills dying in committee that their sponsors wanted to
move forward and with most committee votes being unanimous. Lack of consistent
records makes this claim difficult to verify, but we heard no contradiction of it in our
interviews. While more than one interviewee indicated that “committee hearings never
change anything,” several did suggest that hearings sometimes played an informational
and educational role for the committee members and the public, particularly on new or
minor issues. Committee hearings were also held on issues made salient by the media or
a crisis (e.g., airport congestion around Chicago and governmental ethics) to gather
information and demonstrate to the public that the legislature was dealing with the
problem. But most committees had little or no decisionmaking impact on legislation,
especially important legislation. On the other hand, once bills were reported to the floor
of a chamber and called for a vote there, the recommendation of the committee and
committee members were typically deferred to. This likely says more about leadership
24

control of floor action and the overall legislative process than it does about the esteem in
which the legislative committees were held, according to our interviewees.
One interviewees related an anecdote that demonstrates the extent to which the
majority party leadership (and by proxy through their staff) dominated the substantive
committees in the study period. When a lobbyist once asked a committee chair to
schedule a bill for a hearing, the chair said he had already done so, for a session two days
hence. The lobbyist told the chair that there were no bills officially posted for a hearing
for that day. After calling the Clerk of the House for verification, the chair became upset
because he had arranged for several constituents to come to Springfield for that hearing.
As it turned out, the majority party staff had held up these postings for technical reasons.
While unhappy, the chair was chagrinned and could nothing about it. This shows both
the domination of the committees, and even their chairs, by the majority party leadership
and the significant power the majority party staff derived through their association with
the majority leader.
This preceding characterization of committees in the Illinois General Assembly
during the study period as weak holds for the substantive committees, which were the
great majority of committees. On the other hand, the control committees—the Rules
Committees and the Executive Committees—were very strong. These control
committees were dominated by the legislative party leadership, especially the majority
party leadership, and were used to control the flow of legislation, whether for political or
policy reasons. For example, the Rules Committees not only assigned bills to substantive
committees for review, they also reviewed each amendment offered at 2nd Reading,
25

deciding either to allow it to be voted on on the floor, to refer it back to the bill’s original
substantive committee, or not to be considered at all.
Staff and Staff Agencies
The characteristics of the Illinois General Assembly’s staff were established in the
1970s and 1980s and were largely constant throughout the study period. Two types of
staff organizations exist in the General Assembly— non-partisan units with specific
mandates that are overseen by bi-partisan legislative commissions and four partisan staff
units, one each controlled by the top party leaders in each chamber. In the study period,
the partisan units did the primary staff work on bill analysis, appropriations analysis,
committee work, and constituent relations. The non-partisan staff units specialized in
such things as spot research (Legislative Research Unit), bill drafting (Legislative
Reference Bureau), and fiscal forecasting (Economic and Fiscal Commission). While
data on staffing levels (and on staff salaries, backgrounds, and much else) are not kept
systematically, our interviewees believed that the partisan staffs grew more rapidly in the
1970s and 1980s than did the non-partisan staffs and that their influence increased
markedly. In the study period, the influence of the partisan staff was strong and
consistent.
There were more partisan than non-partisan staff during the study period, and the
former were controlled directly by their respective legislative leaders. No other
legislator, not even committee chairs, hired any professional staff to work in the
legislature. No committee had permanent staff assigned to it. Members had a modest
annual budget to establish a district office (around $50,000 for most of the study period),
26

but this was typically spent on rent, office supplies, and secretarial support, not
professional staff. All staff that worked with committees or members were hired,
assigned, and supervised by the respective leader.
In answer to our questions about “the legislative staff,” our interviewees
commented on these partisan staff almost exclusively, demonstrating their prominence in
the process. These staff members were thought to be younger and more interested in
politics, as opposed to policy, than had their predecessors in the 1970s and 1980s. For
example, upon becoming Speaker of the House in 1983, Madigan established an “Issues”
staff unit in his office. Belying its name, the main job of the Issues unit was to help
Democratic representatives work with their districts. While this was not directly
campaign work (which would have been illegal for these state employees to perform
during working hours), it likely helped these representatives get re-elected. The other
legislative caucuses developed similar work units in the 1980s. The balance between
staff providing policy and legislative assistance versus constituent service assistance
differed among the four caucuses, but the latter got at least as much emphasis as the
former in terms of staff resources in each caucus, and in some, it got much more. In fact,
late in the study period, three of the four caucus partisan staffs came under federal
investigation for using staff to work directly on campaigns during office hours.
Legislative staff commonly worked on campaigns legally in the study period by
switching from the state payroll to the campaign payroll during election time.
Thus, the staffing patterns of the General Assembly in the study period both
reflected the legislative party leaders’ interest in campaigns and enhanced the
centralization of power around them. Any changes in this that our interviewees observed
27

during the study period were slow reinforcements of these patterns—the de-emphasis and
compartmentalization of the non-partisan staff units, the enhancement of the power and
breadth of control of the partisan staff (especially the top level of partisan staff), and the
recruitment of staff who were younger and more interested in politics, rather than policy.
Norms and Internal Relationships
How did legislative norms and internal relationships in the Illinois General
Assembly change during the study period? First, consider data on legislative processing
and session length.6 The length of the regular session declined through most of the study
period, but saw an increase in the last General Assembly for which we have full
information (Figure 17). On the other hand, the level of bill introductions increased in
the same period (Figure 18). And while one might expect the bill passage rate to drop as
the introduction rate increased, that was not the case until the final session in our data,
when the passage rate dropped precipitously (Figure 19). In other words, as the study
period progressed, the legislature met less often, but introduced and passed more bills.
This could mean that the legislature was getting more efficient, that there was less
thorough screening of bills, or that bills were getting less consequential and, therefore,
needed less evaluation, among other interpretations. We do not have sufficient
quantitative or qualitative information to know which interpretation is correct.
FIGURE 17, 18, 19 ABOUT HERE
Beyond these legislative processing data, we must rely on the impressions of our
interviewees for an assessment of the legislative norms in the Illinois General Assembly.
6 As of this writing, the 93rd Illinois General Assembly (2003-04) has not yet completed its work. Therefore, we do not report data on this session in this section.
28

These impressions typically were manifested in discussions of how members had
changed over the years, especially in the ways new and current members were different
than former members. Just as with our interviewees’ impressions of demographic
changes, the changes seen in the more informal characteristics and behavior of legislators
occurred mainly in the 1970s and 1980s. Furthermore, most of these norms are not as
easily documented as demographic changes, so conclusions about their timing and extent
are less reliable. That said, we derived several generalizations about how members
during the study period were different than members prior to the study period. For the
most part, these changes were also thought to be occurring at an evolutionary pace during
the study period.
The general consensus among our interviewees was that legislators in our study
period were more likely to have been recruited to run for office by the legislative leaders
than had been their predecessors. Thus, it is not surprising that new legislators’
characteristics increasingly reflected those that leaders sought in their ideal candidates.
Legislators were described as being younger, better educated, more aggressive in their
careers and in the legislature, and more representative of their districts in the most
obvious ways, such as ideology and race. On the other hand, they were thought to be
more cautious politically and socially, so that fewer long-serving, colorful characters
roamed the State House in the study period than had done so earlier. No longer was there
a cadre of young Turks challenging their leaders, such as those that had served at various
times in the past. This new breed of legislator tended to use staff for constituent service
and working in the district rather than for policy research. Legislators in the study period
were generally seen as more partisan, both inside and outside the legislature. They were
29

also seen as being less open to policy argument and less willing to change their minds.
This attitude, along with the wiring of each member’s floor desk to the computerized
legislative information system in the mid-1990s, giving them instant access to the
partisan staff summaries of each bill, made floor debate less important than it had been
previously. Note that these trends may well stem from the impacts of the 1980 Cutback
Amendment, the development of single-member districts in the House, and partisan
redistricting.
Our interviewees identified a few other, perhaps less fundamental, trends in the
norms and behavior of Illinois state legislators in the study period. First, members
became much more “tech savvy,” as several interviewees put it, as did the entire U.S.
population. Even most of the older members aggressively sought out instruction in the
use of their floor desktop computers and email. The newest, youngest members were
often quite comfortable with the new technology and used it especially in campaigning
for direct mail lists, voter information, reporting contributions and expenditures, and
tracking campaign contributors. One veteran member was said to search his campaign
contribution spreadsheet when answering the telephone to see how much the caller had
contributed to his campaign. Second, our interviewees felt that there was less
socialization among legislators outside of the capitol building as the study period
progressed. This was attributed to interest groups putting on fewer receptions and parties
during the session, concern about the impact of ethics legislation passed in the late 1990s,
more media scrutiny, and the general societal trend toward more health consciousness
that has affected legislative bodies in this way across the country (Rosenthal 1998).
30
A third trend in the study period that our interviewees noted was the reduction in
party leadership requiring, or even instructing, members how to vote in committee and on
the floor, especially in the House. Fewer “up or down arrows” were given, especially
toward the end of the study period. While this may seem to run counter to our
overarching theme of strong leadership control, it is a matter of emphasis and technique
rather than an indication of weaker leadership. Legislative party leaders’ main goal is to
gain or retain a majority in their chamber. During the study period, either through
learning or the replacement of a leader, at least some of the caucus leaders came to
believe that winning legislative elections was influenced less by votes in the legislature
and more by legislative work in the district. Leaders often had narrow and short policy
agendas during the study period, so they increasingly allowed members to vote their own
minds (or helped them understand which vote was the best for their districts). By giving
members this leeway to vote on the majority of bills, the leaders actually increased their
ability to control the major legislation (such as the state budget) that they cared the most
about.
Another important aspect of legislative norms and culture is the relationship
officials have with the media. As in many states where the capital is not a major city,
news coverage of Illinois state government, and especially the state legislature, is weaker
than its importance would warrant (Layton and Dorroh 2002). Our interviewees saw the
State House beat as a place where reporters would “punch their ticket” for a few years
and then move on to other assignments. But throughout the study period, there was a core
of veteran reporters serving along with the young ones on their way through. For
example, according to the Illinois Blue Book, there were 44 reporters registered with the
31

State House press corps in both 1990 and 2000, but only six of those registered in 1990
were still registered in 2000. This lack of continuity in the press corps led to a perhaps
less critical and informed set of reporters, thus allowing those who have been in state
government a long time (like the legislative leaders) to have a freer hand in controlling
the news coming out of the State House. While the number of reporters registered in the
State House press corps has been stable since at least 1990, the amount of time that these
reporters spent covering the legislature is thought to have decreased, with some Chicago
reporters and broadcast media focusing on the State House only in the final days of the
legislative session.
Several of our interviewees mentioned the increase during the study period of
“gotcha journalism,” with reporters looking for sensational scandals and officials making
mistakes, rather than writing state government stories with a good deal of detail and
background. This emphasis may have been prompted by a string of state government
scandals and the ethics legislation it instigated late in the study period, the lack of
experience and understanding of state government in the press corps, and the changing
economics and focus of the media industry.
Lobbyists and Lobbying
While hard data about the influence and activities of interest groups and lobbyists
in the Illinois state legislative process are hard to come by, our interviewees identified
some patterns during the study period. These patterns highlight the increased
concentration of power in the legislative party leadership. While specific groups and
interests gained and lost legislative influence throughout the study period, especially with
32

changes in the party majority in a chamber and the governor’s party, interest groups in
general were seen as being rather weak, largely due to leadership dominance. With weak
committees and rank-and-file members, lobbyists had fewer significant points of access
to the process than they might have in Congress or some other states.
The most important pattern of interest group behavior and influence in the study
period has to do with leadership power short-circuiting the influence groups might have
attained through campaign contributions. Groups contributed vast sums to campaigns,
attempting to gain access to policymakers. But with Illinois’s lack of campaign
contribution limits and the centralization of power in the leaders, the bulk of this money
typically passed through the few top leaders in each party and chamber (Redfield 2001,
chap. 3). In this way, campaign contributions were “laundered” through the leaders, who
distributed funds to the candidates in the few competitive, expensive races (and who were
in the leaders’ favor). Thus, the leaders were the only legislators accountable to these
contributors. But since the leaders controlled the legislative process and had many
sources of campaign funds, contributors had less leverage with them than they would
have had with a rank-and-file member to whom they might have given even a small
percentage of what they gave to leaders.
Against this backdrop of leadership domination, our interviewees identified three
trends in group and lobbyist activities over the course of the study period. First, they
believed that a handful of top contract lobbyists (such as former Governor Jim
Thompson) had increasing influence on the most important issues, and that they worked
through the legislator party leaders to get this influence. Other groups and lobbyists were
seen as being increasingly marginalized. Second, groups held fewer receptions and
33
lobbyists did less socializing with legislators and their staff as the study period
progressed. This was attributed to concerns over changing ethics legislation and
increased media scrutiny, the shortening of the legislative session by a month in 1995,
and the feeling that such activities were no longer an effective way to pursue a policy
agenda (if they ever were). Third, lobbyists were characterized as becoming increasingly
active in election campaigns beyond traditional campaign contributions, seeing this as a
way of gaining favor with legislators. Our interviewees suggested that this may be
indicative of a different type of person being attracted to the lobbying profession in recent
years, one for whom politics holds as much interest as policy. This parallels the trends in
the interests they identified in partisan legislative staff, legislative leaders, and rank-and-
file legislators.
Policy and Budget
While the governor has had a strong hand in the Illinois state budget process since
at least the adoption of the 1970 state constitution, the fiscal crisis faced by the state in
the early 1990s led Governor Jim Edgar to interject himself into the legislative phase of
the budget process in a direct way that set the pattern for the study period. The key
characteristic of this phase of the budget process was that after the governor proposed the
budget to the legislature in February, the legislative party leadership worked behind the
scenes with the governor’s office to modify the proposal so that it would be acceptable to
the General Assembly.
This concentration of power into the hands of the governor and legislative leaders
increased throughout the study period. First, the Appropriations Committees were
34

largely eliminated as an effective part of the process in favor of their chairs and minority
spokespersons (the “budgeteers”) negotiating in private with officials from the governor’s
Bureau of the Budget. Second, as the study period progressed, the budgeteers themselves
became less important, with the leaders and their top staff doing more of their own
negotiating even earlier in the process. This group made many of the final budget deals
in private discussions toward the end of the legislative session. District-specific, pork-
barrel spending had long been used to get the final votes of the rank-and-file to pass the
final budget, and this process was formalized (and legislative leadership power further
enhanced) later in the study period with the inclusion in the budget of money for
“member initiatives,” a lump sum appropriation to each caucus (with the majority party
getting more in each chamber) largely for capital projects. The allocation of each of
these funds was controlled by the respective party leader (with the approval of the
governor) with no specification in the budget. This not only increased the power of the
leaders, it also degraded what was left of the Appropriations Committees’ role in the
process, since these funds were distributed outside of the appropriations process. Finally,
the study period saw further concentration of leadership (and gubernatorial) power in the
budget process in 1995 when the effective deadline for passing a budget was changed
from June 30 to May 31. By shortening the deliberation process, those legislators and
groups outside the leaders’ inner circles had less time to gather independent information
and develop alternative budget proposals.
Even with the centralization of legislative budget power in the party leaders, the
governor dominated the Illinois state budget process throughout the study period. Our
35

interviewees uniformly stated that the governor got what he7 wanted out of the budget.
This stems from, among other things, the governor’s strong control of budgetary
information from the executive branch, his constitutional mandate to propose the budget,
and his strong veto power (see the next section). The governor’s dominance of the
budget process can be seen by looking at the overall changes made by the legislature in
the governors’ budget proposals during the study period. Figure 20 gives a rough
estimate of the legislature’s impact on the budget by showing that since 1992, the
legislature has passed budgets that were within 3 percent of those the governor
proposed.8
FIGURE 20 ABOUT HERE
Balance of Power with the Executive Branch
The 1970 Illinois State Constitution gives the governor strong formal powers, and
there has been a tradition of informal deference to the governor by the legislature since at
least the time of that constitution (Van der Slik and Redfield 1989, chap. 8). The
governor is only one of six elected statewide executives, but he is definitely the primary
statewide official, formally and informally. The governor can dominate the legislative
process, especially through one of the strongest veto powers in the country and his great
influence on the budget. Aside from formal powers, in an individualistic political culture
where elections and the spoils of government are crucial, during the study period,
governors garnered support for their legislative agendas through their control over
7 As of this writing, all Illinois governors have been male. 8 This is the net change made by the legislature in the total amount of the budget each General Assembly. This likely underestimates the gross legislative changes in the budget, as cuts and additions would cancel one another out. Data on the gross changes are not available.
36
district-specific capital projects and the use of public appearances and fundraising to help
legislators in re-election. The lack of strong legislative committees and legislative policy
experts enhanced the governor’s ability to impose his will on the General Assembly.
This relationship in part both arose from and enhanced the centralization of legislative
power in the party leaders. The only counterweight to gubernatorial power during the
study period was the consolidated power of the legislative leaders, especially the majority
leaders. This power was most potent when the leaders had the strong backing of their
members. Our interviewees noted that the personalities and styles of the governors and
legislative leaders had an important impact on legislative-executive relations, but that the
broad outlines of this relationship held constant despite some changes in personnel. And
given that the study period saw only one change of governor (following the 1998
election), only Republican governors, and no changes in the top legislative leaders until
2003, this relationship was very steady.
One place we can see this strong gubernatorial influence in the legislative process
is in the governors’ veto activity. An Illinois governor has one of the most powerful
vetoes in the country; he or she can veto a bill in total, eliminate or reduce a line-item in
an appropriations bill, or amendatorily veto a bill. Our interviewees felt that the
amendatory veto was an especially powerful tool. While the most potent power of the
veto may be in its threat rather than its use (Rosenthal 1990), veto usage and success in
the study period is telling. Figure 21 shows the percentage of bills passed by each
General Assembly that were vetoed in some way by the governor and the percentage of
those vetoes that were subsequently overridden. Note two things about this figure. First,
during the study period, Illinois governors were not reluctant to use their veto pen. While
37
the two General Assembly’s directly prior to the study period saw almost 20 percent of
their passed bills vetoed (not shown), even during the relatively less confrontational
sessions of the study period, the governor vetoed from 7 to 14 percent of passed bills.
Second, the override of a gubernatorial veto was usually a rare event in the study period.
In four of these five General Assemblies, no more than five vetoes were overridden
(Appendix B, Table 9). Indeed, in the first General Assembly of George Ryan’s
governorship (1999-2000), only two vetoes were overridden.9 Thus, Illinois governors
used the veto and made it stick during the study period.
FIGURE 21 ABOUT HERE
The general legislative attitude toward the executive agencies throughout the
study period was one of disinterest and deferral to the governor’s wishes, an attitude that
strengthened moderately as time went on, according to our interviewees. One
interviewee said that legislators care only about district projects and constituent service,
and since the executive agencies rarely have an impact on these, they are ignored. The
weak and shifting committee system reduces the ability of and incentive for legislators to
oversee agencies. The Appropriations Committees were seen as conducting some
oversight in the 1980s, but the reduction of their importance in the budget process in the
study period reduced their role in executive oversight. Paralleling the other impacts of an
increasing focus on elections and constituent work that we have discussed, Democratic
House leader Michael Madigan shifted his interest away from battling executive agencies
after regaining the majority in his chamber in the 1996 elections. Our interviewees noted
a few high profile scandals that focused legislators’ attention on certain executive
9 The legislature overrode 18 vetoes in Governor Jim Edgar’s lame duck General Assembly, when vetoes by the governor also spiked.
38

agencies, prompting hearings and speeches at various points in the study period, but the
norm was legislative disinterest.
This lack of legislative oversight is exemplified by the powers and activities of
the Joint Committee on Administrative Rules (JCAR), the bi-partisan panel of legislators
charged with reviewing executive agency rulemaking. Formally, JCAR is among the
most powerful legislative oversight committees in the country (Gerber, Maestas, and
Dometrius 2005), with two dozen staff members and the mandate to review all agency
rulemaking. But JCAR was generally believed by our interviewees to have little control
over agencies.10 Of the four actions JCAR could take on a proposed administrative rule,
only one even forced a slowing of its implementation, should an agency have chosen to
oppose the action (Mooney and Van Dyke-Brown 2003, chap. 6). And that action—a
filing prohibition—required a three-fifths vote of the committee, and even then, it could
only delay the rule’s implementation for 180 days while JCAR introduced a joint
resolution to the General Assembly that, if passed by both chambers, would permanently
prohibit the rule from being implemented. But even these relatively weak sanctions were
rarely imposed. Figure 22 shows that throughout the study period, JCAR objected to a
rule only rarely, issuing a filing prohibition less than 1 percent of the time. In no single
General Assembly in the study period did JCAR vote to prohibit as many as 10 rules.
Another way to view these figures is that on no more than 7 percent of the rules it
reviewed did JCAR voice any official concern whatsoever. Note that there was no
discernible trend in these JCAR actions, supporting our interviewees’ claims that
10 In 2004, legislation was passed that significantly strengthened the formal powers of JCAR to block administrative rules. As of this writing, this legislation had not been acted upon by the governor.
39

legislative interest in overseeing the executive branch was weak throughout the study
period.
FIGURE 22 ABOUT HERE
Adaptation and Institutional Maintenance
The moderate legislative turnover and stable cadre of long-serving legislators in
Illinois General Assembly during the study period (especially among the legislative party
leadership) has reduced the need for a concerted effort for formal institutional
maintenance mechanisms and training for new members. After each election in the study
period, legislator-elects were invited to participate in a three-day new members’
conference presented by the Legislative Research Unit (LRU). Most new members
attended at least some of these sessions. During the study period, the University of
Illinois’s Institute of Government and Public Affairs began to assist the LRU with this
conference, and the emphasis of many of the sessions shifted toward a discussion of
policy issues. Previously, the new members’ conference had been focused primarily on
procedural issues, such as how to introduce a bill, what were legitimate expenditures for
their district office allowances, how to file for travel reimbursement, and so forth. Our
interviewees who were familiar with the new members’ conference believed that new
members were still primarily concerned with these procedural issues. In the middle of
the study period, the be-partisan Conference of Women Legislators also began holding a
brief retreat for new women members after each election.
40

In general, institutional memory is maintained in the Illinois General Assembly by
senior and influential members informally mentoring promising new and journeymen
members.
Conclusion
Returning to the themes we identified at the outset, the Illinois General Assembly
from 1992 to 2003 was characterized by strong and centralized party leadership, gradual
change where change occurred, and strong party competition. The four sources of these
characteristics are Illinois’s individualistic political culture, the 1980 Cutback
Amendment, decennial redistricting since 1980, and the idiosyncrasies and lengthy tenure
of key officials in the process. In each of the aspects of the General Assembly we have
discussed in this report, these broad characteristics and their impacts are evident.
This report on Illinois offers two contributions to the Joint Project on Term
Limits. First, the Illinois General Assembly makes a good control case study because its
stability during the study period will make any changes found in the term-limits states
stand out in stark relief. There were few major events in Illinois politics and government
that could confound our conclusions about the impacts of term limits elsewhere. Second,
the fact that the 1980 Cutback Amendment and decennial legislative redistricting had
such a broad and deep impact on Illinois legislative politics indicates that institutional
reform can have significant effects even in old and established political institutions. This
suggests that term limits, an institutional reform on the same order of magnitude as these
changes in Illinois, likely has had and will continue to have a wide range of effects on
politics and government in term-limits states.
41

APPENDIX B ABOUT HERE
42

References
Edgar, Jim. 2001. “Parties, Leaders, and the Prospects for Compromise.” In Redistricting
Illinois, 2001. Urbana-Champaign, IL: Institute of Government and Public
Affairs.
Everson, David H., Joan A. Parker, William L. Day, Rita A. Harmony, and Kent D.
Redfield. 1982. Illinois Issues Special Report: The Cutback Amendment.
Springfield, IL: Illinois Issues.
Elazar, Daniel J. 1984. American Federalism: A View from the States. 3rd ed. New York:
Harper & Row.
Francis, Wayne L. 1989. The Legislative Committee Game: A Comparative Analysis of
the Fifty States. Columbus, OH: The Ohio State University Press.
Gerber, Brian J., Cherie Maestas, and Nelson C. Dometrius. 2005. “State Legislative
Influence over Agency Rulemaking: The Utility of Ex Ante Review Procedures.”
State Politics and Policy Quarterly 5: .
Gove, Samuel K. 2001. “Origins, Mechanics, and Politics.” In Redistricting Illinois,
2001. Urbana-Champaign, IL: Institute of Government and Public Affairs.
Gove, Samuel K., and James D. Nowlan. 1996. Illinois Politics and Government: The
Expanding Metropolitan Frontier. Lincoln, NE: University of Nebraska Press.
Hero, Rodney, and Caroline Tolbert. 1996. “A Racial/Ethnic Diversity Interpretation of
Politics and Policy in the States of the U.S.” American Journal of Political
Science 40: 851-71.
Jewell, Malcolm E., and Marcia Lynn Whicker. 1994. Legislative Leadership in the
American States. Ann Arbor, MI: University of Michigan Press.
43

King, David C. 1997. Turf Wars: How Congressional Committees Claim Jurisdiction.
Chicago: University of Chicago Press.
Krehbiel, Keith. 1991. Information and Legislative Organization. Ann Arbor, MI:
University of Michigan Press.
Layton, Charles, and Jennifer Dorroh. 2002. “Sad State.” American Journalism Review
June (on-line edition).
Legislative Research Unit. 2003. Preface to Lawmaking. Springfield, IL: Illinois General
Assembly.
Loftus, Tom. 1994. The Art of Legislative Politics. Washington, DC: CQ Press.
Mooney, Christopher Z. 2004. “The Effects of Term Limits in Professionalized State
Legislatures.” Presented at the 4th Annual State Politics and Policy Conference,
Kent State University.
Mooney, Christopher Z., and Barbara Van Dyke-Brown. 2003. Lobbying Illinois.
Springfield, IL: University of Illinois at Springfield.
Nardulli, Peter F. 1990. “Political Subcultures in the American States- An Empirical
Examination of Elazar’s Formulation.” American Politics Quarterly 18: 287-315.
Redfield, Kent D. 2001. Money Counts: How Dollars Dominate Illinois Politics and
What We Can Do about It. Springfield, IL: Institute for Public Affairs.
Rosenthal, Alan. 1990. Governors & Legislators: Contending Powers. Washington, DC:
CQ Press.
Rosenthal, Alan.1998. The Decline of Representative Democracy: Process, Participation,
and Power in State Legislatures. Washington, DC: CQ Press.
44

Steiner, Gilbert Y., and Samuel K. Gove. 1960. Legislative Politics in Illinois. Urbana,
IL: University of Illinois Press.
Telcser, Arthur A. 1976. “Yes- Cumulative Voting.” Illinois Issues, November, 13-4.
Van der Slik, Jack R., and Kent D. Redfield. 1989. Lawmaking in Illinois: Legislative
Politics, People and Processes. Springfield, IL: Sangamon State University.
Van Dyke-Brown, Barbara. 2002. Almanac of Illinois Politics- 2002. Springfield, IL:
Institute for Public Affairs.
Wheeler, Charles N., III. 2000. “It's the 20th Anniversary of the Regrettable Cutback
Amendment.” Illinois Issues, November, 42-3.
Wirt, Fredrick M. 1991. “Soft Concept and Hard Data- A Research Review of Elazar’s
Political Culture.” Publius 21: 1-13.
45

Appendix B: Figures and Data Tables Figure 1. Percentage of Women in the Illinois General Assembly, 1992-2002
2021222324252627282930
1992 1994 1996 1998 2000 2002
Election Year
%W
omen
Source: Appendix B, Table 1
46

Figure 2. Percentage of Non-Whites in the Illinois General Assembly, 1992-2002
1012141618202224
1992 1994 1996 1998 2000 2002
Election Year
% N
on-W
hite
Source: Appendix B, Table 1
47

Figure 3. Average Age at Election of Illinois State Legislators, 1992-2002
47
48
49
50
51
52
53
1992 1994 1996 1998 2000 2002
Election Year
Ave
rage
Age
48

Figure 4. Lawyers and Fulltime Legislators as a Percentage of the Illinois General Assembly, 1992-2002
10
20
30
40
50
1992 1994 1996 1998 2000 2002
Election Year
% O
ccup
atio
ns
Lawyers Fulltime Legislators
Source: Appendix B, Table 1
49

Figure 5. Percentage of Illinois State Legislators with a Post-Graduate Degree, 1992-2002
35
40
45
50
1992 1994 1996 1998 2000 2002
Election Year
% P
ost-
Gra
d D
egre
e
Source: Appendix B, Table 1
50

Figure 6. Turnover in Illinois State Legislative Seats, 1992-2002
5
15
25
35
45
1992 1994 1996 1998 2000 2002
Election Year
% T
urno
ver
Senate House
Source: Appendix B, Table 2
51

Figure 7. Percentage of Illinois State Legislative Districts with Partisan Change, 1992-2002
0
5
10
15
1992 1994 1996 1998 2000 2002
Election Year
% C
hang
e
Senate House
Source: Appendix B, Table 2
52

Figure 8. Percentage of Illinois State Legislators Who Were Democrats, 1992-2002
45
50
55
60
1992 1994 1996 1998 2000 2002
Election Year
% D
emoc
rat
Senate House
Source: Appendix B, Table 2
53

Figure 9. Average Years of In-Chamber Legislative Experience at Time of Election, 1992-2002
4
6
8
10
12
1992 1994 1996 1998 2000 2002
Election Year
Ave
. Yea
rs E
xper
ienc
e
Senate House
Source: Appendix B, Table 2
54

Figure 10. Mean Campaign Expenditures of Successful Candidates for the Illinois General Assembly (Full Election Cycle), 1992-2002
$50$100$150$200$250$300$350$400
1 3 5
Election Year
$1,0
00s
Senate House
Source: Appendix B, Table 3
55

Figure 11. Mean Campaign Expenditure of Successful Candidates for the Illinois General Assembly, by Targeted and Non-Targeted Races (Full Election Cycle), 1992-2002
0100200300400500600700800
1992 1994 1996 1998 2000 2002
Election Year
$1,0
00s
Sen-Target House-TargetSen-Nontarget House-Nontarget
Source: Appendix B, Table 4
56
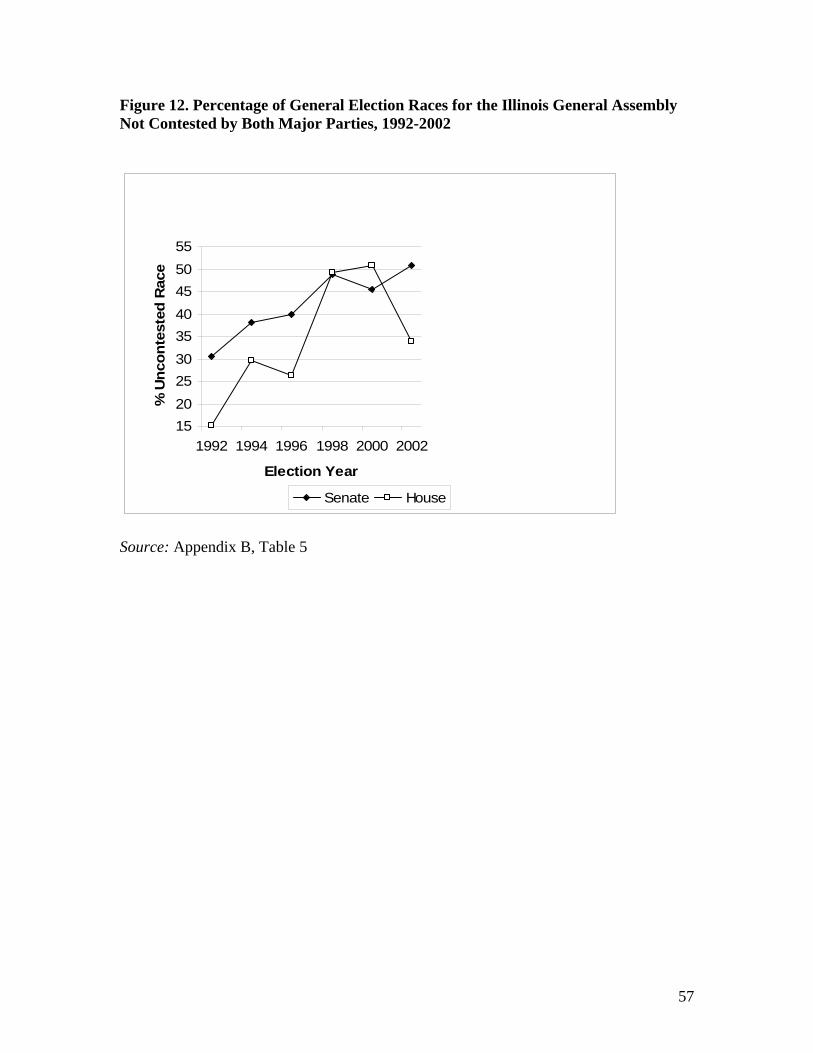
Figure 12. Percentage of General Election Races for the Illinois General Assembly Not Contested by Both Major Parties, 1992-2002
152025303540455055
1992 1994 1996 1998 2000 2002
Election Year
% U
ncon
test
ed R
ace
Senate House
Source: Appendix B, Table 5
57

Figure 13. Average Electoral Competition in General Election Races for the Illinois General Assembly, 1992-2002
25
30
35
40
45
1992 1994 1996 1998 2000 2002
Election Year
Ave
. Vot
e M
argi
n
Senate House
Note: Mean vote margin of races in which both a Democratic and Republican candidate were on the general election ballot. Source: Appendix B, Table 5
58

Figure 14. Average Electoral Competition in General Election Races for the Illinois General Assembly, by Targeted and Non-Targeted Races, 1992-2002
5
15
25
35
45
55
1992 1994 1996 1998 2000 2002
Election Year
Ave
. Vot
e M
argi
n
Sen-Target House-TargetSen-Nontarget House-Nontarget
Source: Appendix B, Table 6
59
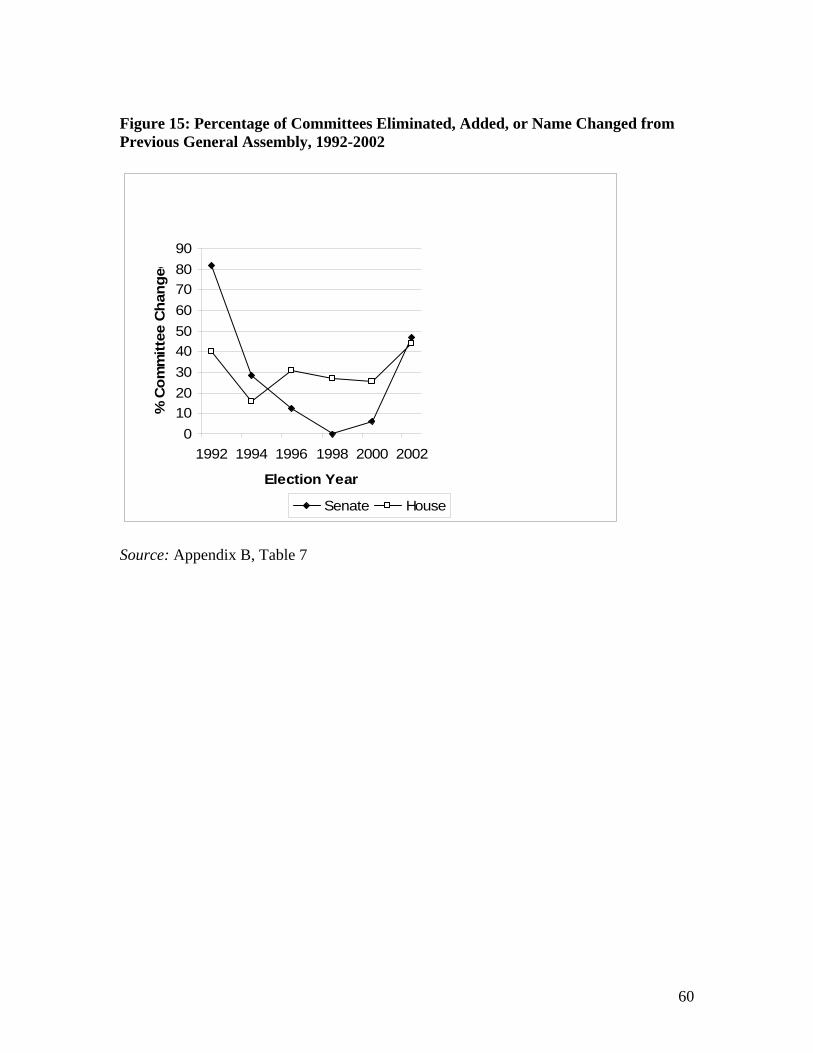
Figure 15: Percentage of Committees Eliminated, Added, or Name Changed from Previous General Assembly, 1992-2002
0102030405060708090
1992 1994 1996 1998 2000 2002
Election Year
% C
omm
ittee
Cha
nged
Senate House
Source: Appendix B, Table 7
60

Figure 16: General Assembly Committee Chair Turnover, 1992-2002
50
60
70
80
90
100
1992 1994 1996 1998 2000 2002
Election Year
% C
hair
Turn
ove
Senate House
Source: Appendix B, Table 8
61

Figure 17: Regular Legislative Session Days for the Illinois General Assembly, 1992-2000
110
120
130
140
150
160
170
1992 1994 1996 1998 2000
Election Year
Reg
ular
Ses
sion
Day
s
Senate House
Note: Regular legislative session days are counted for the General Assembly whose members were elected in the election on the X-axis. Source: Appendix B, Table 9
62

Figure 18: Bills Introduced in the Illinois General Assembly (Both Chambers), 1992-2000
5000
6000
7000
8000
9000
1992 1994 1996 1998 2000
Election Year
Bill
s In
trod
uced
Note: Bill introductions are counted for the General Assembly whose members were elected in the election on the X-axis. Source: Appendix B, Table 9
63
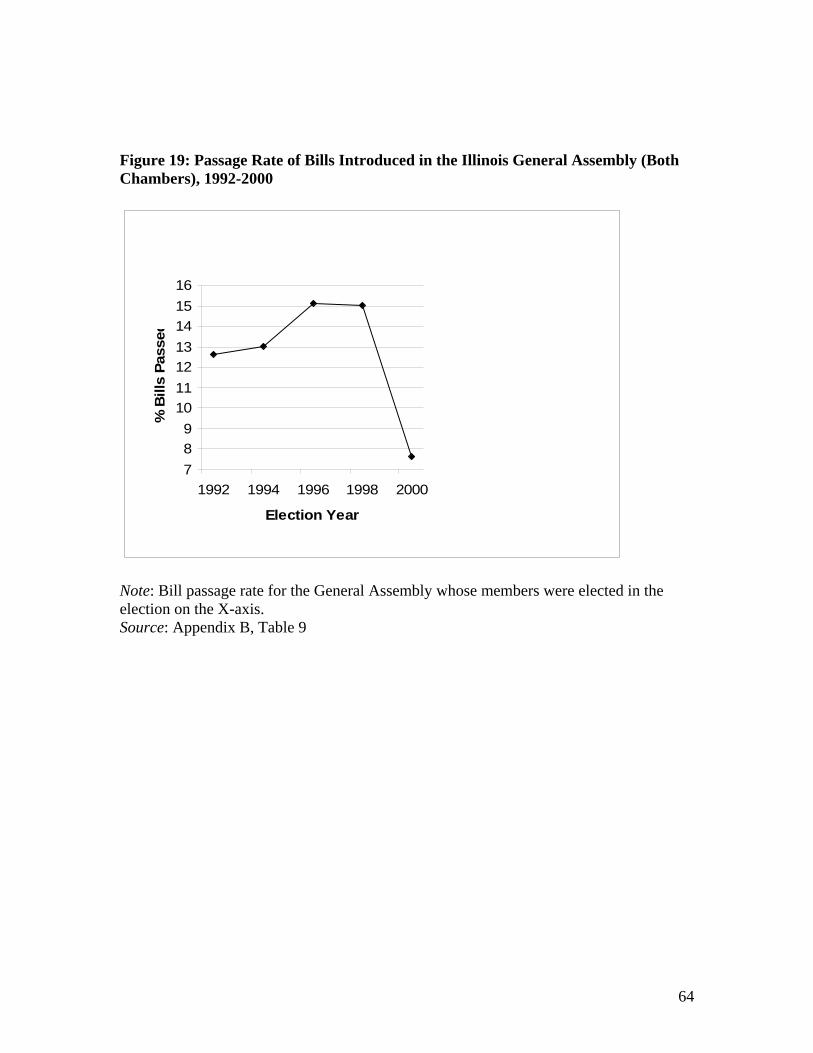
Figure 19: Passage Rate of Bills Introduced in the Illinois General Assembly (Both Chambers), 1992-2000
789
10111213141516
1992 1994 1996 1998 2000
Election Year
% B
ills
Pass
ed
Note: Bill passage rate for the General Assembly whose members were elected in the election on the X-axis. Source: Appendix B, Table 9
64

Figure 20: Net Legislative Changes in the Gubernatorially Proposed Budget, 1993-1999
0
1
2
3
4
1992 1994 1996 1998
Election Year
% C
hang
ed
Note: Net legislative changes in the proposed budget are combined for each General Assembly for the election indicated on the X-axis. Source: Appendix B, Table 10
65

Figure 21: Veto and Override Rates of Bills Passed by the Illinois General Assembly, 1992-2000
0
5
10
15
1992 1994 1996 1998 2000
Election Year
Perc
enta
ge
Vetoed Overidden
Note: Bill veto and override rates for the General Assembly for which those at each election on the X-axis were elected. Source: Appendix B, Table 9
66

Figure 22: Joint Committee on Administrative Rules (JCAR) Actions, 1993-2002
0
1
2
3
4
1992 1994 1996 1998 2000
Election Year
% o
f Pro
pose
d R
ule
Recommended Changes Objections Prohibited
Note: JACR actions for the General Assembly after the election on the X-axis. Source: Appendix B, Table 11
67

Table 1. Demographic Characteristics of Members of the General Assembly*
Election Year
Female Hispanic Black
Lawyers Fulltime Legislators
Post-Graduate
Degree 1992 23.16 3.39 11.30 19.77 47.46 36.16 1994 23.16 3.39 12.43 20.03 41.24 37.29 1996 25.99 3.39 12.43 23.16 36.72 42.37 1998 25.42 3.39 12.99 23.73 40.11 45.20 2000 26.55 3.39 12.99 21.47 40.68 44.07 2002 26.55 7.90 14.69 19.21 45.20 46.89
*At start of session Note: Values are percentages of the entire General Assembly. Source: Almanac of Illinois Politics, various years Table 2. Results of Legislative Elections*
Democratic Seats Partisan Change Turnover In-Chamber
Legislative Experience
Election Year
House Senate House Senate House Senate House Senate
1992 56.80 45.80 14.40 10.17 41.53 38.98 8.53 4.22 1994 46.60 45.80 11.01 4.76 23.70 8.47 9.88 4.83 1996 50.10 47.50 5.08 5.00 16.95 13.56 12.42 5.69 1998 50.10 47.50 1.69 2.44 16.95 13.56 8.03 5.37 2000 52.50 45.80 0.00 0.00 10.17 5.08 10.53 7.17 2002 55.90 55.90 11.86 13.56 23.73 27.12 8.32 4.93
*At start of session Note: Values are percentages. Source: Almanac of Illinois Politics, various years
68

Table 3. Average Campaign Expenditures of Successful Legislative Candidates in Illinois (Full Election Cycle), 1992-2002
Mean expenditure Median expenditure Election cycle House Senate House Senate 1992 $ 77,308 $100,086 $45,659 $52,438 1994 $109,349 $ 65,671 $34,773 $26,021 1996 $151,051 $138,863 $44,132 $51,681 1998 $138,742 $145,387 $53,135 $54,483 2000 2002 $260,564 $404,610 $152,914 $258,282
Note: Top leaders in each party in each chamber are not included, since their campaign finance activities and data are not comparable to those of the rank and file. Source: Illinois State Board of Elections candidate campaign finance records Table 4. Average Campaign Expenditure of Successful Legislative Candidates in Illinois, by Targeted/Non-Targeted Races (Full Election Cycle), 1992-2002
Targets’ Mean Expenditures
(number of targets) Non-Targets’ Mean Expenditures
Election cycle House Senate House Senate 1992 $162,893
(14) $274,499
(11) $45,743 $48,379
1994 $212,238 (19)
$351,891 (5)
$41,940 $26,163
1996 $315,267 (19)
$511,424 (7)
$50,183 $52,450
1998 $337,788 (15)
$497,052 (7)
$57,714 $68,593
2000
2002 $680,417 (11)
$808,793 (9)
$152,473
$251,847
Note: Top leaders in each party in each chamber are not included, since their campaign finance activities and data are not comparable to those of the rank and file. Targeted races were identified through contemporary news reports, informed observers, and empirical evaluation of the campaign finance data to find those races that were qualitatively different than the average. Source: Illinois State Board of Elections candidate campaign finance records
69

Table 5. Electoral Competition in General Election State Legislative Races, 1992-2002
Mean electoral margin* Median electoral margin* Number of Uncontested
Races (percentage)** Election House Senate House Senate House Senate 1992 30.6 25.9 25.8 25.9 18 (15.3%) 18 (30.5%) 1994 34.7 36.6 34.5 45.6 35 (29.7%) 8 (38.1%) 1996 35.4 29.1 30.4 23.9 31 (26.3%) 16 (40.0%) 1998 32.9 41.6 29.6 36.7 58 (49.2%) 20 (48.8%) 2000 33.6 28.8 32.4 24.4 60 (50.8%) 10 (45.5%) 2002 39.5 28.7 36.9 27.1 40 (33.9%) 30 (50.8%)
*Electoral margin is measured as the absolute difference between the Democratic party candidate’s percentage of the vote in the general election and that of the Republican candidate, in races where both a Republican and Democratic candidate were on the ballot. **Uncontested races are those general election races where either the Democratic or Republican party was not on ballot. Source: Almanac of Illinois Politics, various years. Table 6. Electoral Competition in Targeted vs. Non-Targeted Districts General Election State Legislative Races, 1992-2002
Targets’ Mean Electoral Margin (number of targets)
Non-Targets’ Mean Electoral Margin (number of non-targets)
Election cycle House Senate House Senate 1992 11.6
(14) 14.6 (11)
33.5 29.0
1994 11.5 (19)
25.1 (5)
41.2 42.8
1996 9.9 (19)
8.8 (7)
42.3 37.5
1998 13.4 (15)
16.2 (7)
38.3 52.8
2000
2002 24.9 (11)
8.1 (9)
41.2 33.6
Note: Only districts with contested races are included in these data. Targeted races were identified through contemporary news reports, informed observers, and empirical evaluation of the campaign finance data to find those races that were qualitatively different than the average. Electoral margin is measured as the absolute difference between the Democratic party candidate’s percentage of the vote in the general election and that of the Republican candidate, in races where both a Republican and Democratic candidate were on the ballot. Source: Almanac of Illinois Politics, various years.
70

Table 7: Changes in the General Assembly’s Committee System, 1993-2003
House Senate
Start of
GA
# of Committees*
Lost from Previous
GA
New or Name
Changed
% Changes Total**
# of Committe
es*
Lost from Previous
GA
New or Name
Changed
% Changes Total**
1993 31 9 7 40.0 14 8 10 81.8 1995 29 1 4 16.1 16 1 3 28.6 1997 33 3 6 31.0 16 1 1 12.5 1999 43 0 9 27.3 16 0 0 0.0 2001 34 11 0 25.6 17 0 1 6.3 2003 33 8 7 44.1 21 2 6 47.1
*Includes regular and special committees **Indicates percentage of the previous General Assembly’s committees that were changed, new, or deleted in the current General Assembly. Source: Handbook of the Illinois Legislature, various years Table 8: General Assembly Committee Chair Turnover, 1993-2003
Start of GA House* Senate 1993 100.00 100.00 1995 93.10 75.00 1997 78.79 100.00 1999 55.81 68.75 2001 50.00 52.94 2003 97.56 100.00
*Percentage of committees of a General Assembly with chairs who had not chaired that committee in the previous General Assembly. Note: Change of party majority (House- 1995, Senate- 2003) may have inflated committee chair turnover. Source: Handbook of the Illinois Legislature, various years
71

Table 9: Legislative Processing in the Illinois General Assembly, 1993-2001
General Assembly
House Session Days*
Senate Session Days*
#Intro’ed #Passed (%)
#Vetoed (%)
#Overridden (%)
1993-94 165 152 6128 775 (12.65)
104 (13.42)
5 (4.81)
1995-96 150 122 5734 746 (13.01)
67 (8.98)
3 (4.48)
1997-98 140 119 5863 887 (15.13)
121 (13.64)
18 (14.88)
1999-2000 134 112 6748 1015 (15.04)
91 (8.97)
2 (2.20)
2001-02 152 118 8717 664 (7.62)
47 (7.08)
3 (6.38)
*Regular session days Note: As of this writing, the 2003-04 General Assembly had not completed its legislative work. Source: Legislative Research Unit 2003 Table 10: Legislative Influence on the State Budget, 1993-2000
General Assembly*
Percentage Difference between Gubernatorial Proposal and the Budget Passed by the GA (% of
Proposed Budget) 1993-94 3.11% 1995-96 0.02% 1997-98 2.35%
1999-2000 2.55% *Due to data sources, the information on the budgets for the two fiscal years that each General Assembly passed are combined here. Source: Illinois Economic and Fiscal Commission
72

Table 11: Joint Committee on Administrative Rules (JCAR) Actions, 1993-2002
JCAR Actions General Assembly
Rules reviewed Recommended
Changes Objections Prohibited
1993-94 1194 26 (2.18)
32 (2.68)
9 (0.75)
1995-96 1263 32 (2.53)
45 (3.56)
8 (0.63)
1997-98 1250 16 (1.28)
25 (2.00)
2 (0.16)
1999-2000 1168 21 (1.80)
34 (2.91)
5 (0.43)
2001-02 1128 33 (2.93)
32 (2.84)
3 (0.27)
Note: Severity of JCAR actions in increasing order of severity is “recommended changes”- “objections”- “prohibited.” Source: Illinois Joint Commission on Administrative Rules
73