THE ICSID CASELOAD Web Stats... · arbitration and conciliation proceedings, including further...
34
THE ICSID CASELOAD – STATISTICS (ISSUE 2017-1)
Transcript of THE ICSID CASELOAD Web Stats... · arbitration and conciliation proceedings, including further...

THE ICSID CASELOAD –
STATISTICS (ISSUE 2017-1)

© 2017 by International Centre for Settlement of Investment Disputes.
Content may be reproduced for educational use with acknowledgement. Page | 2
The ICSID Caseload – Statistics
(Issue 2017-1)
This issue of the ICSID Caseload – Statistics updates the profile of the ICSID caseload, historically and for the calendar year 2016. It is based on cases registered or administered by ICSID as of December 31, 2016.
As in the previous issues, this document illustrates: the number of cases registered under the ICSID Convention and Additional Facility Rules; the number of other cases administered by the ICSID Secretariat; the basis of consent to ICSID jurisdiction invoked in registered arbitration and conciliation cases; the geographic distribution of ICSID cases by the State party to the dispute, and the economic sectors involved in ICSID disputes. It also contains data on outcomes in ICSID arbitration and conciliation proceedings, including further information on disputes decided by arbitral tribunals, data on discontinued ICSID arbitration proceedings, and outcomes to date in annulment proceedings under the ICSID Convention. The nationalities and geographic origins of arbitrators, conciliators and ad hoc committee members appointed in ICSID cases are also featured.
The Secretariat will continue to publish the ICSID Caseload – Statistics on a bi-annual basis, and welcomes any comments or suggestions by email at [email protected].

© 2017 by International Centre for Settlement of Investment Disputes.
Content may be reproduced for educational use with acknowledgement. Page | 3
TABLE OF CONTENTS1
PART I - ALL CASES REGISTERED AND ADMINISTERED BY ICSID 1. Map of the ICSID Contracting States and Other Signatories to the ICSID Convention as of December 31, 2016 6
2. Cases Registered by ICSID 7 Chart 1: Total Number of ICSID Cases Registered, by Calendar Year 7 Chart 2: Number of Cases Registered under the ICSID Convention and Additional Facility Rules, by Calendar Year 8 Chart 3: Type of Cases Registered under the ICSID Convention and Additional Facility Rules 8
3. Non-ICSID Cases Administered by the ICSID Secretariat 9 Chart 4: Number of Non-ICSID Cases Administered by the ICSID Secretariat over the Past Ten Fiscal Years2 9
4. Basis of Consent Invoked to Establish ICSID Jurisdiction in Registered ICSID Cases 10 Chart 5: Basis of Consent Invoked to Establish ICSID Jurisdiction in Cases Registered under the ICSID Convention and Additional Facility Rules 10
5. Geographic Distribution of All ICSID Cases, by State Party Involved 11 Chart 6: Geographic Distribution of All Cases Registered under the ICSID Convention and Additional Facility Rules, by State Party Involved 11
6. Distribution of All ICSID Cases by Economic Sector 12 Chart 7: Distribution of All Cases Registered under the ICSID Convention and Additional Facility Rules, by Economic Sector 12
7. ICSID Arbitration and Conciliation Proceedings – Outcomes 13 Chart 8: Arbitration Proceedings under the ICSID Convention and Additional Facility Rules – Outcomes 13 Chart 8a: Arbitration Proceedings under the ICSID Convention and Additional Facility Rules – Tribunal Rulings, Settlement & Discontinuances 14 Chart 8b: Disputes Decided by Arbitral Tribunals under the ICSID Convention and Additional Facility Rules – Findings 14 Chart 8c: Disputes Settled or Proceedings Otherwise Discontinued under the ICSID Convention and Additional Facility Rules – Basis 16 Chart 9: Conciliation Proceedings under the ICSID Convention and Additional Facility Rules – Outcomes 17 Chart 10: Conciliation Proceedings under the ICSID Convention and Additional Facility Rules – Commission Reports 17
8. Annulment Proceedings under the ICSID Convention – Outcomes 18 Chart 11: Awards Rendered and Outcomes in Annulment Proceedings under the ICSID Convention, by Decade 18
9. Arbitrators, Conciliators and ad hoc Committee Members Appointed in ICSID Cases 19 Chart 12: Arbitrators, Conciliators and ad hoc Committee Members Appointed in Cases Registered under the ICSID Convention and Additional Facility Rules – Distribution of Appointments by Geographic Region 19 Chart 13: Arbitrators, Conciliators and ad hoc Committee Members Appointed in Cases Registered under the ICSID Convention and Additional Facility Rules – Distribution of Appointments by ICSID and by the Parties (or Party-appointed Arbitrators) by Geographic Region 20 Chart 14: State of Nationality of Arbitrators, Conciliators and ad hoc Committee Members Appointed in Cases Registered under the ICSID Convention and Additional Facility Rules 21
1 The data is based on ICSID statistics as of December 31, 2016. 2 The ICSID Fiscal Year covers the period July 1 to June 30.

© 2017 by International Centre for Settlement of Investment Disputes.
Content may be reproduced for educational use with acknowledgement. Page | 4
PART II - CASES REGISTERED AND ADMINISTERED BY ICSID IN 2016 1. New Cases Registered by ICSID in 2016 23
Chart 1: Number of New Cases Registered under the ICSID Convention and Additional Facility Rules in 2016 23
2. Non-ICSID Cases Administered by the ICSID Secretariat in 2016 23 Chart 2: Number of Non-ICSID Cases Administered by the ICSID Secretariat in 2016 23
3. Basis of Consent Invoked to Establish ICSID Jurisdiction in New Cases Registered in 2016 24 Chart 3: Basis of Consent Invoked to Establish ICSID Jurisdiction in New Cases Registered in 2016 under the ICSID Convention and Additional Facility Rules 24
4. Geographic Distribution of New ICSID Cases Registered in 2016, by State Party Involved 25 Chart 4: Geographic Distribution of New Cases Registered in 2016 under the ICSID Convention and Additional Facility Rules, by State Party Involved 25 Chart 5: Geographic Distribution of New Cases Registered in 2016 under the ICSID Convention and Additional Facility Rules, by State Party Involved – Further Details 26
5. Distribution of New ICSID Cases Registered in 2016, by Economic Sector 27 Chart 6: Distribution of New Cases Registered in 2016 under the ICSID Convention and Additional Facility Rules, by Economic Sector 27
6. ICSID Arbitration Proceedings Concluded in 2016 – Outcomes 28 Chart 7: Arbitration Proceedings under the ICSID Convention and Additional Facility Rules concluded in 2016 – Outcomes 28 Chart 7a: Arbitration Proceedings under the ICSID Convention and Additional Facility Rules concluded in 2016 – Tribunal Rulings, Settlement & Discontinuances 29 Chart 7b: Disputes Decided by Arbitral Tribunals under the ICSID Convention and Additional Facility Rules in 2016 – Findings 30 Chart 7c: Disputes Settled or Proceedings Otherwise Discontinued under the ICSID Convention and Additional Facility Rules in 2016 – Basis 31
7. Arbitrators, Conciliators and ad hoc Committee Members Appointed in ICSID Cases in 2016 32 Chart 8: Arbitrators, Conciliators and ad hoc Committee Members Appointed in 2016 in Cases Registered under the ICSID Convention and Additional Facility Rules – Distribution of Appointments by Geographic Region 32 Chart 9: Arbitrators, Conciliators and ad hoc Committee Members Appointed in 2016 in Cases Registered under the ICSID Convention and Additional Facility Rules – Distribution of Appointments by ICSID and by the Parties (or Party-appointed Arbitrators) by Geographic Region 33 Chart 10: State of Nationality of Arbitrators, Conciliators and ad hoc Committee Members Appointed in 2016 in Cases Registered under the ICSID Convention and Additional Facility Rules 34

© 2017 by International Centre for Settlement of Investment Disputes.
Content may be reproduced for educational use with acknowledgement. Page | 5
PART I
ALL CASES REGISTERED AND ADMINISTERED BY ICSID

© 2017 by International Centre for Settlement of Investment Disputes.
Content may be reproduced for educational use with acknowledgement. Page | 6
1. Map of the ICSID Contracting States and Other Signatories to the ICSID Convention as of December 31, 2016

© 2017 by International Centre for Settlement of Investment Disputes.
Content may be reproduced for educational use with acknowledgement. Page | 7
2. Cases Registered by ICSID
Chart 1: Total Number of ICSID Cases Registered, by Calendar Year:
As of December 31, 2016, ICSID had registered 597 cases under the ICSID Convention and Additional Facility Rules.
14
1 2 1 2 2 3 41
41 2 1
3 3 3
10 11 1012
14
19
31
27 27
23
37
21
25 26
38
50
4038
52
48
0
10
20
30
40
50
60
1972
1973
1974
1975
1976
1977
1978
1979
1980
1981
1982
1983
1984
1985
1986
1987
1988
1989
1990
1991
1992
1993
1994
1995
1996
1997
1998
1999
2000
2001
2002
2003
2004
2005
2006
2007
2008
2009
2010
2011
2012
2013
2014
2015
2016
Cases Registered under the ICSID Convention and Additional Facility Rules

© 2017 by International Centre for Settlement of Investment Disputes.
Content may be reproduced for educational use with acknowledgement. Page | 8
Chart 2: Number of Cases Registered under the ICSID Convention and Additional Facility Rules by Calendar Year:
Chart 3: Type of Cases Registered under the ICSID Convention and Additional Facility Rules:
1 4 1 2 1 2 1 2 4 1 4 1 2 1 2 3 38 8 8 9
1418
30
21 24 21
32
20 23 2533
40 38 35
5042
1 1 1
1
1
1 1
1
2 3 2 3
16
22
4
12
1
4
82
3
2
52
0
10
20
30
40
50
60
1972
1973
1974
1975
1976
1977
1978
1979
1980
1981
1982
1983
1984
1985
1986
1987
1988
1989
1990
1991
1992
1993
1994
1995
1996
1997
1998
1999
2000
2001
2002
2003
2004
2005
2006
2007
2008
2009
2010
2011
2012
2013
2014
2015
2016
ICSID Convention Arbitration Cases ICSID Convention Conciliation Cases
ICSID Additional Facility Arbitration Cases ICSID Additional Facility Conciliation Cases
ICSID Convention Arbitration Cases
534(89.5%)
ICSID Convention Conciliation Cases
8(1.3%)
ICSID Additional Facility Arbitration Cases
53(8.9%)
ICSID Additional Facility Conciliation Cases
2(0.3%)
© 2017 by International Centre for Settlement of Investment Disputes.
Content may be reproduced for educational use with acknowledgement. Page | 9
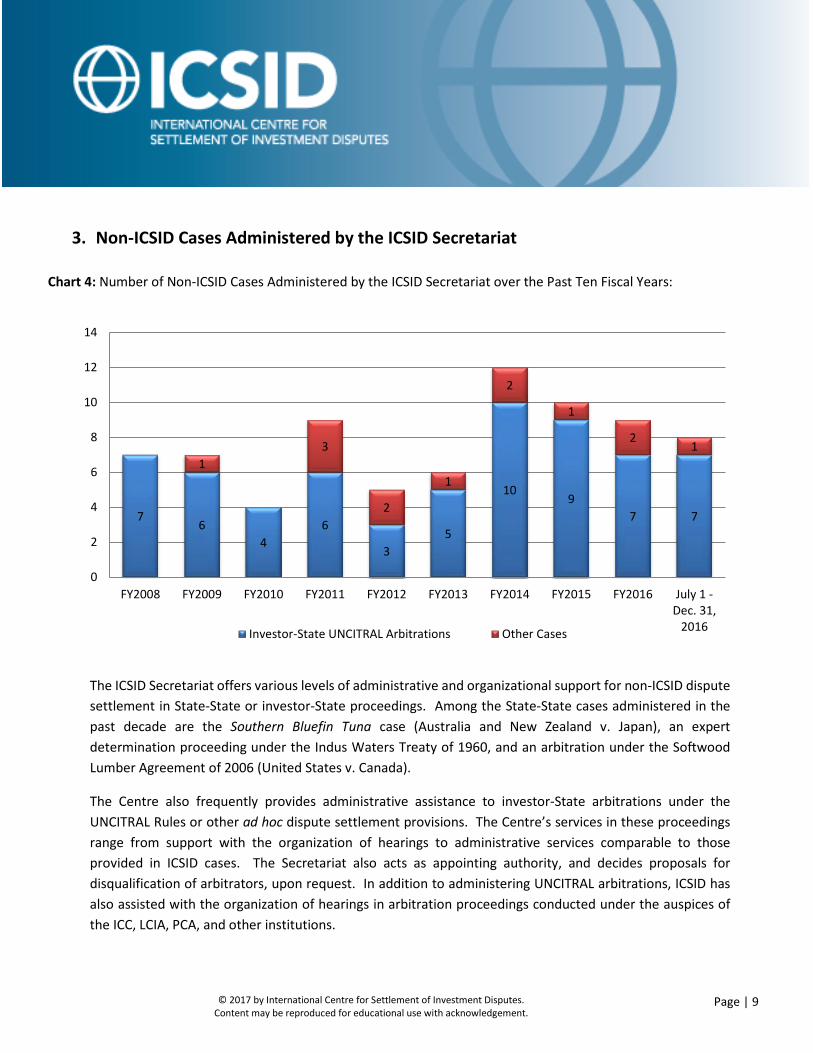
3. Non-ICSID Cases Administered by the ICSID Secretariat
Chart 4: Number of Non-ICSID Cases Administered by the ICSID Secretariat over the Past Ten Fiscal Years:
The ICSID Secretariat offers various levels of administrative and organizational support for non-ICSID dispute settlement in State-State or investor-State proceedings. Among the State-State cases administered in the past decade are the Southern Bluefin Tuna case (Australia and New Zealand v. Japan), an expert determination proceeding under the Indus Waters Treaty of 1960, and an arbitration under the Softwood Lumber Agreement of 2006 (United States v. Canada).
The Centre also frequently provides administrative assistance to investor-State arbitrations under the UNCITRAL Rules or other ad hoc dispute settlement provisions. The Centre’s services in these proceedings range from support with the organization of hearings to administrative services comparable to those provided in ICSID cases. The Secretariat also acts as appointing authority, and decides proposals for disqualification of arbitrators, upon request. In addition to administering UNCITRAL arbitrations, ICSID has also assisted with the organization of hearings in arbitration proceedings conducted under the auspices of the ICC, LCIA, PCA, and other institutions.
76
46
35
109
7 7
13
2
1
2
1
21
0
2
4
6
8
10
12
14
FY2008 FY2009 FY2010 FY2011 FY2012 FY2013 FY2014 FY2015 FY2016 July 1 -Dec. 31,
2016Investor-State UNCITRAL Arbitrations Other Cases

© 2017 by International Centre for Settlement of Investment Disputes.
Content may be reproduced for educational use with acknowledgement. Page | 10
4. Basis of Consent Invoked to Establish ICSID Jurisdiction in Registered ICSID Cases
Chart 5: Basis of Consent Invoked to Establish ICSID Jurisdiction in Cases Registered under the ICSID Convention and Additional Facility Rules:
ASEAN Agreement for the Promotion and Protection of Investments
0.1%
Bilateral Investment Treaty (BIT)
59.8%
Dominican Republic-United States-Central America Free Trade Agreement
(DR-CAFTA)0.7%
Investment Contract between the Investor and
the Host-State16.7%
Investment Law of the Host-State
9.5%
North American Free Trade Agreement
(NAFTA)3.0%
Energy Charter Treaty (ECT)9.5%
Oman-U.S. Free Trade Agreement
(Oman-U.S. FTA)0.1%
Canada-Peru Free Trade Agreement
(Canada-Peru FTA)0.1%
Central America-Panama Free Trade Agreement
0.1%
Colombia-Mexico Free Trade Agreement
(Colombia-Mexico FTA)0.1%
U.S.- Panama Trade Promotion Agreement
(U.S.-Panama TPA)0.2%
Canada - Colombia Free Trade Agreement
(Canada-Colombia FTA)0.1%

© 2017 by International Centre for Settlement of Investment Disputes.
Content may be reproduced for educational use with acknowledgement. Page | 11
5. Geographic Distribution of All ICSID Cases, by State Party Involved
Chart 6: Geographic Distribution of All Cases Registered under the ICSID Convention and Additional Facility Rules, by State Party Involved*:
* The classification of the geographic regions above is based on the World Bank’s regional system, available at http://web.worldbank.org/WBSITE/EXTERNAL/COUNTRIES/0,,pagePK:180619~theSitePK:136917,00.html, and also includes World Bank donor countries.
South America24%
Central America & the Caribbean
6%
North America (Canada, Mexico & U.S.)
5%
Eastern Europe & Central Asia
25%
Western Europe7%
Sub-Saharan Africa15%
Middle East & North Africa10%South & East Asia &
the Pacific8%

© 2017 by International Centre for Settlement of Investment Disputes.
Content may be reproduced for educational use with acknowledgement. Page | 12
6. Distribution of All ICSID Cases by Economic Sector
Chart 7: Distribution of All Cases Registered under the ICSID Convention and Additional Facility Rules, by Economic Sector*:
* This sector classification is based on the World Bank’s sector codes, available at http://siteresources.worldbank.org/PROJECTS/Resources/SectorCodesLists.pdf.
Finance7%
Information & Communication
6%
Agriculture, Fishing & Forestry
4% Oil, Gas & Mining25%
Electric Power & Other Energy
17%
Water, Sanitation & Flood Protection
5%
Construction7%Tourism
4%
Other Industry13%
Transportation9%
Services & Trade3%

© 2017 by International Centre for Settlement of Investment Disputes.
Content may be reproduced for educational use with acknowledgement. Page | 13
7. ICSID Arbitration and Conciliation Proceedings – Outcomes
Chart 8: Arbitration Proceedings under the ICSID Convention and Additional Facility Rules – Outcomes:
Dispute decided by Tribunal
64%(see charts 8a and 8b)
Dispute settled or proceeding otherwise
discontinued36%
(see charts 8a and 8c)

© 2017 by International Centre for Settlement of Investment Disputes.
Content may be reproduced for educational use with acknowledgement. Page | 14
Chart 8a: Arbitration Proceedings under the ICSID Convention and Additional Facility Rules – Tribunal Rulings, Settlement & Discontinuances:
Award deciding that the claims are manifestly without legal merit
0.5%
Award declining jurisdiction
16.1%
Award dismissing all claims18.3%
Award upholding claims in part or in full
29.1%
Proceeding discontinued at the request of both parties
17.3%
Proceeding discontinued at the request of one party
9.2%
Settlement agreement embodied in an award at
parties' request5.4%
Proceeding discontinued at the Initiative of the
Tribunal0.2%
Proceeding discontinued for lack of payment of the
required advances2.9%
Proceeding discontinued for failure of parties to act
1.0%
Dispute decided by Tribunal (64%)
Dispute settled or proceeding otherwise discontinued (36%)

© 2017 by International Centre for Settlement of Investment Disputes.
Content may be reproduced for educational use with acknowledgement. Page | 15
Cart 8b: Disputes Decided by Arbitral Tribunals under the ICSID Convention and Additional Facility Rules – Findings:
* Pursuant to ICSID Arbitration Rule 41(5) and Article 45(6) of the Arbitration (Additional Facility) Rules, as adopted by the ICSID Administrative Council in 2006, a party may, at an early stage of the proceeding, file an objection that a claim is manifestly without merit. If the Tribunal decides that the claims are manifestly without legal merit, it shall render an award to that effect.
Award deciding that the claims are manifestly without legal merit*
1%
Award declining jurisdiction
25%
Award dismissing all claims29%
Award upholding claims in part or in full
45%

© 2017 by International Centre for Settlement of Investment Disputes.
Content may be reproduced for educational use with acknowledgement. Page | 16
Chart 8c: Disputes Settled or Proceedings Otherwise Discontinued under the ICSID Convention and Additional Facility Rules – Basis:
1 ICSID Arbitration Rule 44. No case concluded to date on the basis of Arbitration (Additional Facility) Rule 50. 2 ICSID Arbitration Rule 43(2) and Arbitration (Additional Facility) Rule 49(2). 3 In accordance with Article 44 of the ICSID Convention. 4 ICSID Administrative & Financial Regulation 14(3)(d). 5 ICSID Arbitration Rule 45 and Arbitration (Additional Facility) Rule 51. 6 ICSID Arbitration Rule 43(1) and Arbitration (Additional Facility) Rule 49(1).
Proceeding discontinued at the
request of both parties6
48%
Proceeding discontinued at the
request of one party1
25%
Settlement agreement embodied in an award
at parties' request2
15%
Proceeding discontinued at the Initiative of the
Tribunal31%
Proceeding discontinued for lack of
payment of the required advances4
8%
Proceeding discontinued for failure
of parties to act5
3%

© 2017 by International Centre for Settlement of Investment Disputes.
Content may be reproduced for educational use with acknowledgement. Page | 17
Chart 9: Conciliation Proceedings under the ICSID Convention and Additional Facility Rules – Outcomes:
Chart 10: Conciliation Proceedings under the ICSID Convention and Additional Facility Rules – Commission Reports:
Conciliation Commission Report issued
75%(see chart 10)
Proceeding Discontinued
25%
Report recording failure of the Parties to
reach agreement83%
Report recording agreement of the
Parties17%

© 2017 by International Centre for Settlement of Investment Disputes.
Content may be reproduced for educational use with acknowledgement. Page | 18
8. Annulment Proceedings under the ICSID Convention – Outcomes
Chart 11: Awards Rendered and Outcomes in Annulment Proceedings under the ICSID Convention, by Decade:
49
18
96
124
0 1 0
13
25
0 3 18
40 0 1
5
17
0
20
40
60
80
100
120
140
1971-1980 1981-1990 1991-2000 2001-2010 2011 -
Number of Convention awards rendered Number of decisions rejecting the application for annulment
Number of decisions annulling the award in part or in full Number of annulment proceedings discontinued

© 2017 by International Centre for Settlement of Investment Disputes.
Content may be reproduced for educational use with acknowledgement. Page | 19
9. Arbitrators, Conciliators and ad hoc Committee Members Appointed in ICSID Cases
Chart 12: Arbitrators, Conciliators and ad hoc Committee Members Appointed in Cases Registered under the ICSID Convention and Additional Facility Rules – Distribution of Appointments by Geographic Region*:
* The classification of the geographic regions above is based on the World Bank’s regional system, available at http://web.worldbank.org/WBSITE/EXTERNAL/COUNTRIES/0,,pagePK:180619~theSitePK:136917,00.html, and also includes World Bank donor countries. The chart reflects appointments made to Tribunals and ad hoc Committees constituted until December 31, 2016.
North America (Canada, Mexico & U.S.)
21%
South America11%
Central America & the Caribbean
2%
Middle East & North Africa
4%
Sub-Saharan Africa2%
South & East Asia & the Pacific
11% Eastern Europe &Central Asia
2%
Western Europe47%

© 2017 by International Centre for Settlement of Investment Disputes.
Content may be reproduced for educational use with acknowledgement. Page | 20
Chart 13: Arbitrators, Conciliators and ad hoc Committee Members Appointed in Cases Registered under the ICSID Convention and Additional Facility Rules – Distribution of Appointments by ICSID and by the Parties (or Party-appointed Arbitrators) by Geographic Region*:
* The geographical classification is based on the World Bank’s regions as set forth at http://web.worldbank.org/WBSITE/EXTERNAL/COUNTRIES/0,,pagePK:180619~theSitePK:136917,00.html, and also includes World Bank donor countries. The chart reflects appointments made to Tribunals and ad hoc Committees constituted until December 31, 2016.
69 5828 33 23
91
14
250
353
151
2049
20
131
23
693
0
100
200
300
400
500
600
700
800
North America(Canada, Mexico &
U.S.)
South America Central America &the Caribbean
Middle East &North Africa
Sub-Saharan Africa South & East Asia &the Pacific
Eastern Europe &Central Asia
Western Europe
Appointments by ICSID Appointments by the Parties (or Party-appointed Arbitrators)

Number of Appointments
Chart 14: State of Nationality of Arbitrators, Conciliators and ad hoc Committee Members Appointed in Cases Registered under the ICSID Convention and Additional Facility Rules:
202199
176117
10894
8372
5453
5249
4242
3636
3229
2623
2120
1817
16131313
12121212
11111111
109999999
888
777777
66
55
444444
333333333
22222222222
11111111111111111111111
0 50 100 150 200 250
FranceUnited States of America
United KingdomCanada
SwitzerlandSpain
AustraliaGermany
MexicoItaly
ChileBelgium
NetherlandsNew Zealand
ArgentinaColombia
Egypt, Arab Rep. ofCosta Rica
SwedenFrance/Sweden/Bahrain
BulgariaUnited Kingdom/France
United States of America/SwitzerlandAustria
Canada/New ZealandArgentina/Spain
BrazilSingapore
BangladeshCanada/United Kingdom
FinlandMalaysia
ChinaLebanon/France
MoroccoPhilippines
PakistanDenmark
GreeceGuatemala
Slovak RepublicSwitzerland/Brazil
UruguayVenezuela
Colombia/FranceFrance/Switzerland
Iran, Islamic Rep. of/FranceEcuador
Germany/AustriaPeru
SenegalSomalia
ThailandIndia
Korea, Rep.ofGuyanaNigeriaAlgeria
Australia/IrelandCyprus
Iran, Islamic Rep. ofSwitzerland/Ireland
United States of America/FranceArgentina/United States of America
BarbadosCanada/Lebanon
HondurasIreland/Germany
IsraelJamaica
SerbiaTogo
BeninCzech Republic
France/MauritiusGabonGhanaJordan
LebanonMadagascar
MalawiPortugal
South AfricaAustralia/Germany
Cabo VerdeCameroon
Canada/SwitzerlandCentral African Republic
Chile/United States of AmericaCroatia
DominicaIreland/United States of America
Israel/SwitzerlandJapan
Lebanon/ChileLuxembourg
New Zealand/United KingdomNorway
Pakistan/United States of AmericaParaguaySloveniaSri Lanka
SudanUnited Kingdom/Ghana
United Kingdom/UgandaUnited States of America/Canada
Stat
e of
Nat
iona
lity
of A
ppoi
ntee
© 2
017
by In
tern
atio
nal C
entr
e fo
r Set
tlem
ent o
f Inv
estm
ent D
isput
es.
Cont
ent m
ay b
e re
prod
uced
for e
duca
tiona
l use
with
ack
now
ledg
emen
t. Pa
ge |
21

© 2017 by International Centre for Settlement of Investment Disputes.
Content may be reproduced for educational use with acknowledgement. Page | 22
PART II
CASES REGISTERED AND ADMINISTERED BY ICSID IN 2016

© 2017 by International Centre for Settlement of Investment Disputes.
Content may be reproduced for educational use with acknowledgement. Page | 23
1. New Cases Registered by ICSID in 2016
Chart 1: Number of New Cases Registered under the ICSID Convention and Additional Facility Rules in 2016:
2. Non-ICSID Cases Administered by the ICSID Secretariat in 2016
Chart 2: Number of Non-ICSID Cases Administered by the ICSID Secretariat in 2016:
42
15
0
5
10
15
20
25
30
35
40
45
ICSID Convention Arbitration Cases
ICSID Convention Conciliation Cases
ICSID Additional Facility Arbitration Cases
8
2
0
1
2
3
4
5
6
7
8
9
Investor-State UNCITRAL Arbitrations Other Cases

© 2017 by International Centre for Settlement of Investment Disputes.
Content may be reproduced for educational use with acknowledgement. Page | 24
3. Basis of Consent Invoked to Establish ICSID Jurisdiction in New Cases Registered in 2016
Chart 3: Basis of Consent Invoked to Establish ICSID Jurisdiction in New Cases Registered in 2016 under the ICSID Convention and Additional Facility Rules:
Bilateral Investment Treaty (BIT)57%
Investment Contract between the Investor and
the Host-State4%
Investment Law of the Host-State
9%
North American Free Trade Agreement
(NAFTA)4%
Energy Charter Treaty(ECT)18%
Colombia-Mexico Free Trade Agreement
(Colombia-Mexico FTA)2%
U.S.- Panama Trade Promotion Agreement
(U.S.-Panama TPA)4%
Canada - Colombia Free Trade Agreement
(Canada-Colombia FTA)2%

© 2017 by International Centre for Settlement of Investment Disputes.
Content may be reproduced for educational use with acknowledgement. Page | 25
4. Geographic Distribution of New ICSID Cases Registered in 2016, by State Party Involved
Chart 4: Geographic Distribution of New Cases Registered in 2016 under the ICSID Convention and Additional Facility Rules, by State Party Involved*:
* The classification of the geographic regions above is based on the World Bank’s regional system, available at http://web.worldbank.org/WBSITE/EXTERNAL/COUNTRIES/0,,pagePK:180619~theSitePK:136917,00.html, and also includes World Bank donor countries.
South America17%
Central America & the Caribbean
6%
North America (Canada, Mexico & U.S.)
6%
Eastern Europe &Central Asia
31%
Western Europe15%
Sub-Saharan Africa6%
Middle East & North Africa11%South & East Asia &
the Pacific8%

© 2017 by International Centre for Settlement of Investment Disputes.
Content may be reproduced for educational use with acknowledgement. Page | 26
Chart 5: Geographic Distribution of New Cases Registered in 2016 under the ICSID Convention and Additional Facility Rules, by State Party Involved – Further Details*:
* The classification of the geographic regions above is based on the World Bank’s regional system, available at http://web.worldbank.org/WBSITE/EXTERNAL/COUNTRIES/0,,pagePK:180619~theSitePK:136917,00.html, and also includes World Bank donor countries.
Venezuela, 3
Uruguay, 1
Peru, 1
Colombia, 3
U.S., 1
Mexico, 1
Canada, 1
Panama, 3
Ukraine, 1
Turkmenistan, 1
Serbia, 1
Romania, 1
KrygyzRepublic, 1
Moldova, 1
Lithuania, 1
Latvia, 1
Kazakhstan, 1
Hungary, 1
Croatia, 2
Bulgaria, 1
Bosnia andHerzegovina, 1
Albania, 1
Spain, 4
Italy, 2
Greece, 1
Mauritius, 1
Ghana, 1
Côte d'Ivoire, 1
Oman, 1
Lebanon, 1
Egypt, 3
Sri Lanka, 1
Philippiines, 1
Indonesia, 1
Lao PDR, 1
0
2
4
6
8
10
12
14
16
Western Europe Eastern Europe &Central Asia
Middle East &North Africa
Sub-SaharanAfrica
South America North America(Canada, Mexico
& U.S.)
South & East Asia& the Pacific
Central America& the Caribbean
© 2017 by International Centre for Settlement of Investment Disputes.
Content may be reproduced for educational use with acknowledgement. Page | 27
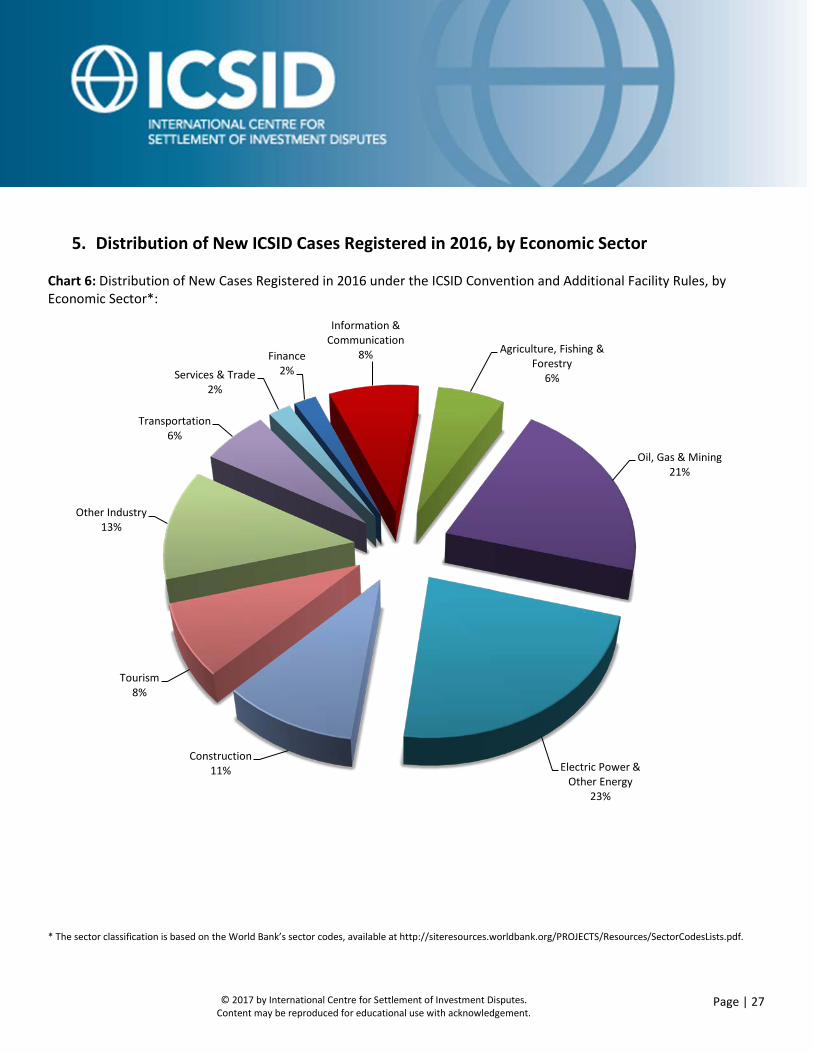
5. Distribution of New ICSID Cases Registered in 2016, by Economic Sector
Chart 6: Distribution of New Cases Registered in 2016 under the ICSID Convention and Additional Facility Rules, by Economic Sector*:
* The sector classification is based on the World Bank’s sector codes, available at http://siteresources.worldbank.org/PROJECTS/Resources/SectorCodesLists.pdf.
Finance2%
Information & Communication
8% Agriculture, Fishing & Forestry
6%
Oil, Gas & Mining21%
Electric Power & Other Energy
23%
Construction11%
Tourism8%
Other Industry13%
Transportation6%
Services & Trade2%

© 2017 by International Centre for Settlement of Investment Disputes.
Content may be reproduced for educational use with acknowledgement. Page | 28
6. ICSID Arbitration Proceedings Concluded in 2016 – Outcomes
Chart 7: Arbitration Proceedings under the ICSID Convention and Additional Facility Rules concluded in 2016 – Outcomes:
Dispute decided by Tribunal
68%(see charts 7a and 7b)
Dispute settled or proceeding otherwise
discontinued32%
(see charts 7a and 7c)

© 2017 by International Centre for Settlement of Investment Disputes.
Content may be reproduced for educational use with acknowledgement. Page | 29
Chart 7a: Disputes Decided by Arbitral Tribunals under the ICSID Convention and Additional Facility Rules in 2016 – Tribunal Rulings, Settlement & Discontinuances:
Award declining jurisdiction
11%
Award dismissing all claims27%
Award upholding claims in part or in full
30%
Proceeding discontinued at the request of both
parties18%
Proceeding discontinued at the request of one
party5%
Settlement agreement embodied in an award at
parties' request5%
Proceeding discontinued for lack of payment of the required advances
2%Proceeding discontinued for failure of parties to
act2%
Dispute decided by Tribunal (68%)
Dispute settled or proceeding otherwise discontinued (32%)

© 2017 by International Centre for Settlement of Investment Disputes.
Content may be reproduced for educational use with acknowledgement. Page | 30
Chart 7b: Disputes Decided by Arbitral Tribunals under the ICSID Convention and Additional Facility Rules in 2016 – Findings:
Award declining jurisdiction
17%
Award dismissing all claims40%
Award upholding claims in part or in full
43%

© 2017 by International Centre for Settlement of Investment Disputes.
Content may be reproduced for educational use with acknowledgement. Page | 31
Chart 7c: Disputes Settled or Proceedings Otherwise Discontinued under the ICSID Convention and Additional Facility Rules in 2016 – Basis:
1 ICSID Arbitration Rule 44. No case concluded on the basis of Arbitration (Additional Facility) Rule 50. 2 ICSID Arbitration Rule 43(2). No case concluded on the basis of Arbitration (Additional Facility) Rule 49(2). 3 ICSID Administrative and Financial Regulations 14(3)(d). 4 ICSID Arbitration Rule 45. No case concluded on the bais of rbitration (Additional Facility) Rule 51. 5 ICSID Arbitration Rule 43(1). No case concluded on the basis of Arbitration (Additional Facility) Rule 49(1).
Proceeding discontinued at the
request of both parties5
57%
Proceeding discontinued at the
request of one party1
15%Settlement agreement embodied in an award
at parties' request2
14%
Proceeding discontinued for lack of
payment of the required advances3
7%
Proceeding discontinued for failure
of parties to act4
7%

© 2017 by International Centre for Settlement of Investment Disputes.
Content may be reproduced for educational use with acknowledgement. Page | 32
7. Arbitrators, Conciliators and ad hoc Committee Members Appointed in ICSID Cases in 2016
Chart 8: Arbitrators, Conciliators and ad hoc Committee Members Appointed in 2016 in Cases Registered under the ICSID Convention and Additional Facility Rules – Distribution of Appointments by Geographic Region*:
* The classification of the geographic regions above is based on the World Bank’s regional system, available at http://web.worldbank.org/WBSITE/EXTERNAL/COUNTRIES/0,,pagePK:180619~theSitePK:136917,00.html, and also includes World Bank donor countries. The chart reflects appointments made to Tribunals and ad hoc Committees constituted in 2016.
North America (Canada, Mexico & U.S.)
18%
South America13%
Central America & the Caribbean
2%
Middle East & North Africa
2%Sub-Saharan Africa
3%
South & East Asia & the Pacific
19%
Eastern Europe &Central Asia
1%
Western Europe42%

© 2017 by International Centre for Settlement of Investment Disputes.
Content may be reproduced for educational use with acknowledgement. Page | 33
Chart 9: Arbitrators, Conciliators and ad hoc Committee Members Appointed in 2016 in Cases Registered under the ICSID Convention and Additional Facility Rules – Distribution of Appointments by ICSID and by the Parties (or Party-appointed Arbitrators) by Geographic Region*:
* The classification of the geographic regions above is based on the World Bank’s regional system, available at http://web.worldbank.org/WBSITE/EXTERNAL/COUNTRIES/0,,pagePK:180619~theSitePK:136917,00.html, and also includes World Bank donor countries. The chart reflects appointments made to Tribunals and ad hoc Committees constituted in 2016.
7
31
21
12
0
11
21
18
21
3
17
2
55
0
10
20
30
40
50
60
North America(Canada, Mexico &
U.S.)
South America Central America &the Caribbean
Middle East &North Africa
Sub-Saharan Africa South & East Asia& the Pacific
Eastern Europe &Central Asia
Western Europe
Appointments by ICSID Appointments by the Parties (or Party-appointed Arbitrators)

© 2017 by International Centre for Settlement of Investment Disputes.
Content may be reproduced for educational use with acknowledgement. Page | 34
Chart 10: State of Nationality of Arbitrators, Conciliators and ad hoc Committee Members Appointed in 2016 in Cases Registered under the ICSID Convention and Additional Facility Rules:
1814
1313
1077
65
433333333
22222222
1111111111111111111
0 5 10 15 20
United KingdomAustralia
FranceUnited States of America
CanadaArgentinaGermany
SpainColombia
ChileBelgium
Canada/New ZealandCosta Rica
France/SwitzerlandIreland/Germany
ItalyMalaysia
United Kingdom/FranceArgentina/United States of America
BulgariaCanada/Lebanon
ChinaFinland
Korea, Rep.ofNew Zealand
SwedenArgentina/Spain
Australia/GermanyAustralia/Ireland
AustriaBangladesh
BrazilEgypt
MexicoNetherlands
New Zealand/United KingdomNigeria
PakistanSingapore
South AfricaSwitzerland
Switzerland/BrazilUnited Kingdom/Uganda
United States of America/SwitzerlandZambia
Number of Appointments
Stat
e of
Nat
iona
lity
of A
ppoi
ntee