The Ichimoku Trader · PDF fileAccording to the Stock Trader’s Almanac, the Dow ......
10
IN THIS ISSUE Sell in May, Buy on ‘Merica Day .............1 Global Market Update.............................2 US Stock Market, VIX Volatility Index, US 30 Year Treasury Bonds, Crude Oil, Germany, China, Greece, Brazil, Saudi Arabia Gold vs. Dollar ...........................................6 July Recap August Seasonal Patterns Sector Analysis.........................................8 Too Cool to Shop for School? Rubber-necking Options........................9 Trading Psychology .................................9 Write the Plan, Trade the Plan The Ichimoku Trader www.ichimokutrade.com © EII Capital Volume 1, No. 4 August 2nd, 2015 Sell in May, Buy on ‘Merica Day! C hances are if you are reading this then you have been around investing media long enough to have heard the addage “Sell in May.” It may then be followed by “and go away,” “come back Labor Day,” or from it’s origins in Old England “do not return until St. Leger’s Day”. You have also no doubt read thorough debunkings of this theory. Anything so widely known and observed surely cannot work consistently, right? According to the Stock Trader’s Almanac, the Dow Jownes Industrial Average has had an average gain of 7.5% during the November through April period and a gain of only 0.3% over the May through October period going back to 1950. Reliance on the addage can work over the long haul for investors with a yearly or deca- cal horizon. But for active traders this does not suit us. How then can we refine our understanding of this cycle and go further to refine our trading strategies within it? Figure 1: TDAmeritrade Weekly chart of SPX A cursory glance at a chart of the last 5 Labor Days confirms that the market does go up from that day over the long term. But what about that volatility with- in the cycle? It looks like we would be taking some Page 1 Email for Information: [email protected] Follow Us On Twitter! @ichimokutrading
Transcript of The Ichimoku Trader · PDF fileAccording to the Stock Trader’s Almanac, the Dow ......

IN THIS ISSUE
Sell in May, Buy on ‘Merica Day.............1
Global Market Update.............................2 US Stock Market, VIX Volatility Index, US 30 Year Treasury Bonds, Crude Oil, Germany, China, Greece, Brazil, Saudi Arabia
Gold vs. Dollar...........................................6 July Recap August Seasonal Patterns
Sector Analysis.........................................8 Too Cool to Shop for School?
Rubber-necking Options........................9
Trading Psychology.................................9 Write the Plan, Trade the Plan
The Ichimoku Traderwww.ichimokutrade.com
© EII Capital
Volume 1, No. 4 August 2nd, 2015
Sell in May, Buy on ‘Merica Day!
Chances are if you are reading this then you have been around investing media long enough to
have heard the addage “Sell in May.” It may then be followed by “and go away,” “come back Labor Day,” or from it’s origins in Old England “do not return until St. Leger’s Day”. You have also no doubt read thorough debunkings of this theory. Anything so widely known and observed surely cannot work consistently, right?
According to the Stock Trader’s Almanac, the Dow Jownes Industrial Average has had an average gain of 7.5% during the November through April period and a gain of only 0.3% over the May through October period going back to 1950. Reliance on the addage can work over the long haul for investors with a yearly or deca-cal horizon. But for active traders this does not suit us. How then can we refine our understanding of this cycle and go further to refine our trading strategies within it?
Figure 1: TDAmeritrade Weekly chart of SPX
A cursory glance at a chart of the last 5 Labor Days confirms that the market does go up from that day over the long term. But what about that volatility with-in the cycle? It looks like we would be taking some
Page 1
Email for Information:[email protected]
Follow Us On Twitter!@ichimokutrading

Page 2
serious drawdowns as we waited patiently for history to repeat itself. I’m not satisfied with that.
I propose a new addage: “Markets Closed Labor Day can’t trade anyway.” So we are going to need to find our opportunities outside the date itself. Let’s look at the numbers for the days around it.
Had we bought the SPX at the close of the day af-ter Labor Day we would have endured the following drawdowns:
2005: -5.36% 2010: no drawdown2006: -1.70% 2011: -7.74%2007: -3.35% 2012: -4.39%
2008: -47.83% 2013: no drawdown2009: -0.61% 2014: -9.07%
In nearly every year there is a significant drawdown following Labor day before the market actually turns up for the rest of the year. The only exceptions have happened within stellar bullish years which would not be an apt description of 2015’s performance thus far. On the flip side, if we had a drawdown then there must have been a run up preceeding Labor Day. When did the actual summer turn happen in these years. The lowest point of the summer (from end of May when we went away) to the open of the day after Labor Day:
7/7/05: 2.91% 7/1/10: 9.06%6/14/06: 7.56% 8/9/11: 6.58%8/16/07: 7.57% 6/4/12: 11.02%7/15/08: 7.32% 6/24/13: 5.09%7/8/09: 17.20% 8/7/14: 5.20%
A lot of money is being left on the table during the summer. It almost centers around the middle of sum-mer, July 4th. ‘Merica, yea! There should be plenty of opportunities in either direction no matter what phase of the yearly cycle. I would recommend doing more in depth seasonal analysis before crafting your own “Sell in May, Buy on America Day, Sell arbitrari-ly post Labor Day” strategy. But what you can do is be searching for opportunities to get into the year’s second half rally during late summer and take some profit and/or re-enter on the way up.
-Wes Bennett
Global Market Update
In this section, we will analyze some of the various Global markets. There is no way, we can cover all of
them in a newsletter. From the global analysis, most markets are undergoing major pull backs or at the critical support levels now.
US Stock Market
For the US Stock Market, we will analyze various in-struments to give us a “complete” picture. The first in-strument we will analyze is the E-Mini SP500 Futures. Figure 1 shows the weekly Ichimoku chart for E-mini SP500 futures. In the last newsletter, we were at the major support of 2047.46. This support held. In July, not only did we hold the support but we also broke the resistance at 2096.34. The market continues to be in a bullish consolidation pattern without any ma-jor pull backs. The consolidation pattern is between 2047.46 and 2125.12. The last time we closed below the major green line support was October of 2014. Furthermore, there is a bullish timing influence until August 17.
Figure 1: TDAmeritrade Ichimoku Weekly chart of E-Mini SP500 Futures
Figure 2 shows the Daily chart of the E-Mini SP500 futures. In Ichimoku, the sentiment is controlled on where price is located in regards to the cloud. Since the weekly time frame is in a big consolidation pat-tern, price is swinging back and forth with the cloud. One thing to note, the last retest of 2125.12 created a lower pivot high then the May pivot high. We also have some bearish timing elements until Aug 9.

Page 3
Figure 2: TDAmeritrade Ichimoku Daily chart of E-Mini SP500 Futures
VIX Volatility Index
Figure 3: TDAmeritrade Ichimoku Weekly chart of $VIX Futures
Figure 3 shows the CBOE Market Volatility Index. It has an inverse relationship with the US Stock market. If the market goes up, the $VIX goes down and vice versa. We have using the $VIX in conjunction with the E-mini SP500 to give us early indication on market direction.
Since the beginning of this year, we have been posting the $VIX chart on twitter and determining the mar-ket direction on a weekly basis for day-trading/swing trading. 3 levels have been marked on the chart: 20.73, 15.89, and 11.98. In the newsletter, we talked about how the VIX broke the resistance of 15.98 and was trying to get to 20.73. Price did not reach 20.73 exactly. It got to 20.05 and then reversed all the way back down to the support of 11.98. This is definitely interesting price action because we didn’t reach the major resistance without retesting the major support. This is still us the US stock is still very strong bullish. Normally, we will say the VIX will bounce off this sup-
port to try to retest the resistance but there are signs that maybe this support may get broken. As a result, we will “play” it cautious this time around. Therefore, we will be looking for both bullish and bearish pull back positions only (low risk) with a very conservative rule set.
30 Year Treasury Bonds Futures
May 2014, the 30 Year Treasury Bond futures entered a long term bullish trend (Figure 4). In the last 2 months, the bond futures have been going through a major pull back to the support of 148 24/32. The support was broken last week that means the bullish momentum is over and the probability of retesting the high is low. The pullback was too severe. This is the statement from the last newsletter. Price ac-tion around the 148 23/32 has been interesting. We broke it for one week and now we held it. Therefore, the 1 week we broke it may have been a “fluke” but we won’t know that until we see what happens around the 156 22/32 resistance and 151 19/32. We reached this resistance and bounced off it. We now have to wait and see what will happen at this resistance lev-el. Will it hold it and go down to the support of 151 19/32 or break it. August should reveal a lot.
Figure 4: Tradestation Ichimoku Weekly chart 30 Year Treasury Bonds Futures
Crude Oil
Crude Oil is a very “hot” topic for the last couple of months. As a result, we will analyze this commodity future. A lot of people analyze Crude Oil to forecast other markets. August 2014, Crude started the jour-ney of a major bearish trend. This continued until March of 2015. After this time, it has been pulling

back. No major pull back has yet to occur. However, in the last newsletter, crude oil was at a major support which would decide if the weekly was going to retest the low or it was going to hold it to go higher. Figure 6 shows the weekly chart for the unadjusted Crude Oil contract. Price broke the support and is trying to retest the lows now.
Figure 5: Tradestation Ichimoku Daily chart of NY-MEX Crude Oil Futures
Figure 6: Tradestation Ichimoku Weekly chart of NYMEX Crude Oil Futures
Germany
Figure 7 shows the weekly Ichimoku chart for the German Stock Market Index. Price is consolidating between 10809.00 and 11810.00. The sentiment is still bullish but price has to break the resistance soon otherwise the probabilities will increase for it to break the support. The more that price consolidates, the closer the momentum is getting from shifting from bullish to bearish. There is a bullish timing element until September.
Figure 7: Esignal Ichimoku Weekly chart of German DAX Stock Index
China
Figure 8 shows the Daily Ichimoku chart for the Chi-na Stock Index. The stock market entered a bullish trend in July 2014. It is finally going through its first major pull back on the daily time frame. The sup-port at 4068 needed to hold for the major pull back. This week the support was broken and now the bull-ish trend is officially over. The market can now enter a major consolidation or a bearish trend long term. We have to wait for the next pull back to determine what is going to happen. Currently, we are ranging between 4043 and 3677.
Figure 8: Esignal Ichimoku Daily chart of China Stock Market
Figure 9 shows the Weekly Ichimoku chart for the Chi-na Stock Index. The weekly is still showing the major bullish trend but now is indicating it may go through its first major pull back.
Page 4
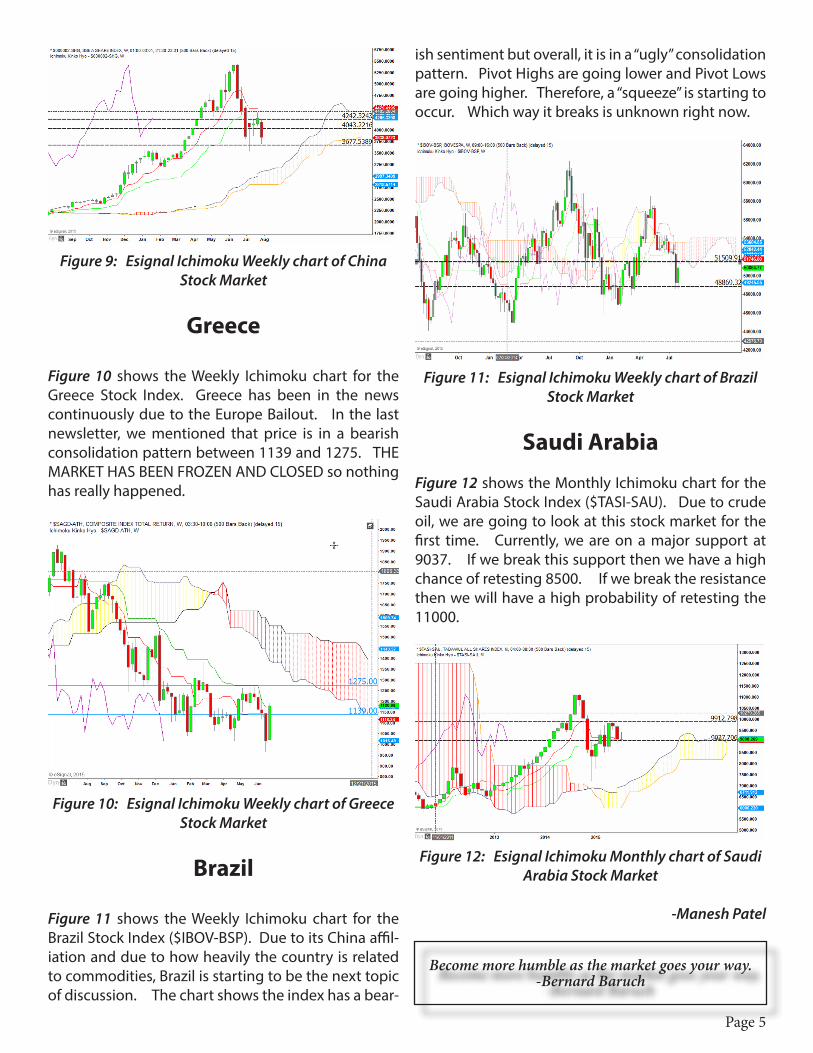
Figure 9: Esignal Ichimoku Weekly chart of China Stock Market
Greece
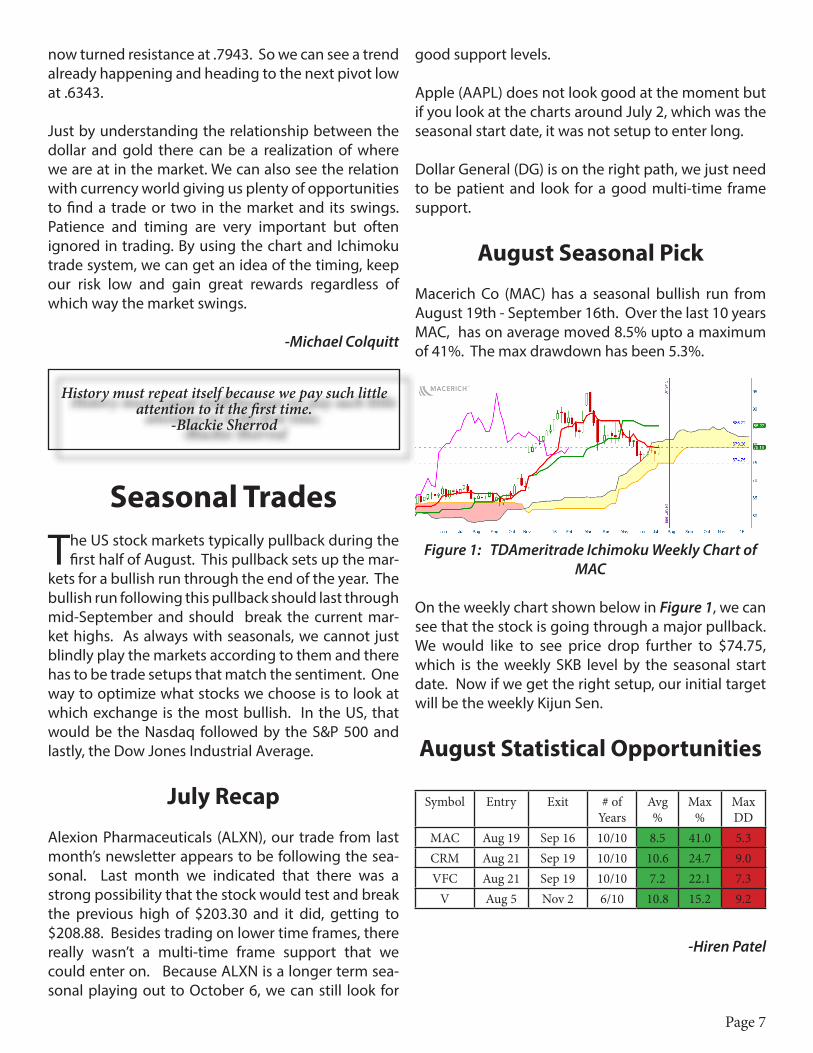
Figure 10 shows the Weekly Ichimoku chart for the Greece Stock Index. Greece has been in the news continuously due to the Europe Bailout. In the last newsletter, we mentioned that price is in a bearish consolidation pattern between 1139 and 1275. THE MARKET HAS BEEN FROZEN AND CLOSED so nothing has really happened.
Figure 10: Esignal Ichimoku Weekly chart of Greece Stock Market
Brazil
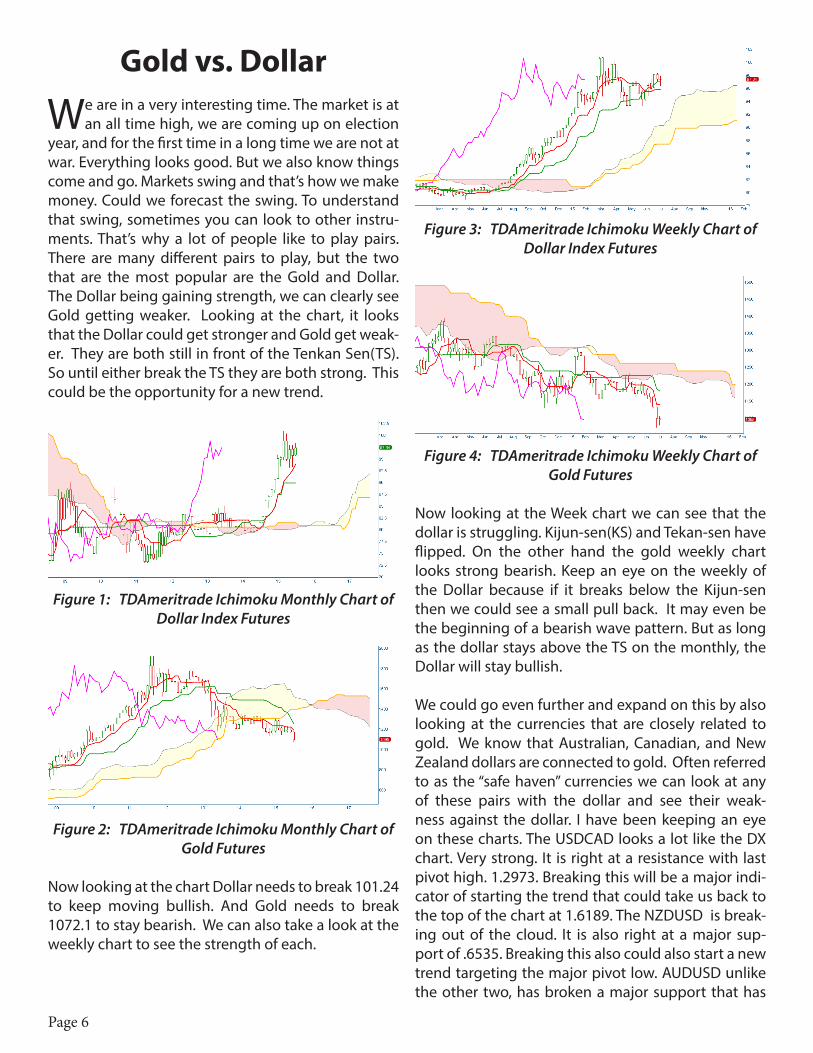
Figure 11 shows the Weekly Ichimoku chart for the Brazil Stock Index ($IBOV-BSP). Due to its China affil-iation and due to how heavily the country is related to commodities, Brazil is starting to be the next topic of discussion. The chart shows the index has a bear-
ish sentiment but overall, it is in a “ugly” consolidation pattern. Pivot Highs are going lower and Pivot Lows are going higher. Therefore, a “squeeze” is starting to occur. Which way it breaks is unknown right now.
Figure 11: Esignal Ichimoku Weekly chart of Brazil Stock Market
Saudi Arabia
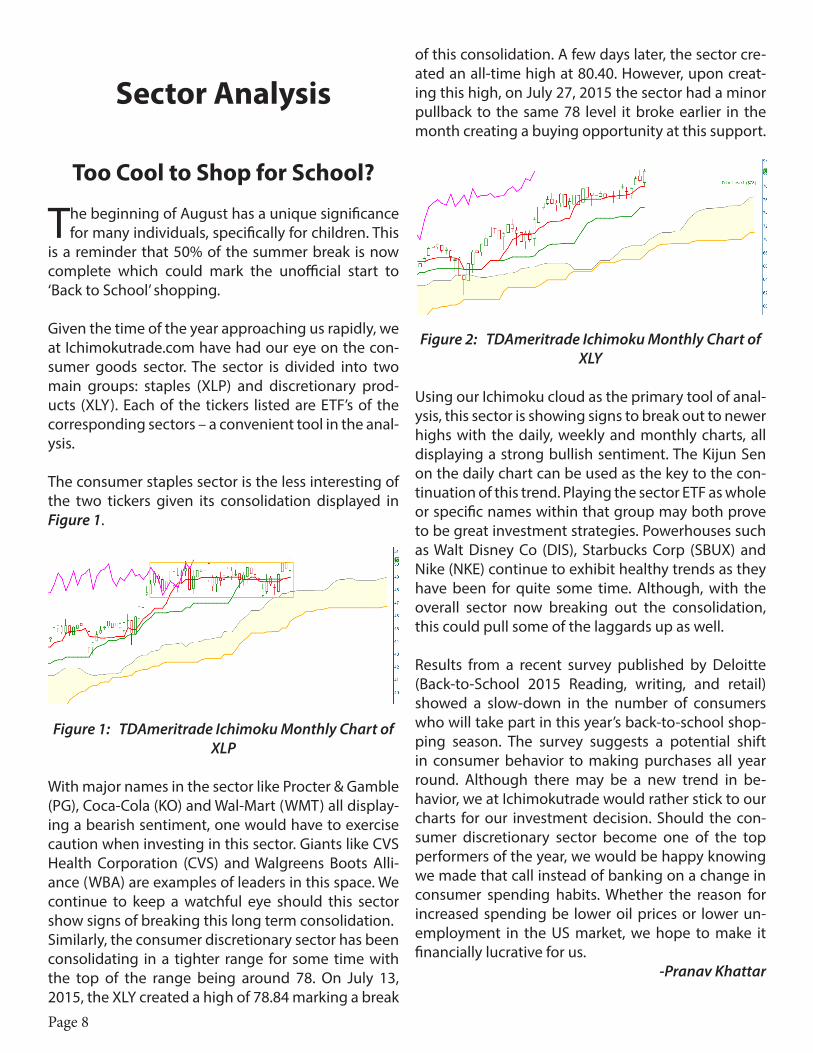
Figure 12 shows the Monthly Ichimoku chart for the Saudi Arabia Stock Index ($TASI-SAU). Due to crude oil, we are going to look at this stock market for the first time. Currently, we are on a major support at 9037. If we break this support then we have a high chance of retesting 8500. If we break the resistance then we will have a high probability of retesting the 11000.
Figure 12: Esignal Ichimoku Monthly chart of Saudi Arabia Stock Market
-Manesh Patel
Become more humble as the market goes your way.
-Bernard Baruch
Page 5
Page 6
Gold vs. Dollar
We are in a very interesting time. The market is at an all time high, we are coming up on election
year, and for the first time in a long time we are not at war. Everything looks good. But we also know things come and go. Markets swing and that’s how we make money. Could we forecast the swing. To understand that swing, sometimes you can look to other instru-ments. That’s why a lot of people like to play pairs. There are many different pairs to play, but the two that are the most popular are the Gold and Dollar. The Dollar being gaining strength, we can clearly see Gold getting weaker. Looking at the chart, it looks that the Dollar could get stronger and Gold get weak-er. They are both still in front of the Tenkan Sen(TS). So until either break the TS they are both strong. This could be the opportunity for a new trend.
Figure 1: TDAmeritrade Ichimoku Monthly Chart of Dollar Index Futures
Figure 2: TDAmeritrade Ichimoku Monthly Chart of Gold Futures
Now looking at the chart Dollar needs to break 101.24 to keep moving bullish. And Gold needs to break 1072.1 to stay bearish. We can also take a look at the weekly chart to see the strength of each.
Figure 3: TDAmeritrade Ichimoku Weekly Chart of Dollar Index Futures
Figure 4: TDAmeritrade Ichimoku Weekly Chart of Gold Futures
Now looking at the Week chart we can see that the dollar is struggling. Kijun-sen(KS) and Tekan-sen have flipped. On the other hand the gold weekly chart looks strong bearish. Keep an eye on the weekly of the Dollar because if it breaks below the Kijun-sen then we could see a small pull back. It may even be the beginning of a bearish wave pattern. But as long as the dollar stays above the TS on the monthly, the Dollar will stay bullish.
We could go even further and expand on this by also looking at the currencies that are closely related to gold. We know that Australian, Canadian, and New Zealand dollars are connected to gold. Often referred to as the “safe haven” currencies we can look at any of these pairs with the dollar and see their weak-ness against the dollar. I have been keeping an eye on these charts. The USDCAD looks a lot like the DX chart. Very strong. It is right at a resistance with last pivot high. 1.2973. Breaking this will be a major indi-cator of starting the trend that could take us back to the top of the chart at 1.6189. The NZDUSD is break-ing out of the cloud. It is also right at a major sup-port of .6535. Breaking this also could also start a new trend targeting the major pivot low. AUDUSD unlike the other two, has broken a major support that has
Page 7
now turned resistance at .7943. So we can see a trend already happening and heading to the next pivot low at .6343.
Just by understanding the relationship between the dollar and gold there can be a realization of where we are at in the market. We can also see the relation with currency world giving us plenty of opportunities to find a trade or two in the market and its swings. Patience and timing are very important but often ignored in trading. By using the chart and Ichimoku trade system, we can get an idea of the timing, keep our risk low and gain great rewards regardless of which way the market swings.
-Michael Colquitt
History must repeat itself because we pay such little
attention to it the first time.-Blackie Sherrod
Seasonal Trades
The US stock markets typically pullback during the first half of August. This pullback sets up the mar-
kets for a bullish run through the end of the year. The bullish run following this pullback should last through mid-September and should break the current mar-ket highs. As always with seasonals, we cannot just blindly play the markets according to them and there has to be trade setups that match the sentiment. One way to optimize what stocks we choose is to look at which exchange is the most bullish. In the US, that would be the Nasdaq followed by the S&P 500 and lastly, the Dow Jones Industrial Average.
July Recap
Alexion Pharmaceuticals (ALXN), our trade from last month’s newsletter appears to be following the sea-sonal. Last month we indicated that there was a strong possibility that the stock would test and break the previous high of $203.30 and it did, getting to $208.88. Besides trading on lower time frames, there really wasn’t a multi-time frame support that we could enter on. Because ALXN is a longer term sea-sonal playing out to October 6, we can still look for
good support levels.
Apple (AAPL) does not look good at the moment but if you look at the charts around July 2, which was the seasonal start date, it was not setup to enter long.
Dollar General (DG) is on the right path, we just need to be patient and look for a good multi-time frame support.
August Seasonal Pick
Macerich Co (MAC) has a seasonal bullish run from August 19th - September 16th. Over the last 10 years MAC, has on average moved 8.5% upto a maximum of 41%. The max drawdown has been 5.3%.
Figure 1: TDAmeritrade Ichimoku Weekly Chart of MAC
On the weekly chart shown below in Figure 1, we can see that the stock is going through a major pullback. We would like to see price drop further to $74.75, which is the weekly SKB level by the seasonal start date. Now if we get the right setup, our initial target will be the weekly Kijun Sen.
August Statistical Opportunities
Symbol Entry Exit # of Years
Avg %
Max %
Max DD
MAC Aug 19 Sep 16 10/10 8.5 41.0 5.3CRM Aug 21 Sep 19 10/10 10.6 24.7 9.0VFC Aug 21 Sep 19 10/10 7.2 22.1 7.3
V Aug 5 Nov 2 6/10 10.8 15.2 9.2
-Hiren Patel
Sector Analysis
Too Cool to Shop for School?
The beginning of August has a unique significance for many individuals, specifically for children. This
is a reminder that 50% of the summer break is now complete which could mark the unofficial start to ‘Back to School’ shopping.
Given the time of the year approaching us rapidly, we at Ichimokutrade.com have had our eye on the con-sumer goods sector. The sector is divided into two main groups: staples (XLP) and discretionary prod-ucts (XLY). Each of the tickers listed are ETF’s of the corresponding sectors – a convenient tool in the anal-ysis. The consumer staples sector is the less interesting of the two tickers given its consolidation displayed in Figure 1.
Figure 1: TDAmeritrade Ichimoku Monthly Chart of XLP
With major names in the sector like Procter & Gamble (PG), Coca-Cola (KO) and Wal-Mart (WMT) all display-ing a bearish sentiment, one would have to exercise caution when investing in this sector. Giants like CVS Health Corporation (CVS) and Walgreens Boots Alli-ance (WBA) are examples of leaders in this space. We continue to keep a watchful eye should this sector show signs of breaking this long term consolidation.Similarly, the consumer discretionary sector has been consolidating in a tighter range for some time with the top of the range being around 78. On July 13, 2015, the XLY created a high of 78.84 marking a break
of this consolidation. A few days later, the sector cre-ated an all-time high at 80.40. However, upon creat-ing this high, on July 27, 2015 the sector had a minor pullback to the same 78 level it broke earlier in the month creating a buying opportunity at this support.
Figure 2: TDAmeritrade Ichimoku Monthly Chart of XLY
Using our Ichimoku cloud as the primary tool of anal-ysis, this sector is showing signs to break out to newer highs with the daily, weekly and monthly charts, all displaying a strong bullish sentiment. The Kijun Sen on the daily chart can be used as the key to the con-tinuation of this trend. Playing the sector ETF as whole or specific names within that group may both prove to be great investment strategies. Powerhouses such as Walt Disney Co (DIS), Starbucks Corp (SBUX) and Nike (NKE) continue to exhibit healthy trends as they have been for quite some time. Although, with the overall sector now breaking out the consolidation, this could pull some of the laggards up as well.
Results from a recent survey published by Deloitte (Back-to-School 2015 Reading, writing, and retail) showed a slow-down in the number of consumers who will take part in this year’s back-to-school shop-ping season. The survey suggests a potential shift in consumer behavior to making purchases all year round. Although there may be a new trend in be-havior, we at Ichimokutrade would rather stick to our charts for our investment decision. Should the con-sumer discretionary sector become one of the top performers of the year, we would be happy knowing we made that call instead of banking on a change in consumer spending habits. Whether the reason for increased spending be lower oil prices or lower un-employment in the US market, we hope to make it financially lucrative for us.
-Pranav Khattar
Page 8

Page 9
Rubber-neckingOptions
One of the key things to study and appreciate about Options is managed risk. Ideally Options
allow traders to hedge their exposure and speculate on a stock’s movement without actually owning the equity. However, many traders just focus on selling premium if the Volatility of the Market or Instrument is “high” or “low.” They sell naked hoping to pocket quick premium or employ complex strategies such as Iron Condors, Straddles, and Butterflies. Selling Options, or “writing calls and puts” is an integral role for traders to take in the financial derivatives markets. Having someone on either side of the trade makes the market work. However, it is not a job to which I am applying unless I have guarantees.
A twisted little hobby of mine is to go through the prior trading day’s options statistics after a massive surprise overnight move in a stock. I look at the dif-ferent trades executed and the strategies they were part taken in. By analyzing a duplicate trade in a risk simulation I can see where someone thought they were going to make a quick buck but instead proba-bly got wiped out.
I recall looking through options for MNST the morn-ing after Coca-Cola announced a major stake. It was the Thursday prior to option expiry. Some poor(er) trader on the sell side took 10 cents of premium on at least 20 of the August 73 Calls. They probably thought “all I have to do is wait 24 hours til expiration and I pocket an easy $200!” When MNST gapped on open to 92.44 the delta move plus volatility shot that option up over 23.00. The selling trader was looking at a $46,000 loss!
Last week AMZN announced earnings. Someone within the last 5 minutes of the day before earnings took a straddle where the sold both a Call and a Put. They sold August Calls and Puts just at the edge of the Market Maker’s standard deviation. On earnings AMZN did the “improbable” and left them owing someone a good bit of delta.
So why do I endulge in this? It’s not that I am mali-
ciously watching other traders get destroyed. I look at worst case scenarios that others face to remind my-self never to be put in one by selling options without a hedge. The idea of high win percentage strategies is enticing but they always come with high if not un-limited risk. Painful as they may be, diligently play-ing lower win rate strategies by only buying Calls and Puts with fixed risk is the safest way to gradually and consistently grow your options portfolio.
-Wes Bennett
The test of success is not what you do when you are
on top. Success is how high you bounce when you hit bottom.
-General George S. Patton, Jr.
Trading Psychology
“Write the Plan, Trade the Plan”
How many times have you gone to work with the idea of completing a particular task but never
completed it at the end of the day?
How many times have you decided not to trade a par-ticular instrument but you continue to do it?
How many times have you decided to optimize your trading system but have not had the time to do so?
How many times have you stayed in a trade even though price got to your stop?
Majority of people will say “many times” to all these questions. Why? Distraction is the answer. The hu-man being has a tendency of getting distracted every easily. We know what we have to do but something in life typically distracts us. A one second distraction is enough for the event that should have occurred to not occur.
If you look all the leaders in the world, you will recog-nize that all of them have one trait in common; they execute what they wanted to do. No distractions will

Disclaimer. The Ichimoku Trader newsletter contains or may contain references to other companies. E.I.I Capital Group makes no representations, warranties or en-dorsements whatever about any other companies , or any products or services of those other companies, even if the products or services of those other companies or their Web sites are described or integrated with E.I.I Capital Group products or services. You use this newsletter and all E.I.I. Capital Group (and affiliated) products and services at your own risk. In no event shall E.I.I. Capital Group be liable for any special, incidental, indirect or consequential damages of any kind, or any financial losses or damages whatever, including, without limitation, those resulting from loss whether or not we have been advised of the possibility of such damages, and regardless of the theory of liability. This newsletter could, and likely does, include some technical and other inaccuracies and errors. Past performance, whether actual or indicated by historical tests of strategies, is no guarantee of future performance or success. There is a possibility that you may sustain a loss equal to or greater than your entire investment regardless of which asset class you trade (equities, options futures or forex); therefore, you should not invest or risk money that you cannot afford to lose. U.S. Government Required Disclaimer - Commodity Futures Trading Commission. Futures and options trading has large potential rewards, but also large potential risk. You must be aware of the risks and be willing to accept them in order to invest in the futures and options markets. Don’t trade with money you can’t afford to lose. This website is neither a solicitation nor an offer to Buy/Sell futures or options. No representation is being made that any account will or is likely to achieve profits or losses similar to those discussed on this website. The past performance of any trading system or methodology is not necessarily indicative of future results. CFTC RULE 4.41 - HYPOTHETICAL OR SIMULATED PERFORMANCE RESULTS HAVE CERTAIN LIMITATIONS. UNLIKE AN ACTUAL PERFORMANCE RECORD, SIMULATED RESULTS DO NOT REPRESENT ACTUAL TRADING. ALSO, SINCE THE TRADES HAVE NOT BEEN EXECUTED, THE RESULTS MAY HAVE UNDER-OR-OVER COMPENSATED FOR THE IMPACT, IF ANY, OF CERTAIN MARKET FACTORS, SUCH AS LACK OF LIQUIDITY, SIMULATED TRADING PROGRAMS IN GENERAL ARE ALSO SUBJECT TO THE FACT THAT THEY ARE DESIGNED WITH THE BENEFIT OF HINDSIGHT. NO REPRESENTATION IS BEING MADE THAT ANY ACCOUNT WILL OR IS LIKELY TO ACHIEVE PROFIT OR LOSSES SIMILAR TO THOSE SHOWN. Testimonials appearing on this site are actually received via email submission. They are individual experiences, reflecting real life experiences of those who have used our products and/or services in some way or other. However, they are individual results and results do vary. We do not claim that they are typical results that consumers will generally achieve. The testimonials are not necessarily representative of all of those who will use our products and/or services. The testimonials displayed are given verbatim except for correction of grammatical or typing errors. Some have been shortened, meaning; not the whole message received by the testimony writer is displayed, when it seemed lengthy or the testimony in its entirety seemed irrelevant for the general public.
stop them. A perfect example will be the famous basketball player Michael Jordan. He was told in high school that he would never be able to play bas-ketball. Years later, he a 5 time MVP, etc.
We have now recognized the problem and also rec-ognized why we need to resolve it. The next step is what can we do to resolve it?
Two weeks ago, I was driving to a casino in Cherokee, NC with a very good friend of mine John. My friend is a very active person and has an amazing drive. He is one of those people that can keep on running on a treadmill for hours and then still run a marathon. On the drive, he was telling me about how he is working out with another guy. The guy is not in shape but is eager to get healthy. One of the suggestions John made to his friend was to write what he was going to do in the workout for that day on a piece of paper before he got to the gym. Once he was at the gym, all he has to do is focus on completely the plan. This
is the answer!
In the morning before you leave your house, take a piece of paper and write what your goal for trading is going to be today and how you are going to execute it step by step. Once you get to your trading ma-chine, read the piece of paper and start to follow the plan and execute. At the top of each hour, review the piece of paper to remind yourself of the daily tasks/goals. Do this until all the items on the piece of pa-per have been conquered! Don’t leave until they are finished.
Once all the tasks are finished, put a smiley face on the piece of paper and put it in an envelope for stor-age. The day is finished with you achieving your dai-ly goals and not getting distracted. You started the morning positive and you end the day positive. Try these steps and watch what will happen! Success will only be one step away!
-Manesh Patel
Thank You for your time! Please look forward to our next newsletter September 6th, 2015. To subscribe
email request to: [email protected]
Page 10