The Hyperglobalization of Trade and Its Future
76
The Hyperglobalization of Trade and Its Future Arvind Subramanian and Martin Kessler Abstract The open, rules-based trading system has delivered immense benefits—for the world, for individual countries, and for average citizens in these countries. It can continue to do so, helping today’s low-income countries make the transition to middle-income status. Three challenges must be met to preserve this system. Rich countries must sustain the social consensus in favor of open markets and globalization at a time of considerable economic uncertainty and weakness; China and other middle-income countries must remain open; and mega-regionalism must be prevented from leading to discrimination and trade conflicts. Collective action should help strengthen the institutional underpinnings of globalization. The world should move beyond the Doha Round dead to more meaningful multilateral negotiations to address emerging challenges, including possible threats from new mega-regional agreements. The rising powers, especially China, will have a key role to play in resuscitating multilateralism. Key words: Hyperglobalization, trading system, mega-regionalism, mega-trader, China, criss-crossing globalization, foreign direct investment WORKING PAPER 3 JUNE 2013 Global Citizen Foundation Phone: +41 (0) 225 18 0265 e-mail: [email protected]
-
Upload
maffer-velasco -
Category
Documents
-
view
8 -
download
2
Transcript of The Hyperglobalization of Trade and Its Future
The Hyperglobalization of
Trade and Its Future
Arvind Subramanian and Martin Kessler
Abstract
The open, rules-based trading system has delivered immense benefits—for the world, for individual
countries, and for average citizens in these countries. It can continue to do so, helping today’s low-income
countries make the transition to middle-income status. Three challenges must be met to preserve this
system. Rich countries must sustain the social consensus in favor of open markets and globalization at a
time of considerable economic uncertainty and weakness; China and other middle-income countries must
remain open; and mega-regionalism must be prevented from leading to discrimination and trade conflicts.
Collective action should help strengthen the institutional underpinnings of globalization. The world
should move beyond the Doha Round dead to more meaningful multilateral negotiations to address
emerging challenges, including possible threats from new mega-regional agreements. The rising powers,
especially China, will have a key role to play in resuscitating multilateralism.
Key words: Hyperglobalization, trading system, mega-regionalism, mega-trader, China,
criss-crossing globalization, foreign direct investment
WORKING PAPER 3 JUNE 2013 Global Citizen Foundation
Phone: +41 (0) 225 18 0265
e-mail: [email protected]
2
The Hyperglobalization of Trade and Its Future
Arvind Subramanian and Martin Kessler
1. Introduction
The post–World War II period witnessed a rapid rise in trade between nations, reminiscent of the
integration that occurred before World War 1 (see WTO forthcoming; Krugman 1995). This
evolution was facilitated partly by reductions in policy barriers—first in the advanced
economies, under the auspices of the then General Agreement on Trade and Tariffs (GATT), and
later in developing countries, through unilateral liberalization actions or under programs with the
International Monetary Fund (IMF) and World Bank. Trade was also facilitated by technological
advances, especially in shipping and transportation costs. By the end of the 1980s and early
1990s, global trade integration had reverted to levels last seen before World War I.
The postwar period also saw a number of growth successes, beginning with Japan (and Europe),
followed by the East Asian tigers and then China and more recently by India. Along the way, a
few countries in Sub-Saharan Africa and Latin America also succeeded in raising their standards
of living.
In the late 1990s, however, a striking change occurred in the economic fortunes of countries:
economic growth took off across the world, a phenomenon that is best described as convergence
with a vengeance. Until the late 1990s, only about 30 percent of the developing world (21 of 72
countries) was catching up with the economic frontier (the United States), and the rate of catch-
Arvind Subramanian is a senior fellow at the Peterson Institute for International Economics and the
Center for Global Development. Martin Kessler is a research analyst at the Peterson Institute. The authors
are grateful to the project’s participants, including Richard Baldwin, Nancy Birdsall, Kemal Derviş,
Shahrokh Fardoust, Theophilos Priovolos, Dani Rodrik, and Andrew Steer, and their colleagues at the
Peterson Institute for International Economics and the Center for Global Development for helpful
discussions. This paper draws on work with Aaditya Mattoo and on Subramanian (2011). This paper was
prepared for the Towards a Better Global Economy Project funded by the Global Citizen Foundation. The
authors alone are responsible for its content. Comments or questions should be directed to
3
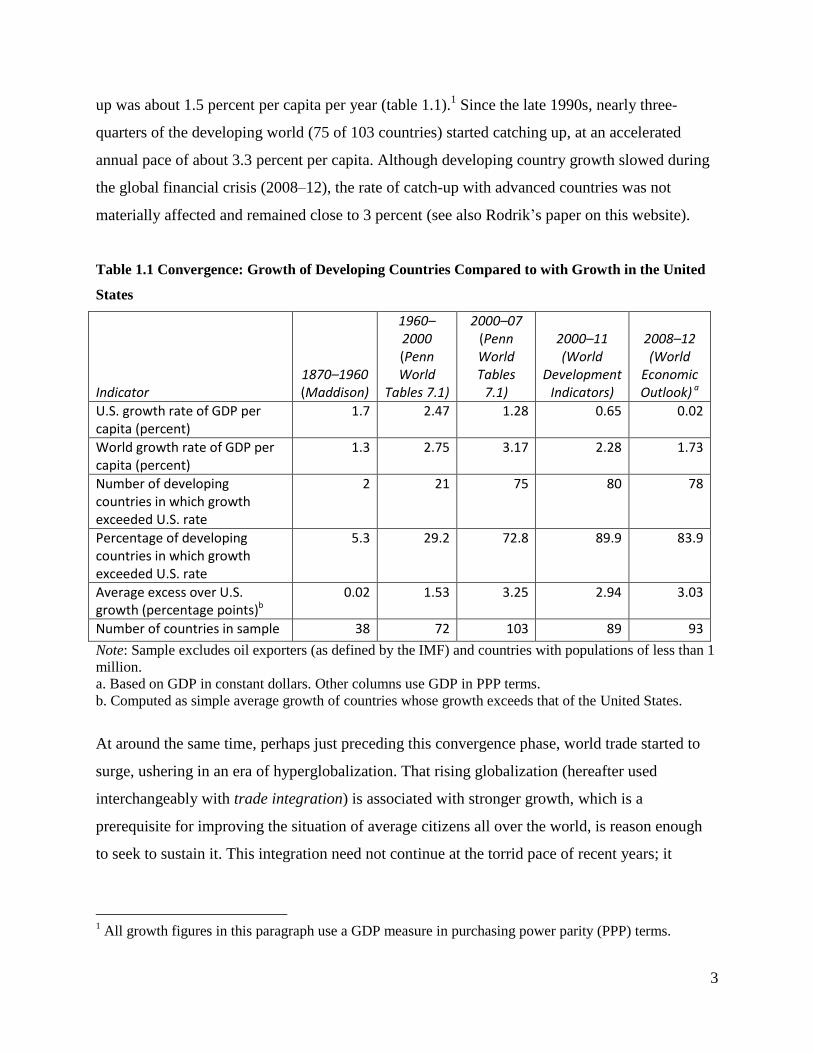
up was about 1.5 percent per capita per year (table 1.1).1 Since the late 1990s, nearly three-
quarters of the developing world (75 of 103 countries) started catching up, at an accelerated
annual pace of about 3.3 percent per capita. Although developing country growth slowed during
the global financial crisis (2008–12), the rate of catch-up with advanced countries was not
materially affected and remained close to 3 percent (see also Rodrik’s paper on this website).
Table 1.1 Convergence: Growth of Developing Countries Compared to with Growth in the United
States
Indicator 1870–1960 (Maddison)
1960–2000 (Penn World
Tables 7.1)
2000–07 (Penn World Tables
7.1)
2000–11 (World
Development Indicators)
2008–12 (World
Economic Outlook) a
U.S. growth rate of GDP per capita (percent)
1.7 2.47 1.28 0.65 0.02
World growth rate of GDP per capita (percent)
1.3 2.75 3.17 2.28 1.73
Number of developing countries in which growth exceeded U.S. rate
2 21 75 80 78
Percentage of developing countries in which growth exceeded U.S. rate
5.3 29.2 72.8 89.9 83.9
Average excess over U.S. growth (percentage points)b
0.02 1.53 3.25 2.94 3.03
Number of countries in sample 38 72 103 89 93
Note: Sample excludes oil exporters (as defined by the IMF) and countries with populations of less than 1
million.
a. Based on GDP in constant dollars. Other columns use GDP in PPP terms.
b. Computed as simple average growth of countries whose growth exceeds that of the United States.
At around the same time, perhaps just preceding this convergence phase, world trade started to
surge, ushering in an era of hyperglobalization. That rising globalization (hereafter used
interchangeably with trade integration) is associated with stronger growth, which is a
prerequisite for improving the situation of average citizens all over the world, is reason enough
to seek to sustain it. This integration need not continue at the torrid pace of recent years; it
1 All growth figures in this paragraph use a GDP measure in purchasing power parity (PPP) terms.
4
should be sustained at a relatively steady rate and any serious reversal, which could set back the
prospects of the average global citizen, avoided.
This paper is divided into six sections. The next section documents some of the salient features
of this era of hyperglobalization. Section 3 discusses three key areas where the trading system is
seen as inadequate. The problems are illustrative of the proximate challenges and possible
solutions, but in important ways, they cannot be solved unless the more fundamental challenges
of globalization are addressed. Section 4 explores these deeper challenges. Section 5 suggests
possible policy responses at the national and international levels that could help sustain
globalization. Section 6 offers brief concluding remarks.
The paper is not comprehensive: it focuses on the trade aspects of globalization. It does not
discuss other important forms of globalization relating to the movement of finance and people.
Rather, it focuses on the major challenges, emphasizing aspects and arguments that have perhaps
received less attention thus far.2
2. Seven Important Characteristics of the Most Recent Wave of Globalization
This section describes seven major features of the current era of hyperglobalization and of
today’s trading system:
hyperglobalization (the rapid rise in trade integration)
the dematerialization of globalization (the importance of services)
democratic globalization (the widespread embrace of openness)
criss-crossing globalization (the similarity of North-to-South trade and investment flows
with flows in the other direction)
the rise of a mega-trader (China), the first since Imperial Britain
the proliferation of regional trade agreements and the imminence of mega-regional ones
the decline of barriers to trade in goods but the continued existence of high barriers to
trade in services
2 For this reason, notable features such as the decline in transportation costs and improvements in
information and communication technologies, which have been widely noted, are not studied in depth
here (for discussions of these issues, see WTO 2013).

5
Hyperglobalization
Since the early 1990s, the world has entered into an era of what might be called
hyperglobalization (figure 2.1). The years between 1870 and 1914 have been described as the
first golden age of globalization. World trade as a share of gross domestic product (GDP) surged
from 9 percent in 1870 to 16 percent on the eve of World War I. This was the era that Keynes
waxed eloquently about, noting that an inhabitant of London “could order by telephone, sipping
his morning tea in bed, the various products of the whole earth, in such quantity as he might see
fit, and reasonably expect their early delivery upon his doorstep” (Keynes 1920, p.11).
Figure 2.1 World Exports, in Current Dollars, 1870–2011
Sources: Authors, based on Klasing and Milionis 2012 for historical estimates (1870–50), World Trade
Organization for 1951–2011, and Johnson and Noguera 2012 for value-added exports estimates.
0
5
10
15
20
25
30
35
1870
1890
1913
1929
1939
1950
1960
1962
1964
1966
1968
1970
1972
1974
1976
1978
1980
1982
1984
1986
1988
1990
1992
1994
1996
1998
2000
2002
2004
2006
2008
2010
Sh
are
of
wo
rld
GD
P (
per
cen
t) First
globalization
Deglobalization
Reglobalization Hyperglobalization
Merchandise
Merchandise
(value added) Services
Total
Total
(value added)

6
The period between 1914 and the end of World War II witnessed the Great Reversal of
globalization, as the combustible mix of isolationism, nationalism, and militarism ignited
protectionist policies. World trade plunged to a low of 5.5 percent of world GDP just before
World War II began (O’Rourke and Williamson 1999; Frieden 2006; Irwin 2011).
A third era, starting after World War II, saw the restoration of world trade, aided by declines in
transport costs and trade barriers. Only by about the mid- to late 1970s did world trade revert to
the peaks seen before World War I.
The world is now in a fourth era, of hyperglobalization, in which world trade has soared much
more rapidly than world GDP. Merchandise exports-to-GDP ratios soared from 15 percent to 26
percent, and goods and services exports to about 33 percent3, over the course of the last two
decades. This rapid increase is somewhat surprising, because transport costs do not appear to
have declined as rapidly as in earlier eras (Hummels, Ishii, and Yi 2001; Baldwin 2011a). The
cost of information and communications did decline significantly, however.
Part of the increase in trade reflects the fragmentation of manufacturing across borders—the
famous slicing up of the value-added chain—as individual production stages are located where
the costs of production are lowest. This phenomenon, whereby technology no longer requires
that successive stages of manufacturing production be physically contiguous or proximate, has
been dubbed the “second unbundling” (Baldwin 2011a).4
This real technological impetus to trade tends to artificially inflate recorded trade. Because value
is added at each stage of the production chain, it is recorded as exports at successive links in the
chain. Gross exports flows therefore overstate real flows of valued added (exports net of
imported intermediate goods). Figure 2.1 shows that, even though value added–based exports of
goods and services are about 5 percentage points lower than exports measured on a gross basis,
3 Throughout this paper, we use trade data as currently measured, on a gross basis. Wherever possible,
and as a cross-check, we also present results for trade data measured on a value-added basis. The
appendix explains how these values are calculated. 4 The first unbundling reflected in the quotation from Keynes is the separation of the producer from the
consumer that increased trade permits.

7
their trajectory has been similar to that of conventionally measured exports. More recently, value
added as a share of exports has not declined substantially or across all trading regions (Hanson
2012; WTO 2013).5
Figure 2.2 Stocks and Flows of Foreign Direct Investment, 1913–2011
Sources: Authors, based on data from Bairoch 1996 for 1913–70, Dunning 1983 for stocks and UNCTAD
various years for flows for 1970–2011.
A related feature of this era of hyperglobalization is the rise of multinational corporations and the
sharp surge in flows of foreign direct investment (FDI), which have both caused and been caused
by cross-border and other flows of goods and services. Since the early 1990s (broadly coinciding
with the era of hyperglobalization), FDI flows have surged, growing substantially faster than
GDP (figure 2.2). Global FDI as a share of world GDP, which hovered around 0.5 percent,
increased sevenfold, peaking at close to 4 percent just before the onset of the recent global
financial crisis. Even discounting the two surges of 1997–2000 and 2005–08, the general trend is
steadily increasing. Global FDI stocks (which are less volatile than flows) jumped from less than
5 Koopman, Wang, and Wei (2013) further refined the measurement of value-added trade by
distinguishing where countries are (upstream versus downstream) in the value-added chain. The aggregate
value-added measures reported here are computed as in their paper.
0
5
10
15
20
25
30
35
0
0.5
1.0
1.5
2.0
2.5
3.0
3.5
4.0
4.5
191
3
192
9
193
8
196
0
197
1
197
3
197
5
197
7
197
9
198
1
198
3
198
5
198
7
198
9
199
1
199
3
199
5
199
7
199
9
200
1
200
3
200
5
200
7
200
9
201
1
Sh
are
of
wo
rld
GD
P (
per
cen
t)
Sh
are
of
wo
rld
GD
P (
per
cen
t)
Stocks of FDI
(right scale)
Flows of FDI
(left scale)

8
10 percent of GDP in the early 1990s to 30 percent in 2011. FDI flows, and stocks, now surpass
levels achieved in the first golden era of globalization, before World War I. By 2009, there were
more than 80,000 multinationals, accounting for about two-thirds of world trade (UNCTAD
2010).
“Dematerializing” Globalization
The rapid increase in trade has occurred in both goods and services. Based on conventional
(gross) trade data, services trade represented about 17 percent of world trade in 1980 and about
20 percent in 2008. Measured in value-added terms, the corresponding numbers are 30 percent
and 40 percent. The apparent paradox that we seek to explain in this section is that services trade,
which represents 6 percent of world GDP in gross terms, is 40–50 percent larger when computed
in value added terms. This phenomenon arises because services are not always directly tradable
but are sometimes embodied in the production of goods that are traded. In traditional trade
statistics, such services are not counted as traded; in value added terms, they are considered as
such, because production of the service takes place in one country and consumption in another
one. Traditional measures of services trade underestimate their importance in global trade.
Two underlying factors can explain the “dematerialization” of trade. First, as Johnson and
Noguera (2012) show, the ratio of value-added exports to gross exports in manufacturing goods
decreased in the last 30 years (from 60 percent in 1980 to 45 percent in 2009), as a result of the
rising importance of global value chains in this sector. Second, as explained in the previous
paragraph, trade in services is larger and growing faster in value added terms than traditional
statistics show. Soon, trade in services could eclipse trade in goods, less because services are
traded directly than because services are increasingly embodied in goods. Trade will actually be
dematerializing—moving from “stuff” to intangibles—although the manifestation will be, and
the data will record, the opposite effect.
Value added–based trade data reveal how much of total value added in a sector is traded
globally. Figure 2.3 plots world exports (gross and value added) of goods as a share of world
value added in goods (defined to include agriculture and industry), as well as similar numbers for
services. During the period of hyperglobalization, value added exports of goods as a share of

9
total value added in the sector (agriculture and industry) increased from about 33 percent to 47
percent, and services as a share of value added in the services sector increased from 11 percent to
16 percent. Thus, the pace at which services are becoming tradable mirrors that in merchandise.
Figure 2.3 Global Tradability of Goods and Services, 1975–2010
Sources: Authors, based on data from World Bank various years and Johnson and Noguera 2012.
The slower rise in the tradability of goods than services in the era of hyperglobalization may
partly reflect the differential rise in the costs of transport versus information and communications
technologies (ICT). After plummeting sharply between about 1940 and 1980, transport costs
appear to have stabilized (Baldwin 2011; Hummels 2007). In contrast, about 1990, the use of
ICT–related technologies and applications surged. A consequence could have been a differential
fillip to more sophisticated goods and especially services.
Democratic Globalization
Part of the increase in trade also reflects convergence and the wider distribution of output and
income: that is, trade has grown because output has become more widespread and “democratic.”
0
2
4
6
8
10
12
14
16
18
0
10
20
30
40
50
60
70
80
90
1975
1980
1985
1990
1995
2000
2005
2010
Sh
are
of
wo
rld
va
lue
ad
ded
in
ser
vic
es (
per
cen
t)
Sh
are
of
wo
rld
va
lue
ad
ded
in
ag
ricu
ltu
re a
nd
ind
ust
ry (
per
cen
t)
Merchandise exports (left scale):
- plain line = gross exports
- dotted line = VA exports
Services exports (right scale)
- plain line = gross exports
- dotted line = VA exports
10
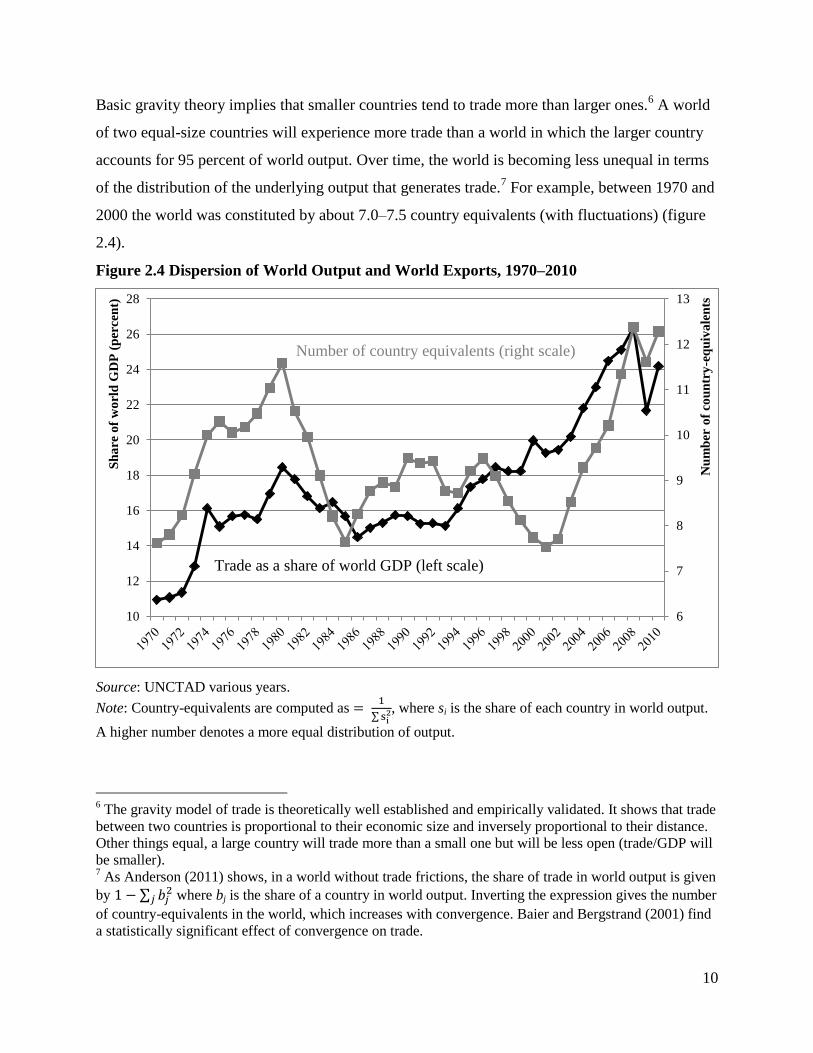
Basic gravity theory implies that smaller countries tend to trade more than larger ones.6 A world
of two equal-size countries will experience more trade than a world in which the larger country
accounts for 95 percent of world output. Over time, the world is becoming less unequal in terms
of the distribution of the underlying output that generates trade.7 For example, between 1970 and
2000 the world was constituted by about 7.0–7.5 country equivalents (with fluctuations) (figure
2.4).
Figure 2.4 Dispersion of World Output and World Exports, 1970–2010
Source: UNCTAD various years.
Note: Country-equivalents are computed as
∑ , where si is the share of each country in world output.
A higher number denotes a more equal distribution of output.
6 The gravity model of trade is theoretically well established and empirically validated. It shows that trade
between two countries is proportional to their economic size and inversely proportional to their distance.
Other things equal, a large country will trade more than a small one but will be less open (trade/GDP will
be smaller). 7 As Anderson (2011) shows, in a world without trade frictions, the share of trade in world output is given
by ∑
where bj is the share of a country in world output. Inverting the expression gives the number
of country-equivalents in the world, which increases with convergence. Baier and Bergstrand (2001) find
a statistically significant effect of convergence on trade.
6
7
8
9
10
11
12
13
10
12
14
16
18
20
22
24
26
28
Nu
mb
er o
f co
un
try
-eq
uiv
ale
nts
Sh
are
of
wo
rld
GD
P (
per
cen
t)
Number of country equivalents (right scale)
Trade as a share of world GDP (left scale)

11
Since 2000, as more countries have started catching up with the rich, world output has become
more dispersed: today, it is as if there were 10 country-equivalents in the world. In the era of
hyperglobalization, roughly a third of the increase in trade can be accounted for by this
democratization of world output (figure 2.4).
Figure 2.5 Trade Openness, 1870–2010
Sources: Maddison (1995); Penn World Table 7.1.
Note: For 1870–1950, openness is defined using Maddison’s measure of current exports in dollars
(deflated by the US consumer price index) and Maddison’s GDP data. For 1951–2010, openness is the
variable openk (Penn World Table 7.1) divided by 2. Oil exporters and small countries (populations of
less than 1 million) are excluded.8
8 We chose the openk variable because it is the most comparable with the Maddison (pre–World War II) GDP data
in that both are in constant purchasing power parity dollars. For the pre-War export data, there are two options for
deflation: a measure of general U.S. inflation (for example, the consumer price index [CPI]) or a measure of export
prices. Maddison provides a real export series based on the latter. We chose the CPI option for the simple reason
that the estimates for 1950 matched better the pre–World War II estimates for the years close to 1950. If we use
0
5
10
15
20
25
18
70
19
13
19
29
19
50
19
52
19
54
19
56
19
58
19
60
19
62
19
64
19
66
19
68
19
70
19
72
19
74
19
76
19
78
19
80
19
82
19
84
19
86
19
88
19
90
19
92
19
94
19
96
19
98
20
00
20
02
20
04
20
06
20
08
20
10
Sh
are
of
GD
P (
per
cen
t)
Population-weighted average
Simple average

12
.Even if the rise in world trade is caused by spreading prosperity, is this rise itself broadly
spread? The numbers in figure 2.1 are in effect a GDP–weighted average of individual country’s
export-to-GDP ratios. We can, instead, calculate export-to-GDP ratios that are unweighted or
weighted by population to measure the reach of globalization across countries and across people,
as done in figure 2.5.
Figure 2.5 shows that in 1913, the peak of the first golden era of globalization, the unweighted
average export-to-GDP ratio in the world was close to 15 percent. In 2010, it was 21.5 percent.
The population-weighted export-to-GDP ratio was about 6 percent; by 2010, it was 15 percent.
Hyperglobalization has thus come about not just because some rich countries are becoming more
open but also because openness is being embraced more widely.9 Keynes’ paean to globalization
was thus both imperialist and elitist.10,
11
Criss-Crossing Globalization
Trade has been increasing steadily. But one of the unique features of the most recent phase of
hyperglobalization is the fact that similar kinds of goods (and capital) are criss-crossing global
borders. In other words, it is less and less the case that a country’s imports and exports are very
different.
Three manifestations of such criss-crossing globalization can be discerned. In the immediate
aftermath of World War II, the industrial countries increasingly started to export and import
manufactured goods (for example, Japan, Germany, and the United States all exported and
imported cars), a phenomenon at odds with classic Ricardian model. Models of monopolistic
Maddison’s real export data, the changes over time are even more dramatic than shown in figure 2.4 (that is, export-
to-GDP ratios are lower for the past when exports are deflated by an export price index than a CPI index). 9 One potential problem with figure 2.5 is that the sample is not constant over time. The finding that trade
has become more democratized holds even for the constant sample of countries (not reported here). The
unweighted average is above the population-weighted average because populous countries tend to trade
less. 10
Even within the United Kingdom, the benefits of globalization were not broadly accessible. In 1912, for
example, there were 0.6 million telephone subscribers in the United Kingdom, the population of which
was about 46 million. 11
Another way of describing this democratization is to note that the trade of low- and middle-income
countries has grown more rapidly than their incomes and more rapidly than the trade of high-income
countries and that a bulk of this growth is trade among low- and middle-income countries (Hanson 2012).
13
competition (Helpman and Krugman 1985) combined with consumers’ love for variety
(differentiated products) provided the theoretical basis for the phenomenon of intraindustry trade
that related to trade in final goods. Melitz and Trefler (2012) show that the share of intraindustry
trade in total trade increased by nearly 20 percentage points. But this increase occurred between
1960 and the mid-1990s rather than over the most recent period of hyperglobalization. In fact,
since the 1990s, this share of intraindustry trade has stabilized (Brulhart 2008).
For the rapidly growing emerging market countries of Asia, criss-crossing globalization has
taken the form of greater two-way flows of parts and components than of final goods. This
phenomenon is related to the slicing up of the value-added chain and the unbundling noted
above.
The share of parts and components in trade offers one measure of criss-crossing globalization.
For the world as a whole, this share increased from about 22 percent in 1980 to 29 percent in
2000. Since then, intermediate goods trade declined to about 26 percent of total trade, suggesting
that the internationalization of production may have peaked (WTO 2013). Indeed, this form of
globalization was really observed only in Asia, and even there intermediate trade has declined
since 2000. Even in China, reliance on imports has declined markedly. In the computer sector
(broadly defined), for example, exports were only 1.6 times imports in 1994, indicating
substantial intermediate trade; by 2008, this ratio had climbed to 4.2 (Hanson 2012).
The third (and perhaps least remarked on) dimension of criss-crossing globalization, with
potentially important effects for globalization policies, relates to two-way flows of FDI. It is one
of the unique aspects of this era of hyperglobalization that developing countries (especially the
larger ones) are exporting FDI (which embodies sophisticated factors of production, including
entrepreneurial and managerial skills and technology)—and not just to other developing or
countries (Mattoo and Subramanian 2010). Figure 2.6 plots a Grubel-Lloyd index of two-way

14
flows of FDI at the global level.12
Depending on the weighting, this index climbed from about
0.3 in 1970 to almost 0.7 by 2011.
Figure 2.6 Two-Way Foreign Direct Investment Flows, 1970–2011
Source: UNCTAD various years.
Note: The Grubel-Lloyd index is computed for each country with nonzero positive flows. Each country is
then weighted by its share of total FDI flows, either with weights correspond to the current year (dotted
line) or with weights that are fixed at their mean over the period (solid line). The figure shows five-year
moving averages (to avoid large spikes).
The Rise of a Genuine Mega-Trader: China
When Krugman (1995) surveyed the evolution of world trade, he noted as one of the distinctive
features the rise of a number of Asian super-traders, including Singapore, Hong Kong (China),
and Malaysia, all of whose exports exceeded 50 percent of GDP, a feature never seen in the first
era of globalization (in 1913, the United Kingdom’s ratio of export to GDP was 18.5 percent).
12
The Grubel-Lloyd index, which can take values between 0 and 1, measures the degree of two-way
flows for a given country or industry. An index of 0 denotes that a country’s exports and imports are
perfectly dissimilar—that is, a country is either fully an importer or an exporter of a good (or, in this
specific case, a type of capital flow). An index of 1 denotes that a country’s exports and imports are
similar—that is, a country exports and imports of a certain good are identical in magnitude.
0.30
0.35
0.40
0.45
0.50
0.55
0.60
0.65
0.70
1970
1971
1972
1973
1974
1975
1976
1977
1978
1979
1980
1981
1982
1983
1984
1985
1986
1987
1988
1989
1990
1991
1992
1993
1994
1995
1996
1997
1998
1999
2000
2001
2002
2003
2004
2005
2006
2007
2008
2009
2010
2011
Gru
bel
-Llo
yd
in
dex
Fixed-weight average
Moving-weight average
15
But mega-traders can be defined in two senses: globally (relative to world trade) and nationally
(relative to a country’s own output). Krugman clearly applied the latter criterion. Had he applied
the former, one mega-trader he would have identified would have been Japan in the 1980s,
which accounted for about 7.5 percent of global trade at its peak. Based on this criterion, none of
the other East Asian Tigers would have been noteworthy, despite their astonishing performance:
the small economies of Singapore, Hong Kong (China), Taiwan (China), and Malaysia
accounted for a very small share of world trade at their peaks.
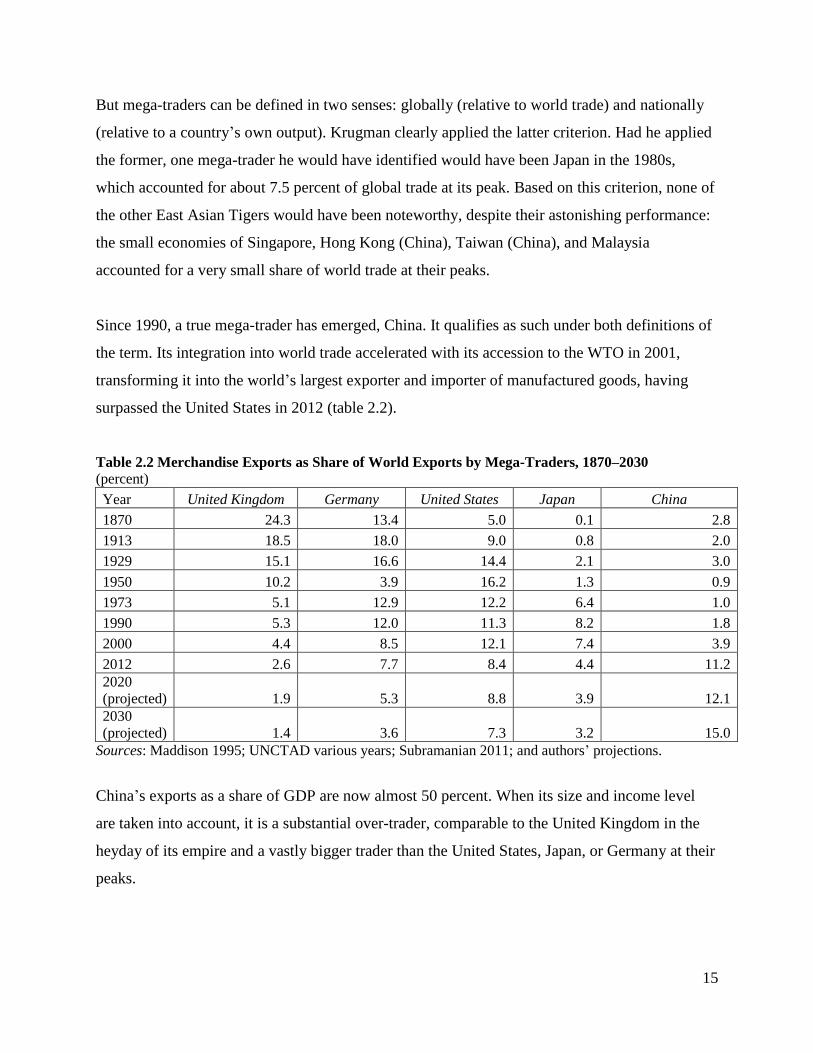
Since 1990, a true mega-trader has emerged, China. It qualifies as such under both definitions of
the term. Its integration into world trade accelerated with its accession to the WTO in 2001,
transforming it into the world’s largest exporter and importer of manufactured goods, having
surpassed the United States in 2012 (table 2.2).
Table 2.2 Merchandise Exports as Share of World Exports by Mega-Traders, 1870–2030
(percent)
Year United Kingdom Germany United States Japan China
1870 24.3 13.4 5.0 0.1 2.8
1913 18.5 18.0 9.0 0.8 2.0
1929 15.1 16.6 14.4 2.1 3.0
1950 10.2 3.9 16.2 1.3 0.9
1973 5.1 12.9 12.2 6.4 1.0
1990 5.3 12.0 11.3 8.2 1.8
2000 4.4 8.5 12.1 7.4 3.9
2012 2.6 7.7 8.4 4.4 11.2
2020
(projected) 1.9 5.3 8.8 3.9 12.1
2030
(projected) 1.4 3.6 7.3 3.2 15.0
Sources: Maddison 1995; UNCTAD various years; Subramanian 2011; and authors’ projections.
China’s exports as a share of GDP are now almost 50 percent. When its size and income level
are taken into account, it is a substantial over-trader, comparable to the United Kingdom in the
heyday of its empire and a vastly bigger trader than the United States, Japan, or Germany at their
peaks.

16
For example, in 1975, the United States’ trade-to-GDP ratio was 13.3 percent (table 2.3). Given
the size and income level of the United States, that number represented under-trading of about 50
percent. Japan in 1990, with a trade-to-GDP ratio of 20 percent, under-traded by about 50
percent. In contrast, China’s trade-to-GDP ratio in 2008 was 56.5 percent, which represented
over-trading of nearly 75 percent. Only Imperial Britain was a mega-trader in both senses of the
term. In 1913, its exports represented 18.5 percent of world exports. Its export-to-GDP ratio was
12 percent, which represented over-trading of about 84 percent. China is thus the first mega-
trader since Imperial Britain.
Table 2.3 Exports and Imports as Percent of GDP in Selected Mega-Traders
(trade as percent of GDP)
Percent over-trading, controlling for key gravity variables
Item Actual Controlling
for size
Controlling for size and income
level
Controlling for size, income level, and oil-
based economies
United Kingdom 1870 (sample includes 26 countries)
Exports 12.2 339.3*** 84.0* n.a
United States 1975 (sample includes 121 countries)
Exports 8.5 –9.5 –37.0*** –36.3***
Imports 7.6 –30.5*** –37.7*** –37.5***
Total trade (exports + imports) 16.1 –20.9*** –35.5*** –35.1***
Japan 1990 (sample includes 131 countries)
Exports 10.3 –33.8*** –56.8*** –55.6***
Imports 9.4 –44.3*** –49.4*** –51.4**
Total trade (exports + imports) 19.7 –40.4*** –52.9*** –53.7***
China 2008 (sample = 136 countries)
Exports 35.0 79.9*** 68.6** 80.5***
Imports 27.3 45.7*** 46.2*** 38.0**
Total trade (exports + imports) 62.2 64.6*** 60.8*** 62.0***
Sources: Maddison for United Kingdom; IMF various years and Penn World Table 7.1 for all other
countries.
Note: All coefficients were obtained by running a regression of exports, imports, trade on column heads a
plus dummy for the country in question. The level of over-/under trading is exp(dummy coefficient) – 1.
A negative value denotes under-trading. * = significant at the 10 percent level, ** = significant at the 5
percent level, *** = significant at the 1 percent level.
17
If trade continues to grow in line with income, China’s dominance in world trade will become
even greater. According to simple calculations in Subramanian (2011), by 2030 China could
account for about 16–17 percent of world exports, nearly three times the share of the United
States (see table 2.2).13
Even at the height of U.S. dominance, around 1975, it did not account for
as large a share of world trade or have as great an edge over its nearest competitors (in 2000, the
United States accounted for about 16 percent of world exports compared with 8 percent for
Germany and about 7 percent for Japan). Any discussion of trade and the trading system going
forward must recognize this development (discussed further below).
Growing Regionalization, Preferential Trade, and Impending Hyperregionalization
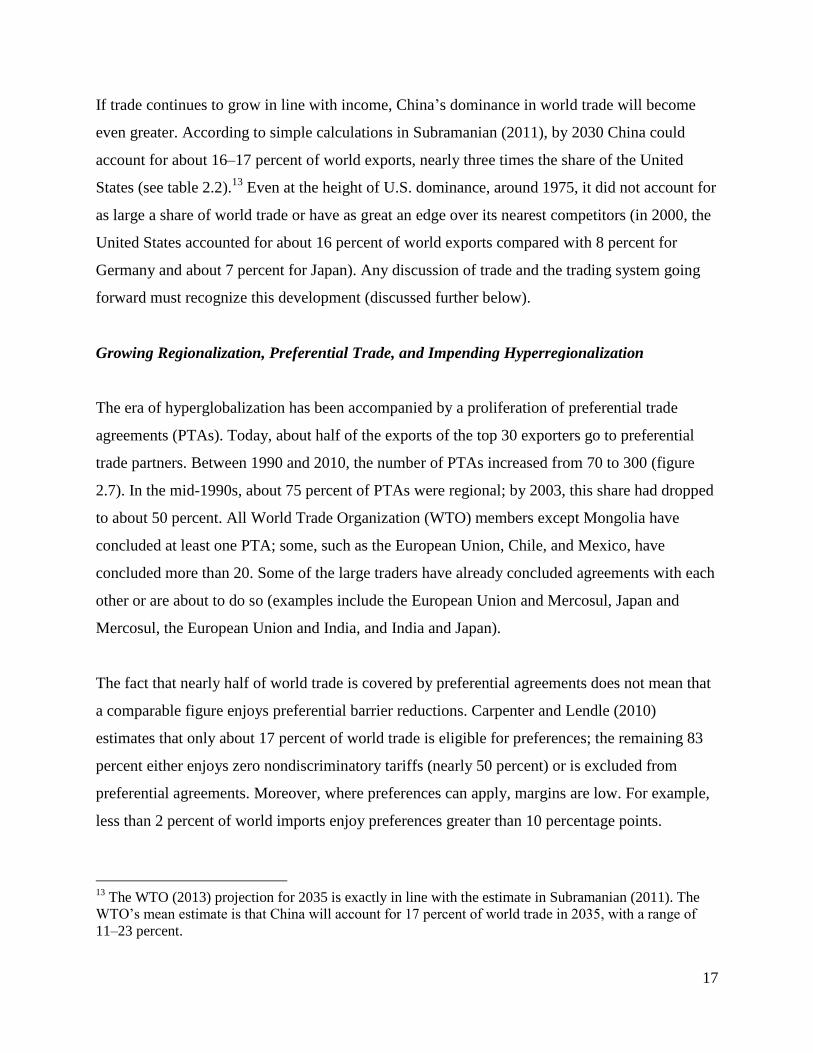
The era of hyperglobalization has been accompanied by a proliferation of preferential trade
agreements (PTAs). Today, about half of the exports of the top 30 exporters go to preferential
trade partners. Between 1990 and 2010, the number of PTAs increased from 70 to 300 (figure
2.7). In the mid-1990s, about 75 percent of PTAs were regional; by 2003, this share had dropped
to about 50 percent. All World Trade Organization (WTO) members except Mongolia have
concluded at least one PTA; some, such as the European Union, Chile, and Mexico, have
concluded more than 20. Some of the large traders have already concluded agreements with each
other or are about to do so (examples include the European Union and Mercosul, Japan and
Mercosul, the European Union and India, and India and Japan).
The fact that nearly half of world trade is covered by preferential agreements does not mean that
a comparable figure enjoys preferential barrier reductions. Carpenter and Lendle (2010)
estimates that only about 17 percent of world trade is eligible for preferences; the remaining 83
percent either enjoys zero nondiscriminatory tariffs (nearly 50 percent) or is excluded from
preferential agreements. Moreover, where preferences can apply, margins are low. For example,
less than 2 percent of world imports enjoy preferences greater than 10 percentage points.
13
The WTO (2013) projection for 2035 is exactly in line with the estimate in Subramanian (2011). The
WTO’s mean estimate is that China will account for 17 percent of world trade in 2035, with a range of
11–23 percent.

18
Figure 2.7 Number of New Signed Preferential Trade Agreements, 1958–2012
Source: WTO 2011.
Note: The year of the count is the year of notification of the agreement to the WTO. To simplify the
classification of agreements, included in the “economic integration agreement” category are all
agreements that are both economic integration agreements and customs unions or partial scope
agreements.
An interesting new dimension of these PTAs is the extent to which they feature “deep
integration” (Lawrence 1996)—that is, liberalize not only tariffs and quotas but other “behind-
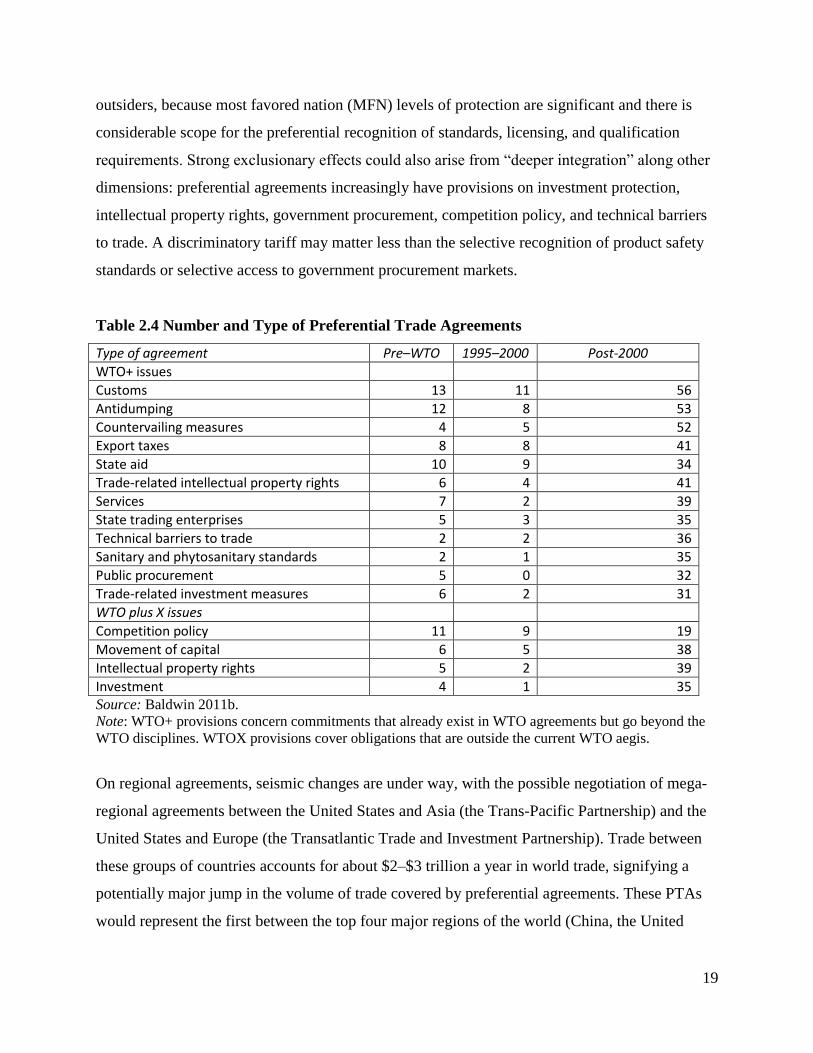
the-border” barriers, such as regulations and standards, as well. In the last 10 years, for example,
nearly 40 agreements have included provisions on WTO–Plus issues (competition policy,
intellectual property rights, investment, and the movement of capital). This figure is four to five
times greater than comparable agreements in the pre–WTO era (WTO 2011) (see figure 2.7 and
table 2.4).
In part because of these deep integration agreements, it would be wrong on the basis of the tariff
evidence to underestimate the potential discriminatory effect of preferential arrangements. In
agriculture and some manufacturing sectors, such as textiles, tariffs are still high. In services, any
future deepening of preferential agreements could create significant discrimination against
0
2
4
6
8
10
12
14
16
18
20
1958
1960
1961
1970
1971
1973
1976
1977
1981
1983
1985
1986
1988
1989
1991
1992
1993
1994
1995
1996
1997
1998
1999
2000
2001
2002
2003
2004
2005
2006
2007
2008
2009
2010
2011
2012
Nu
mb
er o
f a
gre
emen
ts p
er y
ear
Free Trade & Economic Integration Agreements
Economic Integration Agreements
Custom Unions
Free Trade Agreements
Partial Scope Agreements
19
outsiders, because most favored nation (MFN) levels of protection are significant and there is
considerable scope for the preferential recognition of standards, licensing, and qualification
requirements. Strong exclusionary effects could also arise from “deeper integration” along other
dimensions: preferential agreements increasingly have provisions on investment protection,
intellectual property rights, government procurement, competition policy, and technical barriers
to trade. A discriminatory tariff may matter less than the selective recognition of product safety
standards or selective access to government procurement markets.
Table 2.4 Number and Type of Preferential Trade Agreements
Type of agreement Pre–WTO 1995–2000 Post-2000
WTO+ issues
Customs 13 11 56
Antidumping 12 8 53
Countervailing measures 4 5 52
Export taxes 8 8 41
State aid 10 9 34
Trade-related intellectual property rights 6 4 41
Services 7 2 39
State trading enterprises 5 3 35
Technical barriers to trade 2 2 36
Sanitary and phytosanitary standards 2 1 35
Public procurement 5 0 32
Trade-related investment measures 6 2 31
WTO plus X issues
Competition policy 11 9 19
Movement of capital 6 5 38
Intellectual property rights 5 2 39
Investment 4 1 35 Source: Baldwin 2011b.
Note: WTO+ provisions concern commitments that already exist in WTO agreements but go beyond the
WTO disciplines. WTOX provisions cover obligations that are outside the current WTO aegis.
On regional agreements, seismic changes are under way, with the possible negotiation of mega-
regional agreements between the United States and Asia (the Trans-Pacific Partnership) and the
United States and Europe (the Transatlantic Trade and Investment Partnership). Trade between
these groups of countries accounts for about $2–$3 trillion a year in world trade, signifying a
potentially major jump in the volume of trade covered by preferential agreements. These PTAs
would represent the first between the top four major regions of the world (China, the United
20
States, Europe, and Japan), with consequences that will be discussed below. If the Transatlantic
Trade and Investment Partnership and Trans-Pacific Partnership (to the extent that it includes
Japan) are concluded, more than half of global trade will be covered by those deeper regional
agreements. It is not unforeseeable to think of an era in which nearly all trade becomes regional.
Lower Formal Barriers in Goods, High Barriers in Services
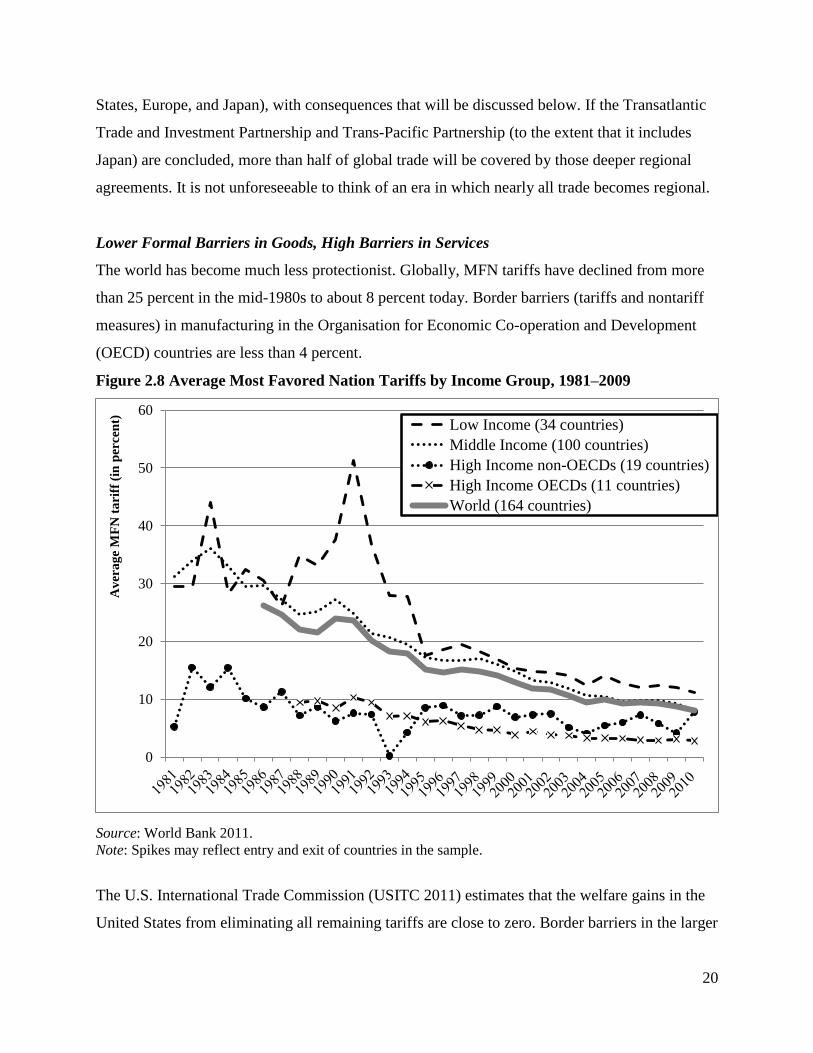
The world has become much less protectionist. Globally, MFN tariffs have declined from more
than 25 percent in the mid-1980s to about 8 percent today. Border barriers (tariffs and nontariff
measures) in manufacturing in the Organisation for Economic Co-operation and Development
(OECD) countries are less than 4 percent.
Figure 2.8 Average Most Favored Nation Tariffs by Income Group, 1981–2009
Source: World Bank 2011.
Note: Spikes may reflect entry and exit of countries in the sample.
The U.S. International Trade Commission (USITC 2011) estimates that the welfare gains in the
United States from eliminating all remaining tariffs are close to zero. Border barriers in the larger
0
10
20
30
40
50
60
Av
era
ge
MF
N t
ari
ff (
in p
ercen
t)
Low Income (34 countries)
Middle Income (100 countries)
High Income non-OECDs (19 countries)
High Income OECDs (11 countries)
World (164 countries)

21
emerging markets are higher, but they have declined considerably, from about 45 percent in the
early 1980s to just over 10 percent in 2009 (figure 2.8). But barriers to trade in services remain
high.14
Borchert, Gootiz, and Mattoo (2012) calculate restrictiveness trade indexes for services.
They cover five major sectors—financial services, telecommunications, retail distribution,
transport and professional services—and the different modes of delivering these services across
borders cross-border and via investment abroad). The index ranges from 0 (completely free) to
100 (completely restricted). Barriers vary across service sectors, but the average level is high
(figure 2.9). 15
Barriers are relatively low in telecommunications and relatively high in
transportation and professional services. They also vary across regions: Latin America is nearly
as open as OECD countries, whereas Asia and the Middle East have high barriers. In fact, as in
goods, barriers are correlated with a country’s level of development (figure 2.1). What this
means is that international negotiations will increasingly focus on services and FDI.
Figure 2.9 Index of Services Trade Restrictiveness, by Sector and Region, 2008–10
Source: Borchert, Gootiz, and Mattoo 2012.
14
There are no data on barriers to trade in services going back in time that would allow a quantitative
description of changes in barriers. 15
This index cannot strictly be compared with tariffs, but the farther away the number is from zero, the
less open a country is.

22
Figure 2.10 Index of Services Trade Restrictiveness and per Capita GDP
Source: Borchert, Gootiz, and Mattoo 2012.
Two points are worth noting. First, barriers to trade in goods and services have declined sharply
over time; the world as a whole is thus becoming less closed. But the composition of world trade
is shifting toward the poorer countries (especially toward China and India), and these countries
are on average more protectionist (as figures 2.8–2.10 illustrate). The composition of world
output is also shifting toward services and away from manufacturing. Both these compositional
shifts make the world as a whole less open and attenuate the liberalization trend that stems from
all countries reducing barriers.
Second, the integration of goods and services markets is nowhere close to completion. One way
of assessing how far from full globalization the world still is might be to compare actual trade
with what is predicted by a simple gravity model without frictions. As Krugman (1995) and
Anderson (2011) show, under frictionless trade, the world trade share is inversely related to the

23
distribution of GDP across countries: the more equal the distribution, the greater the world trade
share. In 1970, actual trade was about 10 percent of the theoretical maximum predicted by the
frictionless gravity model. In 2011, it was about 40 percent (perhaps less if trade is calculated on
a value-added basis). Thus, although actual trade is rapidly catching up with trade in a
frictionless world, there is still some way to go.16
3. Three Pressing Proximate Challenges
This section discusses three recent challenges that have emerged in the trading system and
proposes potential solutions to each of them. The proposed solutions can never be reached on
their own, however, unless the deeper and more fundamental challenges, discussed in subsequent
sections, are addressed.17
Trade and Currency Wars
Mercantilism and self-insurance: The dual origins of reserve accumulation
In the late 1990s, in the aftermath of the Asian financial crisis, a number of emerging market
countries, especially in Asia, adopted an economic strategy that was dubbed Bretton Woods II
(Dooley, Folkerts-Landau, and Garber 2003). This strategy had two motivations and one
manifestation. Reeling from the disruption that sudden withdrawal of foreign capital had caused
to their economies and chafing at the political humiliation of having to borrow from the IMF,
they decided to self-insure against future crises.18
Self-insurance took the form of building an
arsenal of foreign exchange reserves (see the paper by Allen and others on this website;
Goldstein 2009). The second motivation was mercantilism, a strategy that made trade surplus the
engine of growth.
Both motivations translated into a common manifestation: countries moved from being large net
importers of finance (running large current account deficits) to being less reliant on finance, or in
16
An implication of this finding on unrealized globalization is that going forward, this potential is likely
to be greater in services than in goods. 17
The next section, on trade and currency wars, draws on Mattoo and Subramanian (2009). 18
The perceived humiliation was captured in the picture of the IMF Managing Director at the time,
Michel Camdessus, looking over a head-bent President Suharto signing the economic adjustment program
with the IMF.

24
some cases, notably China, Malaysia, and Taiwan (China), to becoming net exporters of finance
(running current account surpluses). These motivations also translated into—actually require—a
policy of undervaluing the exchange rate in a fixed or managed peg regime, aided by
intervention in foreign exchange markets. A few countries in East Asia (China and Malaysia in
particular) tended to maintain restrictions on capital inflows as a way of sustaining a competitive
exchange rate.
Bergsten and Gagnon (2012, p. 2) argue that more than 20 countries have been intervening in
foreign exchange markets for several years “at an average rate of nearly $1 trillion annually… to
keep their currencies undervalued and thus boost their international competitiveness and trade
surpluses.” These countries include China and a number of East Asian countries, oil exporters,
and some advanced countries, including Israel and Switzerland.
This problem is not new. Similar issues of undervaluation arose relating to the Deutsche mark in
the 1960s and the yen in the 1970s and 1980s. The mercantilism or currency wars of today are
related to the much deeper problem—and some would argue the greatest design flaw in the
Bretton Woods system—of the asymmetric adjustment between surplus and deficit countries in
the international monetary and trade system. Bergsten and Gagnon (2012, p. 10)) write that “it is
a huge irony that the Bretton Woods system was created at the end of the Second World War
primarily to avoid repeating the disastrous experiences of the inter-war period with competitive
devaluations, which led to currency wars and trade wars that in turn contributed importantly to
the Great Depression, but that the system has failed to do so.”
Consequences of mercantilism
Why are current account surpluses combined with undervalued exchange rates a problem for the
international economic system? The consequences or problems can be categorized as cyclical
mercantilism, structural mercantilism, and macro-mercantilism.
Cyclical mercantilism arises when the economy is depressed relative to trend growth; such a
situation is characterized by idle resources, underutilized capital, and unemployment.
Mercantilism by one country threatens deflation in partner countries facing idle resources. This
25
concern preoccupied Keynes, who argued that because of international liquidity constraints,
there would always be greater pressure on debtors (countries running deficits) to adjust than on
creditors. This asymmetry would impart a deflationary bias, because debtor countries would have
to cut demand without surplus countries having to undertake the offsetting reflation. He therefore
proposed that pressure be exerted on creditor countries by forcing them to pay instead of
receiving interest on their positive balances (see Williamson 2010).
In the current context, the deflationary impact of Chinese policies on the United States,
quantified by Cline (2010), has prompted some commentators to call for aggressive trade action
by the United States against China and other countries practicing mercantilism (Krugman 2010;
Bergsten and Gagnon 2012). Persistent surpluses by Germany and their deflationary impact,
especially within Europe, have sparked similar calls for action (Wolf 2010).
Structural mercantilism arises when a country pursues policies such as undervalued exchange
rates as development or growth policy for an extended period of time. Such policies can have
long-run effects on partner countries. An undervalued exchange rate is both an import tax and an
export subsidy; it can have adverse effects on trading partners. One way structural mercantilism
is transmitted is by depressing the medium-run price of manufactured products, reducing
opportunities for specialization in manufacturing and manufactured exports in partner countries.
The concerns expressed in Sub-Saharan Africa and Latin America relate to structural
mercantilism. Mattoo, Mishra, and Subramanian (2012) show, for example, that a 10 percent
depreciation of China’s real exchange rate reduces a developing country’s exports of a typical
product to third markets by about 1.5–2.0 percent. Such a decline can have long-run growth
effects.
Macro-mercantilism was most evident in the recent crisis in the creation of the so-called savings
glut (Bernanke 2005, 2007). Large and growing aggregate current account surpluses increase
global liquidity, leading to easy credit and lending, which can easily morph into imprudence,
financial excess, and asset bubbles, threatening financial stability. The savings glut hypothesis is
by no means uncontested; many economists argue that monetary and regulatory policies in
borrowing countries should bear the brunt of responsibility (Johnson and Kwak 2010; Haldane

26
2010). How much blame the bartender should bear for plying alcohol on a drinker who binges
will forever be disputed. But that excess liquidity was a factor and that Chinese mercantilist
policies created excess liquidity are plausible deeper causes of the Lehman crisis (see Bernanke
and others 2011).
Currency wars or the resulting global imbalances are a systemic problem only if one or a few
large countries pursue them. The possibility of collective action to prevent them must take
account of this reality.
Exchange rates and foreign exchange intervention are centrally implicated in mercantilism. The
international monetary system, under the auspices of the IMF, is therefore the best forum in
which to find a solution. The prospects for any serious reform remain slim, however, because of
the inherent limits to international monetary cooperation. Systemic threats arise from the policies
of the largest countries, in particular when polices pursued in self-interest conflict with the
collective interest. But, by definition, it is difficult for the rest of the world to change the
incentives of the large country to give more weight to the collective interest. Successful
cooperation is fated to falter if not fail—and the efforts of the IMF in this matter have often
resulted in failure. As Mussa (2007) makes clear, “In none of these consultations has the
Executive Board ever concluded that a member was out of compliance with its obligations
regarding its exchange rate policies or any other matter” (emphasis in the original).19
Williamson (2011, p. 1) notes that “it has been 80 years since John Maynard Keynes first
proposed a plan that would have disciplined persistent surplus countries. But the Keynes Plan,
like the subsequent Volcker Plan in 1972–74, was defeated by the major surplus country of the
day (the United States and Germany, respectively), and today China (not to mention Japan or
Germany) exhibits no enthusiasm for new revisions of these ideas.” The question is whether
there is anything that the rest of the world could have done—by way of sticks or carrots—to
have persuaded the United States in 1944, Germany in 1973, or China in 2007 to change its
positions or policies for the collective good.
19
Keynes himself recognized the asymmetry of IMF leverage between creditor and debtor countries in the
discussion in the lead-up to the creation of the IMF.

27
The IMF’s ineffectiveness is a proximate manifestation of deeper structural causes related to
leverage and legitimacy. Although the IMF has been able to effect changes in member country
policies in the context of financial arrangements, it has not been influential without the leverage
of financing. In its key surveillance function (which involves no financing), the IMF has rarely
led to changes in the policies of large creditor countries, even when such policies have had
significant spillover effects on countries; it has not been able to persuade large creditor countries
to sacrifice domestic objectives for systemic ones. There seems to be an implicit “pact of mutual
nonaggression,” to use Mussa’s phrase, in IMF surveillance. Perhaps as a result, the IMF has had
a history and tradition of nonadversarial dialogue between its members and has not had to
develop a real dispute settlement system.20
Compounding this problem of limited leverage is the IMF’s eroding legitimacy. Although its role
and importance were rehabilitated with the recent global financial crisis, the perception of the
IMF as an unreliable interlocutor in emerging market countries—Asia in particular—endures. A
good example is the IMF’s new conditionality-lite financing facility, which has few takers
because some emerging market countries do not want to be seen as even potential borrowers
from the IMF. Indeed, in 2009, a number of emerging market countries—Brazil, Singapore, and
the Republic of Korea—preferred to get lines of credit from the U.S. Federal Reserve than the
IMF.
The WTO seems to be different on these two counts of legitimacy and leverage, because it works
on the basis of the exchange of concessions, which ensures that all players feel that they have
derived a fair political “bargain.” Reciprocity ensures political buy-in to cooperation. Periodic
negotiations in the GATT/WTO have updated this political contract between countries,
20
A corollary of the observation that cooperation is least likely where the self-interest of the largest
countries are at stake is that the prospects for successful cooperation are greater where these countries are
less affected and when the demands on them are minimal. Building global safety nets by providing
greater and more expeditious access to crisis financing is one area where the greatest progress has already
been made. The IMF’s lending ability tripled after the crisis, and it may increase further. For the large
countries, it is both desirable and effective to push for larger safety nets. The costs are relatively small—
involving larger financial contributions rather than any major change of domestic policies—and the
rewards are great, because the system as a whole is strengthened while the individual clout of the large
countries is increased (see Goldstein 2009).
28
redressing some old grievances and papering over others, with the implicit understanding that
there will be a future occasion to take up the unsolvable problems of the day.
A consequence of reciprocity and the periodic updating of the political contract to cooperate—
and another reason why the WTO works—is that this process creates incentives to adhere to the
dispute settlement contract. Dispute settlement by the WTO is effective largely because countries
feel that they have previously (and recently) made a reasonably advantageous, fair, and equitable
bargain, to which they must adhere. WTO governance works because negotiations to create the
rules and agree on liberalization are perceived as fair and broadly equitable in outcome,
rendering subsequent compliance possible.21
Trade, Climate Change, and Green Growth
Do the institutions and ideology of globalization come in the way of tackling climate change? In
one very important respect, they may.22
Consider two episodes from 2012. In late 2012, the United States and the European Union
sanctioned the use of antidumping duties against Chinese exports of solar panels on the grounds
that Chinese manufacturers were “dumping” (selling below cost) solar panels manufactured in
China. In the presidential debates, President Obama was on the defensive against Mitt Romney,
who tried (with some success) to tar him with the “failed industrial policy” brush in relation to
government support for clean energy and Solyndra, a producer of solar panels that filed for
bankruptcy two years after receiving substantial government loans and guarantees. These
examples illustrate how international rules and ideology (which underlie rules) could come in the
way of efforts to tackle climate change.
Mattoo and Subramanian (2012b) argue that only radical technological change can reconcile
climate change goals with the development and energy aspirations of the bulk of humanity.
Technological change requires the deployment of the full range of policy instruments that would
21
Experience suggests that the mere prospect of retaliation, as well as the reluctance to be seen as a rule
breaker, is sufficient to ensure compliance and that there is rarely need for action. 22
This section is based on Mattoo and Subramanian (2013).

29
raise the price of carbon and provide incentives for research and development of noncarbon-
intensive sources of energy and related green technologies. With notable exceptions, countries
have shown great reluctance to raise the price of carbon directly.
International rules severely restrict the use of subsidies. Under current WTO rules, domestic
subsidies for the development and production of clean energy and related energy technologies
are actionable by partner countries if those countries feel that their domestic production or
exports are adversely affected. Until 2000, some of these subsidies were deemed nonactionable,
but the exemption has not been renewed. Moreover, all forms of export subsidy involving clean
energy and/or green technologies are prohibited. These rules are in place because of the ideology
that imbues globalization—the notion that subsidies and all forms of industrial policy are
dubious.
In relation to climate change, these rules are doubly bad. There is, of course, a logic to curtailing
subsidies: even if they confer domestic benefits, those benefits are outweighed by the damage to
partner countries. A multilateral rule to which there is general adherence reduces that damage,
potentially leaving countries better off. But in the case of climate change, because spillovers are
global, any subsidy that promotes clean energy and development confers a benefit to partner
countries. On balance, therefore, rules should err on the side of promoting rather than restricting
subsidies.
There is a second, arguably bigger, political economy benefit. Prospects for climate change
action in the United States in the form of a carbon tax or cap-and-trade are not bright. President
Obama’s grand rhetoric in his 2013 State of the Union speech is unlikely to be matched by bold
action because of the lack of bipartisan support in Congress. This state of affairs reflects a
combination of factors—climate change denial, the strength of the carbon energy industries, and
weak economic prospects. There is probably only one development that could galvanize action in
the United States: the threat that China will capture green technology leadership. The United
States needs a Sputnik moment of collective alarm at the loss of economic and technological
ascendancy.
30
The problem is that China is currently constrained by WTO rules, as the actions against its firms
in 2012 illustrate.23
China and all countries that are not straitjacketed by the tyranny of the
susbsidies-are-bad ideology and that have the financial means to do so should be allowed to
deploy industrial policy to promote clean energy and green technologies. If doing so leads to a
subsidy war because partners feel threatened, that is a war that should be promoted, as it will
ignite the race for the development and production of an undersupplied global public good. From
this perspective, WTO rules should allow not only domestic but also export subsidies; current
rules circumscribe the use of domestic and prohibit the use of export subsidies.24
Trade and Scarcity of Food and Resources
The 2007 global food crisis was severe.25
According to the World Bank, about 100 million
people are estimated to have been thrown back into the ranks of the poor because of increases in
the price of food. Riots occurred in a number of countries. The Bank identified 33 countries as
especially vulnerable. The poor were especially vulnerable because they spend the largest
portions of their income on food. In the United States, the poor spend an estimated 18 percent of
their income on food; a similar measure for households earning less than $1 a day is about 72
percent in Peru and South Africa, 66 percent in Indonesia, and 50 percent in Mexico (Banerjee
and Duflo 2011).
23
In fact, China stopped providing subsidies to its solar power companies in response to trade action by
the United States. “The U.S. Trade Representative’s Office responded by filing a complaint in December
with the WTO saying China violated rules of the Geneva-based trade arbiter. China’s Special Fund for
Wind Power Manufacturing required recipients of aid to use Chinese- made parts and amounted to a
prohibited subsidy, the U.S. said. Before the WTO acted on the complaint, China made it moot by ending
that aid in June, according to the U.S.” (http://www.bloomberg.com/news/2011-09-23/blame-china-
chorus-grows-as-solyndra-fails-amid-cheap-imports.html). 24
Another area in which trade restrictions should be permitted are border tariffs against imports from
countries that do not tax carbon in the manner that the importing country does. Such tariffs would help
overcome opposition from energy-intensive industries in countries wishing to raise the price of carbon on
the grounds that they would be rendered uncompetitive relative to imports from countries that do not tax
carbon. A final area in which WTO rules need to be clarified is export restrictions on natural gas, which is
becoming an important fuel. The U.S. currently limits its exports to countries with which it does not have
a free trade agreement. If greater global use of natural gas is desirable (because it is cleaner than
substitutes such as oil and coal), then restrictions on exports may be deleterious for global energy
emissions. 25
This section draws on Mattoo and Subramanian (2012a).
31
But pressure on food supplies, and associated high food prices, could be a medium- to long-term
reality, because some of the driving factors—rising prosperity in the developing world, which
creates more demand; high fuel prices; stagnant agricultural productivity; and climate change–
induced pressure on agricultural supplies, including through the depletion of water—could be of
a durable nature. These fundamentals are being exacerbated by export restrictions on foodstuffs.
According to a World Bank report, in the 2007 crisis, 18 developing countries imposed some
form of export restrictions (Zaman and others 2008). Each country was trying to keep domestic
supplies high, on the grounds of food security. But as more countries implemented export
controls, global supply contracted, pushing prices up and exacerbating global food insecurity.
The global rice market was particularly affected by trade restrictions.26
There are few restrictions on the use of export taxes in the WTO, and its disciplines on export
restrictions are incomplete. The GATT does prohibit quantitative restrictions on exports, but
temporary restrictions are permitted in order to prevent critical shortages of food or other goods.
This permissiveness on export taxes and restrictions is resulting in the worst of all possible
worlds. Under “normal” agricultural conditions, costly taxpayer support reduces imports and
encourages production and exports, creating huge distortions. Under abnormal conditions, such
as are prevailing now, the opposite occurs: countries liberalize their imports but prevent exports.
What is needed is a system in which both imports and exports remain free to flow in good times
and bad. Such a system is especially important if trade is to remain a reliable avenue for food
security. If in bad times importing countries are subject to the export-restricting actions of
producing countries, they will consider trade an unreliable way of maintaining food security and
reconsider how to manage their agriculture. As a result, there will be a greater temptation to
move toward more self-reliance as insurance against the bad times.27
26
Food security goals are best served not by restricting trade but by deploying domestic policy
instruments such as targeted safety nets. The existence of such safety nets would dilute the political
economy bias in favor of trade interventions. 27
Not surprisingly, WTO members that depend heavily on world markets for food (for example, Japan
and Switzerland in 2000; the Democratic Republic of Congo, Jordan, and the Republic of Korea in 2001)
have pushed for disciplines on export controls and taxes. Recognizing that importers’ concerns about the
reliability of supply could inhibit liberalization, some exporting countries have advocated for multilateral
restrictions on the right to use export restrictions (examples include the Cairns Group and the United
States in 2000 and Japan and Switzerland in 2008) (International Economic Law and Policy Blog 2008).

32
The Doha Round of trade negotiations did not address these problems. It was devoted to
traditional forms of agricultural protection—trade barriers in the importing countries and
subsidies to food production in producing countries—which are now becoming less important as
food prices have soared and import barriers declined. The trade agenda needs to be enlarged, so
that trade barriers, on both imports and exports, are put on the trade agenda.
Trade policies have also exacerbated the scarcity of nonfood resources. Concerns have already
arisen over China’s restriction of exports of rare earth metals, for some of which (for example,
scandium and yttrium) it accounts for more than 70 percent of the world’s exports. It also
accounts for a large shares of exports of other key raw materials, including various forms of
bauxite, magnesium, and zinc.28
4. Fundamental Policy Challenges
The period of hyperglobalization has been associated with the most dramatic turnaround in the
economic fortunes of developing countries. Regardless of the view one takes about this
association, it is safe to say that a broadly open system is good for the world, good for individual
countries, and good for average citizens in these countries. Going forward, even if the pace of
hyperglobalization slows, the aim of policy at the national and collective level must be to sustain
steady and rising globalization and avoid sharp reversals.
The previous section illustrated some of the proximate challenges. They can be addressed only if
the deeper challenges are recognized and addressed.
One way of approaching these more fundamental policy challenges is suggested in table 4.1,
which helps identify the problems and hence to prioritize the policy response. This schematic can
be applied to three broad groups of countries (high, middle, and low income), the challenges and
responses for each of which may differ.
28
In an earlier case, a WTO panel ruled against certain export restrictions China had maintained on a
number of raw materials, including bauxite, coke, fluorspar, magnesium, and zinc.
33
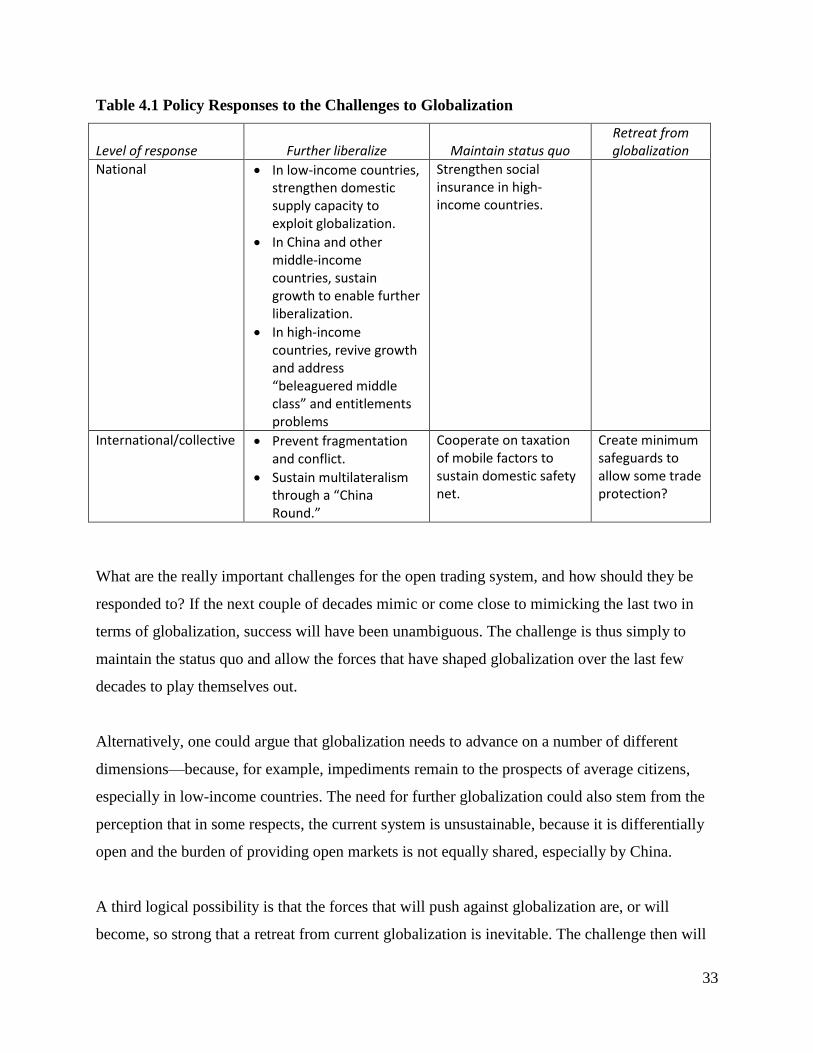
Table 4.1 Policy Responses to the Challenges to Globalization
Level of response Further liberalize Maintain status quo
Retreat from globalization
National In low-income countries, strengthen domestic supply capacity to exploit globalization.
In China and other middle-income countries, sustain growth to enable further liberalization.
In high-income countries, revive growth and address “beleaguered middle class” and entitlements problems
Strengthen social insurance in high-income countries.
International/collective Prevent fragmentation and conflict.
Sustain multilateralism through a “China Round.”
Cooperate on taxation of mobile factors to sustain domestic safety net.
Create minimum safeguards to allow some trade protection?
What are the really important challenges for the open trading system, and how should they be
responded to? If the next couple of decades mimic or come close to mimicking the last two in
terms of globalization, success will have been unambiguous. The challenge is thus simply to
maintain the status quo and allow the forces that have shaped globalization over the last few
decades to play themselves out.
Alternatively, one could argue that globalization needs to advance on a number of different
dimensions—because, for example, impediments remain to the prospects of average citizens,
especially in low-income countries. The need for further globalization could also stem from the
perception that in some respects, the current system is unsustainable, because it is differentially
open and the burden of providing open markets is not equally shared, especially by China.
A third logical possibility is that the forces that will push against globalization are, or will
become, so strong that a retreat from current globalization is inevitable. The challenge then will

34
be to manage this retreat in a way that minimizes the costs to countries and citizens around the
world.
The responses to each of these challenges can occur at the national level, at the international
level, or through some combination of national and collective action. The responses to these
challenges are discussed below.
The West’s Challenge: Hyperglobalization Meets Economic Decline
The bad news
Public support for free trade agreements in the United States is at its lowest point since 2006,
according to the Pew Center (2010)—and the decline occurred quickly. In 2009, the share of
people who supported free trade agreements exceeded the share who opposed it by a margin of
11 percentage points. In 2010, opponents of free trade outnumbered supporters by 8 percentage
points. Surprisingly, among Republican-leaning voters, the turnaround was even more dramatic:
the margin in 2009 was 7 percentage points in favor of free trade agreements; the margin in 2010
was 26 percentage points against free trade agreements. This weakening collective perception of
the benefits of openness is matched, mirrored, or validated by intellectual opinion.
Samuelson (2004) argues that the rise of developing countries such as China and India could
compromise living standards in the United States, because as they move up the technology
ladder, they provide competition for U.S. exports, reducing their price. Krugman (2008) focuses
on the impact of imports from developing countries, particularly China, on the distribution of
income in the United States and the wages of less-skilled workers. His conclusion is that “it is
likely that the rapid growth of trade since the early 1990s has had significant distributional
effects” and that “it is probably true that this increase (in manufactured imports from developing
countries)… has been a force for greater inequality in the United States and other developed
countries” (Krugman 2008, 134–35).
Blinder (2009) draws attention to the employment and wage consequences of the outsourcing
that has been facilitated by technological change and trade in services. He estimates that 22–29
percent of all U.S. jobs will be offshored or offshorable within the next decade or two.

35
Summers (2008a, 2008b) has highlighted the problems stemming from increasing capital
mobility. Hypermobile U.S. capital creates a double whammy for American workers. First, as
companies flee in search of cheaper labor abroad, American workers become less productive
(because they have less capital to work with) and hence receive lower wages; the “exit” option
for capital also reduces the incentive to invest in domestic labor. Second, capital mobility impairs
the ability of domestic policy to respond to labor’s problem through redistribution because of an
erosion in the tax base as countries compete to attract capital by reducing their tax rates.
Spence and Hlatshwayo (2011) argue that almost all the increase in employment of 27.3 million
jobs in the United States between 1990 and 2008 was in the nontradable sectors, where
productivity growth was much slower than in the manufacturing and tradable sectors, explaining
the long-term stagnation of wages in the last segment of the workforce.
That a constellation of intellectuals—instinctively cosmopolitan and ideologically liberal—talks
like this is an important signal, not least because the objective circumstances have changed. One
might call this challenge that of the irresistible force of globalization and hyperglobalization
meeting the immovable object of weakening economic and fiscal fortunes in the West.
In the United States, except for a brief spell in the late 1990s, median wages have stagnated for
three decades; inequality has been sharply rising, particularly because of rising incomes at the
very top of the income spectrum (Piketty and Saez 2003); and mobility has declined (Haskins,
Isaac, and Sawhill 2008) Worse, as in all industrial countries, indebtedness has risen (average
debt in the G-7 is now about 80 percent of GDP), prospects for medium-term growth in the
future are not bright (according to the latest World Economic Outlook forecast), and aging and
entitlements add to the serious fiscal pressures looming ahead. These objective conditions are not
the most propitious for sustaining globalization.
This structural malaise is captured in the following metaphor that Larry Katz, of Harvard, uses:
“Think of the American economy as a large apartment block. A century ago—even 30 years
ago—it was the object of envy. But in the last generation its character changed. The penthouses
at the top keep getting larger and larger. The apartments in the middle are feeling more and more

36
squeezed, and the basement has flooded. To round it off, the elevator is no longer working. That
broken elevator is what gets people down the most” (quoted by Luce 2010).
The policy challenge in the advanced countries is that sustaining current levels of openness will
require addressing these domestic challenges at the very time when growth could be slowing and
the ability to effect redistribution is being impeded by broader medium-term fiscal concerns.
In this light, the changing attitudes to globalization and free trade cited above are not surprising.
We focus here on what is now different in the West’s ability to sustain globalization. A starting
point is the view, described in Rodrik (1998), that sustaining openness requires a domestic social
consensus in its favor, which in turn requires mechanisms of social insurance to cushion
domestic actors against globalization-induced shocks. Rodrik (1998) provides evidence showing
that this domestic consensus can be captured in the relationship between the size of government
(a proxy for social insurance mechanisms) and openness.
More direct evidence of the importance of social insurance comes from a paper by Autor, Dorn,
and Hanson (2013), who show that rising exposure to Chinese imports increases unemployment,
lowers labor force participation, and reduces wages in local labor markets. They estimate that the
exogenous component of this shock explains one-quarter of the contemporaneous aggregate
decline in U.S. manufacturing employment. They estimate that rising exposure to Chinese import
competition explains about 16 percent of the decline in U.S. manufacturing employment between
1991 and 2000 and 27 percent of the decline between 2000 and 2007. Transfer payments for
unemployment, disability, retirement, and health care also rise sharply in exposed labor markets.
They estimate the increase in annual per capita transfers attributable to rising Chinese import
competition at $32 in the first 10 years and $51 in the last 7 years of the sample, which translates
into total expenditure of about $5 billion in the 1990s and almost $15 billion in the 2000s. The
deadweight loss of financing these transfers is one-third to two-thirds as large as U.S. gains from
trade with China.
Can the West sustain these social insurance mechanisms? According to Summers (2008a),
globalization both increases the need for social insurance and undermines the government’s

37
ability to provide it, because it renders more factors, especially capital and high-skilled labor,
more mobile and less easy to tax.
Has capital become less easy to tax? Figure 4.1 plots the marginal effective tax rates on capital in
some important OECD countries and for the OECD as a whole. These rates have been sharply
declining, and there is little pressure to reverse these trends.
Figure 4.1 Tax Rates on Distributed Corporate Profits in Selected OECD Countries, 1981–
2012
Source: OECD various years.
Note: Overall (corporate plus personal) tax rate on distributed profits are computed as effective statutory
tax rates on distributions of domestic source income to a resident individual shareholder, taking account
corporate income tax, personal income tax, and any type of integration or relief to reduce the effects of
double taxation.
For the OECD as a whole, the average marginal tax rate declined from about 55 percent to
almost 40 percent, a 15 percentage point decline. These declines were witnessed across most if
not all countries. In the United States, rates declined from 65 percent to just over 50 percent; in
40
45
50
55
60
65
70
75
80
85
90
198
1
198
2
198
3
198
4
198
5
198
6
198
7
198
8
198
9
199
0
199
1
199
2
199
3
199
4
199
5
199
6
199
7
199
8
199
9
200
0
200
1
200
2
200
3
200
4
200
5
200
6
200
7
200
8
200
9
201
0
201
1
201
2
Tax r
ate
on
pro
fits
(in
per
cen
t)
France Germany
Japan United Kingdom
United States
OECD average OECD weighted average

38
Germany they fell from about 60 percent to less than 50 percent. Of course, these declines reflect
pressures other than globalization and the attendant difficulty of heavily taxing mobile capital,
but these pressures have been important.
A new development adds to the problems. Across the OECD, the share of the economic pie
accruing to capital has been increasing, increasing from about 35 percent to 40 percent in the last
few years (figure 4.2). This increasing share has prompted several commentators, including
Krugman, to argue that the debate about inequality and trade and inequality in the 1990s, which
related to inequality within types of labor (skilled versus unskilled), should now be viewed
through a different lens, because inequality is increasingly between capital (and those who own
it) and labor.
Figure 4.2 Share of Capital in National Income in Selected OECD Countries, 1980–2012
Sources: Annual Macroeconomic Database of the European Commission (AMECO) various years.
Note: The share of capital is computed from the AMECO database using the adjusted wage share at
current market prices.
25
30
35
40
45
50
1980
1981
1982
1983
1984
1985
1986
1987
1988
1989
1990
1991
1992
1993
1994
1995
1996
1997
1998
1999
2000
2001
2002
2003
2004
2005
2006
2007
2008
2009
2010
2011
2012
Sh
are
of
nati
on
al
inco
me
(in
per
cen
t)
France GermanyUnited Kingdom United StatesJapanArithmetic OECD average Weighted OECD average
39
For the purposes of our argument, what is important is this: Not only is the ability to finance
mechanisms of social insurance being undermined by weak growth and the burden of debt
(Ruggie 1998); slippery, mobile capital is now accounting for a larger share of the economic pie.
The funding of social insurance through taxation is thus going to become more difficult.
The good news: The protectionist dog that barked but did not bite
Several commentators have remarked on the fact that despite suffering perhaps the biggest global
trade shock in the recent global financial crisis, the world did not succumb to protectionism. This
response stood in stark contrast to the experience of the 1930s. Explanations for the difference
have included the facts that (a) countries could use macroeconomic policy instruments (monetary
and exchange rate), which adherence to the gold standard initially prevented in the 1930s
(Eichengreen and Irwin 2009); (b) automatic stabilizers were in place, by way of transfers and
unemployment benefits (Autor, Dorn, and Hanson 2013); and (c) the deeper integration created by
modern production chains rendered protectionism self-defeating (Baldwin and Evenett 2009).
The bigger puzzle is this: How did the West, and the United States in particular, adjust to
arguably the biggest structural trade shock in its history—namely, rising imports from China—
without any serious recourse to protectionism? Why was there less protectionist outrage in the
United States against China than there was against Mexico in the 1990s or Japan in the 1980s?
The domestic uproar against China did not match the backlash created in the context of the North
American Free Trade Agreement (NAFTA), and actual protectionist actions did not come
remotely close to the actions taken against Japan (the Reagan era witnessed the greatest upsurge
in trade barriers in the postwar period; see Destler 1992).
The differences cannot be explained by the relative magnitude of the three shocks, as the Chinese
shock was orders of magnitude larger than the early shocks. Figure 4.3 plots imports from
Mexico, Japan, and China as a share of U.S. domestic consumption between 1962 and 2011. At

40
their peaks, Japan accounted for 3.6 percent of U.S. consumption, whereas China accounts for
about 5.2 percent.29
Figure 4.3 Import Shocks in the United States from Mexico, Japan, and China, 1962–2011
Sources: IMF various years.
Note: Domestic absorption is GDP minus trade balance.
Table 4.2 quantifies the trade shocks to the United States from the three countries. The shock is
computed in three ways (each scaled by the working-age population in the United States or the
domestic consumption of manufacturing): (a) average imports over the relevant period (for
convenience, all shocks are considered to extend over a 20-year period: Japan 1970–90, Mexico
1980–2000, and China 1990–2010); (b) the change in imports over the period30
; and (c) both
average changes and changes calibrated by per capita GDP in each country.
29
Appendix figure A.3 plots the same data but for a shorter period for which value-added trade data can
be computed. Gross exports overstate value-added exports for China, but they overstate them even more
for Mexico. 30
Trefler (1993) shows that cross-industry differences in protection are associated with the change in
import penetration, not its absolute value. Autor, Dorn, and Hanson (2013) use import penetration as a
share of working-age population as the measure of trade shock.
0
1
2
3
4
5
6
196
21
96
31
96
41
96
51
96
61
96
71
96
81
96
91
97
01
97
11
97
21
97
31
97
41
97
51
97
61
97
71
97
81
97
91
98
01
98
11
98
21
98
31
98
41
98
51
98
61
98
71
98
81
98
91
99
01
99
11
99
21
99
31
99
41
99
51
99
61
99
71
99
81
99
92
00
02
00
12
00
22
00
32
00
42
00
52
00
62
00
72
00
82
00
92
01
02
01
1
Sh
are
of
US
do
mes
tic a
bso
rpti
on
(p
ercen
t)
Japan
Mexico
China
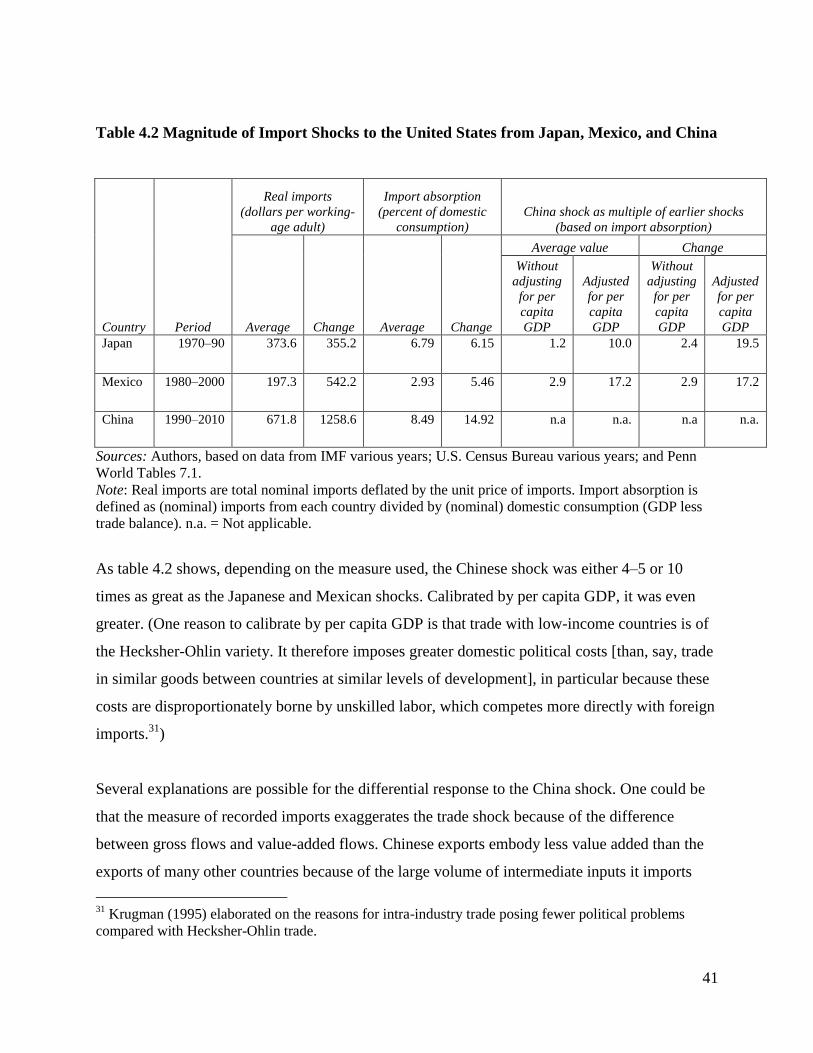
41
Table 4.2 Magnitude of Import Shocks to the United States from Japan, Mexico, and China
Country Period
Real imports
(dollars per working-
age adult)
Import absorption
(percent of domestic
consumption)
China shock as multiple of earlier shocks
(based on import absorption)
Average Change Average Change
Average value Change
Without
adjusting
for per
capita
GDP
Adjusted
for per
capita
GDP
Without
adjusting
for per
capita
GDP
Adjusted
for per
capita
GDP
Japan 1970–90 373.6 355.2 6.79 6.15 1.2 10.0 2.4 19.5
Mexico 1980–2000 197.3 542.2 2.93 5.46 2.9 17.2 2.9 17.2
China 1990–2010 671.8 1258.6 8.49 14.92 n.a n.a. n.a n.a.
Sources: Authors, based on data from IMF various years; U.S. Census Bureau various years; and Penn
World Tables 7.1.
Note: Real imports are total nominal imports deflated by the unit price of imports. Import absorption is
defined as (nominal) imports from each country divided by (nominal) domestic consumption (GDP less
trade balance). n.a. = Not applicable.
As table 4.2 shows, depending on the measure used, the Chinese shock was either 4–5 or 10
times as great as the Japanese and Mexican shocks. Calibrated by per capita GDP, it was even
greater. (One reason to calibrate by per capita GDP is that trade with low-income countries is of
the Hecksher-Ohlin variety. It therefore imposes greater domestic political costs [than, say, trade
in similar goods between countries at similar levels of development], in particular because these
costs are disproportionately borne by unskilled labor, which competes more directly with foreign
imports.31
)
Several explanations are possible for the differential response to the China shock. One could be
that the measure of recorded imports exaggerates the trade shock because of the difference
between gross flows and value-added flows. Chinese exports embody less value added than the
exports of many other countries because of the large volume of intermediate inputs it imports
31
Krugman (1995) elaborated on the reasons for intra-industry trade posing fewer political problems
compared with Hecksher-Ohlin trade.

42
and transforms into exports. Even making allowances for this distinction, however—and the
problem was arguably as acute in relation to Mexican maquiladora exports to the United
States—would hardly make a dent in the numbers presented above. 32
A second explanation could be that in the case of Mexico, the uproar was exaggerated because
there was a focal point: a trade agreement that had to be passed by the U.S. Congress. But in the
case of China, there has also been an identifiable target and identifiable policies: currency
manipulation. Moreover, Mexico was an ally, whereas China is a potential adversary and
competitor to big power status, which should have increased the outcry and concerns in domestic
U.S. politics.
A third explanation is that by the time the China trade shock arrived, the United States had
specialized so much away from unskilled labor that there was less to disturb domestically. For
example, the number of workers employed in the U.S. clothing sector declined from 900,000 in
1990 to 150,000 in 2013. In technical terms, the United States is no longer in the cone of
diversification (Edwards and Lawrence 2013). The estimates of employment disruption by
Autor, Dorn, and Hanson (2013) for the Chinese case suggest that this argument cannot be a full,
or even an important, explanation, however.
A fourth argument for the relatively muted domestic response is that the size of the Chinese
market and the strategy of openness to U.S. FDI essentially coopted U.S. companies and capital,
which had an incentive to support rather than criticize China. The Japanese experience was
different from the Chinese experience in two important respects: trade conflict with Japan
reflected head-to-head competition in some specific industries (steel, cars, semiconductors)
rather than conflict based on unequal endowments. It was U.S. capital rather than labor that was
the victim in the Japan episode; as it had unusual influence in the political process, there was
32
In appendix table A.1, the figures for China are recomputed based on value-added trade data (we cannot
do the same for the Mexican and Japanese shocks, which would bias the comparison in favor of
understating the China shock). The size of the Chinese shock declines, but it remains orders of magnitude
larger than the earlier shocks from Japan and Mexico.
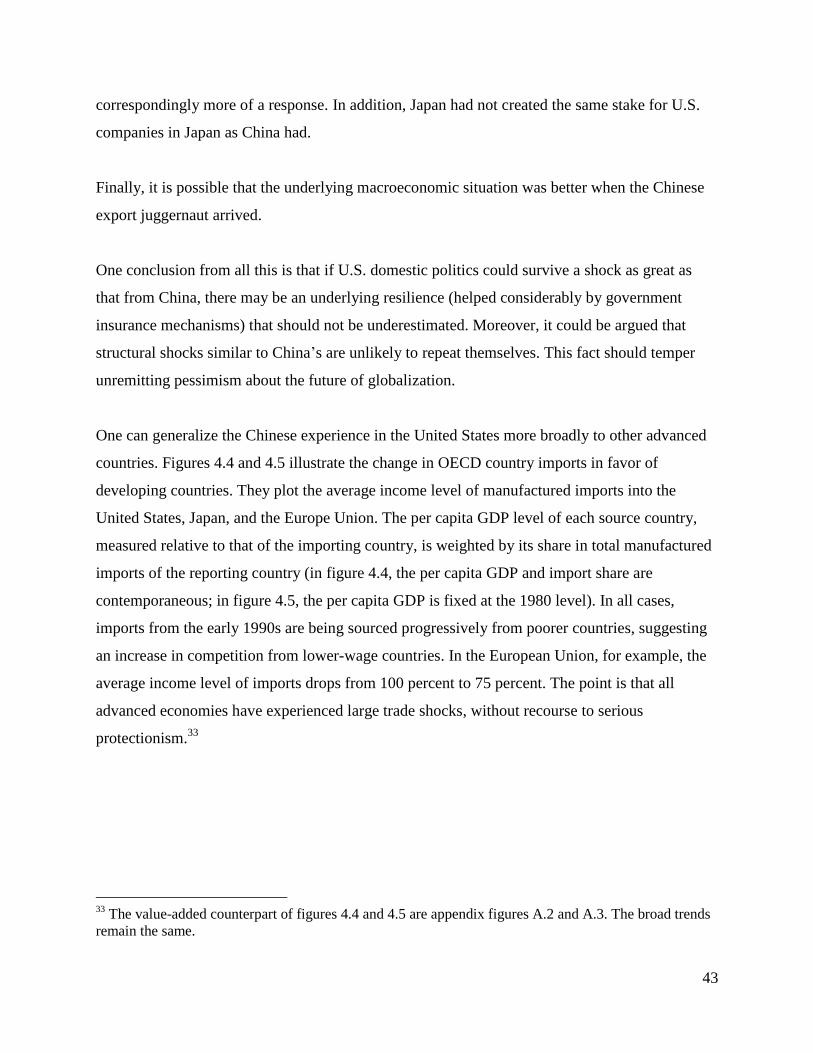
43
correspondingly more of a response. In addition, Japan had not created the same stake for U.S.
companies in Japan as China had.
Finally, it is possible that the underlying macroeconomic situation was better when the Chinese
export juggernaut arrived.
One conclusion from all this is that if U.S. domestic politics could survive a shock as great as
that from China, there may be an underlying resilience (helped considerably by government
insurance mechanisms) that should not be underestimated. Moreover, it could be argued that
structural shocks similar to China’s are unlikely to repeat themselves. This fact should temper
unremitting pessimism about the future of globalization.
One can generalize the Chinese experience in the United States more broadly to other advanced
countries. Figures 4.4 and 4.5 illustrate the change in OECD country imports in favor of
developing countries. They plot the average income level of manufactured imports into the
United States, Japan, and the Europe Union. The per capita GDP level of each source country,
measured relative to that of the importing country, is weighted by its share in total manufactured
imports of the reporting country (in figure 4.4, the per capita GDP and import share are
contemporaneous; in figure 4.5, the per capita GDP is fixed at the 1980 level). In all cases,
imports from the early 1990s are being sourced progressively from poorer countries, suggesting
an increase in competition from lower-wage countries. In the European Union, for example, the
average income level of imports drops from 100 percent to 75 percent. The point is that all
advanced economies have experienced large trade shocks, without recourse to serious
protectionism.33
33
The value-added counterpart of figures 4.4 and 4.5 are appendix figures A.2 and A.3. The broad trends
remain the same.

44
Figure 4.4 Relative Income Level of Exporters to the European Union, Japan, and United
States, 1980–2010
Sources: IMF various years; Penn World Tables 7.1.
Note: The measure represented here is the weighted average income level of exporters to the European
Union, Japan, the United States, excluding oil exporters (as defined by the IMF) and small countries
(countries with populations of less than 1 million). Income level is per capita GDP (purchasing power
parity) using the rgdpch measure in the Penn World Tables. For example, if we call this index RIEU,t for
the European Union, it is computed as
∑(
) (
)
where Mi,EU is imports by the European Union from i and is total imports by the European Union. RIJP,t
and RIUS,t are identically computed for Japan and the United States.
50
60
70
80
90
100
110
120
1980
1981
1982
1983
1984
1985
1986
1987
1988
1989
1990
1991
1992
1993
1994
1995
1996
1997
1998
1999
2000
2001
2002
2003
2004
2005
2006
2007
2008
2009
2010
Inco
me
lev
el o
f p
art
ner
s a
s a
sh
are
of
ow
n i
nco
me
lev
el
(per
cen
t) European Union
Japan
United States

45
Figure 4.5 Relative Income Level of Exporters to the European Union, Japan, and the United States
with Fixed Weights, 1980–2010
Sources: IMF various years; Penn World Tables 7.1
Note: See note to figure 4.4. GDP weights are fixed to their initial 1980 value. The fixed-weight index
becomes:
∑ (
) (
) .
The China Challenge: Bretton Woods Rules or Hyperglobalization Rules?
China will play a critical role in shaping the future of globalization, just as the United States did
in the immediate aftermath of World War II. Its economy is as large as the United States’ (in
purchasing power parity terms) is as large, and its merchandise trade is larger. Over time, unless
China implodes, the differential in economic strength will widen in its favor. Under reasonable
assumptions about growth, China will become the dominant economic trader, accounting for
twice as much trade as the United States and four times as much as Germany in 2030.
40
50
60
70
80
90
100
110
120
1980
1981
1982
1983
1984
1985
1986
1987
1988
1989
1990
1991
1992
1993
1994
1995
1996
1997
1998
1999
2000
2001
2002
2003
2004
2005
2006
2007
2008
2009
2010
Inco
me
lev
el o
f p
art
ner
s a
s a
sh
are
of
ow
n i
nco
me
lev
el (
in
per
cen
t)
European Union
Japan
United States
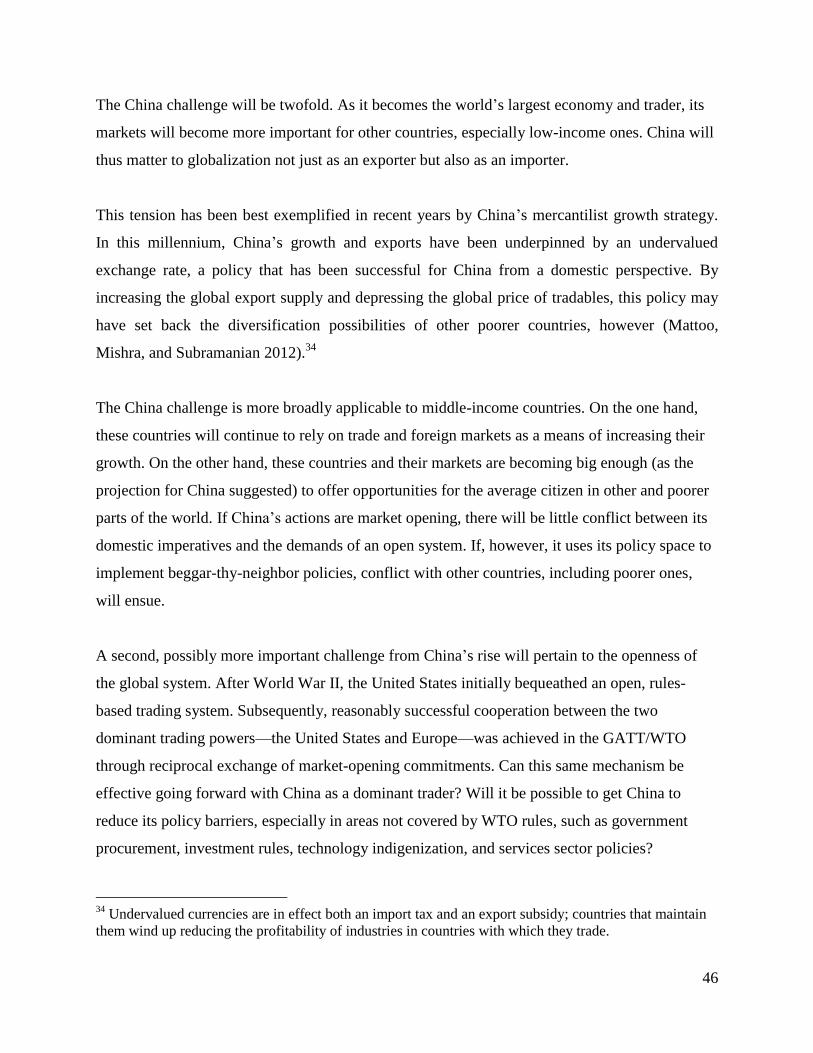
46
The China challenge will be twofold. As it becomes the world’s largest economy and trader, its
markets will become more important for other countries, especially low-income ones. China will
thus matter to globalization not just as an exporter but also as an importer.
This tension has been best exemplified in recent years by China’s mercantilist growth strategy.
In this millennium, China’s growth and exports have been underpinned by an undervalued
exchange rate, a policy that has been successful for China from a domestic perspective. By
increasing the global export supply and depressing the global price of tradables, this policy may
have set back the diversification possibilities of other poorer countries, however (Mattoo,
Mishra, and Subramanian 2012).34
The China challenge is more broadly applicable to middle-income countries. On the one hand,
these countries will continue to rely on trade and foreign markets as a means of increasing their
growth. On the other hand, these countries and their markets are becoming big enough (as the
projection for China suggested) to offer opportunities for the average citizen in other and poorer
parts of the world. If China’s actions are market opening, there will be little conflict between its
domestic imperatives and the demands of an open system. If, however, it uses its policy space to
implement beggar-thy-neighbor policies, conflict with other countries, including poorer ones,
will ensue.
A second, possibly more important challenge from China’s rise will pertain to the openness of
the global system. After World War II, the United States initially bequeathed an open, rules-
based trading system. Subsequently, reasonably successful cooperation between the two
dominant trading powers—the United States and Europe—was achieved in the GATT/WTO
through reciprocal exchange of market-opening commitments. Can this same mechanism be
effective going forward with China as a dominant trader? Will it be possible to get China to
reduce its policy barriers, especially in areas not covered by WTO rules, such as government
procurement, investment rules, technology indigenization, and services sector policies?
34
Undervalued currencies are in effect both an import tax and an export subsidy; countries that maintain
them wind up reducing the profitability of industries in countries with which they trade.

47
There may indeed be a structural problem limiting the scope for reciprocity. When the United
States and European Union dealt with each other in the postwar period, their markets were
largely open; in areas where they were closed, they were broadly closed to the same extent. This
symmetry facilitated reciprocity. In the future, problems could arise because the United States
and European Union are, in policy terms, more open than China.
China is highly open in terms of trade outcomes, and it has made great strides in removing policy
barriers as part of WTO accession. It is, however, more closed in policy terms, especially outside
the traditional goods area. In services, technology, and government procurement, closed policies
take the form of continuing state control over a large share of economic activity. According to
Borchert and others (2012), China’s services sector policies are about three times as restrictive as
those of the United States. In the retail sector, for example, China limits foreign ownership to 49
percent if the retailer has set up 30 or more stores that sell multiple types and brands of goods. In
any future bargain, the United States will, by virtue of previous liberalization, have less to offer
China.
The paradox will be that China will have greater leverage in bargaining by virtue of its much
larger volume of trade but will also have higher trade policy barriers. It is as if in a duel, one
party offers a smaller target and has a pistol with longer range. By 2020, China’s imports will be
1.5 larger than the United States’ and twice as large as Germany’s, conferring the kind of power
that comes with being able to determine access to its markets. Future bargaining will therefore be
structurally imbalanced in China’s favor, making reciprocity more difficult to achieve.
This structural imbalance will be a persistent source of tension between the United States and
China. As U.S. manufacturing sector hollows out, and the United States comes to rely to an even
greater degree on services, it will seek to open markets overseas, especially in China. If China’s
future opening is slow, over time the United States may be increasingly tempted to play the
unfairness card based on the disparate levels of policy openness: Why should our markets be
more open than those of a rival and equal?
48
This imbalance in bargaining could remain at the level of sparring and skirmishing without
systemic consequences. But suppose failures to address its structural economic problems—
stagnating median household income, rising inequality, declining economic mobility—creates a
large, disaffected, and beleaguered middle class in the United States and that the intellectual
consensus in favor of openness becomes increasingly frayed, as it has in the last few years.
Frustrated by China’s unwillingness to open the new sectors of its economy and lacking the
carrots to overcome its unwillingness, spurred by a weak economic climate and shifting
intellectual certitudes, and goaded by perceptions that China is not making its fair contribution to
keeping markets open, the United States could be tempted to threaten to close its own market to
China unless China further opens its own. In this scenario, especially if China cannot wean itself
off mercantilism and state capitalism, the scope for trade conflict and tension could increase
considerably, jeopardizing the openness of the global system.
Concerns about China’s trade policies have not been confined to rich countries. The Chinese
export juggernaut is a source of concern across the developing world. Brazil, India, Mexico,
Korea, South Africa, and other emerging market countries chafe under China’s mercantilist
exchange rate policies. Most of the antidumping actions taken by developing countries have been
against Chinese imports. And one of the dirty secrets of the Doha Round is that its collapse was
caused in part by the reluctance of emerging market countries to liberalize their economies and
expose themselves to Chinese competition.35
So a big, first-order question for the open system is how to prompt China to adopt more open
policies. The problem becomes acute if one recognizes China’s economic dominance and the
degree to which other countries have lost leverage to influence Chinese policies. A little over a
35
In 2009, China’s share of imports in the most protected sectors was substantially larger than its share of
overall imports and dwarfed that of any other supplier. Its share in these sectors was more than 70 percent
in Japan; more than 60 percent in Korea; about 55 percent in Brazil; and about 50 percent each in the
United States, Canada, and the European Union. Even in these protected sectors, China’s share increased
dramatically over the course of the Doha Round. In many importing countries (for example, Brazil, the
European Union, and the United States), China’s share more than doubled. Also striking is how much
market share China has gained even in countries such as Canada, Mexico, and Turkey, which have free
trade agreements with close and large neighbors. Thus, liberalization under the Doha agenda, especially
in the politically charged, high-tariff sectors, is increasingly about other countries opening their markets
to Chinese exports (Mattoo and Subramanian 2012a).
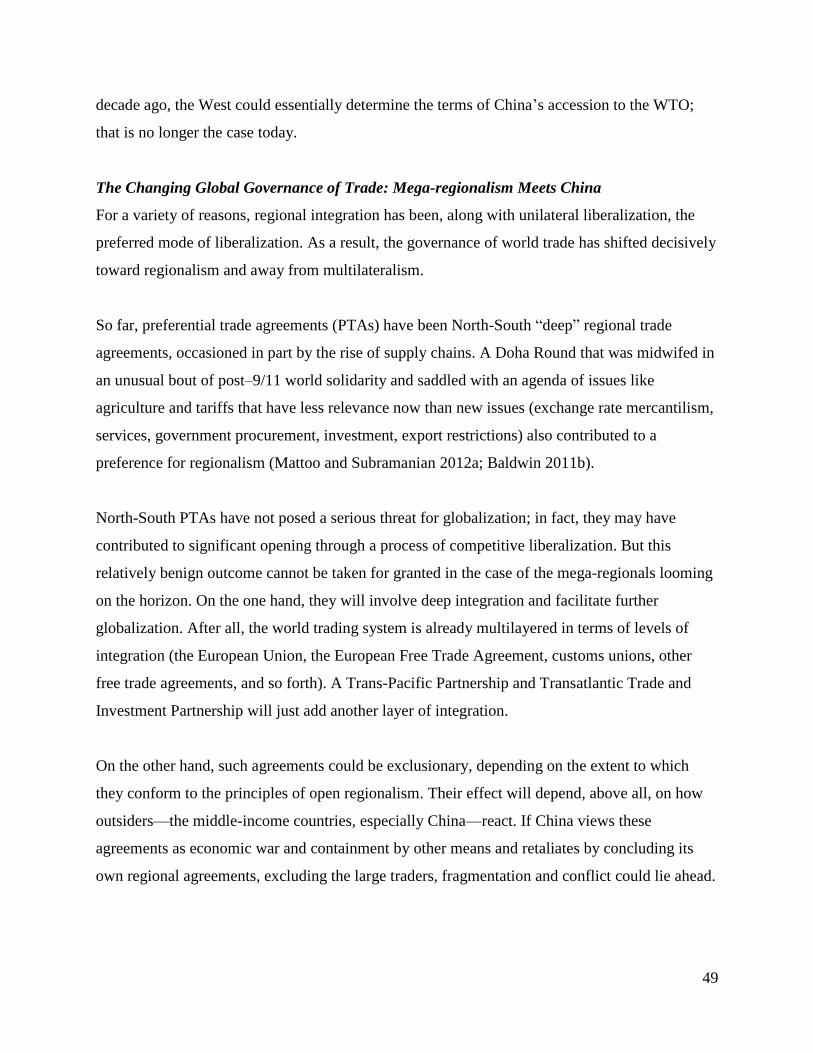
49
decade ago, the West could essentially determine the terms of China’s accession to the WTO;
that is no longer the case today.
The Changing Global Governance of Trade: Mega-regionalism Meets China
For a variety of reasons, regional integration has been, along with unilateral liberalization, the
preferred mode of liberalization. As a result, the governance of world trade has shifted decisively
toward regionalism and away from multilateralism.
So far, preferential trade agreements (PTAs) have been North-South “deep” regional trade
agreements, occasioned in part by the rise of supply chains. A Doha Round that was midwifed in
an unusual bout of post–9/11 world solidarity and saddled with an agenda of issues like
agriculture and tariffs that have less relevance now than new issues (exchange rate mercantilism,
services, government procurement, investment, export restrictions) also contributed to a
preference for regionalism (Mattoo and Subramanian 2012a; Baldwin 2011b).
North-South PTAs have not posed a serious threat for globalization; in fact, they may have
contributed to significant opening through a process of competitive liberalization. But this
relatively benign outcome cannot be taken for granted in the case of the mega-regionals looming
on the horizon. On the one hand, they will involve deep integration and facilitate further
globalization. After all, the world trading system is already multilayered in terms of levels of
integration (the European Union, the European Free Trade Agreement, customs unions, other
free trade agreements, and so forth). A Trans-Pacific Partnership and Transatlantic Trade and
Investment Partnership will just add another layer of integration.
On the other hand, such agreements could be exclusionary, depending on the extent to which
they conform to the principles of open regionalism. Their effect will depend, above all, on how
outsiders—the middle-income countries, especially China—react. If China views these
agreements as economic war and containment by other means and retaliates by concluding its
own regional agreements, excluding the large traders, fragmentation and conflict could lie ahead.

50
It is not that the WTO and multilateralism have become totally irrelevant. More and more
countries, including Russia, want to join the WTO. Its dispute settlement system functions
effectively, its basic rules are broadly respected. The question is whether it retains its relevance
as a key forum for facilitating further liberalization or transforms itself into an institution that
serves mainly as a court of trade law and an overseer of regional trade.
The (Non) Challenge of Low-Income Countries
The antiglobalization and anti–WTO crusade of the 1990s (culminating in the protests in Seattle
in 1998) forced policy makers into a strenuous defense of the development friendliness of the
trading system. The Doha Round, for example, was formally dubbed the Doha Development
Agenda, which seems an overdone title.
The perception that the trading system is unfair to low-income countries stems from the fact that
rich country trade barriers are highest in agriculture and low-skilled manufacturing (textiles,
clothing, and footwear), which tend to be important exports for low-income countries. This
situation changed over the last decade or so. Rich country barriers in these sectors declined in the
aftermath of the Uruguay Round, with Canada, the European Union, the United States, and Japan
all significantly improving preferential access to low-income countries, in terms of both country
and product coverage (the European Union’s Everything But Arms and the United States’ Africa
Growth and Opportunity Act are two notable examples). In some cases, these schemes also
became less arbitrary.
As a consequence, low-income countries are at worst treated no worse than the typical country
and at best treated better. Nearly all low-income countries (“least developed countries,” in the
jargon of the trading system) face lower trade barriers than most other countries, because they
receive generous preferences (albeit with some problems, depending on which country is
granting them). There are some exceptions to these preferences (Bangladesh and Cambodia in
clothing; West African countries facing rich country cotton subsidization). But even these
exceptions create a situation only of parity with other countries. Increasingly, larger developing
countries have also started granting preferential access to low-income countries, although the
coverage and magnitude of this access are limited.

51
Hoekman and Nicita (2008) calculate that the average barriers facing exports of Sub-Saharan
Africa are very low and much lower than for other countries. The average level of restrictiveness
(including nontariff measures) that exports from Sub-Saharan Africa face in other markets—4.4
percent in high-income countries and 6.0 percent in upper-middle-income countries, taking
account of preference margins—is consistently lower than for any group. The comparable
numbers are 6.3 and 15.6 percent for high-income countries as exporters and 5.7 percent and
11.8 percent for upper-middle-income countries as exporters. (An exception is South Asia, which
faces higher barriers because its exports face higher MFN tariffs and because countries such as
India and Bangladesh are not included in the major preferential schemes, especially in the United
States.)
Low-income countries also receive considerable space to pursue their own policies. In relation to
rules on subsidies, intellectual property, and local content requirements, the least developed
countries face weaker obligations. Moreover, the thresholds for taking contingent protectionist
action (countervailing and antidumping) against exports of low-income countries are generally
higher.
So it is not clear what more could be done for low-income countries internationally that would
materially alter their growth prospects (box 4.1). Their growth challenges are predominantly
domestic, as Dani Rodrik’s paper in this volume implies. Even recognizing the important point
that Baldwin (2011a makes—that these countries need to get on to the new supply chains—it is
not clear what other countries might do to galvanize this process, especially if the supply chain
phenomenon is to some extent about geography.
_____________________________________________________________________________
Box 4.1 Helping Low-Income Countries in New Ways
Discussions of trade by low-income countries increasingly focus on supply chains. Summarizing a new
report, Enabling Trade: Valuing Growth Opportunities, Hoekman (2013, p.13) suggests that “reducing
supply chain barriers could increase global GDP up to six times more than removing all import tariffs.
Estimates suggest that an ambitious improvement in two key components of supply chain barriers—
border administration and transport and communications infrastructure—with all countries raising their
performance halfway to global best practice (as observed in Singapore), would lead to an increase of
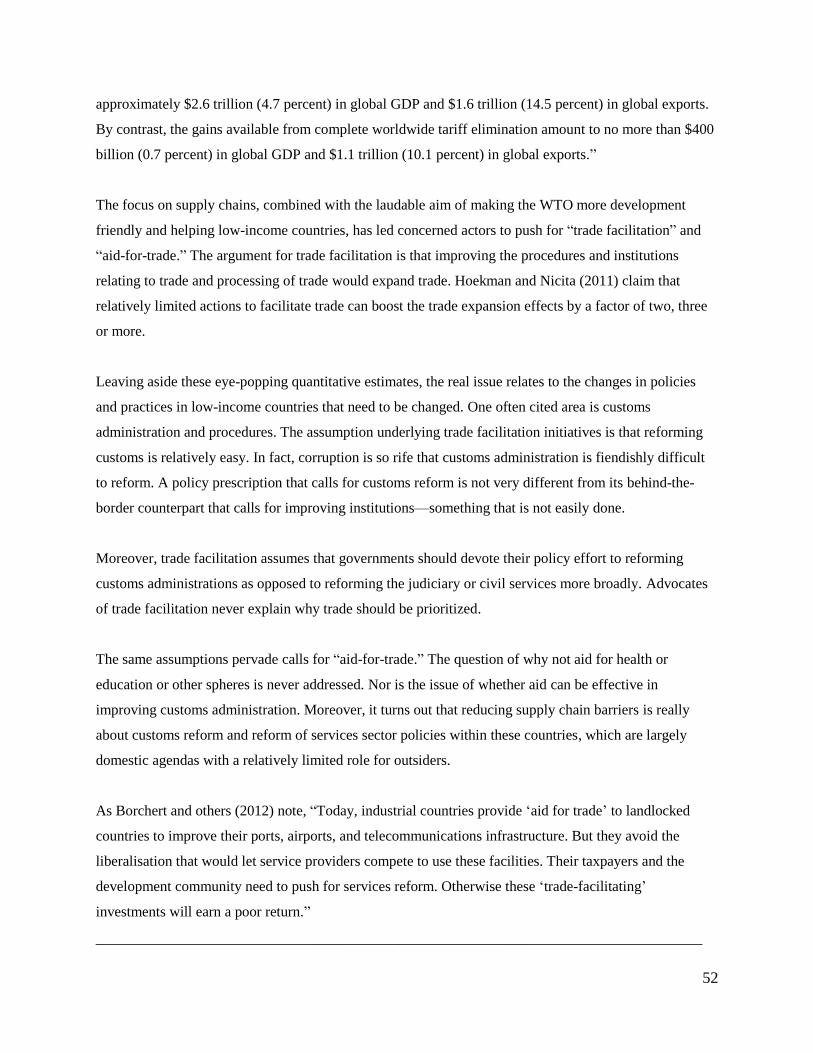
52
approximately $2.6 trillion (4.7 percent) in global GDP and $1.6 trillion (14.5 percent) in global exports.
By contrast, the gains available from complete worldwide tariff elimination amount to no more than $400
billion (0.7 percent) in global GDP and $1.1 trillion (10.1 percent) in global exports.”
The focus on supply chains, combined with the laudable aim of making the WTO more development
friendly and helping low-income countries, has led concerned actors to push for “trade facilitation” and
“aid-for-trade.” The argument for trade facilitation is that improving the procedures and institutions
relating to trade and processing of trade would expand trade. Hoekman and Nicita (2011) claim that
relatively limited actions to facilitate trade can boost the trade expansion effects by a factor of two, three
or more.
Leaving aside these eye-popping quantitative estimates, the real issue relates to the changes in policies
and practices in low-income countries that need to be changed. One often cited area is customs
administration and procedures. The assumption underlying trade facilitation initiatives is that reforming
customs is relatively easy. In fact, corruption is so rife that customs administration is fiendishly difficult
to reform. A policy prescription that calls for customs reform is not very different from its behind-the-
border counterpart that calls for improving institutions—something that is not easily done.
Moreover, trade facilitation assumes that governments should devote their policy effort to reforming
customs administrations as opposed to reforming the judiciary or civil services more broadly. Advocates
of trade facilitation never explain why trade should be prioritized.
The same assumptions pervade calls for “aid-for-trade.” The question of why not aid for health or
education or other spheres is never addressed. Nor is the issue of whether aid can be effective in
improving customs administration. Moreover, it turns out that reducing supply chain barriers is really
about customs reform and reform of services sector policies within these countries, which are largely
domestic agendas with a relatively limited role for outsiders.
As Borchert and others (2012) note, “Today, industrial countries provide ‘aid for trade’ to landlocked
countries to improve their ports, airports, and telecommunications infrastructure. But they avoid the
liberalisation that would let service providers compete to use these facilities. Their taxpayers and the
development community need to push for services reform. Otherwise these ‘trade-facilitating’
investments will earn a poor return.”
____________________________________________________________________________

53
For low-income countries, a trading system that allows them policy space to pursue appropriate
growth strategies and that at the same time keeps global markets open for their exports is critical.
After all, such was the external environment that allowed today’s middle-income countries to
prosper. Despite the tightening of trade rules since the formation of the WTO, there remains
enough policy space for these rules not to become a straitjacket for today’s low-income
countries. Apart from some specific issues (such as food security), the real concern will be
whether the external environment will remain as benign as in the previous two decades, so that
low-income countries can export their way to growth. The actions of high- and middle-income
countries will be critical.
5. Policy Responses
The key challenges facing globalization are sustaining domestic support for it in the West and
ensuring that China continues to open its markets. Open markets in China are an important part
of China’s domestic agenda for sustaining convergence. They also offer opportunities for poorer
countries similar to those that China enjoyed in industrial countries over the last few decades.
They are critical to keeping the trading system open and free of serious conflict. The challenge of
mega-regionalism is related to the China challenge.
National Responses
Sustaining and furthering globalization will be determined at the national rather than the
international level. For the United States and Europe, actions are needed to revive growth and
address fiscal challenges, especially the challenges stemming from growing entitlements. For the
United States, there is the additional challenge of addressing the problems of stagnating wages,
rising inequality, and declining mobility. Success on these fronts will provide a surer guarantee
that globalization will proceed apace. Several studies note that the demand for trade protection is
inversely and robustly related to the state of the economy (see Rodrik 1998).
For its part, China should have a stake in preserving the open system for the simple reason that
its rapid economic transformation over the last three decades was predicated crucially on
openness. That transformation is still far from complete: China’s standard of living is still only
20–25 percent that of industrial countries. Completing that transformation is critical for the
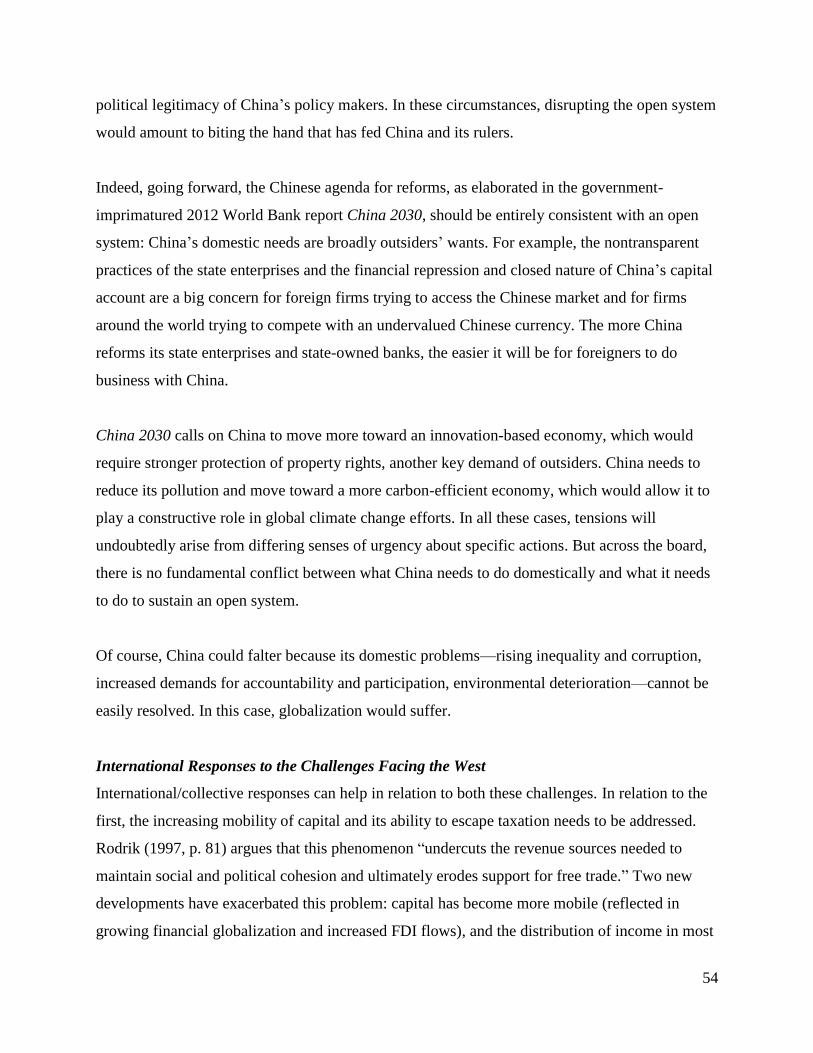
54
political legitimacy of China’s policy makers. In these circumstances, disrupting the open system
would amount to biting the hand that has fed China and its rulers.
Indeed, going forward, the Chinese agenda for reforms, as elaborated in the government-
imprimatured 2012 World Bank report China 2030, should be entirely consistent with an open
system: China’s domestic needs are broadly outsiders’ wants. For example, the nontransparent
practices of the state enterprises and the financial repression and closed nature of China’s capital
account are a big concern for foreign firms trying to access the Chinese market and for firms
around the world trying to compete with an undervalued Chinese currency. The more China
reforms its state enterprises and state-owned banks, the easier it will be for foreigners to do
business with China.
China 2030 calls on China to move more toward an innovation-based economy, which would
require stronger protection of property rights, another key demand of outsiders. China needs to
reduce its pollution and move toward a more carbon-efficient economy, which would allow it to
play a constructive role in global climate change efforts. In all these cases, tensions will
undoubtedly arise from differing senses of urgency about specific actions. But across the board,
there is no fundamental conflict between what China needs to do domestically and what it needs
to do to sustain an open system.
Of course, China could falter because its domestic problems—rising inequality and corruption,
increased demands for accountability and participation, environmental deterioration—cannot be
easily resolved. In this case, globalization would suffer.
International Responses to the Challenges Facing the West
International/collective responses can help in relation to both these challenges. In relation to the
first, the increasing mobility of capital and its ability to escape taxation needs to be addressed.
Rodrik (1997, p. 81) argues that this phenomenon “undercuts the revenue sources needed to
maintain social and political cohesion and ultimately erodes support for free trade.” Two new
developments have exacerbated this problem: capital has become more mobile (reflected in
growing financial globalization and increased FDI flows), and the distribution of income in most
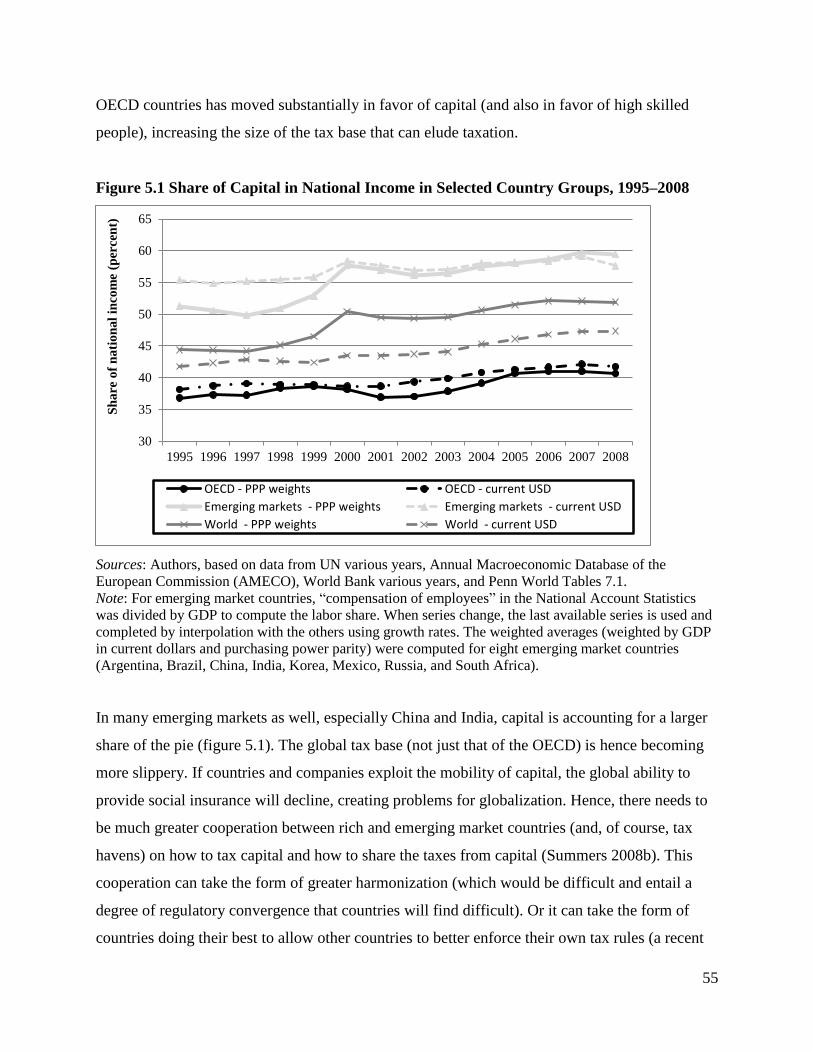
55
OECD countries has moved substantially in favor of capital (and also in favor of high skilled
people), increasing the size of the tax base that can elude taxation.
Figure 5.1 Share of Capital in National Income in Selected Country Groups, 1995–2008
Sources: Authors, based on data from UN various years, Annual Macroeconomic Database of the
European Commission (AMECO), World Bank various years, and Penn World Tables 7.1.
Note: For emerging market countries, “compensation of employees” in the National Account Statistics
was divided by GDP to compute the labor share. When series change, the last available series is used and
completed by interpolation with the others using growth rates. The weighted averages (weighted by GDP
in current dollars and purchasing power parity) were computed for eight emerging market countries
(Argentina, Brazil, China, India, Korea, Mexico, Russia, and South Africa).
In many emerging markets as well, especially China and India, capital is accounting for a larger
share of the pie (figure 5.1). The global tax base (not just that of the OECD) is hence becoming
more slippery. If countries and companies exploit the mobility of capital, the global ability to
provide social insurance will decline, creating problems for globalization. Hence, there needs to
be much greater cooperation between rich and emerging market countries (and, of course, tax
havens) on how to tax capital and how to share the taxes from capital (Summers 2008b). This
cooperation can take the form of greater harmonization (which would be difficult and entail a
degree of regulatory convergence that countries will find difficult). Or it can take the form of
countries doing their best to allow other countries to better enforce their own tax rules (a recent
30
35
40
45
50
55
60
65
1995 1996 1997 1998 1999 2000 2001 2002 2003 2004 2005 2006 2007 2008
Sh
are
of
na
tio
na
l in
com
e (p
ercen
t)
OECD - PPP weights OECD - current USD
Emerging markets - PPP weights Emerging markets - current USD
World - PPP weights World - current USD

56
example involved Switzerland relaxing its secrecy laws to allow the United States to go after its
tax evaders).
International Responses to the Challenge of China and Mega-Regionalism
The China challenge is a broader problem of cooperation in the face of a shift in economic power
from the United States and Europe toward a rising one. It is in this context that even the new
attempt at mega-regional agreements (Trans-Pacific Partnership and Transatlantic Trade and
Investment Partnership) must be seen. At one level, these agreements are about deepening
integration at a time when the multilateral liberalization process has become moribund and the
Doha Round remains in cold storage. At another level, the issue is how the United States and
European Union deal with the rise of China.36
At the risk of overgeneralizing, the challenge in the trade arena can be summarized as follows:
China is happy with the status quo and the United States is not. China—and the other larger
emerging markets, such as Brazil, India, and Russia—is reasonably content to have Bretton
Woods rules apply to it and hyperglobalization rules apply to its large partners. China will
liberalize and open up its markets in line with domestic rather than external imperatives. Its
partners, especially the United States, will increasingly refuse to acquiesce in this status quo. But
given China’s dominance and the weakness of the United States, the United States’ ability to
force or induce China to change will be limited. The mega-regionalism demarche of the United
States is an attempt to exert pressure on China.
How can these differing perspectives and positions be reconciled? The larger partners of the
United States and China need to deploy a strategy that takes account of the possibility that China
may occasionally be tempted into a less than-benign economic hegemony while reinforcing its
incentives to act to preserve an open economic system.
36
In the case of the Trans-Pacific Partnership, containment is more political. With the Transatlantic Trade
and Investment Partnership, agreement by the United States and the European Union to common
regulatory standards would preempt China from imposing its standards in international markets and even
force China to adhere to these common standards.
57
The possibility of the misuse of hegemony would not be unique to China. It was famously said of
the United Kingdom that Britannia ruled the waves by waiving the rules. The United States also
occasionally succumbed to this temptation. In 1955, it excluded agriculture from GATT
disciplines. In the early 1970s, it unilaterally blew up the Bretton Woods system when it became
a straitjacket on domestic U.S. policies. In the 1980s and 1990s, it cajoled and coerced
developing countries to take on costly obligations (relating to intellectual property and capital
flows, for example). In the dark Nietschzean view that “power is never held in innocence,”
misuse of hegemony is intrinsic to hegemony. It is inevitable given the infinite capacity for
countries to succumb to the delusion that John Adams memorably warned about, that “power
always thinks it has a great soul.”
History suggests that the best defense against hegemony is multilateralism, which offers a
modicum of protection for the weak against the dominant power. Keeping China tethered to the
multilateral system, in which the United States and other major countries can exercise some
countervailing influence, offers the best insurance against its unrestrained exercise of hegemony.
Multilateralism could work as a defense against China in several ways: in shaping rules, in
promoting adherence to them, and more broadly in defining legitimate behavior. With China’s
growing size, the balance of negotiating power will be with China rather than its partners.
Multilateralism ensures that China’s trading partners will have enough heft to negotiate with
China in a more balanced manner. For example, China might be willing to open its markets in
return for the United States, European Union, India, and Brazil opening theirs. Its willingness to
open up in a similar manner in negotiations with just the United States or European Union or
with some less powerful combination is far from clear.
A similar argument carries over to enforcement and the incentives to adhere to previously agreed
upon rules. China’s incentive to abide by multilateral rules will be stronger than its incentive to
abide by a series of bilateral agreements, because the reputational costs of being seen as errant
are much greater in the multilateral context. The opprobrium of being a deviant from multilateral
norms is China’s great fear, rendering multilateralism the best weapon the world can deploy
against a dominant China.

58
These arguments for multilateralism have an important corollary for the United States and other
countries. They imply less recourse to bilateral and regional dealings with China and with each
other. The more countries elevate the role of bilateralism in dealings with China, the less China
will be anchored in the multilateral system and the more exposed countries will be to the exercise
of Chinese dominance. One operational consequence, advocated by Lieberthal and Wang (2012),
is to expand the U.S.–China strategic economic dialogue to include the larger countries in the
world—Europe, Japan, Brazil, and India, for a start—whose heft can be an effective
counterweight to that of China.
These arguments in favor of multilateralism and against regionalism and bilateralism apply
across the board in the fields of currency, finance, and trade. But they carry particularly
important implications in the field of trade because of the current environment, in which the
WTO appears moribund and regional initiatives are flourishing. The recent trade initiatives of the
Obama administration—the Trans-Pacific and Trans-Atlantic partnerships—are regional
initiatives. As box 5.1 suggests, they are particularly fraught in the context of a rising China.
_____________________________________________________________________________
Box 5.1 Multilateralism versus Regionalism: The Risks from the Trans-Pacific Partnership
In the old debate between regionalists and multilateralists, the divide was not about the end-point: all
parties wanted global free trade. Rather, the divide was over whether regional agreements would be, in
Jagdish Bhagwati’s words, a building block or a stumbling block in the way of that goal, with the
regionalists falling in the former category and the multilateralists in the latter.
Regionalists would point to the evident success of regionalism in achieving deeper liberalization: in many
or most cases, border barriers have been eliminated in goods and services, and in some, behind-the-border
barriers have also been addressed. But both forms of regionalism involving China render this old debate
less relevant.
No major country has yet embraced regional agreements with China (although the Association for
Southeast Asian Nations [ASEAN] has embarked on this path). The arguments against regionalism are
really the flip side of the arguments for multilateralism: negotiating with China will lead to agreements
that are weighted in favor of China, because it has bargaining power. If the basic problem is the

59
imbalance of leverage arising from China’s size, regionalism will by definition be less effective than
multilateralism. For the same reason, getting China to adhere to these agreements will also be difficult.
But countries are increasingly negotiating agreements around China, with the Trans-Pacific Partnership
representing the best recent example. Advocates of regionalism have long relied on the competitive
dynamic it creates: if two countries negotiate preferential reductions of barriers, one or several outsiders
will be hurt. These outsiders will then have an incentive to negotiate preferential agreements themselves.
This process would will until the goal of global free trade is achieved—or so went the Bergsten-Zoellick
theory of regionalism as promoting competitive liberalization.
But consider three ways in which the Trans-Pacific Partnership might play out. In the first, the United
States embarks on a process of deep integration with a number of Asia Pacific countries without China.
To avoid the dangers of hostile regionalism (that is, excluding China), Trans-Pacific Partnership countries
could subscribe to the principle of open regionalism: countries get all of the agreement’s benefits only if
they embrace its terms.
The problem with this approach is that China would never agree to fall in line with rules it did not
participate in negotiating. For example, if Trans-Pacific Partnership members negotiated rules against
undervalued exchange rates, China would probably stay away. If it did, the agreement would hardly
achieve the objective of disciplining problematic Chinese policies that adversely affect the open character
of the trading system.
In the second scenario, the United States invites China to the Trans-Pacific Partnership negotiating table
to be part of the process of creating the rules. Would its participation really be superior to negotiating
with China multilaterally, where the European Union, Brazil, and India would also be at the table? If the
problem of a rising China is that it will have enormous bargaining power by virtue of its economic size
and dominance, then a multilateral process will add more negotiating heft on the other side of the
negotiation. How can it not help to have Brazil and India and Europe as part of the group putting pressure
on China to create better rules and to adhere to them? Of course, there is no guarantee that Brazil and
India will always be on the side applying pressure on China. But where important interests are at stake,
they are likely to do so.
In the much worse third scenario, China construes the Trans-Pacific Partnership as an act of hostile
regionalism (Yao Yang’s [2013] reaction is typical of this perception) and negotiates preferential
60
agreements of its own—with, say, the European Union alone. Such a situation would create significant
trade diversion for U.S. and other exporters because of high Chinese levels of protection in certain areas.
The Trans-Pacific Partnership could thus provoke China into playing the regionalism game in a way that
could fundamentally fragment the trading system. Down this path lies the folly of the interwar years.
In sum, the Trans-Pacific Partnership will either exclude China (and open regionalism may have little
sway in persuading China to join) or be less effective in engaging China, because it would exclude other
large trading countries (the European Union, Brazil, and India), whose collective heft might be crucial in
balancing the bargaining power of China. The lesson is that the success of regionalism in reducing
barriers and generating the competitive dynamic for further liberalization simply cannot be applied to
China. The successes of regionalism typically involved a big economic power (the United States, the
European Union, Japan) negotiating with smaller countries. The smaller countries did most of the
incremental liberalization, because the larger countries held the balance of negotiating power and
influence. With China, the power balance is reversed, rendering many of the old arguments for
regionalism obsolete.
Regional and discriminatory solutions carry greater risks. The challenge of anchoring China in
the multilateral trading system—as well as providing a fillip to growth in industrial countries
through further liberalization—can be addressed by embarking on a new and comprehensive
multilateral initiative. This initiative would anticipate the changing interests and concerns of all
the big trading nations in a way that the Doha agenda did not. It would also pave the way for a
reciprocal liberalization mechanism—you open your markets in return for my opening mine—
that has been the basis for previous successes in the trading system.
To achieve this reciprocity, first and foremost, the world should declare that the Doha Round is
dead and place a wider range of issues on the agenda. China’s trading partners remain concerned
by Beijing’s exchange rate policies, as well as the protection and discrimination that stem from
China’s state capitalism. China and other countries have an interest in ensuring that their exports
are not subject to antidumping and trade restrictions, uncertainty from investment regulations,
and international rules on subsidies in relation to climate change.
61
Everyone has an interest in preventing export protectionism, liberalizing trade in goods and
services, and opening government procurement markets. To achieve these goals, Mattoo and
Subramanian (2012a) call for a new China Round of multilateral negotiations focused on some of
these issues, with participation (initially) by a core group or critical mass of large trading
countries (Low 2012).
Any new initiative will have to break from the past in one key respect. Countries in the West
have been the drivers of past trade negotiations. China and the other big emerging market
countries must now take the lead in negotiating further multilateral liberalization (the alternative,
an orderly retreat from globalization, is explored with some skepticism in box 5.2). If they do
not, there is the risk that mega-regional agreements will spread, which would be detrimental to
the excluded larger emerging markets.
Box 5.2 Is an Orderly Retreat from Globalization Possible?
In discussing the challenges of globalization, the possibility of a retreat from it must not be ignored. A
meaningful and consequential retreat would have to be led by the major trading powers, especially the
United States, Europe, and China. If it is sparked by political or security conflicts, there can by definition
be no orderly retreat.
One recent historical did represent a retreat from globalization. Although not close to the severity of
protectionism seen during the 1920s and 1930s, the 1980s experience of U.S.–Japan trade relations is
nevertheless instructive. In the wake of the recessions in the early 1980s and the appreciation of the dollar
through 1985, the United States became more protectionist (Destler 1992). This protectionism took
several forms. Some actions were consistent with the letter if not the spirit of international rules (for
example, recourse to antidumping and countervailing duties). Other actions clearly violated the rules (for
example, getting Japan to impose voluntary export restraints) or involved the threat of illegal trade
sanctions to persuade/coerce Japan to open up its own market. This experience suggests that it will be
difficult to craft rules ex ante that bind the very players that have the power to violate or disregard them in
the very circumstances that create the greatest incentives to do so.

62
6. Concluding Thoughts on the Future of Trade Integration and Cooperation
Can and will the ongoing process of hyperglobalization of goods and services continue? Or, to
use Keynes’ evocative phrase, might there be “serpents to the paradise” of the ongoing process
of hyperglobalization?
Why Optimism about Globalization?
Although trade has been rising rapidly, the process is less than half complete. On a value-added
basis, the world trade-to-GDP ratio is about 25 percent. but a simple frictionless gravity model
predicts that the theoretical maximum should be substantially greater.37
At least three forces will
drive globalization toward and sustain it at higher levels: economic convergence; technology;
and interests, ideas, and institutions.
Economic convergence
As more countries continue to grow and to grow more rapidly, trade will increase, as figure 2.4
illustrates. Clearly, the pace of globalization will be affected by the pace of convergence. If
Rodrik’s more sober assessment prevails, the pace of globalization may slow, but it will not be
reversed. If the pace described in table 2.1 is sustained, so, too, will the ongoing
hyperglobalization.
Technology
Predicting the pace of technological progress is impossible. Revolutions in transportation, and
then in information and communication technologies, have driven trade globalization. Even if the
pace of new discoveries slows, there is scope for the spread of existing technologies, both
directly and embodied in FDI. Mobile telephony, Internet usage, and connectivity are still far
from universal (Aker and Mbiti 2010).
37
Recall that this model suggests that the ratio of world trade-to-GDP should be 1 minus the sum of the
squared shares of countries in world output. With convergence and a sufficiently large number of
countries, the sum of squared shares should converge to 0, and the ratio of world trade to GDP should
converge to 1.
63
Interests, ideas, and institutions
Bhagwati (1988) identifies a set of factors he calls the three I’s: interests, ideas, and institutions.
The very fact of hyperglobalization deepens the enmeshing of interests across countries, people,
and companies. In the current phase, the additional reinforcing factor relates to the phenomenon
of criss-crossing globalization discussed earlier.
One of the widely noted features of the global financial crisis was the drop in trade that exceeded
the decline in the aftermath of the Great Depression. Yet unlike in the past, the world did not
collapse into a protectionist spiral.38
One reason why this collapse did not occur was that
countries, no longer tied to the gold standard or otherwise straitjacketed, had broader
macroeconomic policy options. Another reason was that the vertical integration of production via
supply chains made it difficult and undesirable for countries to impose barriers that would
undermine these chains and hence trading opportunities.
The supply chain phenomenon has a broader counterpart. Not only goods moving back are and
forth—capital flows are, too. FDI flows no longer just flow downhill from rich to poor countries.
Brazil, China, and India are all becoming large exporters of FDI. As capital relocates
internationally, the political economy of protectionism also changes. U.S. firms in China have
lobbied strongly against U.S. trade action against China. India can now less afford to repel FDI if
Indian companies at the same time seek to operate in and from foreign markets (Mattoo and
Subramanian 2010).
The recent crises provoked an existential debate about capitalism and finance, but the ideological
near-consensus that trade in goods and services as well as FDI should flow relatively unimpeded
has not been dented.
Is There Reason to Be Sanguine about Trade?
The cardinal sin of forecasting is to extrapolate the recent past, as Norman Angell, future Nobel
Peace Prize winner, did in 1910, when he published The Great Illusion. This pamphlet-turned-
38
Global Trade Alert (2012) suggests that there was an upsurge in protectionism after the global financial
crises, the quantitative impact of which remains far from clear. Hufbauer and others (2013) document the
rise of local content requirements in a number of countries.

64
book acquired cult status for propagating the view that Europe had become so interlaced
economically through trade, credit, and finance that war was impossible. Twentieth century wars
would be so economically devastating even to the aggressor that waging one would amount to
self-inflicted folly.39
Notwithstanding the five influences discussed above, history’s lesson is that “we cannot be 100
percent certain that the enmeshing of interests will be strong enough to sustain the status quo.
Nor is there a cast-iron guarantee that the current ideological embrace of markets as the
predominant basis for organizing economic relations will survive the vicissitudes of intellectual
fashion and the selective and self-serving interpretations of policymakers. There is tail-side risk
(that is, a small, but nontrivial probability of catastrophic outcomes) that interests, ideology, and
institutions, both domestic and international, will be the inadequate to the task of preserving the
current system. And then there is always the unforeseeable and the irrational. World War I, after
all, did happen” (Subramanian 2011, p. 170).
Section 5 discussed the factors that become serpents in the paradise of hyperglobalization. They
include prolonged weakness in the West, a serious domestic shock in China that precipitates a
retreat there, and the vacuum in international governance. The status quo power is in economic
decline, and the rising power will prioritize domestic interests over international responsibilities
to a greater degree than previous superpowers, because it is still only a middle-income country.
Another unforeseeable factor is the politics and projects of militarism and imperialism (for
example, a conflict between China and Japan), which could set back globalization.
Most of the actions that will allow positive influences to prevail over globalization-reversing
ones will be at the national level: actions to address economic decline in the West and sustain
growth in the Rest, especially China. Collective action should help strengthen the institutional
underpinnings of globalization. These actions include ensuring that domestic social insurance
mechanisms are not undermined by globalization and bolstering multilateral institutions to
prevent conflict between the major trading partners. Greater cooperation on taxes may become
39
In the words of Lord Esher, Angell’s most earnest disciple, the inevitable consequences of “commercial
disaster, financial ruin, and individual suffering” would be “pregnant with restraining influences.”

65
necessary to preserve funding for these mechanisms. The world should declare the Doha Round
dead in order to move to more meaningful multilateral negotiations to address emerging
challenges, including any possible threats from new mega-regional agreements. The rising
powers, especially China, will have a key role to play to resuscitate multilateralism.
The open, rules-based trading system has delivered immense benefits for all, especially today’s
emerging market economies. Preserving it will ensure that low-income countries can also make
successful growth transitions. It is often overlooked that the international trading system has
witnessed more successful cooperation, especially between the systemically important countries,
than the international financial and monetary system. So cooperation to preserve globalization,
even if not in its most hyper current incarnation, is of critical importance. It may also prove less
difficult.

66
Appendix A
Measuring Value-Added Trade
In national account systems, trade is measured in gross terms, meaning that an export from a
country is counted at its full value, whether this value was produced in the country or imported in
part from another country (via foreign purchases of intermediate goods). It is thus possible to
count a good that crosses frontiers at multiple stage of its production several times.
This accounting lies in contrast to the way in which GDP is computed. It is measured in terms of
value added: the value of the intermediates used in production is subtracted from the value of the
final good.
This distinction between gross and value-added trade has assumed significance in wake of the
ongoing process of the slicing up of the value chain across national boundaries. Slicing up is not
a new phenomenon, but its magnitude has accelerated sharply in recent years, increasing the
importance of proper measurement. Recent attempts have been made to correct this discrepancy
and measure a consistent index of “value-added trade” by linking trade data and input-output
tables. The basic idea is to link sources and uses of goods and services to be able to trace to its
origin the value-added embodied in an exported good.
Johnson and Noguera (2012) use estimates for 42 countries since 1970; their table 7 is the source
of the value-added trade data in figure 2.1 in this paper. They use the concept of value-added
exports (VAX), the ratio of value added in the country and exported to total exports. Recent
research has refined the understanding of value-added trade by distinguishing various stages of
production and trade (Koopman, Wang, and Wei, 2013). In this paper, for reasons of simplicity,
we adopt the VAX approach. To calculate the value-added trade data presented in the tables and
figures presented in this appendix, we used the publicly available World Input Output Tables
(available at http://www.wiod.org/database/iot.htm). These data span 15 years (1995–2009) and
include 40 countries (including 27 EU countries and large developed and emerging market
economies as well as a “rest of the world” aggregate), which represent 85–90 percent of global
GDP.
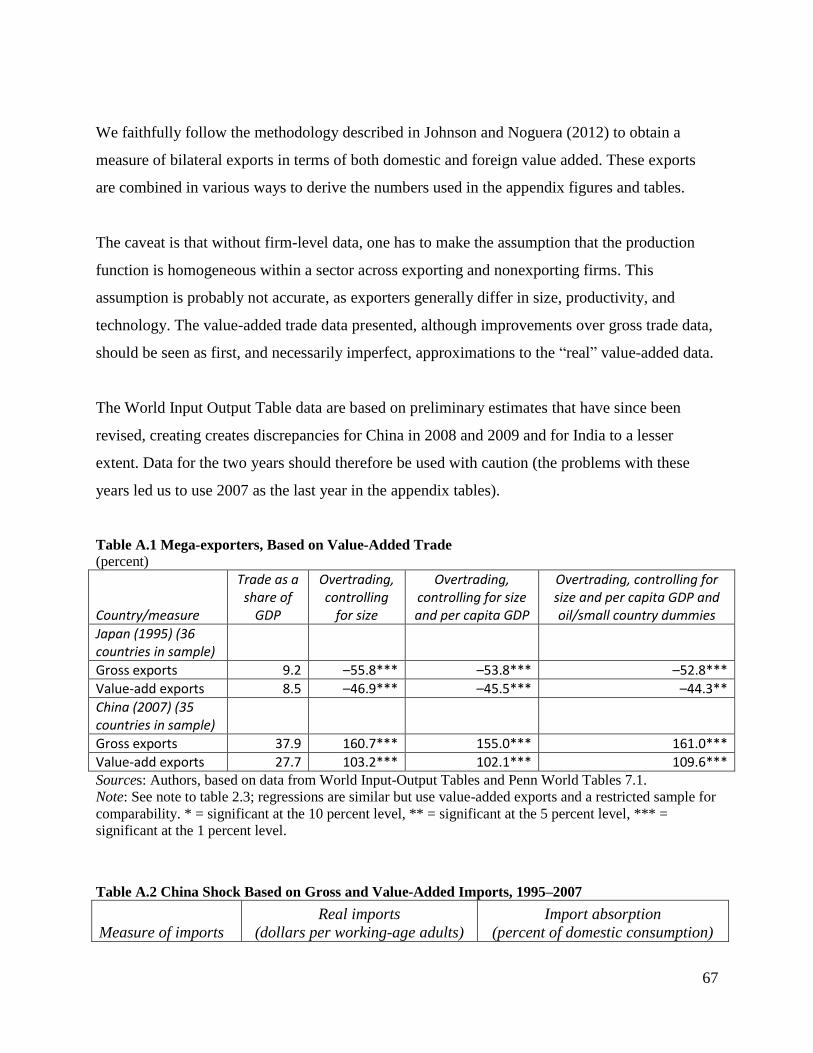
67
We faithfully follow the methodology described in Johnson and Noguera (2012) to obtain a
measure of bilateral exports in terms of both domestic and foreign value added. These exports
are combined in various ways to derive the numbers used in the appendix figures and tables.
The caveat is that without firm-level data, one has to make the assumption that the production
function is homogeneous within a sector across exporting and nonexporting firms. This
assumption is probably not accurate, as exporters generally differ in size, productivity, and
technology. The value-added trade data presented, although improvements over gross trade data,
should be seen as first, and necessarily imperfect, approximations to the “real” value-added data.
The World Input Output Table data are based on preliminary estimates that have since been
revised, creating creates discrepancies for China in 2008 and 2009 and for India to a lesser
extent. Data for the two years should therefore be used with caution (the problems with these
years led us to use 2007 as the last year in the appendix tables).
Table A.1 Mega-exporters, Based on Value-Added Trade
(percent)
Country/measure
Trade as a share of
GDP
Overtrading, controlling
for size
Overtrading, controlling for size and per capita GDP
Overtrading, controlling for size and per capita GDP and oil/small country dummies
Japan (1995) (36 countries in sample)
Gross exports 9.2 –55.8*** –53.8*** –52.8***
Value-add exports 8.5 –46.9*** –45.5*** –44.3**
China (2007) (35 countries in sample)
Gross exports 37.9 160.7*** 155.0*** 161.0***
Value-add exports 27.7 103.2*** 102.1*** 109.6*** Sources: Authors, based on data from World Input-Output Tables and Penn World Tables 7.1.
Note: See note to table 2.3; regressions are similar but use value-added exports and a restricted sample for
comparability. * = significant at the 10 percent level, ** = significant at the 5 percent level, *** =
significant at the 1 percent level.
Table A.2 China Shock Based on Gross and Value-Added Imports, 1995–2007
Measure of imports
Real imports
(dollars per working-age adults)
Import absorption
(percent of domestic consumption)

68
Average Change Average Change
Gross 562.7 957.4 6.1 10.0
Value added 485.5 766.2 5.3 7.9
Sources: Authors, based on data from World Input-Output Tables, Penn World Tables 7.1, and U.S.
Census Bureau.
Note: See note to table 4.2.

69
Figure A.1 Gross and Value-Added Imports by the United States as Share of Consumption, 1995–
2009
Sources: Authors, based on data from World Input-Output Tables and IMF various years.
Note: See note to figure 4.3. Lines with (without) markers denote gross (value-added) imports
0
0.5
1.0
1.5
2.0
2.5
3.0
1995 1996 1997 1998 1999 2000 2001 2002 2003 2004 2005 2006 2007 2008 2009
Sh
are
of
do
mes
tic a
bso
rpti
on
(p
ercen
t)
China
Mexico
Japan
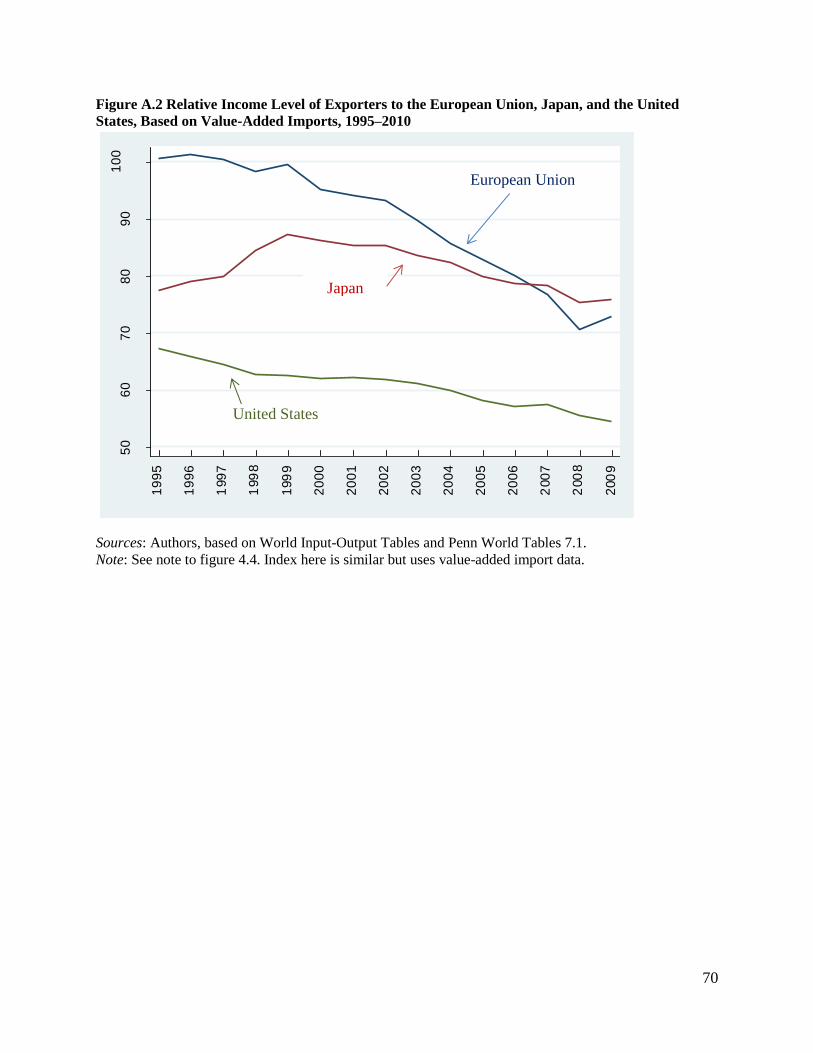
70
Figure A.2 Relative Income Level of Exporters to the European Union, Japan, and the United
States, Based on Value-Added Imports, 1995–2010
Sources: Authors, based on World Input-Output Tables and Penn World Tables 7.1.
Note: See note to figure 4.4. Index here is similar but uses value-added import data.
50
60
70
80
90
10
0
Inco
me
le
ve
l o
f pa
rtn
ers
as a
sh
are
of
ow
n in
co
me
le
ve
l (p
erc
en
t)
19
95
19
96
199
7
199
8
199
9
20
00
20
01
20
02
20
03
20
04
20
05
20
06
200
7
200
8
200
9
European Union
Japan
United States
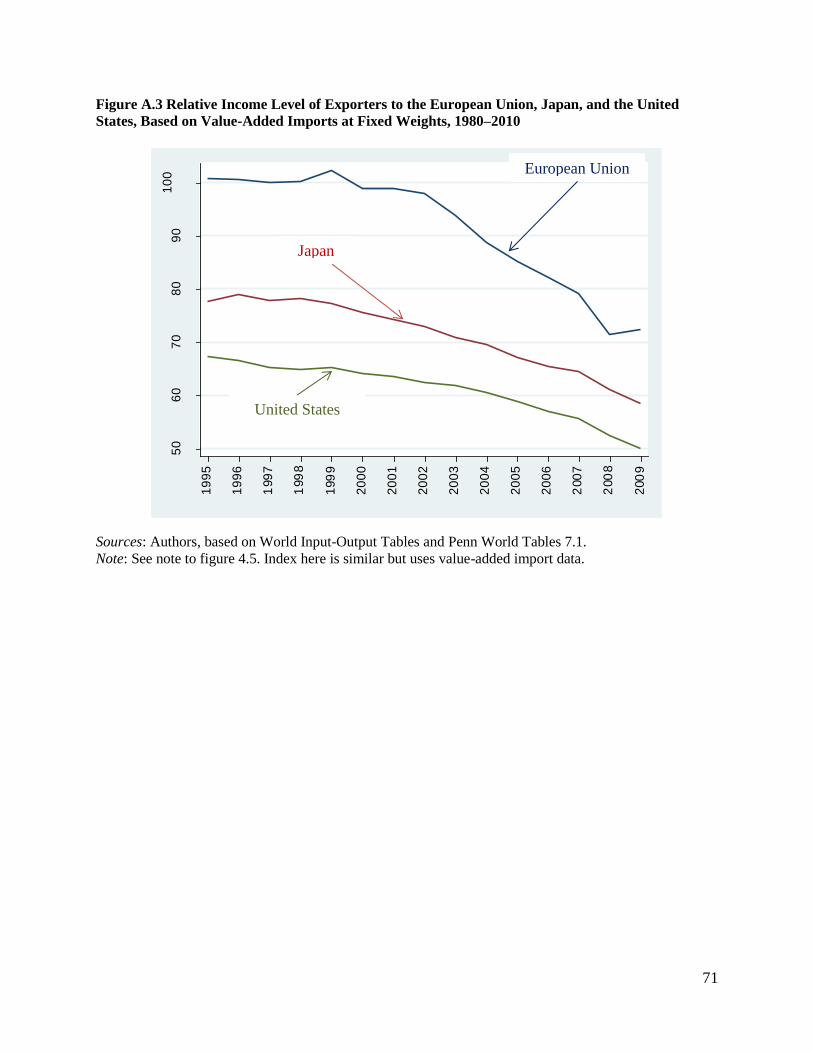
71
Figure A.3 Relative Income Level of Exporters to the European Union, Japan, and the United
States, Based on Value-Added Imports at Fixed Weights, 1980–2010
Sources: Authors, based on World Input-Output Tables and Penn World Tables 7.1.
Note: See note to figure 4.5. Index here is similar but uses value-added import data.
50
60
70
80
90
10
0
Inco
me
le
ve
l o
f p
art
ne
rs a
s a
sh
are
of
ow
n in
co
me
le
ve
l (p
erc
en
t)
19
95
19
96
199
7
199
8
199
9
20
00
20
01
20
02
20
03
20
04
20
05
20
06
200
7
200
8
200
9
European Union
United States
Japan

72
References
Aker, J., and I. Mbiti. 2010. “Mobile Phones and Economic Development in Africa.” Journal of
Economic Perspectives 24 (3): 207–32.
AMECO (Annual Macroeconomic Database). Various years. European Commission.
http://ec.europa.eu/economy_finance/ameco/user/serie/SelectSerie.cfm.
Anderson, J.A. 2011. “The Gravity Model.” Annual Review of Economics 3 (1): 133–60.
Autor, D., D. Dorn, and G.H. Hanson. 2013. “The China Syndrome: Local Labor Market Effects of
Import Competition in the United States.” American Economic Review.
Baier, S.L., and J. H. Bergstrand. 2001. “The Growth of World Trade: Tariffs, Transport Costs, and
Income Similarity.” Journal of International Economics 53 (1): 1–27.
Bairoch, P. 1996. “Globalization, Myths and Realities: One Century of External Trade and Foreign
Investment.” In States against Markets: The Limits of Globalisation, ed. R. Boyer and D. Drache,
173–92. London: Routledge.
Baldwin, R., and S. Evenett. 2009. The Collapse of Global Trade, Murky Protectionism and the Crisis:
Recommendations for the G20. E-book. London: Centre for Economic Policy Research.
Baldwin, R. 2011a. “Trade and Industrialisation after Globalisation’s 2nd Unbundling: How Building and
Joining a Supply Chain Are Different and Why It Matters.” Working Paper17716, National Bureau of
Economic Research, National Bureau of Economic Research, Cambridge, MA.
———. 2011b, “21st Century Regionalism: Filling the Gap between 21st Century Trade and 20th
Century Trade Rules.” Policy Insight No. 56, Center for Economic Policy Research Policy,
Washington, DC.
———. 2012. “WTO 2.0: Global Governance of Supply-Chain Trade.” Policy Insight No. 64, Center for
Economic Policy Research Policy, Washington, DC.
Banerjee, A., and E. Duflo. 2011. Poor Economics. A Radical Rethinking of the Way to Fight Global
Poverty. New York: Public Affairs.
Bergsten, C F., and J.E. Gagnon. 2012. “Currency Manipulation, the US Economy, and the Global
Economic Order.” Policy Brief 12-25, Peterson Institute for International Economics, Washington,
DC.
Bernanke, B. 2005. “The Global Saving Glut and the US Current Account Deficit.” Sandridge Lecture,
Virginia Association of Economics, Richmond, Virginia, March 10.
———. 2007. “Global Imbalances: Recent Developments and Prospects.” Bundesbank Lecture, Berlin,
September 11.
Bernanke, B., C. Bertaut, L. DeMarco, and S. Kamin. 2011. “International Capital Flows and the Return
to Safe Assets in the United States, 2003–2007.” FRB International Finance Discussion Paper 1014,
Federal Reserve Board, Washington, DC.
Bhagwati, J. 1988. Protectionism. Cambridge, MA: MIT Press.
Blinder, A.S. 2009. “How Many US Jobs Might Be Offshorable?” World Economics 10 (2): 41.
Borchert, I., B. Gootiiz, and A. Mattoo. 2012. “Policy Barriers to International Trade in Services:
Evidence from a New Database.” Policy Research Working Paper 6109, World Bank, Washington,
DC.
Borchert, I., B. Gootiiz, A. Goswami, and A. Mattoo. 2012. “Landlocked or Policy Locked? How
Services Trade Protection Deepens Economic Isolation.” World Bank Policy Research Working
Paper 5942, Washington, DC.
73
Brülhart, M. 2009. “An Account of Global Intra-industry Trade, 1962–2006.” World Economy 32 (3):
401–59.
Carpenter, T., and A. Lendle. 2011. “How Preferential Is World Trade?” CTEI Working Paper, Centre for
Trade and Economic Integration, The Graduate Institute, Ecole des Hautes Etudes, Geneva.
Cline, W.R. 2005. The United States as a Debtor Nation. Peterson Institute for International Economics,
Washington, DC.
Destler, I.M. 1992. American Trade Politics, 2nd. ed. New York: New York University Press.
Dooley, M.P., D. Folkerts-Landau, and P. Garber. 2003. “An Essay on the Revived Bretton Woods
System.” NBER Working Paper 9971, National Bureau of Economic Research, Cambridge, MA.
Dunning, J.H. 1983. “Changes in the Level and Structure of International Production: The Last One
Hundred Years.” In The Growth of International Business, ed. M. Casson. London: Allen and Unwin.
Edwards, L., and R.Z. Lawrence. 2013. Rising Tide: Is Growth in Emerging Economies Good for the
United States? Peterson Institute for International Economics, Washington, DC.
Eichengreen, B., and D. Irwin. 2009. “The Protectionist Temptation: Lessons from the Great Depression
for Today.” Vox-EU. http://www.voxeu.org/article/protectionist-temptation-lessons-great-depression-
today.
Frieden, J.A. 2006. Global Capitalism: Its fall and Rise in the Twentieth Century. New York: WW
Norton.
Global Trade Report. 2012. Débâcle: The 11th GTA Report on Protectionism. Centre for Economic
Policy Research, London.
Goldstein, M. 2009. “A Grand Bargain for the London G20 Summit: Insurance and Obeying the Rules.”
VoxEU. http://www.voxeu.org/article/grand-bargain-london-g20-summit.
Haldane, A. 2010. “The $100 Billion Question.” Speech to Institute of Regulation and Risk, Hong Kong,
March.
Hanson, G.H. 2012. “The Rise of Middle Kingdoms: Emerging Economies in Global Trade.” Journal of
Economic Perspectives 26 (2): 41–63.
Haskins, R., J. Isaacs, J., and I. Sawhill, I. 2008. “Getting Ahead or Losing Ground: Economic Mobility
in America.” Brookings Institution, Washington, DC.
Helpman, E., and P.R. Krugman. 1985. Market Structure and Foreign Trade: Increasing Returns,
Imperfect Competition, and the International Economy. Cambridge, MA: MIT Press.
Hoekman, B. 2013. Enabling Trade: Valuing Growth Opportunities. World Economic Forum report,
Davos, Switzerland.
Hoekman, B., and A. Nicita. 2011. “Trade Policy, Trade Costs, and Developing Country Trade.” World
Development 39 (12): 2069–79.
Hufbauer, G.C., J. J. Schott, M. Vieiro, and E. Wada. 2013. “Local Content Requirements: A Global
Problem.” Peterson Institute for International Economics Working Paper, Washington, DC.
Hummels, D. 2007. “Transportation Costs and International Trade in the Second Era of Globalization.”
Journal of Economic Perspectives 21 (3): 131–54.
Hummels, D.L., J. Ishii, and K.M. Yi. 2001. “The Nature and Growth of Vertical Specialization in World
Trade.” Journal of International Economics 54 (1): 75–96.
International Economic Law and Policy Blog. 2008. Export Restrictions.
worldtradelaw.typepad.com/ielpblog.
IMF (International Monetary Fund). Various years. Direction of Trade Statistics. Washington, DC.
Irwin, D.A. 2011. Trade Policy Disaster: Lessons from the 1930s. Cambridge, MA: MIT Press.

74
Johnson, R.C., and G. Noguera. 2012. “Fragmentation and Trade in Value Added over Four Decades.”
NBER Working Paper 18186. National Bureau of Economic Research, Cambridge, MA.
Johnson, S., and J. Kwak. 2010. 13 Bankers: The Wall Street Takeover and the Next Financial Meltdown.
New York: Vintage Books.
Keynes, J.M. 1920. The Economics Consequences of the Peace. New York: Harcourt-Brace.
Klasing, M., and P. Milionis. 2012. “Reassessing the Evolution of World Trade, 1870–1949.” University
of Groningen Working Paper, SSRN 2087678, Groningen, the Netherlands.
Koopman R., Z. Wang, and S.-J. Wei. 2013. “Tracing Value-Added and Double Counting in Gross
Exports.” American Economic Review
Krugman, P. 1995. “Growing World Trade: Causes and Consequences.” Brookings Papers on Economic
Activity 1: 327–77.
———. 2008. “Trade and Wages, Reconsidered.” Brookings Papers on Economic Activity 1: 103–54.
———. 2010. “Chinese Currency Discussion.” http://krugman.blogs.nytimes.com/2010/03/17/chinese-
currency-discussion.
Lawrence, R. 1996. Regionalism, Multilateralism and Deeper Integration. Washington, DC: Brookings
Institution.
Lieberthal, K., and J. Wang. 2012. “Addressing US-China Strategic Distrust.” Brookings Institution,
Washington, DC.
Low, P. 2012. “The TPP in a Multilateral World.” In The Trans-Pacific Partnership. A Quest for a
Twenty-First Century Trade Agreement, ed. C.L. Lim, D.K. Elms, and P. Low, 299–31. Cambridge:
Cambridge University Press.
Luce, E. 2010. “The Crisis of Middle-Class America.” Financial Times, July 30.
Mattoo, A., and A. Subramanian. 2009. “Currency Undervaluation and Sovereign Wealth Funds: A New
Role for the World Trade Organization.” World Economy 32 (8): 1135–64.
———. 2010. “Criss-Crossing Globalization: Uphill Flows of Skill-Intensive Goods and Foreign Direct
Investment.” Annual World Bank Conference on Development Economics 2009. Global: People,
Politics, and Globalization. Washington, DC: World Bank.
———. 2012a. “China and the World Trading System.” World Economy 35 (12): 1733–71.
———. 2012b. Greenprint: A New Approach to Cooperation on Climate Change. Center for Global
Development, Washington, DC.
———. 2013. “Four Changes to Trade Rules on Climate Change.” Policy Brief, Peterson Institute for
International Economics, Washington, DC.
Mattoo, A., P. Mishra, and A. Subramanian. 2012. “Spillover Effects of Exchange Rates: A Study of the
Renminbi.” Working Paper 12-4, Peterson Institute for International Economics, Washington, DC.
Melitz, M.J., and D. Trefler. 2012. “Gains from Trade when Firms Matter.” Journal of Economic
Perspectives 26 (2): 91–118.
Mussa, M. 2007. “IMF Surveillance over China’s Exchange Rate Policy.” In Debating China’s Exchange
Rate Policy, ed. M. Goldstein and N. Lardy. pp. 279–339. Washington, DC: Peterson Institute for
International Economics.
OECD (Organisation for Economic Co-operation and Development). Various years. OECD Statistics.
Paris. http://stats.oecd.org/.
O’Rourke, K.H., and J.G. Williamson. 1999. Globalization and History: The Evolution of a Nineteenth-
Century Atlantic Economy. Cambridge, MA: MIT Press.
Penn World Tables. Penn World Table 7.1.https://pwt.sas.upenn.edu/php_site/pwt71/pwt71_form.php.

75
Pew Center. 2010. “Americans Are of Two Minds on Trade. More Trade, Mostly Good; Free Trade Pacts,
Not So.” http://www.pewresearch.org/2010/11/09/americans-are-of-two-minds-on-trade/.
Piketty, T., and E. Saez. 2003. “Income Inequality in the United States, 1913–1998.” Quarterly Journal of
Economics 118 (1): 1–41.
Rodrik, D. 1998. “Why Do More Open Economies Have Bigger Governments?” Journal of Political
Economy 106 (5): 997–1032.
———. 2004. Has Globalization Gone Too Far? Institute for International Economics, Washington, DC.
Ruggie, J.G. 1998. Constructing the World Polity. London: Routledge.
Samuelson, P.A. 2004. “Where Ricardo and Mill Rebut and Confirm Arguments of Mainstream
Economists Supporting Globalization.” Journal of Economic Perspectives 18 (3): 135–46.
Spence, M., and S. Hlatshwayo. 2012. “The Evolving Structure of the American Economy and the
Employment Challenge.” Comparative Economic Studies 54 (4): 703–38.
Subramanian, A. 2011. Eclipse: Living in the Shadow of China’s Economic Dominance. Peterson Institute
for International Economics, Washington, DC.
Summers, L. 2008a. “America Needs to Make a New Case for Trade.” Financial Times, April 27
———. 2008b. “A Strategy to Promote Healthy Globalization.” Financial Times, May 4.
Trefler, D. 1993. “Trade Liberalization and the Theory of Endogenous Protection: An Econometric Study
of U.S. Import Policy.” Journal of Political Economy 101 (1): 138–60.
UN (United Nations). Various years. National Account Statistics. New York.
UNCTAD (United Nation Conference on Trade and Development). Various years. UnctadStat.
http://unctadstat.unctad.org/ReportFolders/reportFolders.aspx?sCS_referer=&sCS_ChosenLang=en
———. 2010. Global Investment Trends Monitor: Global and Regional FDI Trends in
2009.Geneva. http://www.unctad.org/en/docs/webdiaeia20101_en.pdf.
U.S. Census Bureau. Various years. www.census.gov
USITC (United States International Trade Commission). 2011. The Economic Effects of Significant U.S.
Import Restraints: Seventh Update. Investigation No. 332-325, USITC Publication 4253,
Washington, DC.
Williamson, J.H. 2011. “Getting Surplus Countries to Adjust.” Policy Brief 11-1, Peterson Institute for
International Economics, Washington, DC.
Wolf, M. 2010. “China and Germany Unite to Impose Global Deflation.” Financial Times, March 16.
World Bank. 2009. Global Economic Prospects 2009: Commodities at the Crossroads. Washington, DC:
World Bank.
———. 2011. Data on Trade and Import Barriers. Washington, DC.
http://econ.worldbank.org/WBSITE/EXTERNAL/EXTDEC/EXTRESEARCH/0,,contentMDK:2105
1044~pagePK:64214825~piPK:64214943~theSitePK:469382,00.html.
———. 2012. China 2030: Building a Modern, Harmonious, and Creative Society. Washington, DC:
World Bank.
———. Various years. World Development Indicators. Washington, DC: World Bank.
WIOD, World Input-Output Tables and International Supply and Use Tables.
http://www.wiod.org/database/iot.htm.
WTO (World Trade Organization). 2011. The WTO and Reciprocal Preferential Trading Agreements.
Geneva.
———. 2013. The Shaping Factors of World Trade over the Next Decade. Geneva.
76
Yao, Y. 2013. “America’s Pivot to Asia Will Provoke China.” Financial Times, February 12.
http://blogs.ft.com/the-a-list/2013/02/12/americas-pivot-to-asia-will-provoke-
china/#axzz2QTlHlbKQ.
Zaman, H., C. Delgado, D. Mitchell, and A. Revenga. 2008. Rising Food Prices. Are There Right Policy
Choices? World Bank Institute, Washington, DC.