The hydration of an Ordinary Portland Cement (OPC) and the influence … · The hydration of an...
144
The hydration of an Ordinary Portland Cement (OPC) and the influence of selected polymers: A mineralogical study using an external standard method for quantitative X- ray diffraction Die Hydratation eines Portlandzementes und der Einfluss ausgewählter Polymere: Mineralogische Charakterisierung mittels einer externen Standard Methode zur röntgenographischen Quantifizierung Der Naturwissenschaftlichen Fakultät der Friedrich-Alexander-Universität Erlangen-Nürnberg zur Erlangung des Doktorgrades Dr.rer.nat. vorgelegt von Daniel Jansen aus Bamberg
Transcript of The hydration of an Ordinary Portland Cement (OPC) and the influence … · The hydration of an...

The hydration of an Ordinary Portland Cement (OPC) and the influence of selected
polymers: A mineralogical study using an external standard method for quantitative X-
ray diffraction
Die Hydratation eines Portlandzementes und der Einfluss ausgewählter Polymere: Mineralogische Charakterisierung mittels einer externen Standard Methode zur
röntgenographischen Quantifizierung
Der Naturwissenschaftlichen Fakultät der
Friedrich-Alexander-Universität Erlangen-Nürnberg
zur
Erlangung des Doktorgrades Dr.rer.nat.
vorgelegt von
Daniel Jansen
aus Bamberg

Dissertation Daniel Jansen, University Erlangen-Nürnberg, 2011
- 2 -
Als Dissertation genehmigt von der Naturwissenschaftlichen Fakultät der Friedrich-Alexander-Universität Erlangen-Nürnberg
Tag der mündlichen Prüfung: 18.11.2011
Vorsitzender der
Promotionskommission: Prof. Dr. Rainer Fink
Erstberichterstatter: Prof. Dr. Friedlinde Götz-Neunhoeffer
Zweitberichterstatter: Prof. Dr. Jürgen Neubauer

Dissertation Daniel Jansen, University Erlangen-Nürnberg, 2011
- 3 -
List of abbreviations ......................................................................................................................... - 4 -
Abstract .............................................................................................................................................. - 6 -
Zusammenfassung ............................................................................................................................ - 7 -
1. Introduction ............................................................................................................................... - 8 -
2. Aim of the Research Work ..................................................................................................... - 10 -
3. State of Knowledge ................................................................................................................. - 14 -
3.1. Ordinary Portland Cement (OPC) CEMI 52.5 R ................................................................ - 14 -
3.2. Polymers ............................................................................................................................ - 16 -
3.3. Heat Flow Calorimetry ....................................................................................................... - 17 -
3.4. Powder Diffraction and the Rietveld-Method ..................................................................... - 19 -
4. Results (Publications) ............................................................................................................ - 22 -
4.1. Does Ordinary Portland Cement contain amorphous phase? (Published in PDJ) ............ - 22 -
4.2. XRD Quantification of cement hydration using an external standard (Published in CCR) - 43 -
4.3. The hydration of alite (Published in JAC) .......................................................................... - 64 -
4.4. The early hydration of Ordinary Portland Cement (Published in CCR) ............................ - 81 -
4.5. Influence of PDADMAC on the hydration of CEMI 52.5R( Submitted to CCC) ................. - 98 -
4.6. Influence of superplasticizers on the hydration of CEMI 52.5 R (Published in CCR) ..... - 117 -
5. Conclusion ............................................................................................................................ - 134 -
Acknowledgement ......................................................................................................................... - 144 -
Dissertation Daniel Jansen, University Erlangen-Nürnberg, 2011
- 4 -
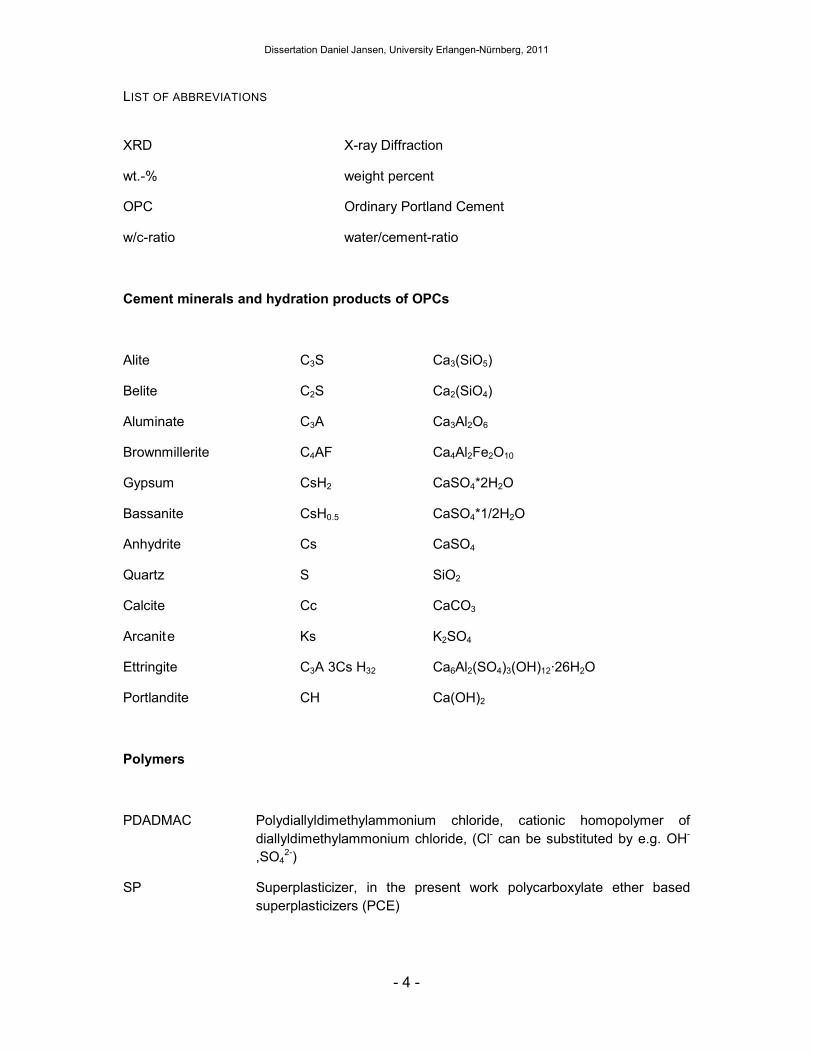
LIST OF ABBREVIATIONS
XRD X-ray Diffraction
wt.-% weight percent
OPC Ordinary Portland Cement
w/c-ratio water/cement-ratio
Cement minerals and hydration products of OPCs
Alite C3S Ca3(SiO5)
Belite C2S Ca2(SiO4)
Aluminate C3A Ca3Al2O6
Brownmillerite C4AF Ca4Al2Fe2O10
Gypsum CsH2 CaSO4*2H2O
Bassanite CsH0.5 CaSO4*1/2H2O
Anhydrite Cs CaSO4
Quartz S SiO2
Calcite Cc CaCO3
Arcanit e Ks K2SO4
Ettringite C3A 3Cs H32 Ca6Al2(SO4)3(OH)12·26H2O
Portlandite CH Ca(OH)2
Polymers
PDADMAC Polydiallyldimethylammonium chloride, cationic homopolymer of diallyldimethylammonium chloride, (Cl- can be substituted by e.g. OH-
,SO42-)
SP Superplasticizer, in the present work polycarboxylate ether based superplasticizers (PCE)

Dissertation Daniel Jansen, University Erlangen-Nürnberg, 2011
- 5 -
Professional Journals
PDJ Powder Diffraction Journal
CCR Cement and Concrete Research
JAC Journal of Applied Crystallography
CCC Cement and Concrete Composites

Dissertation Daniel Jansen, University Erlangen-Nürnberg, 2011
- 6 -
ABSTRACT
The influence on the hydration of a commercial Portland cement of two different polymers used in dry-mix-mortar technology was examined by means of X-ray diffraction. To this end an external standard method was used and evaluated which turned out to be the most elegant method available when working with cement pastes containing amorphous phases. The external standard method was also used in order to examine the amorphous content of the dry cement powder.
It was found that several structural parameters, such as atomic dislocation and microstrain of the structure models, used for quantitative Rietveld analysismight lead to the determination of false “amorphous” content. No actual amorphous content (phase with missing crystalline structure) could be proven in the cement examined.
It turned out that the hydration process can be precisely examined using the externalstandard method evaluated in this research. New insights into the hydration process of a commercial OPC could be achieved. The heat resulting from the hardening of the cement with water could be assigned to different reactions, namely the silicate reaction, the dissolution of the aluminates, and the precipitation of ettringite.
The cationic polymer (PDADMA-X) which was used affects the hydration of the cement as a function of the anionic counterion. The influence of the polymer is due to the interaction of the polymer with the anions in the pore solution indirectly influencing the cationic composition of the latter.
The polycarboxylate-based superplasticizer leads to a retardation of all reactions during cement hydration, without thereby showing a higher influence on any specific reaction. Both the silicate reaction and the aluminate reaction are retarded where the superplasticizer is present. Thus it is very conceivable that an interaction may here occur between the superplasticizer and the Ca2+ ions from the cement pore solution, though other mechanisms are also conceivable.

Dissertation Daniel Jansen, University Erlangen-Nürnberg, 2011
- 7 -
ZUSAMMENFASSUNG
Die Hydratation eines handelsüblichen Portlandzements wurde mittels Röntgen-diffraktometrie und Wärmeflusskalorimetrie untersucht. Dabei wurde eine Methode mit einem externen Standard angewandt und evaluiert, welche in abbindenden Zementen noch nie zum Einsatz kam. Die Methode stellte sich als eine sehr elegante Methode für die Untersuchung von Zementpasten heraus.
Außerdem wurde der amorphe Gehalt eines handelsüblichen Zements untersucht. Es stellte sich heraus, dass der Zement keinen amorphen (nicht kristallinen) Bestandteil aufweist. Vielmehr ist es möglich mit falschen Werten für die Auslenkungsparameter der einzelnen Atome oder den Microstrain für den Standard bzw. aller Phasen der Probe einen „falschen“ amorphen Anteil zu errechnen.
Weiterhin wurde der Einfluss zweier Polymere, welche in Trockenmörteln neben dem untersuchten Zement eingesetzt werden, auf das Abbindeverhalten des Zements untersucht.
Dabei zeigt sich, dass das kationische PDADMA-X einen deutlichen Einfluss auf die Hydratation hat und diese in Abhängigkeit des anionischen Gegenions zu dem kationischen Polymer entweder beschleunigt oder verzögert. Dabei spielt offensichtlich ein Anionenaustausch zwischen Polymer und Zementporenlösung eine entscheidende Rolle.
Das Fließmittel (Polycarboxylat-basierend) verzögert sowohl die Silikatreaktion als auch die Aluminatreaktion während des Abbindens des Zementes.Es ist am denkbarsten, dass das Polymer durch das Entziehen von Ca2+-Ionen aus der Zementporenlösung verzögernd auf das Abbinden des Zementes wirkt.

Dissertation Daniel Jansen, University Erlangen-Nürnberg, 2011
- 8 -
1. INTRODUCTION
Cementitious building materials have been playing a major role in human life for thousands of years. Binders less reactive than cement, such as lime or gypsum, have an even longer history.
The introduction of cement onto the market in the 19th century provided the possibility of new applications and products with better properties and durability.
Today Ordinary Portland Cement (OPC) is an important product in our daily life and it is an irreplaceable part of numerous other products. It is the basis of many products of the building industrysuch as concrete and dry-mix-mortars. The worldwide production of Ordinary Portland Cement amounts to almost 3 billion tons a year. The global production of dry-mix-mortars has already exceeded the amount of 100 mio tons a year [1].
The first investigations into the hydration of cements date back to the early 20th century.However, there are still many unsolved problems concerning the hydration of cements, especially in modified cementitious systems like dry-mix-mortars. One of the main issues of research is to clarify the kinetics behind the hydration of Portland cement, which can be seen from heat flow curves and the influence of all kinds of additives on the hydration behavior.
It is a well known fact that two reactions are assumed for the hydration of an OPC with water. The phase alite (chemically impure C3S) reacts with water, forming portlandite and C-S-H-phase (equation 1). The sulfate carriers of the cement (anhydrite, gypsum, bassanite) react with C3A and water, forming ettringite (equation 2).
Equ.1 C3S + 3.9 H → C1.7SH2.6 + 1.3 CH (silicate reaction)
Equ.2 C3A + 3 Cs + 32 H → C3A*3Cs*H32 [ettringite] (aluminate reaction)
Dry-mix-mortar systems are very important products and today’s standard when it comes to efficient and resource-saving construction sites [1, 2]. So-called ready-to-use mortars are applied more and more often and are tending to replace job-site-mixed mortars at construction sites. Since they need to fulfill very different requirements for different products, dry mortars are complex mixtures of many components such as inorganic binders (Ordinary Portland Cements, Calcium Aluminate Cements, Sulfates), organic binders (redispersible polymer powders, polymer dispersions), additives and aggregates. The systematic addition of additives and functional polymers gives rise to products with a varying field of application possibilities. The modification of concrete and mortars with polymers, in particular, has turned out to be very advantageous.
Research into dry-mix-mortar systems is a very broad field. The best means of improving mechanical properties, such as strength and adhesion,remain live scientific issues [e.g. 3, 4, 5] and form the aims set by many research programs. The study of the microstructuredevelopment of mortar systems [e.g. 6, 7, 8] is also a very important issue.

Dissertation Daniel Jansen, University Erlangen-Nürnberg, 2011
- 9 -
In addition, there also exists a need to understand and investigate the influence of numerous organic additives and aggregates on the hydration behavior of the inorganic binders in mortar systems (references in chapter 4.5 and 4.6).
From a mineralogical point of view, OPC (a very important inorganic binder in many products) is a mixture of several crystalline phases. During hydration (the hardening of the cement after adding water) several crystalline phases are dissolved and hydration products crystallize from the pore solution. The fact that OPC is a crystalline product means that mineralogical studies using X-ray diffractometry can be helpful in examining the raw material cement, the hardened cement stone, and also the hydration process. The quantification of the phase development during cement hydration is a very powerful tool for demonstrating reactions during hydration. A problem, however, for the quantification of the hydration process is the fact that neither the water added to the cement nor the C-S-H-phase which is formed during hydration can, at present, be quantified by means of X-rays. This problem can be overcome by using standard methods which also allow the quantification of the amorphous phases (water, C-S-H-phase) in the cement paste.
[1] F. Leopolder, The global drymix mortar industry, ZKG International, 4 (2010) 32-45
[2] C. Winter, J. Plank, The European Drymix Mortar Industry, ZKG International, 60 (2007) 62-69
[3] J. M. Geist, S. V. Amagna, B.B. Mellor, Improved Portland Cement Mortars with Polyvinyl Acetate Emulsions, Industrial and Engineering Chemistry, 45 (1953) 759-767
[4] J. Schulze, Influence of water-cement ratio and cement content on the properties of polymer-modified mortars, Cement and Concrete Research, 29 (1999) 909-915
[5] J.-H. Kim, R. E. Robertson, A. E. Naaman, Structure and properties of poly(vinyl alcohol)-modified mortar and concrete, Cement and Concrete Research, 29 (1999) 407-415
[6] J. Rottstegge, M. Arnold, L. Herschke, G. Glasser, M. Wilhelm, H.W. Spiess, W.D. Hergeth, Solid state NMR and LVSEM studies on the hardening of latex modified tile mortars, Cement and Concrete Research, 35 (2005) 2233-2243
[7] S. Seifert, J. Neubauer, F. Goetz-Neunhoeffer, H. Motzet, Application of two-dimensional XRD for the characterization of the microstructure of self-leveling compounds, Powder Diffraction, 24 (2009) 107-111
[8] A. Jenni, L. Holzer, R. Zurbriggen, M. Herwegh, Influence of polymers on microstructure and adhesive strength of cementitious tile adhesive mortars, Cement and Concrete Research, 35 (2005) 35-50

Dissertation Daniel Jansen, University Erlangen-Nürnberg, 2011
- 10 -
2. AIM OF THE RESEARCH WORK
The aim of the present work was to clarify, from a mineralogical point of view, the processes occurring in the course of the hydration of a commercial Portland cement, using X-ray diffractometry combined with heat flow calorimetry. On this basis, there can be examined the influence of two selected polymeric additives which are used in dry-mix-mortars on the hydration behavior of the cement. Within the scope of the present research work the focus was on the first 22 hours of the hydration process.
For the above-mentioned reasons, an OPC which is very often used in German dry-mix-mortar technology was chosen for the research performed.
The hydration of OPCs can be examined very well by means of X-ray diffraction analysis. Studies of this sort are nowadays helping us to understand many processes which occur during the application of cement based products.
When working with X-rays the scientist has always to keep in mind that only crystalline phases with a known structure and sufficient peak intensities can be quantified. Although possibilities exist for quantifying phases with partially-known or unknown crystal structures [1], the mixing water introduced into the cement in order to start the hardening process cannot be quantified by means of X-rays. Moreover, hydration products may also display (especially during early hydration) an unsatisfying degree of crystallinity (e.g. C-S-H-phase). These factors might lead to wrong quantitative values for the crystalline phases in a cement paste (see chapter 4.2.).
The application of X-ray diffraction to hydrating cementitious systems was already suggested by scientists several years ago. Neubauer et al. [2] suggested a conversion of the data obtained from Rietveld analysis in order to get true quantitative results for the cement paste. This method was carried on by Hesse [3]. Mitchell et al. [4] and Scrivener et al. [5], however, suggested using an internal standard method for the quantitative analysis of cement pastes.
Generally speaking, one of the most important aims of the scientists who work with X-ray diffraction and hydrating cementitious systems is to find the most suitable standard method in order to quantify the crystalline phases in a cement paste. A standard method suitable for obtaining absolute quantities for each crystalline phase in a mixture of crystalline (clinker phases, hydrate phases) and amorphous phases (e.g. water, C-S-H-phase) is therefore most appreciated.

Dissertation Daniel Jansen, University Erlangen-Nürnberg, 2011
- 11 -
The first step of the present work is therefore the application of the chosen method in order to examine the dry cement powder. The question of whether or not the dry cement powder already has amorphous phases which cannot be quantified with X-rays is also a scientific issue. These investigations lead to the first question to be answered within the scope of the present research work.
i. Does Ordinary Portland Cement contain amorphous content? (Chapter 4.1.)
After the above-mentioned external standard method turned out to be very promising for the dry cement, its evaluation and implementation for the in-situ investigationof cement hydration is the next task of the present work.
ii. Is the standard method applied to the dry cement powder suitable for characterizing the cement during hydration? (Chapter 4.2.)
The data obtained from the XRD in-situ investigation of the cement paste during hydration are suitable in order to calculate heat flow diagrams. But in order to do this the enthalpies of reaction for all reactions which take place during the hydration process have to be taken into account.
By comparing the calculated heat flow diagrams with measured heat flow diagrams, we can arrive at detailed statements concerning the kinetics behind cement hydration. Hesse et al. [6] proved that this is possible for synthetic cementitious systems. The intention of the present work is to take the idea of Hesse et al. [6] further and to apply it to a commercial and more complex system. Hesse et al. assumed that the reactions described in equations 1 and 2 (chapter 1) run synchronously. They made use of the alite dissolution curve and the ettringite precipitation curve in order to calculate the heat released during both reactions and compared it with heat flow curves from heat flow experiments. The aim of the present work is to figure out whether or not both reactions have not rather to be separated into dissolution and precipitation reactions, specifically, into the dissolution of the clinker phases and sulfate carriers and the precipitation of the hydrate phases.
The first step will be the examination of the early hydration of the pure phase alite with water in order to answer the following question.
iii. Is it possible to calculate the heat releasedduring the hydration of alite with water from the alite dissolution curve quantified by means of X-ray diffraction? (Chapter 4.3.)
Dissertation Daniel Jansen, University Erlangen-Nürnberg, 2011
- 12 -
If it is possible to calculate the heat released during hydration of pure alite with water using the dissolution curve of alite, then this curve, determined from the paste of the whole cement, can be used in order to show the contribution of the silicate reaction (equation 1 in chapter 1) to the total amount of heat released during the hydration of the cement.
This question immediately and automatically gives rise to the next:
iv. Is it necessary to split the aluminate reaction into dissolution and precipitation reactions in order to calculate heat flow curves from the X-ray data? (Chapter 4.4.)
The four questions posed all have the aim of clarifying the process of hydration of the OPC used in the study. On the basis of the new knowledge acquired from the answers to the first questions we can set about examining the influence of selected polymers on the hydration of the Portland Cement used.
v. Does the PDADMA-X with different counterions have an influence on the hydration behavior of the OPC? (Chapter 4.5.)
vi. Does the polycarboxylate-based superplasticizer have an influence on the hydration behavior of the OPC? (Chapter 4.6.)
The focus of the research performed is not only on the documentation of the influences of said polymers on the hydration behavior, but also on the generation of theories that might explain and account for these influences.
Dissertation Daniel Jansen, University Erlangen-Nürnberg, 2011
- 13 -
[1] N.V.Y. Scarlett, I.C. Madsen, Quantification of phases with partially known or no known crystal structures, Powder Diffraction, 21 (2006) 278-284
[2] J. Neubauer, F. Götz-Neunhoeffer, D. Schmitt, M. Degenkolb, U. Holland, In-situ Untersuchung der frühen PZ-Hydratation, Tagungsbericht 16. Internationale Baustofftagung, Weimar (2006)1-0375 – 1-0382
[3] C. Hesse, Der Reaktionsverlauf der frühen Hydratation von Portlandzement in Relation zur Temperatur, Dissertation Universität Erlangen-Nürnberg (2009)
[4] L.D. Mitchell, J.C. Margeson, P.S. Whitfield, Quantitative Rietveld analysis of hydrated cementitious systems, Powder Diffraction, 21 (2006) 111-113 [5] K.L. Scrivener, T. Füllmann, E. Gallucci, G. Walenta, E. Bermejo, Quantitative study of Portland cement hydration by X-ray diffraction/Rietveld analysis and independent methods, Cement and Concrete Research, 34 (2004) 1541-1547
[6] C. Hesse, F. Goetz-Neunhoeffer, J. Neubauer, A new approach in quantitative in-situ XRD of cement pastes, Correlation of heat flow curves with early hydration reactions, Cement and Concrete Research, 41 (2001) 123-128

Dissertation Daniel Jansen, University Erlangen-Nürnberg, 2011
- 14 -
3. STATE OF KNOWLEDGE
3.1. ORDINARY PORTLAND CEMENT (OPC) CEMI 52.5 R
The term CEMI 52.5 R is defined according to DIN EN 197-1[1]. A CEM I is a Portland Cement with a clinker content of at least 95 wt.%. In addition, sulfate carriers and aggregates (e.g. calcite) are added to the cement in order to optimize hardening and reduce production costs.
The term 52.5 refers to the standard compressive strength of the cement, which has to reach at least 52.5 N/mm2 after 28 days wet curing. In compliance with DIN-EN 196–1, the compressive strength is tested on mortar prisms of 4 × 4 × 16 cm (defined composition of cement and sand-mixture; defined w/c-ratio). The letter R indicates a high early strength after 2 days.
Ordinary Portland Cement (OPC) consists of several phases which are shown in Table 1 [2]. Alite is the main phase of Ordinary Portland Cement and mainly determines the early hydration (first 24 hours) of the latter, though the reaction of the C3A with the sulfate carriers is also an important process during the early hydration. The reaction of belite does not take place during the first 24 hours of hydration [3].
TABLE 1 MAIN PHASES IN AN ORDINARY PORTLAND CEMENT CLINKER
Mineral Formula Cement nomenclature Amount [wt.%]
Alite Ca3SiO5 C3S 40-80 Belite Ca2SiO4 C2S 0-30
Tricalciumaluminate Ca3Al2O6 C3A 3-15 Brownmillerite Ca4Al2Fe2O10 C4AF 4-15
Sulfate carriers (calcium sulfate) are added to the cement clinker and interground in
order to control the setting of the cement. The particular calcium sulfate employed is usually gypsum (CaSO4 *2H2O) or natural anhydrite (CaSO4) or a mixture of both. The hemihydrate (bassanite, CaSO4*0.5H2O) in the cement is a product of the dehydration of gypsum during milling at temperatures above 80 °C. Bassanite is a metastable mineral phase and is not found in large amounts in nature. There are two forms of bassanite. The α-form results from heat treatment of gypsum under vapor pressure [4]. Hence, in Ordinary Portland Cements only the β-form can be found. The formation of calcium sulfate phases from gypsum is a function of temperature and time [5]. The reaction of the sulfate carriers during cement hydration is mainly based on the different solubilities and the availability of the sulfate carriers, which are a function of pH value and temperature [6, 7].

Dissertation Daniel Jansen, University Erlangen-Nürnberg, 2011
- 15 -
TABLE 2 TYPICAL SULFATE CARRIERS IN AN ORDINARY PORTLAND CEMENT
Mineral Formula Cement nomenclature Abbreviation
Gypsum CaSO4*2H2O CsH2 Gy Bassanite (β) CaSO4*0.5H2O CsH0.5 HH
Anhydrite CaSO4 CsH AII
[1] 14. DIN EN 197- Part 1 (6/2000): Cement –Composition, specification and conformity criteria for common cements - Part 2 (6/2000): Cement - Conformity evaluation. [2] S. Sprung, Cement, Ullmann`s Encyclopedia of Industrial Chemistry, (2009)
[3] I. Jelenic, A. Bezjak, M. Bujan, Hydration of B2O3-stabilized α`-C2S and β-modifications of dicalcium silicate, Cement and Concrete Research, 8 (1978) 173-180
[4] F. Wirsching, Calcium Sulfate, Ullmann`s Encyclopedia of Industrial Chemistry, (2009)
[5] S. Seufert, C. Hesse, F. Goetz-Neunhoeffer, J. Neubauer, Quantitative determination of anhydrite III from dehydrated gypsum by XRD, Cement and Concrete Research, 39 (2009) 936-941
[6] L. Amathieu, Solubility of calcium sulfate hemihydrates as a function of pH and the calcination temperature and process, Ciments, Betons, Platres, Chaux, 789 (1991) 101-106
[7] D. Freyer, W. Voigt, Crystallization and phase stability of CaSO4 and CaSO4-based salts, Monatshefte für Chemie, 134 (2003) 693-719
Dissertation Daniel Jansen, University Erlangen-Nürnberg, 2011
- 16 -
3.2. POLYMERS
Polymers (also called macromolecules) are large molecules composed of repeating units. Polymers are characterized by very high molecular weights. The repeating units are connected by covalent chemical bonds. Polymers play an essential role in our daily life inasmuch as they cover a large class of materials (natural as well as synthetic) with a wide variety of properties and therefore lots of fields of applications.
Mortars and concrete made with Ordinary Portland Cements (OPCs) have been the most widely used construction materials for several centuries now. In recent decades many attempts have been made to use polymers in order to improve the properties of these products [1]. Numerous polymer additives, such as redispersible polymer powders, superplasticizers, thickeners, cellulose ethers and many others, are nowadays responsible for the fact that modern products display such excellent performance characteristics as self-leveling properties, water retention, good tensile adhesive strength, good flexural strength, workability and more. Modern dry-mix mortar technology, in particular, is based on the interplay between inorganic binders and organic binders and additives [2].
The present investigations focus on the influence of two specific polymers, namely: a new-generation polycarboxylate-based superplasticizer, and polydiallyl-dimethylammonium chloride (Poly-DADMAC; PDADMAC) which are both used in dry-mix-mortar technology [3].
Superplasticizers improve workability and fluidity of concrete and mortars [4]. A distinction is made between polycondensates, polycarboxylates, small molecules and biopolymers (e.g. casein). The superplasticizer used in this study belongs to the group of polycarboxylates. These polymers are synthesized by radical polymerization using suitable monomers such as methacrylic acid.
Polydiallyldimethylammonium chloride (PDADMAC), a homo-polymer of Diallyl-dimethylammonium chloride, is a cationic polymer with a high charge density and with a molecular weight of hundreds of thousands grams per mole. PDADMAC is synthesized by radical polymerization and is soluble in water. The counterion to the positive charge of the nitrogen is usually chloride. PDADMAC is mainly employed in the papermaking process, since it can be used in order to control disturbing substances which occur in this process. In addition to this, PDADMAC can be used as an organic coagulant in waste water treatment. The use of PDADMAC in dry-mix-mortar technology is also important [3].
[1] Y. Ohama, Handbook of polymer-modified concrete and mortars, Noyes Publications, Park Ridge, New Jersey, U.S.A. (1995)
[2] H. Lutz, R. Bayer, Dry Mortars, Ullmann`s Encyclopedia of Industrial Chemistry, (2009)
[3] EP 1984 428, Wacker Chemie AG; Schorm, A., Weitzel, H.P., Killat, S., Lutz, H.
[4] J. Plank, applications of Biopolymers in Construction Engineering, in: Biopolymers, Vol. 10 General Aspects and Special Applications (Publisher: A. Steinbüchel), Wiley-VCH, Weinheim (2003) 29-95

Dissertation Daniel Jansen, University Erlangen-Nürnberg, 2011
- 17 -
3.3. HEAT FLOW CALORIMETRY
One method which is implemented in order to study cement hydration is heat flow calorimetry [1, 2]. Heat flow calorimetry is a technique used in order to study processes through the thermal power which they produce or consume. The sample is placed in an ampoule that is inserted into a channel from the calorimeter. The ampoule is in contact with a heat flow sensor on a thermostated heat sink. The heat produced in the sample is balanced by a heat flow of the heat in excess in the sample through the sensor into the heat sink. This heat flow produces a voltage which can be expressed as a specific heat on the premise that the calorimeter was calibrated with a known heat, resulting in a calibration coefficient Kcalib (WV-1). The calibration coefficient converts the voltage U (V) as measured into a thermal power Pthermal (Equ.1).
Equ.1 Pthermal = Kcalib х (U – U0)
where U0 (V)is the base line signal of the calorimeter.
The output of a calorimeter can be plotted against time in order to arrive at the heat flow (HF) and can also be integrated with respect to time in order to arrive at the total heat of reaction HR (Equ.2).
Equ.2 ∫=1
2
*6,3
t
t
R HFdtH
The correction factor 3.6 is to be used only when mW is plotted against hours (J = W
х s). A detailed evaluation of the method as regards its use in the examination of cement
hydration can be found elsewhere [3].
The calorimeter used in this work was a commercial TAM Air calorimeter produced by TA Instruments. It is an eight-channel twin-type calorimeter. Each channel has a twin channel in which an inert sample is placed, with the difference between the heat output of the sample and that of the reference sensor being recorded.

Dissertation Daniel Jansen, University Erlangen-Nürnberg, 2011
- 18 -
Cement and water were weighed in separately, the former in special plastic vessels and the latter in syringes according to the chosen water/cement ratio. The cement and water were equilibrated before the measurements in a tempered room. Mixing of the cement with the water was carried out externally for one minute employing a special tool which allows reproducible stirring. The samples were then put into the calorimeter. The first half-hour of the heat-flow experiments have to be evaluated with care because of the disturbance of the signal when opening the calorimeter.
The time constant [4] of the TAM Air calorimeter turned out to be 234 s. Since the experiments in this study are focused on the main reaction of cement, it was not necessary to take into account the time constant for the evaluation of the heat flow diagrams.
[1] L. Wadsö, Applications of an eight-channel isothermal conduction calorimeter for cement hydration studies, Cement International, 5 (2005) 94-101
[2] J. Neubauer, F. Goetz-Neunhoeffer, Efficiency of highly sensitive heat flow calorimetry in examination of OPC hydration, Proceedings of the 24th International Conference on Cement Microscopy, San Diego, California (2002) 58-68
[3] L. Wadsö, Operational issues in isothermal calorimetry, Cement and Concrete Research, 40 (2010) 1129-1137
[4] W.F. Hemminger, H.K. Cammenga, Methoden der thermischen Analyse, Springer-Verlag, Berlin (1989)

Dissertation Daniel Jansen, University Erlangen-Nürnberg, 2011
- 19 -
3.4. POWDER DIFFRACTION AND THE RIETVELD-METHOD
X-ray powder diffraction is a powerful tool for examining samples with crystalline phase content. This has meant that it has been regularly used for the examination of cements for years. Because of the ongoing development of new X-ray equipment the opportunities are continuously improving.
The interaction between X-rays and crystalline materials was first described in 1912 by Max von Laue, who found out that X-rays have wave-like properties and that crystals have a 3-dimensional periodic structure [1].
W.L. Bragg formulated the basic equation which explains the diffraction of X-rays on crystals with periodic structures, which has consequently come to be known as Bragg’s Equation [2]. Intensities can only be observed if Bragg’s Equation is fulfilled.
Today`s state-of-the-art quantitative use of X-ray patterns dates back to the considerations of Hugo Rietveld [3], who formulated the fundamental relations concerning peak intensities obtained from X-ray experiments. The so called Rietveld method is nowadays implemented in specific software. In the case of the present work the Rietveld software Topas V4.2 from Bruker AXS was employed.
Modern Rietveld software uses the fundamental parameters approach [4]. When using this approach, an XRD diagram is calculated from structure models and refined as long as there is close agreement to the observed XRD diagram from the experiment.
The final observed profile Y(2θ) depends on several parameters [5] (Equ.1).
Equ.1 Y(2θ) = (W х GEq х GAx) х S х P х U + Bkg
where W = Source emission profile
GEq and GAx = Equatorial and axial instrumental contributions
S = Sample contributions
P = Real structures effects
U = User convolutions
Bkg = Background
In recent years the XRD analysis procedure has been adjusted for the examination of hydration processes [6]. For this purpose, a special sample holder with a cooling/heating-unit has been developed [7]. Preparation of the cement paste, and the covering of the paste with a Kapton film, allows the examination of the phase content in the cement paste over time.
Dissertation Daniel Jansen, University Erlangen-Nürnberg, 2011
- 20 -
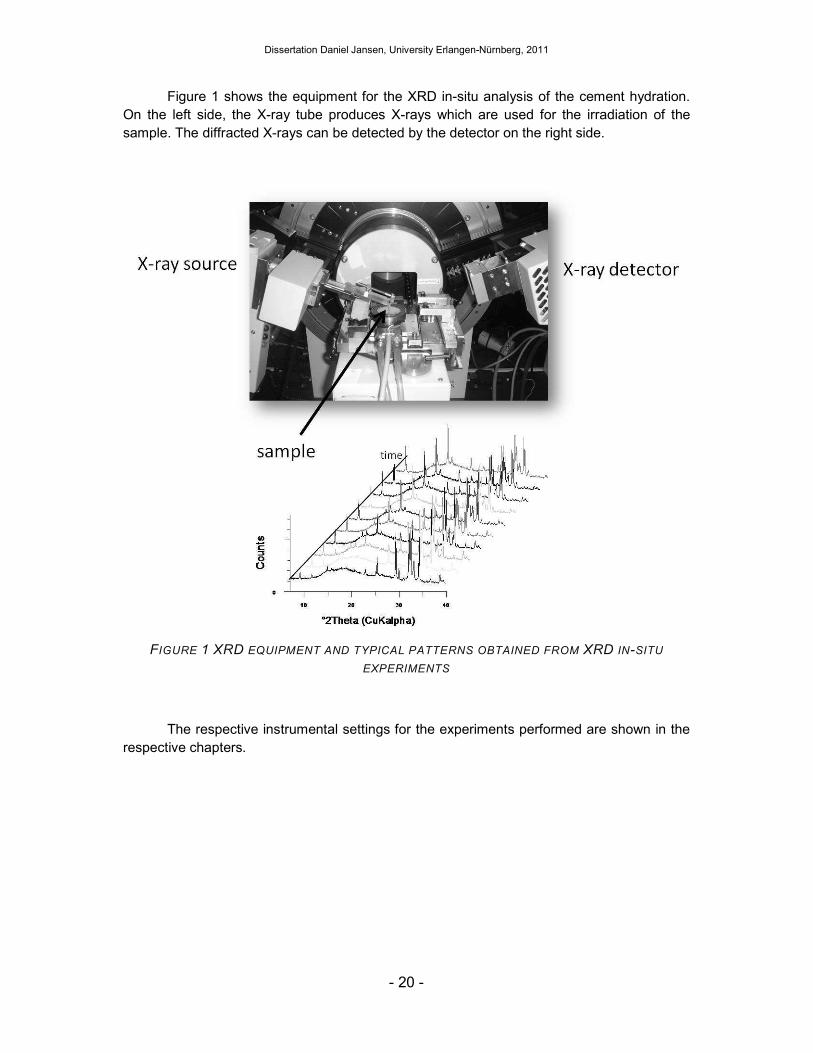
Figure 1 shows the equipment for the XRD in-situ analysis of the cement hydration. On the left side, the X-ray tube produces X-rays which are used for the irradiation of the sample. The diffracted X-rays can be detected by the detector on the right side.
FIGURE 1 XRD EQUIPMENT AND TYPICAL PATTERNS OBTAINED FROM XRD IN-SITU
EXPERIMENTS
The respective instrumental settings for the experiments performed are shown in the respective chapters.
Dissertation Daniel Jansen, University Erlangen-Nürnberg, 2011
- 21 -
[1] M. Laue, Röntgenstrahlinterferenzen, Physik. Z., 14 (1913) 1075-1079
[2] W.H. Bragg, W.L. Bragg, The reflection of X-rays by crystals, Proc. Roy. Soc. London (A), 88 (1913) 428-438
[3] H.M. Rietveld, A profile refinement method for nuclear and magnetic structures, Journal of Applied Crystallography, 2 (1988) 65-71
[4] R.W. Cheary, A. Coelho, A fundamental parameters approach to X-ray Line-Profile Fitting, Journal of Applied Crystallography, 25 (1992) 109-121
[5] R.W. Cheary, A.A. Coelho, Axial Divergence in a Conventional X-Ray Powder Diffractometer. II. Realiyation and Evaluation in A Fundamental-Parameter Profile Fitting Procedure, Journal of Applied Crystallography, 31 (1998) 862-869
[6] J. Neubauer, F. Goetz-Neunhoeffer, U. Holland, D. Schmitt, In-situ XRD investigation of OPC hydration, Proceedings of the 26th International Conference on Cement Microscopy, San Antonio, Texas, (2004), on CD-ROM
[7] C. Hesse, M. Degenkolb, P. Gaeberlein, F. Goetz-Neunhoeffer, J. Neubauer, V. Schwarz, Investigation into the influence of temperature and w/c-ratio on the early hydration of white cement, Cement International, 6 (2008) 68-78
Dissertation Daniel Jansen, University Erlangen-Nürnberg, 2011
- 22 -
4. RESULTS (PUBLICATIONS)
4.1. DOES ORDINARY PORTLAND CEMENT CONTAIN AMORPHOUS PHASE? (PUBLISHED IN PDJ)
Does Ordinary Portland Cement (OPC) contain amorphous phase? A quantitative study using an external standard method
D. Jansen,Ch. Stabler, F. Goetz-Neunhoeffer, S. Dittrich, and J. Neubauer
Published in: Powder Diffraction Journal (2011), 26, 31-38
A suitable external standard method which was first described by O´Connor (1988) was used to determine the quantitative phase composition of a commonly used Ordinary Portland Cement (OPC). The method was also applied in order to determine amorphous contents in OPC. Also investigated were the impact of atomic displacement parameters and the microstrain on the calculated amorphous content. The investigations yielded evidence that said parameters do indeed exert an influence on the calculated amorphous content. On the basis of the data produced we can conclude that the method used is entirely to be recommended for the examination of OPC. No significant amorphous content could be proven in the OPC used.
Key words: Ordinary Portland Cement, amorphous content, external standard, G factor

Dissertation Daniel Jansen, University Erlangen-Nürnberg, 2011
- 23 -
( )
( )∑=
=n
i
ii
jj
j
ZMVS
ZMVSc
1
INTRODUCTION
The worldwide consumption of Ordinary Portland Cement (OPC), the most commonly used foundation for building materials on this planet, amounts to around 3 billion tons a year. OPCs are complex powders of worldwide importance, and knowledge of their mineralogical compositions is of great economic importance inasmuch as it enables us to predict hydration behavior. Major phases are alite, belite, aluminate and ferrite. Lime, periclase as well as alkali sulfates may also exist as minor phases in cement clinkers (Taylor, 1997). Furthermore, sulfate carriers are added to the clinker to avoid an unintended rapid setting of the cement. As a result, OPCs are mixtures of ten and more phases. This means that the quantitative analysis of OPCs is quite a challenging task.
The cement industry uses a number of techniques to characterize their clinkers and final cement products, such as the Bogue method, microscopic point counting and quantitative X-ray diffraction. Quantitative phase analysis of OPCs and clinkers based on single-peak intensities has only a limited applicability to OPCs because of overlapping reflections and the tendency to preferred orientations displayed by several phases. These limitations of single-peak intensity methods can be overcome by utilizing the Rietveld method of refinement (Rietveld, 1969).
Rietveld analysis always gives the total of the determined crystalline phases normalized to 100 wt.% (Hill and Howard, 1987) (Eq. 1). If amorphous or unknown phases are present, the amounts of the crystalline phases estimated by the analysis will differ from the actual amounts present.
(1)
where
cj = weight fraction of phase j,
Sj = Rietveld scale factor of phase j,
Z = number of formula units per unit cell,
M = mass of the formula unit,
V = unit-cell volume.

Dissertation Daniel Jansen, University Erlangen-Nürnberg, 2011
- 24 -
Nevertheless, the presence of a glassy or amorphous component in cements and clinkers has been debated by several authors (Maki, 1979; Han et al. 1980). X-ray experiments have been performed in order to determine amorphous contents in cements and clinkers. Mainly two strategies, namely internal standard methods as well as external standard methods, have been reported.
De La Torre et al. (2001) examined several standard materials using the internal standard method and concluded that corundum is the best standard, displaying as it does contain almost no amorphous content. De La Torre et al. (2001) assumed, in addition, that atomic displacement parameters exerted an impact on the quantitative results. Furthermore, it was shown that the phase alite has an amorphous content of 21.7 wt.%. The impact of the atomic displacement parameters on the scale factors was also described by Madsen et al. (2001) who assumed that errors made when using incorrect values for the atomic displacement parameters are propagated to the quantitative analysis. Le Saoût et al. (2007) examined cementitious materials by use of external and internal methods. They employed the external standard method in order to avoid problems of homogenization. As regards the internal standard method, they expressed doubts as to whether levels of amorphous phases below 10 wt.% can be proven. Le Saoût et al. (2007) also noted that it is imperative to take into consideration the influence of refinement parameters on the quantification of amorphous contents. More research concerning the amorphous level of cements and clinkers was carried out by Whitfield et al. (2003). They employed the internal standard method and calculated an amorphous content in the cement used of 18 to 25 wt.%. They concluded that the most serious source of error is the standard used and its amorphous content. Mathematical consequences of the experimental approach for internal standard methods have been worked out by Westphal et al. (2009). They showed that the calculation of the amorphous content via Rietveld analysis using an internal standard follows a non-linear function, which in turn leads to a significant degree of error, especially when determining minor amounts of amorphous content. Thus, Westphal et al. (2009) concluded that to prove amorphous contents below 20 ma.% using an internal standard is quite a challenging task, because of the considerable degree of error which is also a function of the amount of standard added. For low amounts of amorphous content in the sample (like OPCs) Westphal et al. (2009) recommended an amount of internal standard measuring at least 50 ma.%. Even with that amount of internal standard there exists an uncertainty of the amorphous portion of almost 4 wt.%, as compared to the assumed uncertainty of 1 wt.% of the Rietveld quantification.
It is certainly the case that determination of amorphous contents from analyses using internal standards is a very challenging operation indeed. First of all, a proper mixing of the standard with the sample has to be guaranteed. Furthermore, the experiments are complicated enormously by issues such as micro-absorption, especially if significant differences exist between the respective mass attenuation coefficients of sample on one hand and standard on the other (Hermann and Ermrich, 1989).
Suherman et al. (2002) employed internal and external standard methods in order to examine the amorphous content of different cement clinkers and described an amorphous content in clinkers amounting to between 6.1 and 15.9 wt.%, depending on clinker type and on the method (internal or external standard) used. They refer to O`Connor et al. (1988) who recommended an external standard method using a G-factor for examinations of powdered mixtures as an alternative to conventional discrete peak methods as described by Klug and

Dissertation Daniel Jansen, University Erlangen-Nürnberg, 2011
- 25 -
Alexander (1974) and Chung (1974). O´Connor pointed out that it is imperative to be aware of the degree of crystallinity of the standard used, which ideally should be 100 wt.%. The calculation of a G-factor as a calibration factor for the whole experiment set-up has not subsequently been used for powder diffraction experiments on hydrating cementitious systems.
EXPERIMENTAL
In the experiments we performed we made use of an Ordinary Portland Cement CEMI 52.5R (OPC). As only small amounts of sample are necessary for the XRD experiments performed, representative components for analysis were obtained by using the “cone and quarter” method. All samples were ground to a grain size of about 10 µm using a McCrone micronizing mill (liquid: waterfree ethanol). Standard zircon was recrystallized from Alfa Aesar zircon. To this end the zircon was heated at 1300 °C for 4 h. Afterwards the zircon was cooled in five hours to 150 °C. A second thermal treatment was carried out at 1400 °C for 6 h and the zircon was cooled again. The treated zircon was found to be a suitable standard with a crystallinity as good as the corundum standard recommended by De La Torre (2001).
X-ray powder diffraction patterns were recorded on a D8 automated diffractometer equipped with a Lynx Eye position-sensitive detector. Cement and standard were measured as frontloaded pressed-powder samples, seven times respectively, using the same conditions and settings as shown in Table I.
TABLE I. DATA ACQUISITION CONDITIONS FOR THE X-RAY EXPERIMENTS PERFORMED.
Instrument Bruker D8
Radiation Cu Kα Geometry Bragg-Brentano
Divergence Slit 0.3° Generator 40 mA, 40 kV
Range 7 to70° Step width 0.02°
Integration time / step 1 s Detector Lynx Eye (PS-Detector)
To ensure a proper detection of all phases in the OPC used, minor-phase enrichment experiments were performed. The dissolution of the interstitial phases using KOH sucrose solution permits an accurate analysis of the silicate phases such as alite and belite (Gutteridge, 1979). The dissolution of the silicate phases using a salicylic acid-methanol solution permits an accurate analysis of the interstitial phases (Struble, 1985).
Dissertation Daniel Jansen, University Erlangen-Nürnberg, 2011
- 26 -
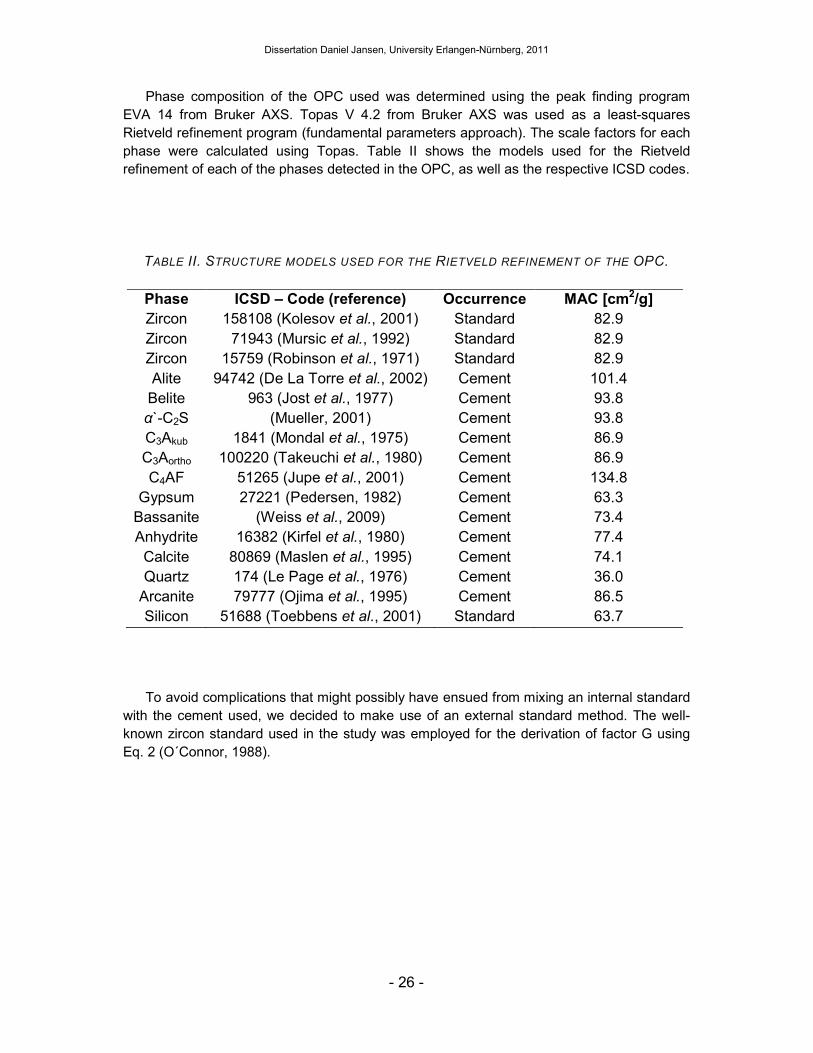
Phase composition of the OPC used was determined using the peak finding program EVA 14 from Bruker AXS. Topas V 4.2 from Bruker AXS was used as a least-squares Rietveld refinement program (fundamental parameters approach). The scale factors for each phase were calculated using Topas. Table II shows the models used for the Rietveld refinement of each of the phases detected in the OPC, as well as the respective ICSD codes.
TABLE II. STRUCTURE MODELS USED FOR THE RIETVELD REFINEMENT OF THE OPC.
Phase ICSD – Code (reference) Occurrence MAC [cm2/g]
Zircon 158108 (Kolesov et al., 2001) Standard 82.9 Zircon 71943 (Mursic et al., 1992) Standard 82.9 Zircon 15759 (Robinson et al., 1971) Standard 82.9 Alite 94742 (De La Torre et al., 2002) Cement 101.4 Belite 963 (Jost et al., 1977) Cement 93.8 α`-C2S (Mueller, 2001) Cement 93.8 C3Akub 1841 (Mondal et al., 1975) Cement 86.9 C3Aortho 100220 (Takeuchi et al., 1980) Cement 86.9 C4AF 51265 (Jupe et al., 2001) Cement 134.8
Gypsum 27221 (Pedersen, 1982) Cement 63.3 Bassanite (Weiss et al., 2009) Cement 73.4 Anhydrite 16382 (Kirfel et al., 1980) Cement 77.4
Calcite 80869 (Maslen et al., 1995) Cement 74.1 Quartz 174 (Le Page et al., 1976) Cement 36.0
Arcanite 79777 (Ojima et al., 1995) Cement 86.5 Silicon 51688 (Toebbens et al., 2001) Standard 63.7
To avoid complications that might possibly have ensued from mixing an internal standard with the cement used, we decided to make use of an external standard method. The well-known zircon standard used in the study was employed for the derivation of factor G using Eq. 2 (O´Connor, 1988).

Dissertation Daniel Jansen, University Erlangen-Nürnberg, 2011
- 27 -
(2)
where Szir = Rietveld scale factor of zircon,
ρzir = density of zircon,
Vzir = unit-cell volume of zircon,
Czir = weight fraction of zircon (100 wt.%),
µ*zir = mass attenuation coefficient (MAC) of zircon.
The calculated Factor G represents a calibration factor for the whole experimental setup and comprises the diffractometer used, radiation, and all data acquisition conditions, such as temperature and integration time. This factor G was then used to determine the mass concentration of each phase j in the sample (Eq. 3). This meant that the sample had to be measured under the same conditions as the standard.
(3)
In multi-phase systems the absorption of X-rays strongly depends on the linear attenuation coefficients and the mean particle size of the single phases. If the linear attenuation coefficients differ strongly from each other, effects of microabsorption can occur if a critical particle size defined by Brindley (1945) is exceeded leading to an underestimation of phases with a high linear attenuation coefficient (De La Torre and Aranda, 2003). The linear attenuation coefficients of the phases of an OPC (except the ferrite phase) do not differ strongly from each other. The ferrite-phase yielding the highest attenuation coefficient only appears as interstitial phase in the multi-phase cement grains of technically produced OPCs. Therefore only small particle sizes (around 1µm) of this phase can be expected leading to negligible microabsorption effects (Le Saout et al., 2010).
zir
zirzirzir
c
VsG zir
*2 µρ=
G
Vsc
SAMPLEjj
jj
*2µρ=

Dissertation Daniel Jansen, University Erlangen-Nürnberg, 2011
- 28 -
In order to evaluate the accuracy of the method presented we applied the method to powder mixtures of known composition. For this purpose we produced mixtures of the zircon standard material and a NIST glass (NIST 622) of defined ratios. The mass attenuation coefficient of the NIST glass is 44.8 cm2/g. The mass attenuation coefficients of the mixtures are shown in Table III. In order to guarantee a proper mixing both components were ground and sieved to a particle size below 5 µm and were then homogenized over 2 weeks. The amount of zircon in the mixtures was calculated using the G-factor derived from the pure zircon standard and the calculated scale factors for zircon from Rietveld refinement of the mixtures.
TABLE III EXAMINED ZIRCON/NIST 622 MIXTURES.
Mixture Zircon [ma.%] NIST 622 [ma.%] MAC [cm2/g]
1 25 75 54.35 2 50 50 63.89 3 75 25 73.44
For all cement phases the values ρ and V were computed within the refinement, both of them being checked against data from the literature (Table II). Scale factors for the phases detected in the OPC were acquired from the Rietveld refinement. The mass attenuation coefficient of the OPC (µ*OPC) was measured and calculated from elemental analysis carried out by X-ray fluorescence spectrometry. The mass attenuation coefficient of the OPC used was found to be 97.9 cm2/g. The chemical composition of the OPC and the mass attenuation coefficients of the oxides used (Prince, 2004) are given in Table IV.

Dissertation Daniel Jansen, University Erlangen-Nürnberg, 2011
- 29 -
TABLE IV. CHEMICAL COMPOSITION AND MASS ATTENUATION COEFFICIENT OF THE OPC
Oxide Wt.% MAC [cm2/g]
CaO 66.7 124.04 × 0.667 = 82.73
SiO2 22.9 36.03 × 0.229 = 8.25
Al2O3 3.8 31.69 × 0.038 = 1.2
Fe2O3 1.3 214.9 × 0.013 = 2.79
MgO 0.8 28.6 × 0.008 = 0.229
Na2O 0.1 24.97 × 0.001 = 0.025
K2O 0.7 122.3× 0.007 = 0.856
SO3 3.4 44.46 × 0.034 = 1.51
TiO2 0.2 124.6 × 0.002 = 0.249
P2O5 0.1 39.66 × 0.001 = 0.04
OPC 97.9
We furthermore made use of different models for the zircon standard used. The authors Mursic et al. (1992), Kolesov et al. (2001) and Robinson et al. (1971) all suggest the same symmetry (I41/amdZ). They differ strongly, however, in their suggestions regarding the refined atomic displacement parameters. When using Rietveld programs, the user has always to ensure that correct values are being employed as regards atomic displacement parameters. Most of the displacement parameters given in the literature are anisotropic displacement factors (e.g. Uaniso/Baniso). When using the GUI (Graphical User Interface) some Rietveld programs will not convert those anisotropic values into equivalent isotropic values. Therefore, in such cases the user needs to calculate the equivalent isotropic displacement factor himself. The calculation of the equivalent isotropic displacement factor is an eigenvalue calculation so that the equivalent isotropic parameter can be easily calculated from the anisotropic values given (Fischer et al. 1988). Secondly, in the crystallographic literature, there tend to occur inconsistent terms and symbols for said parameters (Trueblood et al. 1996). U [Å2] is the mean square displacement of an atom from its equilibrium position
Dissertation Daniel Jansen, University Erlangen-Nürnberg, 2011
- 30 -
x. The Debye-Waller factor B can be derived from U by multiplying the value for U with 8π2. Very often, atomic displacement parameters are given as ßs. These parameters have then to be converted into equivalent Bs for the Rietveld programs, employed while taking into account the reciprocal lattice vectors a*, b* and c*. If these parameters are not converted and inserted into the Rietveld software, then the software will sometimes automatically employ the default value 1, which is in many cases far away from the correct values for ions in inorganic solid-state structures. In order to estimate the error that might possibly ensue from different and/or wrong atomic displacement parameters, we made use of all three zircon structures and added the value 1 at all sides of the zircon structure used by Robinson et al. (1971), knowing that the values are incorrect.
During Rietveld refinement the operator has the opportunity to refine the strain of all phases in the mixture. Real crystals contain imperfections which tend to produce local distortions of the lattice. This fact has an impact on peak profiles (Dinnebier and Billinge, 2008). The refinement of the strain leads to a better agreement between observed and calculated data. Although the refinement of the strain is important, it is not always to be recommended. Especially in a mixture of many phases such as cements, any refinement of the strain might lead to wrong strain values. The fact that many phases in OPCs, such as bassanite, arcanite and C4AF, display small crystallite sizes and are difficult to differentiate from the background also complicates the refinement of the strain. Hence, it is recommended that the strain be refined using the residues of the minor-phase enrichment experiments, keeping these latter fixed while refining the OPC. In order to estimate the error that might be caused by different and/or wrong values for the microstrain, our calculation of the amount of amorphous phase present in the cement that we were using was a calculation of same specifically as a function of the microstrain (Lorentz function) of the major phase alite.
Because of the problems with standard materials just discussed, we also made use of a silicon standard. We ground, to only a very slight degree, a single piece of a silicon single crystal produced for wafer production. These single crystals are known to have a high chemical purity, which in turn is important if one is to proceed on the assumption of a precisely correct mass attenuation coefficient of the standard. Silicon is a highly symmetric material (cubic, Fd-3m) which is very well-known and used very often as a peak position standard. Because of the brittleness of the material one minute’s grinding in a micronizing mill entirely sufficed in order to achieve our purpose. For this reason, we assume that no amorphous content was produced during the grinding process.
Dissertation Daniel Jansen, University Erlangen-Nürnberg, 2011
- 31 -
RESULTS AND DISCUSSION
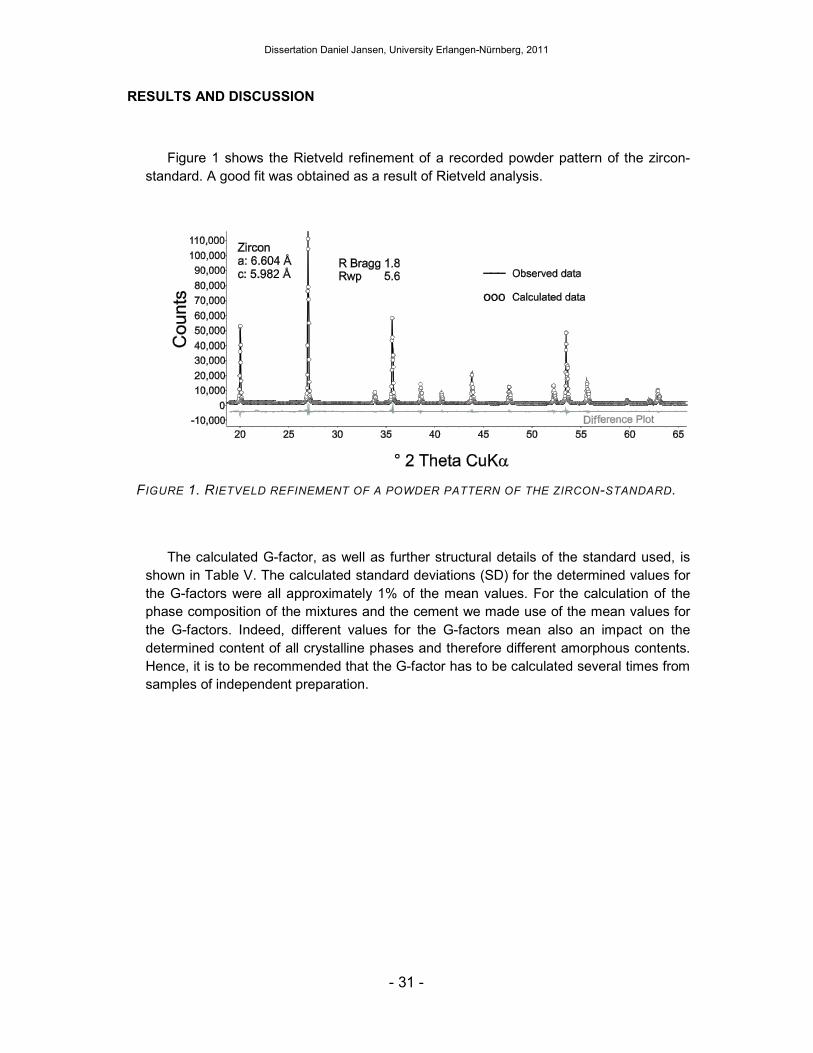
Figure 1 shows the Rietveld refinement of a recorded powder pattern of the zircon-standard. A good fit was obtained as a result of Rietveld analysis.
FIGURE 1. RIETVELD REFINEMENT OF A POWDER PATTERN OF THE ZIRCON-STANDARD.
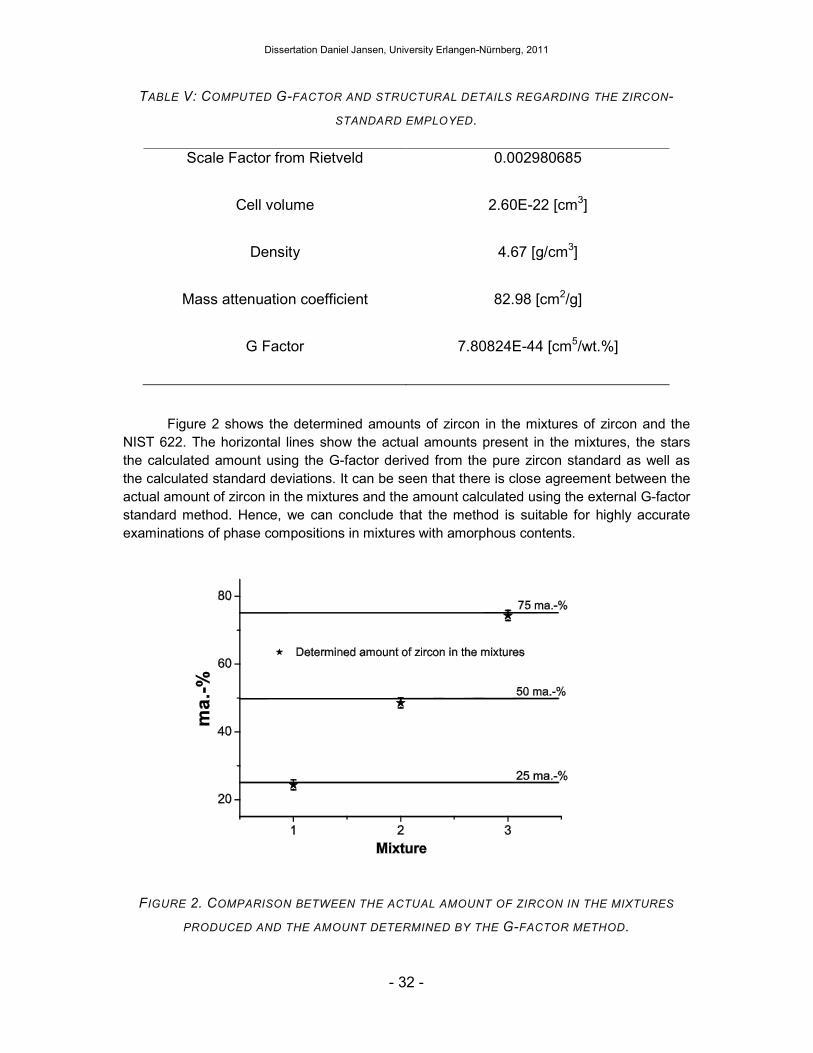
The calculated G-factor, as well as further structural details of the standard used, is shown in Table V. The calculated standard deviations (SD) for the determined values for the G-factors were all approximately 1% of the mean values. For the calculation of the phase composition of the mixtures and the cement we made use of the mean values for the G-factors. Indeed, different values for the G-factors mean also an impact on the determined content of all crystalline phases and therefore different amorphous contents. Hence, it is to be recommended that the G-factor has to be calculated several times from samples of independent preparation.
Dissertation Daniel Jansen, University Erlangen-Nürnberg, 2011
- 32 -
TABLE V: COMPUTED G-FACTOR AND STRUCTURAL DETAILS REGARDING THE ZIRCON-
STANDARD EMPLOYED.
Scale Factor from Rietveld 0.002980685
Cell volume 2.60E-22 [cm3]
Density 4.67 [g/cm3]
Mass attenuation coefficient 82.98 [cm2/g]
G Factor 7.80824E-44 [cm5/wt.%]
Figure 2 shows the determined amounts of zircon in the mixtures of zircon and the NIST 622. The horizontal lines show the actual amounts present in the mixtures, the stars the calculated amount using the G-factor derived from the pure zircon standard as well as the calculated standard deviations. It can be seen that there is close agreement between the actual amount of zircon in the mixtures and the amount calculated using the external G-factor standard method. Hence, we can conclude that the method is suitable for highly accurate examinations of phase compositions in mixtures with amorphous contents.
FIGURE 2. COMPARISON BETWEEN THE ACTUAL AMOUNT OF ZIRCON IN THE MIXTURES
PRODUCED AND THE AMOUNT DETERMINED BY THE G-FACTOR METHOD.

Dissertation Daniel Jansen, University Erlangen-Nürnberg, 2011
- 33 -
All phases detectable in the residues of the minor-phase enrichment experiments of the cement used are shown in Table VI.
TABLE VI. PHASES DETECTED IN THE RESIDUES OF THE MINORPHASE ENRICHMENT
EXPERIMENTS (ICDD-PDF-CODE).
Phases in the residue using KOH
sucrose solution
Phases in the residue using salicylic
acid-methanol solution
Alite (42-0551) C3Akub (38-1429) Belite (33-0302) C3Aortho (32-0150)
α`-C2S (Mueller, 2001) C4AF (30-0226) Calcite (05-0586) Gypsum (33-0311) Quartz (46-1045) Bassanite (41-0224)
Anhydrite (37-1496) Calcite (05-0586) Quartz (46-1045) Arcanite (83-0684)
The calculated phase composition for the OPC used, including the amorphous content which was established (actual: amorphous + not determined + misfitted) are shown in Table VII (Standard: Zircon #158108). It was found that the OPC does not contain significant quantities of amorphous material. All in all, we were only able to observe an amorphous content of around 3.3 wt.%. In view of the large error of 3.9 wt.%, resulting from the additive effect of the errors of each single phase, we were not in the end able to prove the existence of any amorphous phase. The Rietveld refinement of the OPC is shown in Figure 3.

Dissertation Daniel Jansen, University Erlangen-Nürnberg, 2011
- 34 -
TABLE VII. DETERMINATION OF CONCENTRATIONS OF ALL PHASES IN THE OPC USED.
Phase wt.% SD [wt.%]
Alite 56.8 1.2 Belite 13.1 0.6
Alpha`C2S 9.2 0.5 C3Acub 4.4 0.3
C3Aortho 3.9 0.3 C4AF 1.8 0.2
Gypsum 1.0 0.1 Bassanite 1.2 0.1 Anhydrite 2.0 0.2
Calcite 2.0 0.2 Quartz 0.4 0.1
Arcanite 0.9 0.1 XX (total of crystalline phases) 96.7 +/- 3.9
Amorphous + not determined + misfitted 3.3 +/- 3.9
FIGURE 3. RIETVELD REFINEMENT OF A POWDER PATTERN OF THE OPC USED.
Except for some problems in the fit of the major phase alite, there is close agreement between the observed and the calculated data. Due to the fact that the fit for alite is not perfect – depending on superstructure and/or MI/MIII modifications – we assume that the misfit of the major phase alite is the cause of the amorphous content which was established, and which is, in this specific case, no glassy component but rather non-fitted parts of the

Dissertation Daniel Jansen, University Erlangen-Nürnberg, 2011
- 35 -
crystalline phases. If we use the silicon as standard for the derivation of the factor G-factor, we even arrive at an amount of 98.8 wt.% of crystalline phases, assuming the same error of 3.9 wt.% (Figure 4).
FIGURE 4. AMORPHOUS CONTENT OF THE OPC USED AS A FUNCTION OF STRUCTURES
AND ATOMIC DISPLACEMENT PARAMETERS.
Since the silicon powder used was acquired from a single crystal, there is no reason to assume that it has a lower degree of crystallinity than commercial zircon powder. The Rietveld refinement of the silicon powder is shown in Figure 5.
FIGURE 5. RIETVELD REFINEMENT OF A POWDER PATTERN OF THE SILICON STANDARD.

Dissertation Daniel Jansen, University Erlangen-Nürnberg, 2011
- 36 -
Furthermore, we calculated the G-factor using the zircon structures and the atomic displacement parameters reported by Mursic et al. (1992) and Robinson et al. (1971). These G-factors were then used to calculate over again the entire phase composition of the cement. Figure 4 shows the amorphous content of the cement as a function of the structures of the zircon employed. The higher the atomic displacement parameters in the structure of the standard are, the higher the calculated amount of the amorphous content of the investigated OPC. This fact might possibly be explained as follows.
The atomic displacement factors modify the atomic form factor f and consequently also the structure factor F. Where the atomic displacement factors U increase, the structure factor decreases correspondingly (Eq. 4; Dinnebier and Billinge, 2008).
F ~ f ~ e-U (4)
The structure factor F, in its turn, is proportional to the relative intensity I resulting from the proposed structure (Eq. 5; Young, 1995).
I ~ [F]2 (5)
The scale factors s obtained via Rietveld refinement convert the relative intensities resulting from the structures into the absolute intensities obtained from the experiment (Eq. 6; Hubbard et al., 1976).
Iabsolute = s × Irelative (6)
Where there obtains a low relative intensity due to large atomic displacement parameters, the Rietveld scale factor will tend to be high. This will in turn tend to give rise to a G-factor which is oversized, and which will therefore result in an undersizedness of every single phase in the mixture (Eqs. 2 and 3). In this case, it is not to be recommended that one refer to an “amorphous content” in respect of the difference between the total of crystalline phases and 100 wt.%, since it might be understood as a glassy (not crystalline) component.
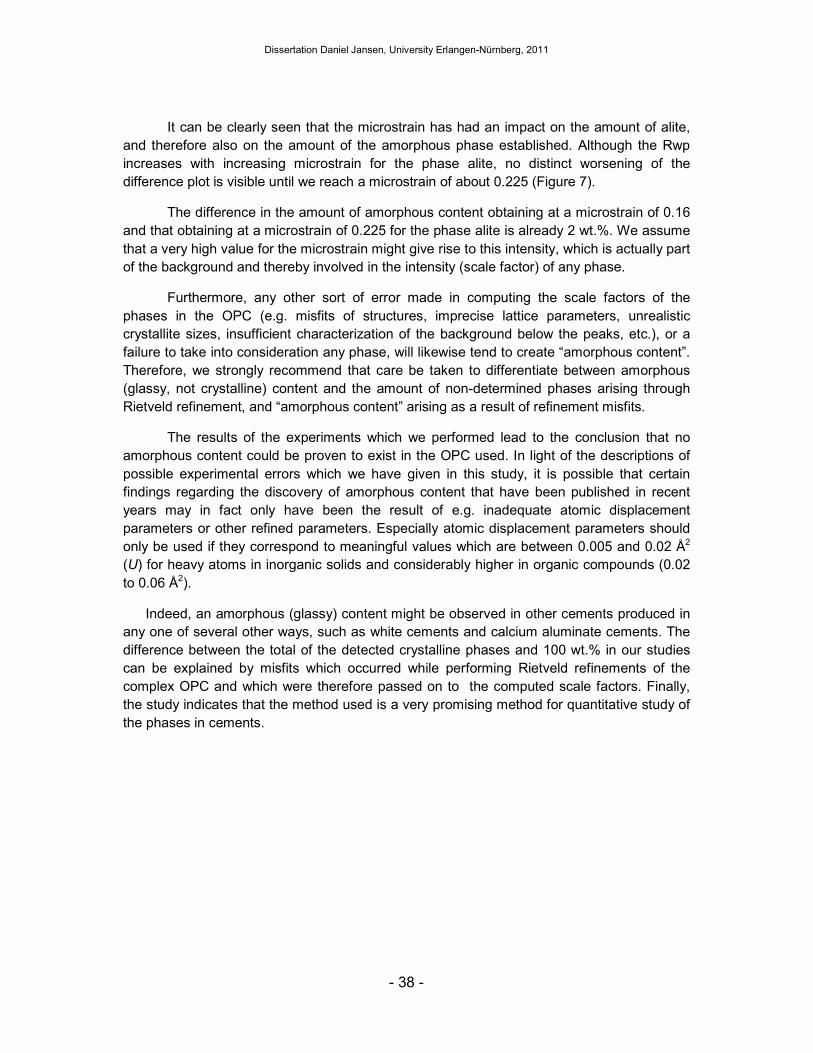
Figure 6 shows the amorphous content of the OPC which we investigated as a function of the microstrain for the major phase alite, as well as the Rwp of the refinement.

Dissertation Daniel Jansen, University Erlangen-Nürnberg, 2011
- 37 -
FIGURE 6. AMORPHOUS CONTENT OF THE OPC USED AS A FUNCTION OF THE
MICROSTRAIN FOR ALITE.
FIGURE 7. RIETVELD REFINEMENT OF A POWDER PATTERN OF THE OPC USED USING
DIFFERENT MICROSTRAINS FOR ALITE.
Dissertation Daniel Jansen, University Erlangen-Nürnberg, 2011
- 38 -
It can be clearly seen that the microstrain has had an impact on the amount of alite, and therefore also on the amount of the amorphous phase established. Although the Rwp increases with increasing microstrain for the phase alite, no distinct worsening of the difference plot is visible until we reach a microstrain of about 0.225 (Figure 7).
The difference in the amount of amorphous content obtaining at a microstrain of 0.16 and that obtaining at a microstrain of 0.225 for the phase alite is already 2 wt.%. We assume that a very high value for the microstrain might give rise to this intensity, which is actually part of the background and thereby involved in the intensity (scale factor) of any phase.
Furthermore, any other sort of error made in computing the scale factors of the phases in the OPC (e.g. misfits of structures, imprecise lattice parameters, unrealistic crystallite sizes, insufficient characterization of the background below the peaks, etc.), or a failure to take into consideration any phase, will likewise tend to create “amorphous content”. Therefore, we strongly recommend that care be taken to differentiate between amorphous (glassy, not crystalline) content and the amount of non-determined phases arising through Rietveld refinement, and “amorphous content” arising as a result of refinement misfits.
The results of the experiments which we performed lead to the conclusion that no amorphous content could be proven to exist in the OPC used. In light of the descriptions of possible experimental errors which we have given in this study, it is possible that certain findings regarding the discovery of amorphous content that have been published in recent years may in fact only have been the result of e.g. inadequate atomic displacement parameters or other refined parameters. Especially atomic displacement parameters should only be used if they correspond to meaningful values which are between 0.005 and 0.02 Å2 (U) for heavy atoms in inorganic solids and considerably higher in organic compounds (0.02 to 0.06 Å2).
Indeed, an amorphous (glassy) content might be observed in other cements produced in any one of several other ways, such as white cements and calcium aluminate cements. The difference between the total of the detected crystalline phases and 100 wt.% in our studies can be explained by misfits which occurred while performing Rietveld refinements of the complex OPC and which were therefore passed on to the computed scale factors. Finally, the study indicates that the method used is a very promising method for quantitative study of the phases in cements.

Dissertation Daniel Jansen, University Erlangen-Nürnberg, 2011
- 39 -
CONCLUDING REMARKS
The hydration of OPCs is a complex scientific issue and the kinetics of the hydration process is a topic which is still under discussion. Several scientists have published articles quantifying the crystalline phases of cement pastes during the process of hydration (Hesse et
al., 2009; Scrivener et al., 2004). During hydration of OPCs, a C-S-H phase is formed which is hardly to be detected by X-ray diffraction because of its low degree of crystallinity. In order to arrive at the true phase content of each phase in the cement paste, the results obtained via Rietveld analyses have to be converted – namely, by taking into account also the C-S-H phase, the free water, and the bounded water (Hesse et al ., 2009). The implementation of the method presented in this paper offers a lot of advantages. Firstly, the concentration obtaining in each phase can be detected directly from the scale factor. Secondly, errors in Rietveld quantification do not, here, necessarily have an impact on the other phases present in the OPC paste. Lastly, the difference between the total of crystalline phases and 100 wt.% can be attributed directly to the amorphous components in the OPC paste, e.g. not to crystalline bounded water and to C-S-H phase. This makes it possible to calculate the amorphous content of the cement paste during hydration. The G-factor method which we have presented is very promising for the quantitative study of cement hydration.
ACKNOWLEDGEMENTS
The authors would like to thank Rainer Hock and Helmuth Zimmermann of the Department of Crystallography and Structural Physics for useful discussion.

Dissertation Daniel Jansen, University Erlangen-Nürnberg, 2011
- 40 -
References
Brindley, G.W. (1945). “The Effect of Grain or Particle Size on X-ray Reflections from Mixed Powders and Alloys, considered in relation to the Quantitative Determination of Crystalline Substances by X-ray Methods.” Phil. Mag. (7) 36, 347-369.
Chung, F.H. (1974). “Quantitative Interpretation of X-ray Diffraction Patterns of Mixtures. II. Adiabatic Principle of X-ray Diffraction Analysis of Mixtures.” J. Appl. Cryst. 7, 526-531.
De La Torre, A.G., Bruque, S. and Aranda, M.A.G. (2001). “Rietveld quantitative amorphous content analysis,” J. Appl. Cryst. 34, 196-202.
De La Torre, A.G., Bruque, S., Campo, J. and Aranda, M.A.G. (2002). “The superstructure of C3S from synchrotron and neutron powder diffraction and its role in quantitative phase analysis.” Cem. Concr. Res. 32, 1347-1356.
De La Torre, A.G. and Aranda, M.A.G. (2003). “Accuracy in Rietveld quantitative phase analysis of Portland cements.” J. Appl. Cryst. 36, 1169-1176.
Dinnebier, R.E. and Billinge, S.J.L. (2008). Powder Diffraction, Theory and Practice (The Royal Society of Chemistry, Cambridge).
Fischer, R.X. and Tillmanns, E. (1988). “The equivalent isotropic displacement factor.” Acta Cryst. C44, 775-776.
Gutteridge, W.A. (1979). “On the dissolution of the interstitial phases in Portland Cement,” Cem. Concr. Res. 9, 319-324.
Han, K.S., Glasser, F.P. and Gard, J.A. (1980). “Studies of the crystallization of the liquid phase in Portland Clinker,” Cem. Concr. Res. 10, 443-448.
Hermann, H. and Ermrich, M. (1989). “Microabsorption Correction of X-ray Intensities Diffracted by Multiphase Powder Specimens,” Powder Diffr. 4, 189-195.
Hesse, Ch., Goetz-Neunhoeffer, F., Neubauer, J., Braeu, M. and Gaeberlein, P. (2009). “Quantitative in-situ X-ray diffraction analysis of early hydration of white cement,” Powder Diffr. 24, 112-115.
Hill, R.J. and Howard, C.J. (1987). “Quantitative Phase Analysis from Neutron Powder Diffraction Data using the Rietveld Method,” J. Appl. Cryst. 20, 467-474.
Hubbard, C.R., Evans, E.H. and Smith, D.K. (1976). “The Reference Intensity Ration I/Ic for Computer Simulated Powder Patterns.” J. Appl. Cryst. 9, 169-174.
Jost, K.H., Ziemer, B. and Seydel, R. (1977). “Redetermination of the structure of β-Dicalcium Silicate.” Acta Cryst. B33, 1696-1700.
Jupe, A.C., Cockcroft, J.K., Barnes, P. Colston, S.L., Sankar, G. and Hall, C. (2001). “The site occupancy of Mg in the brownmillerite structure and its effect on hydration properties: An X-ray/neutron diffraction and EXAFS study.” J. Appl. Crystallogr. 34, 55-61.
Kirfel, A. and Will, G. (1980). “Charge density in anhydrite CaSO4, from X-ray and neutron diffraction measurements. Acta Cryst. B36, 2881-2890.

Dissertation Daniel Jansen, University Erlangen-Nürnberg, 2011
- 41 -
Klug, H.P. and Alexander, L.E. (1974). X-ray Diffraction Procedures 2nd ed. (J. Wiley and Sons, New York).
Kolesov, B.A., Geiger, C.A. and Armbruster T. (2001). “The dynamic properties of zircon studied by single-crystal X-ray diffraction and Raman spectroscopy.” Eur. J. Mineral. 13, 939-948.
Le Page, Y. and Donnay, G. (1976). “Refinement of the Crystal Structure of Low-Quartz.” Acta Cryst. B32, 2456-2459.
Le Saoût, G., Füllmann, T., Kocaba, V. and Scrivener, K.L. (2007). “Quantitative study of cementitious materials by X-ray diffraction. Rietveld analysis using an external standard.” 12th ICCC, Montreal.
Le Saoût, G., Kocaba, V. and Scrivener, K. (2010). “Application of the Rietveld method to the analysisof anhydrous cement.” Cem. Concr. Res. (available online)
Madsen, I.C., Scarlett, N.V.Y., Cranswick, L. M. D. and Lwin, T. (2001). “Outcomes of the International Union of Crystallography Commission on Powder Diffraction Round Robin on quantitative phase analysis: samples 1a to 1h.” Journal of Appl. Cryst. 34, 409-426.
Maki, I. (1979). “Mechanism of glass formation in Portland Cement Clinker,” Cem. Concr. Res. 9, 757-763.
Maslen, E.N., Streltsov, V.A. and Streltsova, N.R. (1995). “Electron density and optical anisotropy in rhombohedral carbonates. III. Synchroton X-ray studies of CaCO3, MgCO3 and MnCO3. Acta Cryst. B51, 929-939.
Mondal, P. and Jeffery, J.W. (1975). “The crystal structure of tricalcium aluminate, Ca3Al2O6.” Acta Cryst. B31, 689-697.
Mueller, R. (2001). “Stabilisierung verschiedener Dicalciumsilikat-Modifikationen durch den Einbau von Phosphat: Synthese, Rietveld-Analyse, Kalorimetrie,“ Diploma Thesis University of Erlangen.
Mursic, Z., Vogt, T., Boysen, H. and Frey, F. (1992).“Single-Crystal Neutron Diffraction Study of Metamict Zircon uo to 2000 K” J. Appl. Cryst. 25, 519-523.
O´Connor, B.H. and Raven, M.D. (1988). “Application of the Rietveld Refinement Procedure in Assaying Powdered Mixtures,” Powder Diffr. 3, 2-6.
Ojima, K., Hishihata, Y. and Sawada, A. (1995). “Structure of Potassium Sulfate at Temperatures from 296 K down to 15 K.” Acta Cryst. B51, 287-293
Pedersen, B. F. (1982). “Neutron diffraction refinement of the structure of gypsum.” Acta Cryst. B38, 1074-1077.
Prince, E. (2004). International Tables for Crystallography, Volume C: Mathematical, Physical and Chemical Tables 3rd Edition (Wiley)
Rietveld, H.M. (1969). “A profile refinement method for nuclear and magnetic structures,” J. Appl. Crystallogr. 41, 65-71.

Dissertation Daniel Jansen, University Erlangen-Nürnberg, 2011
- 42 -
Robinson, K., Gibbs, V. and Ribbe, P.H. (1971). “The structure of zircon: A comparison with garnet” The American Mineralogist 56, 782-791.
Scrivener, K.L., Füllmann, T., Gallucci, E., Walenta, G. and Bermejo, E. (2004).“Quantitative study of Portland cement hydration by X-ray diffraction/Rietveld analysis and independent methods,” Cem. Concr. Res. 34, 1541-1547.
Struble, L.J. (1985). “The effect of water on maleic acid and salicylic acid extractions,” Cem. Concr. Res. 15, 631-636.
Suherman, P.M., van Riessen, A., O´Connor, B., Li, D., Bolton, D. and Fairhurst, H. (2002). “Determination of amorphous phase levels in Portland cement clinker,” Powder Diffr. 17, 178-185.
Takeuchi, Y. and Nishi, F. (1980). “Crystal-chemical characterization of the 3 CaO * Al2O3 –Na2O solid-solution series.” Zeitschrift für Kristallographie 152, 259-307.
Taylor, H.F.W. (1997). Cement Chemistry (Thomas Telford Publishing, London).
Toebbens, D.M., Stuesser, N., Knorr, K., Mayer, H.M. and Lampert, G. (2001). “The new high-resolution neutron powder diffractometer at the Berlin neutron scattering center.” Materials Science Forum. 378, 288-293
Trueblood, K.N., Bürgi, H.-B., Burzlaff, H., Dunitz, J.D., Gramaccioli, C.M., Schulz, H.H., Shmueli, U. and Abrahams, S.C. (1996). “Atomic displacement parameter nomenclature report of a subcommittee on atomic displacement parameter nomenclature.” Acta Cryst. A52, 770-781.
Weiss, H. and Bräu, M.F. (2009). “How much water does calcined gypsum contain?” Angew. Chem. Int. Ed. 48, 3520-3524
Westphal, T., Füllmann, T. and Pöllmann, H. (2009). “Rietveld quantification of amorphous portions with an internal standard-Mathematical consequences of the experimental approach.” Powder Diffraction. 24, 239-243.
Whitfield, P.S. and Mitchell, L.D. (2003). “Quantitative Rietveld analysis of the amorphous content in cements and clinkers,” J. Mat. Sc. 38, 4415-4421.
Young, R.A. (1995). The Rietveld method (Oxford University Press, New York).

Dissertation Daniel Jansen, University Erlangen-Nürnberg, 2011
- 43 -
4.2. XRD QUANTIFICATION OF CEMENT HYDRATION USING AN EXTERNAL STANDARD
(PUBLISHED IN CCR)
A Remastered External Standard Method Applied to the Quantification of Early OPC Hydration
Daniel Jansen, Friedlinde Goetz-Neunhoeffer, Christopher Stabler and Jürgen Neubauer
Published in: Cement and Concrete Research (2011), 41, 602-608
A promising external standard method, first described by O´Connor [15], was used to determine the quantitative phase composition of a hydrating cement paste. On the basis of the data produced we can conclude that the method used is absolutely to be recommended for the examination of OPC pastes, since it displays many advantages in comparison to internal standard methods and other methods. No reaction of the phase alite could be detected during the initial and the induction period of the cement hydration. Additionally it was found that the cement phases involved in the aluminate reaction (bassanite, gypsum, anhydrite and C3A) react successively. The changes detected in the phase composition of the OPC paste could be assigned to the different periods of OPC hydration.
Keywords: Hydration (A); Kinetics (A); Amorphous Material (B); X-Ray Diffraction (B); Cement Paste (C)
Introduction
The hydration of Ordinary Portland Cements (OPCs) is a complex scientific issue. The kinetics behind the hydration process are still a subject of scientific debate. X-ray diffraction (XRD) analysis is a suitable method for examining the hydration process.
Hence, several scientists have published articles in which the quantities of the crystalline phases of cement pastes were measured during the process of hydration. During the early stages of the hydration process, OPCs form portlandite and a C-S-H phase of varying composition [1, 2] which is hard to detect by X-ray diffraction because of its low degree of crystallinity. In addition to this, the water added to the cement cannot be quantified directly by means of X-rays and if AFm phase is present it may also have a low degree of crystallinity. During the aluminate reaction, ettringite is formed from calcium sulfate and tricalcium aluminate (C3A) [3].

Dissertation Daniel Jansen, University Erlangen-Nürnberg, 2011
- 44 -
( )
( )∑=
=n
i
ii
jj
j
ZMVS
ZMVSc
1
Rietveld analysis always gives the total of the crystalline phases as determined, normalized to 100 wt.-% (equation 1). If amorphous phases are present (in the case of OPCs at least C-S-H phase and water), then the amounts of crystalline phases calculated by the analysis will differ from the actual amounts present. In addition, any error made in computing any phase (e.g. wrong use of preferred orientation, wrong use of the micro strain,…) of the mixture will have an impact on the calculated amount of all phases in the mixture. Besides, every unidentified phase will lead to a falsification of the results when using a normalization to 100 wt.-%.
Equ. 1
where cj = Weight fraction of phase j
Sj = Rietveld scale factor of phase j
Z = Number of formula units per unit cell
M = Mass of the formula unit
V = Unit-cell volume
Several articles have been published describing methods which might possibly be used to avoid the problem of falsequantitative results for the crystalline phases in the cement paste.
The problem of false Rietveld results can be overcome by plotting e.g. peak areas [4], normalized peak areas [5] or relative peak intensities [6]. This approach does indeed have certain advantages. The peak areas as well as the peak intensities can show any decrease or increase of phase contents in a cement paste. Since there is here no normalization to 100 wt.-%, it can be ensured that there is no falsification of the data caused by the normalization process. No error committed while determining the peak areas or the peak intensities of one phase will necessarily have any impact on the calculated peak areas or peak intensities of the other phases present in the cement paste. Unfortunately, it is not possible to calculate by this method actual quantities given in wt.-% of the cement paste.
In order to arrive at the actual phase content of each phase in the cement paste in wt.-%, the results obtained via Rietveld analysis can be converted, taking into account the C-S-H phase, free water and bound water [7, 8]. Therefore, a fixed chemical composition of the C-S-H phase has to be assumed based on a thinkable reaction of alite with water to portlandite and C-S-H (e.g. equation 4, C1.7SH2.6) and the amount of C-S-H phase has to be calculated from the amount of portlandite detected. If the assumed chemical composition differs strongly

Dissertation Daniel Jansen, University Erlangen-Nürnberg, 2011
- 45 -
from the actual composition, a systematic error in the phase composition of the cement paste may occur. Any error in the determination of the amount of portlandite will falsify the amount of the C-S-H phase as well.
Other possibilities are standard methods. An internal standard material can be added, in order to arrive at the phase composition of the crystalline phases as well as the amount of the amorphous content of the cement paste (C-S-H phase and water) [9, 10]. If an internal standard is added to the cement, it is possible that this standard material will have an impact on the hydration of the cement. Westphal et al. [11] recommend an amount of internal standard for a system with approximately 35 wt.-% of amorphous content (depends on amount of C-S-H phase and water in a cement paste) in order to minimize the uncertainty of the results for the amorphous content of the sample. The uncertainty is in this case a function of the amount of internal standard added to the sample and is based on mathematical consequences of the internal standard method. An amount of 40 wt.-% of internal standard would have an impact on the hydration behavior because of the dilution of the cement phases in the sample. Proper mixing of the standard with the cement has also to be ensured, and issues such as micro-absorption have to be taken into account, especially if the mass attenuation coefficients of sample and standard differ significantly from one another [12].
Recently, it has been shown that the scale factor calculated during Rietveld refinement is also suitable for calculating quantities in the cement paste [13, 14].
To avoid complications that might be caused by mixing an internal standard with the OPC used, we decided to make use of an external standard method which was first described by O`Connor [15] but which has not since been used again for the quantification of cement pastes. The method has already been used successfully for the quantification of cements, cement/fly ash-mixtures [21, 17] and also organic mixtures [51].
Materials and Methods
In our experiments we made use of an Ordinary Portland Cement (CEMI 52.5R). To ensure a proper detection of all phases in the OPC used, minor phase enrichment experiments were performed. The dissolution of the interstitial phases by application of KOH solution allows an accurate analysis of the silicate phases, such as alite, belite, α`-C2S [18] (Gutteridge, 1979). Conversely, the dissolution of the silicate phases using a salicylic acid-methanol solution allows an accurate analysis of the interstitial phases [19] (Struble, 1985).
As only small amounts of sample are necessary for the XRD experiments performed, representative components for analysis were obtained by using the “cone and quarter” method. In order to acquire the best crystalline material available, we made use of a single silicon crystal produced for wafer production. We carefully ground a piece of said single silicon crystal so as to produce a powder of suitable grain size for the X-ray experiments. These single crystals are known to have a high chemical purity (99.999%), which in turn is important when assuming the right mass attenuation coefficient of the standard. Silicon is a

Dissertation Daniel Jansen, University Erlangen-Nürnberg, 2011
- 46 -
highly symmetric material (cubic; Fd-3mS) which is very well known for its use as peak position standard material. Because of its brittleness, grinding it for just one minute in a micronizing mill was sufficient to achieve our purposes. We therefore assume that no significant amorphous content was produced during the grinding procedure.
The well known silicon standard used in the study was employed for derivation of factor G using equation 2 [15]. Scale factors were obtained from Rietveld refinement [16] using the fundamental parameters approach and the Rietveld-software Topas V4.0. All structures used for the refinement are shown in Table 1.
Equ. 2
where Ssil = Rietveld scale factor of silicon from Rietveld analysis
ρsil = density of silicon
Vsil = Unit-cell volume of silicon
Csil = Weight fraction of silicon (100 wt.-%)
µ* =Mass attenuation coefficient of silicon
Since silicon is difficult to handle and to prepare, we made use of the factor G derived from the crystalline silicon in order to calibrate a secondary quartz standard of not exactly known chemical composition (and therefore unknown mass attenuation coefficient) cut from quartzite-rock, which was delivered from Bruker AXS along with the diffractometer which we also used. We made use of the secondary standard quartzite because it has not to be prepared for every measurement. The calibration of the quartzite was performed with 8 measurements for the silicon and the quartzite respectively. The mean values for the scale factors were used. The standard deviation for the scale factors were 0.8 % of the mean values for the scale factors.
The factor G is, amongst others, a function of the Rietveld scale factor. The scale factor depends also on the performance of the X-ray tube, which tends to suffer a degree of performance loss over time. Figure 1 shows the development of the scale factor for the standard quartzite material, as delivered from Bruker AXS. It can be seen that the factor G has to be calculated separately for each measurement. If the factor G is calculated at a point in time lying long before the actual measurement of the sample, this will result in an underestimation of the crystalline material and an overestimation of the amorphous content of the sample. For this reason, the period of time allowed to elapse between the time of the
sil
silsilsil
silc
VsG
*2 µρ=

Dissertation Daniel Jansen, University Erlangen-Nürnberg, 2011
- 47 -
measurement of the standard material and that of the measurement of the sample should not amount to more than 7 days.
TAB. 1: STRUCTURES USED FOR THE RIETVELD REFINEMENTS PERFORMED
Phase ICSD Code Reference
Alite (C3S) 94742 De La Torre et al. (2002) [37] Belite (C2S) 963 Jost et al. (1977) [38]
α`-C2S - Mueller (2001) [39] C3A cubic 1841 Mondal and Jeffery (1975) [40]
C3A orthorombic 100220 Takéuchi and Nishi (1980) [41] C4AF 51265 Jupe et al. (2001) [42]
Gypsum 27221 Pedersen et al. (1982) [43] Bassanite 380286 Weiss and Bräu (2009) [44] Anhydrite 16382 Kirfel and Will (1980) [45]
Calcite 80869 Maslen (1995) [46] Quartz 174 Le Page and Donnay (1976) [47]
Arcanite 79777 Ojima et al. (1995) [48] Ettringite 155395 Goetz-Neunhoeffer and Neubauer (2006) [49]
Portlandite 34241 Busing and Levy (1986) [50]
FIG. 1: CHANGE IN THE SCALE FACTOR AND FACTOR G OVER TIME (10 MONTH)

Dissertation Daniel Jansen, University Erlangen-Nürnberg, 2011
- 48 -
The factor G as calculated is a calibration constant for the whole experimental set-up and includes the diffractometer set-up used, as well as radiation and all data-acquisition conditions such as temperature (dislocation parameters of the atoms in the structures [21]) and counting time. The factor G arrived at was then used to determine the mass concentration of each phase j in the hydrating cement paste (equation 3). This made it imperative that the sample be measured under the same conditions as the standard. Since the cement paste was covered, when being measured, with a Kapton film which can cause absorption of X-rays and thereby intensity loss, it was necessary that the standard material be measured covered with the Kapton film as well. Otherwise the intensities of the standard material might have been be misinterpreted, with compensation in the scale factor, thus giving rise to an inaccurate factor G.
Equ. 3
The values ρ and V for each phase were computed within the refinement, being checked against data from the literature (data sets from ICSD). Scale factors for the phases detected in the OPC were taken from Rietveld refinement. The mass attenuation coefficient of the OPC µ*OPC was calculated from elemental analysis measured by X-ray fluorescence spectrometry. Said mass attenuation coefficient of the OPC used was found to be 97.95 cm2/g, using data for mass attenuation coefficients from the International Tables for Crystallography [20]. Since we made use of a w/c ratio of 0.5, the mass attenuation of the sample µ*SAMPLE (cement paste) turned out finally to be 68.7 cm2/g. The chemical composition and the phase composition of the OPC used is given in table 2. A detailed discussion concerning the amorphous content of Portland cements is given elsewhere [21].
G
Vsc
SAMPLEjj
jj
*2µρ=

Dissertation Daniel Jansen, University Erlangen-Nürnberg, 2011
- 49 -
TAB. 2: PHASE COMPOSITION AND CHEMICAL COMPOSITION OF THE OPC (CEMI 52.5R)
USED
Phase wt.-% oxide wt.-%
Alite (C3S) 57.7 +/- 1.2 CaO 66.2 Belite (C2S) 11.7 +/- 0.6 SiO2 22.6
α`-C2S 8 +/- 0.5 Al2O3 4.1 C3A cubic 5.6 +/- 0.3 Fe2O3 1.3
C3A orthorombic 4.8 +/- 0.3 MgO 0.8 C4AF 1.9 +/- 0.2 K2O 0.7
Gypsum 0.8 +/- 0.1 Na2O 0.1 Bassanite 1.5 +/- 0.1 SO3 3.4 Anhydrite 3 +/- 0.2
Calcite 2.2 +/- 0.2 Quartz 0.9 +/- 0.1
Arcanite 0.9 +/- 0.1 Amorphous/misfitted 1
For the in-situ XRD analysis a custom-made sample holder was used [22]. Cement and water were mixed by external stirring for one minute, using an electronical stirrer which allows a reproducible stirring. The paste was then prepared into the sample holder and covered by a 7.5 µm thick Kapton polyimide film. The diffraction patterns were recorded using a D8 diffractometer (Bruker) equipped with a LynxEye PS-Detector. We made use of CuKα radiation at 40 kV and 40 mA and recorded from 7° 2θ to 40° 2θ with a step width of 0.0236 and 0.58s, counting time per step. Under these data acquisition conditions, it is possible to record 88 ranges within the first 22 hours of hydration. The Rietveld program used was Topas 4.2 from Bruker AXS. The background caused by the Kapton polyimide film was fitted with a specific background model. To this end the Kapton foil was strechted over a single crystal sample holder and the pattern of the Kapton foil was fitted with a peaks phase which was later used for the refinement of the cement paste [7].

Dissertation Daniel Jansen, University Erlangen-Nürnberg, 2011
- 50 -
Results
Figure 2 shows the refined XRD pattern of the cement paste after 22 hours of hydration.
There is close agreement between the observed data and the calculated data. At this point in time after the start of hydration there was no sign for AFm phase and the peak of the C-S-H phase was not very distinct.
FIG. 2: REFINED PATTERN OF THE CEMENT PASTE AT 23 °C AND W/C = 0.5 AFTER 22 H
HYDRATION
Figure 3 shows the alite content over time, within the first 22 hours of hydration, from 4 measurements with individual preparation. It can be clearly seen that the results for the phase alite during hydration are reproducible. The results of all other phases were as good as that of the alite in terms of reproducibility. The biggest error occurred regarding the total amount detected. Since we can detect 57.7 wt.-% of alite in the dry cement, we can assume about 38 wt.-% in the cement paste (w/c=0.5), if no alite reacts immediately after mixing the cement with water. Figure 3 shows that we can indeed find that amount in the first XRD pattern of the hydrating cement paste, considering the single standard deviation from 1 wt.-% of our experiments. Therefore, we cannot prove that alite dissolves immediately with water, forming C-S-H and portlandite. In addition, we cannot detect portlandite in the first XRD patterns.

Dissertation Daniel Jansen, University Erlangen-Nürnberg, 2011
- 51 -
FIG. 3: ALITE CONTENT DURING HYDRATION OF THE OPC USED AT 23 °C, USING A W/C
RATIO OF 0.5
Figure 4 shows the heat flow, as measured, of the OPC used, as well as the phase development of the phases alite and portlandite. It can be clearly seen that the alite dissolution, as well as the portlandite precipitation, begins at the end of the induction period (beginning of the acceleration period), this being, in our case, 2.5 hours after the beginning of hydration. At the beginning of the acceleration period, we can detect the beginning of the dissolution of alite, as well as the precipitation of portlandite, both taking place synchronously.

Dissertation Daniel Jansen, University Erlangen-Nürnberg, 2011
- 52 -
FIG. 4: ALITE CONTENT, PORTLANDITE CONTENT AND MEASURED HEAT FLOW DURING THE
HYDRATION OF THE OPC USED AT 23 °C, USING A W/C RATIO OF 0.5
It can be shown that the reaction assumed for the silicate reaction (equation 4) runs synchronously, which means that the dissolution of the phase alite occurs at the same time as the precipitation of the phase portlandite. Since the C-S-H phase cannot be detected by XRD-methods, it has to be assumed that the precipitation of the C-S-H phase occurs at the same time as the precipitation of the phase portlandite.
Equ.4 C3S + 3.9 H20 → C1.7SH2.6 + 1.3 Ca(OH)2
In the experiments performed there was no sign for the reaction of the phase belite. These findings correspond to findings from the literature [52].
According to equation 4, the consumption of 1 mole of C3S can result in the precipitation of 1.3 mole of portlandite. If we take the molar masses into account, this means that we need 237.1 grams of C3S to precipitate 100 grams of portlandite (ignoring the possibility of incorporation of other ions). The ratio between C3S consumed and portlandite precipitated should, ideally, be 2.37. Our calculated ratio of around 2.53 (equation 5) after 22 hours hydration agrees almost exactly with the theoretical value. Where we take into account

Dissertation Daniel Jansen, University Erlangen-Nürnberg, 2011
- 53 -
the single standard deviation of 1 wt.-% from Rietveld analysis, we arrive at an absolutely exact agreement with the theoretical value of 2.37.
Equ. 5 ��������
������ ������
� �� ��.�%
�.� ��.�%� 2.53
where
∆alite 22h= dissolved amount of alite after 22 hours hydration [wt.-%]
∆portlandite 22h = precipitated amount of portlandite after 22 hours hydration [wt.-%]
Figure 5 shows the heat flow curve of the cement examined and the cement phases involved in the aluminate reaction, which react to the hydrate phase ettringite during hydration. Since we find 3 wt.-% of anhydrite in the dry cement, we can assume the presence of 2 wt.-% of anhydrite in the cement paste (w/c = 0.5) if no anhydrite reacts within the first minutes of hydration. We find almost 2 wt.-% of anhydrite in the first measurement of the cement paste. Additionally we observe a reaction of the phase anhydrite within the first 2.5 hours of hydration. At point 1, the first dissolution of anhydrite is completed and we can detect the dissolution of the phase gypsum. We cannot prove a dissolution of gypsum immediately after mixing the cement with water. Since 0.8 wt.-% of gypsum is detected in the dry cement, 0.5 wt.-% of gypsum can be assumed to be present in the cement paste, supposing a w/c ratio of 0.5, if no gypsum reacts within the first minutes. Since we find about 0.5 wt.-% in the cement paste over the first 4 hours, we can assume that gypsum does not react at any rapid rate in the cement system examined.

Dissertation Daniel Jansen, University Erlangen-Nürnberg, 2011
- 54 -
FIG. 5: C3A CONTENT, ANHYDRITE CONTENT, GYPSUM CONTENT AND MEASURED HEAT
FLOW DURING THE HYDRATION OF THE OPC USED AT 23 °C, USING A W/C RATIO OF 0.5
There are two other sulfate containing phases in the dry cement, namely bassanite and arcanite. Neither phase could be detected in the first XRD patterns of the cement paste. Therefore, we can assume that both phases react immediately with the mixing water and provide a high sulfate concentration in the pore solution for the first ettringite precipitation.
At point 2, the dissolution of the phase gypsum is completed and a second dissolution of the phase anhydrite can be detected. At point 3 the dissolution of the phase anhydrite is retarded and a further reaction of the C3A can be detected.

Dissertation Daniel Jansen, University Erlangen-Nürnberg, 2011
- 55 -
Furthermore, we can detect a disparity between the amount of C3A expected from the analysis of the dry cement and the amount of C3A actually detected in the first recorded pattern of the cement paste, namely, about 2 wt.-% +/- 0.5 wt.-% (figure 5). Due to the molar masses of C3A and ettringite we can assume that 2 wt.-% of C3A can lead to the formation of about 9 wt.-% of ettringite, when we take into account the following reaction for the precipitation of ettringite.
Equ. 6 C3A + 3 CaSO4 + 32 H2O → C3A*3CaSO4*32 H2O (Ettringite)
The said 9 wt.-% +/- 0.5 wt.-% is approximately equal to the amount of ettringite we can detect at 12.5 hours after the beginning of hydration, which is also the point within the hydration process at which the further dissolution of C3A begins to occur synchronously with an accelerated precipitation of ettringite (figure 6). There was no sign for the reaction of the C4AF in the first 22 hours of hydration. We assume that the alumina of the dissolved alite is incorporated in the C-S-H phase [53].
We can confirm the assumption of Hesse et al. [13] that there may exist an amorphous aluminate phase which can serve as a reservoir for further ettringite formation. Indeed, 27 Al NMR experiments might be interesting to perform in order to describe the assumed Al-reservoir.
FIG. 6: ETTRINGITE CONTENT, C3A CONTENT AND MEASURED HEAT FLOW DURING THE
HYDRATION OF THE OPC USED AT 23 °C, USING A W/C RATIO OF 0.5

Dissertation Daniel Jansen, University Erlangen-Nürnberg, 2011
- 56 -
We also detect that the cement phases involved in the aluminate reaction react successively (figure 5). Firstly, the phases arcanite and bassanite are not detectable in the first scan of the paste. The lack of the phases reflects the fast dissolution of both phases. Additionally, we detect an initial dissolution of the phase anhydrite immediately after mixing the cement with water. Up until a point in time of 2.5 hours after the beginning of hydration an ongoing dissolution of the phase anhydrite is detected. The dissolution of the anhydrite is interrupted during the dissolution of the phase gypsum. Dissolution of the phase anhydrite only begins once again when the dissolution of the phase gypsum has been completed. At about 12 hours after the beginning of the hydration process we observe a retarded dissolution of the phase anhydrite, the last available sulfate carrier, and consequently the further reaction of C3A. No synchronous dissolution of two phases like anhydrite and gypsum, or of any sulfate carrier and C3A, can be detected within the first 22 hours of hydration. Bassanite is the most soluble sulfate carrier with a solubility of about 8 g/L at ambient conditions whereby the solubilities of gypsum and anhydrite are more similar to one another (between 2.3 g/L and 2.8 g/L). We assume that the cement used contains anhydrite of different solubilities dependent on grain size, degree of crystallinity and surface defects. The most soluble anhydrite reacts before the gypsum up until point 1, a less soluble anhydrite reacts after the complete dissolution of the phase gypsum after point 2, and the least soluble anhydrite reacts after point 3.
Both the reaction of the aluminate and the accelerated precipitation of ettringite cause the significant 2nd local heat flow maximum at about 15 hours after the start of hydration – a phenomenon which had also been ascribed to the aluminate reaction by Hesse et al. [13] - thereby confirming the findings of Lerch [23] which described this maximum as a function of sulfate depletion. At the end of our examinations at 22 hours after the beginning of hydration an amount of ettringite of about 13.5 ma.-% had been formed in the cement paste. The sulfate content of our cement is 3.4 wt.-% which corresponds to 2.3 wt.-% in the cement paste. Since some 0.5 wt.-% of anhydrite failed to react during the first 22 hours, around 0.2 wt.-% of the SO3-content of the cement were not available for the ettringite precipitation. According to equation 6, around 11 wt.-% of pure sulfate ettringite can be formed with said amount of sulfate. A disparity between the amount of ettringite calculated from the sulfate content of the cement (11 wt.-%) and the amount detected (13.5 wt.-%) can be observed. The phenomenon of formation of solid solutions during the hydration of ettringite has been described by several authors [24, 25, 26]. But considering the findings of Renaudin et al. [27], which showed that there is a significant variation in the lattice parameters of pure sulfate-ettringite depending on humidity, it is not possible to make statements concerning the chemical composition of the ettringite based on the refinement of the lattice parameters in wet cement pastes. Therefore, a slight enrichment of ettringite at the contact point of the cement paste and Kapton foil in addition to the uncertainties of the measurements are the most obvious explanation for the slight overestimation of the phase ettringite.

Dissertation Daniel Jansen, University Erlangen-Nürnberg, 2011
- 57 -
Discussion
Different hypotheses exist concerning the hydration kinetics of Portland cements and the phases present in OPCs. These were reviewed by Bullard et al. [28] and also by Juilland et al. [29], who worked out that the dissolution theory can explain the early hydration behavior of alite without having to invoke the formation of a metastable barrier. It has recently been described, however, how the formation of shells around cement grains tends to limit reaction behavior [30]. It was shown by Gallucci et al. that there is no sign of a reaction of the phase alite during cement hydration over the first hours of cement hydration. The formation of shells around the grains occurs during and at the end of the induction period. In accordance with these findings, we must conclude that we cannot prove any reaction of alite during the initial reaction and the induction period. It had been shown by Juilland et al. [29] that there is no sign of a reaction of the phase alite in saturated lime solutions. It is conceivable that the rapid reaction of the C3A, as well as the reaction of the sulfate carriers arcanite and bassanite, cause a pore solution composition which prevents the initial dissolution of the phase alite.
Studies have shown that the C-S-H nucleation and growth restrict the early age hydration during the acceleration period. According to Bullard et al. [31] the growth of the C-S-H phase, respectively the nucleation and the number of active growth sites, is rate controlling. Thomas et al. [32] have shown that the seeding of cement pastes with reactive C-S-H phases at the time of mixing causes an acceleration of the hydration and results in the induction period’s being almost entirely eliminated. These findings agree with our findings in the acceleration period. During the acceleration period we detected an increasing reaction rate of alite over time. If we assume that we have increasing numbers of active growth sites during the acceleration period, we can explain a more rapid precipitation of the hydrates and, consequently, a more rapid reaction of alite over time.
The point of inflection in the dissolution curve of alite corresponds to the heat flow maximum, occurring at about 9 hours, in the heat flow curve of the cement used (figure 4). It can be assumed that after 9 hours the rate controlling mechanism changes and the deceleration period is reached. During that period we observe a decreasing reaction rate of alite dissolution. This might be caused by either lack of space or lack of water. Furthermore, it has been debated whether the controlling factor during the cement hydration may be the diffusion of the ions through the pore solution. Another interesting hypothesis to explain the decreasing reaction rate during the deceleration period has been suggested by Thomas et al. [33] who worked out that the intergrowth of the hydration products leads to a decreasing number of active growth sites, which in turn leads to that decreasing reaction rate of the phases in the cement paste which we detected with our XRD in-situ experiments.
Synchronous to the silicate reaction there also occurs the aluminate reaction, with the formation of ettringite. On the basis of the data produced, we can confirm that there is a very rapid reaction of the C3A at the beginning of the hydration process. In addition, a rapid dissolution of the sulfate-containing phases bassanite, arcanite and anhydrite is detected, with bassanite and arcanite reacting faster than anhydrite. The retardation of any further reaction of C3A seems to be caused by the presence of the sulfate carriers. As long as sulfate carriers are present we cannot prove a further dissolution of C3A. Scrivener and Pratt [34] have pointed out that the morphology of ettringite as hexagonal rods is unlikely to provide any barrier to the C3A capable of inhibiting ion transport. Therefore, it seems unlikely that the hydration product of C3A, ettringite, forms a barrier on the surfaces of the C3A.

Dissertation Daniel Jansen, University Erlangen-Nürnberg, 2011
- 58 -
The C3A surfaces have a positive charge in solution [35]. The adsorption of ions from solution on surfaces is a function of charge density. The sulfate ions are comparatively small, with two charges. Therefore, an adsorption of the sulfate ions on the surfaces of the C3A is conceivable. This possibility has in fact also been discussed, namely by Minard et al. [36]. It is not clear whether the adsorption of the sulfate ions on the surfaces of the C3A causes the cessation of the C3A dissolution or whether it is rather the composition of the pore solution (high concentration of sulfate ions) which inhibits the further reaction of the C3A. Moreover, it is also possible that the assumed amorphous layer, which can be seen as an Al-reservoir for ettringite precipitation, might inhibit further dissolution of C3A.
Synchronous to the local heat flow maximum, at about 15 hours into the hydration process of the OPC which we used, there is detected a rapid precipitation of ettringite as well as further hydration of C3A. The aluminate hydration product is still ettringite, not calcium monosulfoaluminate. Previous to this, there is observed a less rapid dissolution of the phase anhydrite, which is the last sulfate carrier present. We ascribe the less rapid reaction of the anhydrite to the less reactive nature of the anhydrite grains, which might either be bigger than the more reactive ones or might have a higher degree of crystallinity. The beginning of the anhydrite dissolution can be tracked in the heat flow diagrams during the acceleration period. At about 7.5 hours after the start of hydration process, a distinct “neck” in the heat flow curve of the cement can be observed. This can be ascribed to the onset of the anhydrite dissolution (figure 5). After about 12 hours, the slower reaction of the anhydrite causes a slump of the sulfate ions in the pore solution. A desorption of the sulfate ions from the surfaces of the C3A into the pore solution results in a more rapid availability of sulfate, as well as a further reaction of the C3A. Both reactions, which occur synchronously, permit a faster precipitation of ettringite than before. As soon as the available sulfatehas been consumed for ettringite precipitation the final precipitation of the ettringite is concluded.
Conclusion
The implementation of the method using a factor G presented in this paper offers a lot of advantages. Firstly, the concentration of each phase can be detected directly from the scale factor. Secondly, any errors made in Rietveld quantification will not, where this method is used, necessarily have an impact on the other phases present in the OPC paste. Lastly, the difference between the total of crystalline phases and 100 wt.-% can be attributed directly to the amorphous components in the OPC paste, i.e. not to crystalline bounded water and C-S-H phase. This means that the amorphous content of the cement paste during hydration can be measured indirectly. On the basis of the data produced, a hydration model for the early hydration of OPC can be assumed (Figure 7).

Dissertation Daniel Jansen, University Erlangen-Nürnberg, 2011
- 59 -
FIG. 7: CHANGES DETECTED IN THE PHASE COMPOSITION OF THE OPC PASTE, ASSIGNED
TO THE DIFFERENT PERIODS OF OPC HYDRATION
Future perspectives
The method presented is very promising for the quantitative study of cement hydration. There are many other fields within construction chemistry in which the method presented here looks likely to prove very useful. In ternary systems containing Portland cements and calcium aluminate cements (CAC), more than one amorphous phase is formed in addition to the added water. In this case, an external standard method is the most promising method available. The very rapid reaction of crystalline phases immediately after the mixing of the binder with the water can be examined by comparing the quantification of the dry binder with the first XRD patterns of the hydrating pastes.
Dissertation Daniel Jansen, University Erlangen-Nürnberg, 2011
- 60 -
References
[1] J.I. Escalante-Garcia, J.H. Sharp, Variation in the composition of C-S-H gel in Portland cement pastes cured at various temperatures, J. Am. Ceram. Soc. 82 (1999) 1131-1147
[2] I.G. Richardson, The calcium silicate hydrates, Cement and Concrete Reseach, 38 (2008) 137-158
[3] H.F.W. Taylor, Cement Chemistry, 2nd ed. Thomas Telford Publishing, 1997.
[4] H. Pöllmann, M. Fylak, R. Wenda, Investigations on hydration reactions and hydration behavior of cements and cement phases, Tagungsbericht 17. Internationale Baustofftagung, Weimar, Band 1 (2009) 1-0161 – 1-0176
[5] A. Quennoz, E. Gallucci, C.F. Dunant, K.L. Scrivener, Influence of the gypsum amount on the hydration of tricalcium aluminate in C3A-gypsum and alite-C3A-gypsum systems, Tagungsbericht 17. Internationale Baustofftagung, Weimar, Band 1 (2009) 1-0207 – 1-0212
[6] L. Pelletier, F. Winnefeld, B. Lothenbach, Hydration mechanism of the ternary system Portland cement – calcium sulphoaluminate – anhydrite, Tagungsbericht 17. Internationale Baustofftagung, Weimar, Band 1 (2009) 1-0277 – 1-0282
[7] C. Hesse, F. Goetz-Neunhoeffer, J. Neubauer, M. Braeu, P. Gaeberlein, Quantitative in situ X-ray diffraction analysis of early hydration of Portland cement at defined temperatures, Powder Diffraction, 24 (2009) 112-115
[8] D. Jansen, F. Goetz-Neunhoeffer, J. Neubauer, W.-D. Hergeth, R. Haerzschel, Influence of polyvinyl alcohol on phase development during the hydration of Portland cement, ZKG International,7 (2010) 100-107
[9] K.L. Scrivener, T. Füllmann, E. Gallucci, G. Walenta, E. Bermejo, Quantitative study of Portland cement hydration by X-ray diffraction/Rietveld analysis and independent methods, Cem.Concr. Res. 34 (2004) 1541-1547
[10] L.D. Mitchell, J.C. Margeson, P.S. Whitfield, Quantitative Rietveld analysis of hydrated cementitious systems, Powder Diffraction 21 (2006) 111-113
[11] T. Westphal, T. Füllmann, H. Pöllmann, Rietveld quantification of amorphous portions with an internal standard – Mathematical consequences of the experimental approach, Powder Diffraction, 24 (2009) 239-243
[12] H. Hermann, M. Ermrich, Microabsorption Correction of X-ray Intensities Diffracted by Multiphase Powder Specimens, Powder Diffraction, 4 (1989) 189-195
[13] C. Hesse, F. Goetz-Neunhoeffer, J. Neubauer, A new approach in quantitative in-situ XRD of cement pastes: Correlation of heat flow curves with early hydration reactions, Cement and Concrete Research, 41 (2010) 123-128
[14] M. Merlini, G. Artioli, T . Cerulli, A. Bravo, F. Cella, Tricalcium aluminate hydration in additivated systems. A crystallographic study by SR-XRPD, Cement and Concrete Research, 38 (2008) 477-486

Dissertation Daniel Jansen, University Erlangen-Nürnberg, 2011
- 61 -
[15] B.H. O´Connor, M.D. Raven, Application of the Rietveld Refinement Procedure in Assaying Powdered Mixtures, Powder Diffraction, 3 (1988) 2-6
[16] H.M. Rietveld, A profile refinement method for nuclear and magnetic structures, J. Appl. Crystallogr., 2 (1969) 65-71
[17] J. Neubauer, S. Dittrich, F. Goetz-Neunhoeffer, D. Jansen, Quantitative Analysis of OPC, Fly Ash and Mixtures, monograph of the congress on building chemistry, Dortmund (2010) 85-92
[18] W.A. Gutteridge, On the Dissolution of the Interstitial Phases in Portland Cement, Cement and Concrete Research, 9 (1979) 319-324
[19] L.J. Struble, The Effect of Water on Maleic Acid and Salicylic Acid Extractions, Cement and Concrete Research, 15 (1985) 631-636
[20] International Union for Crystallography; Edited by Prince, E., International Tables for Crystallography, Volume C: Mathematical Physical and Chemical Tables, Wiley, third edition (2004)
[21] D. Jansen, Ch. Stabler, F. Goetz-Neunhoeffer, S. Dittrich, J. Neubauer, Does Ordinary Portland Cement contain amorphous phase? A quantitative study using an external standard method, Powder Diffraction, 26 (2011) 31-38
[22] C. Hesse, M. Degenkolb, P. Gäberlein, F. Goetz-Neunhoeffer, J. Neubauer, V. Schwarz, Investigation into the influence of temperature and w/c-ratio on the early hydration of white cement, Cement International, 6 (2008) 68-78
[23] W. Lerch, The influence of gypsum on the hydration and properties of Portland cementpastes, American Society for Testing Materials, 46 (1946) 1252-1297
[24] H. Poellmann, H.-J. Kuzel, Solid solution of ettringite part I, Cement and Concrete Research, 20 (1990) 941-947
[25] S.J. Barnett, C.D. Adam, A.R.W. Jackson, An XRPD profile fitting investigation of the solid solution between ettringite Ca6Al2(SO4)3(OH)12*26H2O and carbonate ettringite Ca6Al2(CO3)3(OH)12*26H2O, Cement and Concrete Research, 31 (2001) 13-17
[26] G. Möschner, B. Lothenbach, F. Winnefeld, A. Ulrich, R. Figi, R. Kretzschmar, Solid solution between Al-ettringite and Fe-ettringite (Ca6[Al1-xFex(OH)6]2(SO4)3*26H2O), Cement and Concrete Research, 39 (2009) 482-489
[27] G. Renaudin, Y. Filinchuk, J. Neubauer, F. Goetz-Neunhoeffer, A comparative study of wet and dried ettringite, Cement and Concrete Research, 40 (2010) 370-375
[28] J.W. Bullard, et al. Mechanisms of cement hydration, Cement and Concrete Research, (2011) in press
[29] P. Juilland, E. Gallucci, R. Flatt, K. Scivener, Dissolution theory applied to the induction period in alite hydration, Cement and Concrete Research, 40 (2010) 831-844
[30] E. Gallucci, P. Mathur, K. Scrivener, Microstructural development of early age hydration shells around cement grains, Cement and Concrete Research, 40 (2010) 4-13

Dissertation Daniel Jansen, University Erlangen-Nürnberg, 2011
- 62 -
[31] J.W. Bullard, A determination of hydration mechanisms for tricalcium silicate using a kinetic cellular automaton model, J. Am. Ceram.Soc., 91 (2008) 2088-2097
[32] J.J. Thomas, H.M. Jennings, J.J. Chen, Influence of nucleation seeding on the hydration mechanisms of tricalcium silicate and cement, J. Phys. Chem. C 113 (11) (2009) 4327-4334
[33] J.J. Thomas, J.J. Biernacki, J.W. Bullard, S. Bishnoi, J.S. Dolado, G.W. Scherer, A. Luttge, Modeling and simulation of cement hydration kinetics and microstructure development, Cement and Concrete Reseach(2011), doi: 10.1016/j.cemconres.2010.10.004
[34] K.L. Scrivener, P.L. Pratt, Microstructural studies of the hydration of C3A and C4AF independently and in cement paste, in: F.P. Glasser (Ed.), Brit. Ceram. Proc. 35, Stoke-on-Trent, British Ceramic Society, (1984) 207-219
[35] J. Plank, Ch. Hirsch, Impact of zeta potential of early cement hydration phases on superplasticizer adsorption, Cement and Concrete Research, 37 (2007) 537-542
[36] H. Minard, S. Garrault, L. Regnaud, A. Nonat, Mechanisms and parameters controlling the tricalcium aluminate reactivity in the presence of gypsum, Cement and Concrete Research,37 (2007) 1418-1426
[37] A.G. De La Torre, S. Bruque, J. Campo, M.A.G. Aranda, The superstructure of C3S from synchrotron and neutron powder diffraction and its role in quantitative phase analysis, Cement and Concrete Research,32 (2002) 1347-1356
[38] K.H. Jost, B. Ziemer, R. Seydel, Redetermination of the structure of β-dicalcium silicate, Acta Crystallogr., Sect. B: Struct. Crystallogr. Cryst. Chem. 33, (1977) 1696-1700
[39] R. Mueller, Stabilisierung verschiedener Dicalciumsilikat-Modifikationen durch den Einbau von Phosphat: Synthese, Rietveld-analyse, Kalorimetrie, Diplom-thesis (2001) University of Erlangen.
[40] P. Mondal, J. Jeffery, The crystal structure of tricalcium aluminate, Ca3Al2O6, Acta Crystallogr., Sect. B: Struct. Crystallogr. Cryst. Chem., 31 (1975) 689-697
[41] Y. Takéuchi, F. Nishi, Crystal-chemical characterization of the Al2O3-Na2O solid-solution series, Z. Kristallogr., 152 (1980) 259-307
[42] A.C. Jupe, J.K. Cockcroft, P. Barnes, S.L. Colston, G. Sankar, C. Hall, The site occupancy of Mg in the brownmillerite structure and its effect on hydration properties: An X-ray/neutron diffraction and EXAFS study, J. Appl. Crystallogr., 34 (2001) 55-61
[43] B.F. Pedersen, Neutron diffraction refinement of the structure of gypsum, Acta Crystallogr., Sect. B, Struct. Crystallogr. Cryst. Chem., 38 (1982) 1074-1077
[44] H. Weiss, M.F. Bräu, How much water does calcined gypsum contain?, Angew. Chem., Int. Ed., 48 (2009) 3520-3524
[45] A. Kirfel, G. Will, Charge density in anhydrite CaSO4, from X-ray and neutron diffraction measurements, Acta Crystallogr., Sect.B: Struct. Crystallogr. Cryst. Chem., 36 (1980) 2881-2890

Dissertation Daniel Jansen, University Erlangen-Nürnberg, 2011
- 63 -
[46] E.N. Maslen, V.A. Streltsov, N.R. Streltsova, Electron density and optical anisotropy in rhombohedral carbonates. III. Synchroton X-ray studies of CaCO3, MgCO3 and MnCO3, Acta Crystallogr., Sect. B: Struct. Sci., 51 (1995) 929-939
[47] Y. Le Page, G. Donnay, Refinement of the crystal structure of low-quartz, Acta Crystallogr., Sect.B: Struct. Crystallogr. Cryst. Chem., 32 (1976) 2456-2459
[48] K. Ojima, Y. Hishihata, A. Sawada, Structure of potassium sulfate at temperatures from 296 K down to 15 K, Acta Crystallogr., Sect. B: Struct. Sci. 51 (1995) 287-293
[49] F. Goetz-Neunhoeffer, J. Neubauer, Refined ettringite structure for quantitative X-ray diffraction analysis, Powder Diffraction, 21 (2006) 4-11
[50] W.R. Busing, H.A. Levy, Neutron diffraction study of calcium hydroxide, Acta Crystallogr., Sect. B: Struct. Sci. 42 (1986) 51-55
[51] M. Schreyer, L. Guo, M. Tjahjono, M. Garland, Three approaches to total quantitative phase analysis of organic mixtures using an external standard, J. Appl. Crystallogr., 44 (2011) 17-24
[52] I. Jelenic, A. Bezjak, M. Bujan, Hydration of B2O3-stabilized α´- and β-modifications of dicalcium silicate, Cement and Concrete Research, 8 (1978) 173-180
[53] I.G. Richardson, G.W. Groves, The incorporation of minor and trace elements into calcium silicate hydrate (C-S-H) gel in hardened cement pastes, Cement and Concrete Research, 23 (1993) 131-138

Dissertation Daniel Jansen, University Erlangen-Nürnberg, 2011
- 64 -
4.3. THE HYDRATION OF ALITE (PUBLISHED IN JAC)
The hydration of alite: A time-resolved quantitative XRD approach using the G-factor method compared with heat release
Daniel Jansen, Sebastian T. Bergold, Friedlinde Goetz-Neunhoeffer and Jürgen Neubauer
Published in: Journal of Applied Crystallography,(2011), 44, 895-901
Keywords: In-situ XRD analysis, alite hydration, G-factor method, heat flow calorimetry
Synopsis
The hydration of alite examined from a crystallographic point of view. Rietveld analysis of water/alite-pastes combined with external-standard quantification, compared with measured and calculated heat of hydration.
Abstract
The classical external-standard method derived from O´Connor and Raven (1988) was used in order to examine the hydration of the major-phase alite of Ordinary Portland Cements (OPC) at different temperatures and different water/alite-ratios. In order to estimate the accuracy of the method, heat-flow curves were calculated from the alite dissolution curves obtained from XRD in-situ experiments. The heat-flow curves calculated in this way were compared with heat-flow curves recorded using a calorimeter. It was shown that the calculated curves agreed to a great extent with the curves obtained from heat-flow experiments.

Dissertation Daniel Jansen, University Erlangen-Nürnberg, 2011
- 65 -
Introduction
Even though Ordinary Portland Cements (OPCs) have been used and studied for decades, the hydration kinetic of their major-phase alite, doped tricalcium silicate (C3S), is still not completely understood. Several theories have persisted side by side with one another. These theories’ major concern has been to explain the reaction kinetics of the alite hydration which is commonly received from heat-flow calorimetric measurements (Figure 1). An initial heat flow can be detected directly after mixing (I). This is followed by a period of slow reaction which is known as the induction period (II). This induction period is followed by the main hydration reaction (III) which is separated into the acceleration (IIIa) and the deceleration period (IIIb).
FIGURE 1 HEAT-FLOW CURVE OF ALITE; WATER/ALITE-RATIO = 0.5; T = 23 °C
The main hydration reaction is normally completed after the elapse of 24 h, whereas the hydration continues at low heat-flow levels for months. The hydration results in the formation of an amorphous C-S-H gel (Calcium-Silicate-Hydrate) and crystalline portlandite. The Ca/Si-ratio of C-S-H depends on the temperature (Escalante-Garcia & Sharp, 1999), on the water to cement ratio (Locher, 1967) and, in the case of an OPC, on the composition of the OPC used (Richardson, 1999). After 28 d, the Ca/Si-ratio of a C-S-H gel formed in a hydrated OPC at 20 °C with a water to cement ratio of 0.4 stands at 1.7, according to Allen et al. (2007). We thus arrive at Equ.1 for the hydration of C3S after this point in time.
Equ. 1 C3S + 3.9 H → C1.7SH2.6 + 1.3 CH ∆H = -561 J/g

Dissertation Daniel Jansen, University Erlangen-Nürnberg, 2011
- 66 -
The enthalpy of reaction ∆H is the difference between the sum of the formation enthalpies of the products (∆HFproducts) and the sum of the formation enthalpies of the reactants (∆HFreactants).
The enthalpy for Equ.1 was calculated using data acquired by means of the thermodynamic software GEMS (Kulik, 2010) using the GEMS version of the Nagra/PSI thermodynamic database (Hummel et al., 2002; Thoenen et al., 2003), the cemdata07 database (Lothenbach et al., 2008) and the enthalpy of formation for C1.7SH2.6 derived from Fuji and Kondo (1983).
The most widely used theory for the hydration of alite predicts the formation of a metastable protective C-S-H layer on the C3S grain surface directly after the wetting. This protective layer suppresses the further hydration of the C3S and ends the initial period (Stein & Stevels, 1964; Gartner & Gaidis, 1989). At the end of the induction period, this protective layer is destabilized, giving rise either to a more permeable layer or to the dissolution of the layer, which allows the hydration reaction to start again. Livingston et al. (2010) assume, from the results of their nuclear resonance reaction analysis (NRRA) of C3S hydration, that an existing protective layer breaks because of the osmotic pressure obtained between the silicate-rich grain surface and the calcium-rich solution.
Another theory does not require this assumption of the emergence of a protective layer in order to explain the progress of the alite hydration. For example Garrault & Nonat (2001) and Peterson & Whitten (2009) assume that a single process is responsible for both the nucleation and the growth of C-S-H, which begins, according to Rodgers et al. (1988), directly after mixing. Thomas (2007) concludes, from mathematical calculation of a boundary nucleation and growth model, that the hydration remains on low levels during the period of slow reaction. This, he suggests, is because there is only a small amount of C-S-H nucleons present, so that this period does not form a separate chemical process in itself. Assuming a constant rate for the C-S-H nucleation process (Thomas, 2007), the acceleration period would begin once a sufficient amount of C-S-H nucleons have been precipitated. Juilland et al. (2010) recommend that there are different solution mechanisms working at different degrees of undersaturated solutions, as described by Lasaga & Luttge (2001) for several minerals.
At a certain point, the hydration of alite becomes diffusion-controlled, because the unreacted alite grains come to be covered by a continuous product layer. Some authors (e.g. Garrault & Nonat, 2001) claim that the diffusion regime begins already with the beginning of the deceleration period, while others consider it to begin only with the deceleration period’s end, when the hydration has reached very low levels, or at even later points in time (Thomas et al., 2009).
XRD in-situ analysis is a suitable method for examining the phase development of hydrating alite/water-mixtures during the process of hydration. This is the case even though the C-S-H phase which is formed during this process is not detectable by X-ray diffraction in the first 24 hours because of its low degree of crystallinity. Besides this, the water added to the alite cannot be quantified directly with X-rays.
Softwares for Rietveld refinement (Rietveld, 1969) usually give the total of the crystalline phases determined, normalized to 100 wt.-% (ZMV-algorithm, Hill & Howard, 1987). In cases where amorphous phases are present (in the case of alite/water-mixtures, there is likely to be at least C-S-H phase and water) the amounts of crystalline phases calculated from Rietveld analysis will differ from the actual amounts. Moreover, any
Dissertation Daniel Jansen, University Erlangen-Nürnberg, 2011
- 67 -
computing error of any phase of the mixture will have an influence on the calculated amount of all phases in the mixture.
There exists the possibility of plotting peak areas or peak intensities in order to show phase developments in pastes in quantitative terms (Pöllmann et al., 2009; Pelletier et al., 2009) and without normalization to 100 wt.-%. Unfortunately it is not possible to calculate actual quantities, given in wt.-% of the alite/water-mixture, by this method.
An internal-standard method can be applied in order to establish the phase-composition of the crystalline phases as well as the amount of the amorphous content of alite/water-mixture (Scrivener et al., 2004). If an internal standard is added to the cement, there exists the possibility of the standard material’s exerting an influence on the hydration of the cement.
Westphal et al. (2009) have examined the mathematical consequences of the internal-standard method and have concluded that there is such a thing as an optimal amount of internal standard which can be added to the sample. Assuming an amorphous content of 35 wt.-% on average in the first 22 hours of hydration (depending on C-S-H phase and w/c ratio), the most advisable option, they propose, is to work with an amount of internal standard of at least 40 wt.-%. Where this is not done, the user will have to accept a considerable analysis error. Such a high amount of internal standard might possibly have an influence on the hydration inasmuch as it might bring about alterations in nucleation and growth kinetics or the water/alite ratio.
In order to avoid complications that might be caused by mixing an internal standard with the phase alite, we decided to make use of an external-standard method which was first described by O`Connor and Raven (1988) but has not subsequently been used for the quantification of hydration reactions.
The scope set for this paper is to provide an answer to the question of whether or not XRD in-situ analysis is a suitable method for characterizing the hydration process of the phase alite. It is also the intention of the authors to focus attention on the comparison between heat-flow curves as calculated from XRD data and heat-flow curves as measured from heat-flow experiments. The main focus is on the main hydration period of the cement, which sets in after several hours and is concluded within 24 hours at room and higher temperatures.
However, a question which can be answered using XRD experiments is how the reaction from alite to portlandite and C-S-H-phase emerges. Assuming that there exist at least two processes here which release heat, namely the dissolution of the phase alite and the precipitation of portlandite and the C-S-H phase, it necessarily follows that dissolution and precipitation have to run synchronously in order to make it possible to calculate the heat flow using only the dissolution curve of the phase alite obtained from Rietveld analysis.

Dissertation Daniel Jansen, University Erlangen-Nürnberg, 2011
- 68 -
Materials and Methods
Alite was synthesized using CaCO3, Al2O3, SiO2 from Alfa Aesar and MgO from Merck. Al2O3 and MgO were added to stabilize a monoclinic (M3) alite structure (De La Torre, 2002). The chemicals were homogenized in a vibration disk mill and placed in platinum crucibles. The thermal treatment was carried out three times at a temperature of 1400 °C for 4 hours in a chamber furnace. The synthesized alite was checked for phase purity using XRD. The specific surface of the synthesized alite was measured to be 0.29 m2/g, using the BLAINE method.
For the in-situ XRD analysis a custom-made sample holder with a heater/cooler-unit was used (Hesse et al., 2008). Cement and water were mixed by external stirring for one minute. The paste was then prepared into the sample holder and covered by a 7.5 µm thick Kapton polyimide film. The diffraction patterns were recorded using a D8 diffractometer (Bruker) equipped with a LynxEye PS-Detector. We made use of CuKα radiation at 40 kV and 40 mA and recorded from 7° 2θ to 40° 2θ with a step width of 0.0236 and 0.58 s counting time per step. Under these conditions, it is possible to record 88 ranges within the first 22 hours of hydration. For the Rietveld refinements, the program Topas 4.2 from Bruker AXS (fundamental parameters approach) was used. There was no evidence for any difference in the results when working with a longer range from 7° 2θ to 70° 2θ.
The quantitative phase composition of the alite paste was determined using the G-factor method which was first described by O´Connor & Raven (1988) and which has already been used successfully for the examination of cements and cement pastes (Jansen et al., 2011a&b). In addition, the method was recommended by Schreyer et al. (2011) for the examination of organic mixtures. For this purpose, a well known standard (in our case silicon; Jansen et al. 2011a) is used in order to calculate the factor G (equation 2).
Equ. 2
where ssi = Rietveld scale factor of silicon from Rietveld analysis
ρsi = density of silicon
Vsi = Unit-cell volume of silicon
csi = Weight fraction of silicon (100 wt.-%)
µ* = Mass attenuation coefficient of silicon
The factor G was then used to determine the mass concentration of each crystalline phase j in the hydrating alite paste (equation 3). This made it imperative that the sample be measured under the same conditions as the standard. Since the alite paste was covered during the measurement process with a Kapton film, which can cause absorption of X-rays and thereby intensity loss, it was necessary that the standard material be likewise covered with a Kapton film during its measurement process.
si
sisisi
sic
VsG
*2µρ=

Dissertation Daniel Jansen, University Erlangen-Nürnberg, 2011
- 69 -
Equ. 3
The structure models and the respective ICSD codes are shown in table 1. The chemical composition of the alite samples is shown in table 2. The mass attenuation coefficients of the dry alite powder and the pastes are shown in table 3. Mass attenuation coefficients for the various elements were drawn from the International Tables for Crystallography (2004). The mass attenuation coefficient of the alite powder was calculated from chemical composition. More details about the standard used are shown in table 4. The factor G was evaluated from 6 powder samples with individual preparations. The mean value of all measurements was used for the quantification of the water/alite pastes. The standard deviation of the mean value for the scale factor of the silicon powder was 0.8 wt.-%.
Table 1 Structure models used for Rietveld refinements
Phase ICSD code Author
Alite
Silicon
Portlandite
94742
51688
34241
De La Torre et al. 2002
Többens et al., 2001
Busing & Levy, 1986
Table 2 Chemical composition of the samples
CaO
Al2O3
SiO2
MgO
71.8 wt.-%
0.6 wt.-%
25.9 wt.-%
1.8 wt.-%
G
Vsc
SAMPLEjj
jj
*2µρ=

Dissertation Daniel Jansen, University Erlangen-Nürnberg, 2011
- 70 -
Table 3 Mass attenuation coefficients of the samples
MACdry alite
MACH2O
MAC(alite/water-paste; w/a-ratio = 0.5)
MAC(alite/water-paste; w/a-ratio = 1)
99 cm2/g
10.2 cm2/g
69.4 cm2/g
54.6 cm2/g
Table 4 Computed G factor and structural details regarding the silicon standard employed
Scale factor from Rietveld 0.007695
Cell Volume
Density
Mass attenuation coefficient
G Factor
1.6 x 10⁻²² cm3
2.33 g/cm3
63.7 cm2/g
2.92 x 10-44 cm5/wt.-%
The G-factor method from O´Connor and Raven (1988) displays enormous advantages where it is applied to the quantification of alite hydration. Where this method is adopted, the crystalline phases can be quantified directly from the scale factors. No error in the determination of any individual phase has any influence on the determined amount of the other phases. In addition, the amorphous phases, namely water and C-S-H phase, cannot be quantified using the standard Rietveld ZMV-algorithm, which only considers the crystalline phases.
Heat flow experiments were carried out using a commercial TAM Air calorimeter. Alite and water were equilibrated before the measurements in a calibrated heat chamber. Mixing of the alite with the water was carried out externally by means of a special mixer which allows reproducible stirring for one minute. The samples were then put in the calorimeter. The first half-hour of the heat-flow experiments cannot be evaluated because of the disturbance of the signal by opening the calorimeter.
Heat-flow curves were calculated from the in-situ XRD results (alite dissolution curves) using equation 4 (modified from Hesse et al., 2011).

Dissertation Daniel Jansen, University Erlangen-Nürnberg, 2011
- 71 -
Equ. 4 �� �� ��. % !"#�$
��
%��
∆&'
(.)* +,1.
where
/ 01.�% 23415
/1 = derivation of the alite curve from XRD in-situ experiments
∆HR = enthalpy of reaction of equation 1
Results
The Rietveld refinement of the synthesized alite is shown in figure 2. There was no sign for any phase except the phase alite. The calculation of the amount of alite using the factor G, which was derived from the standardmaterial silicon, resulted in 96 wt.-% +/- 2 wt.-% of alite in our sample and 4 wt.-% +/- 2 wt.-% of amorphous or non-fitted phase. We assume that the structures used, as well as inaccurate dislocation parameters, might possibly be the reasons for the underquantification of the phase alite (Jansen et al., 2011a). An amorphous, glassy phase is not verified.
FIGURE 2 RIETVELD REFINEMENT OF A POWDER PATTERN OF THE SYNTHESIZED ALITE
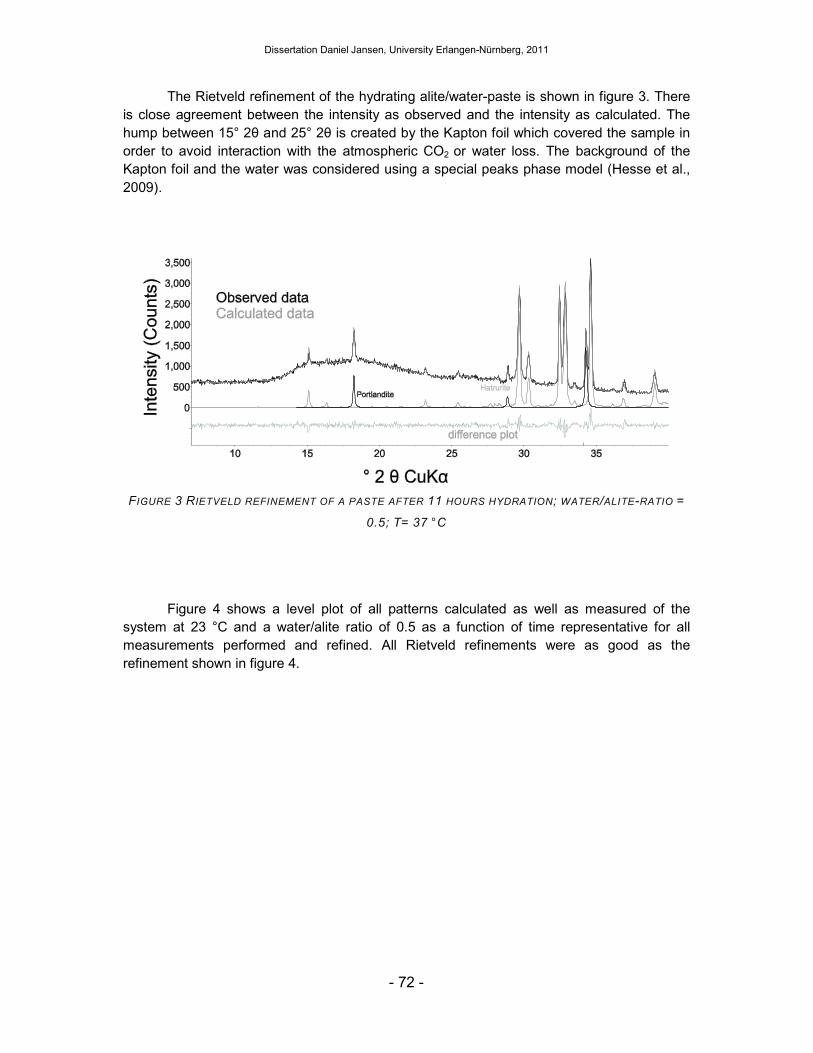
Dissertation Daniel Jansen, University Erlangen-Nürnberg, 2011
- 72 -
The Rietveld refinement of the hydrating alite/water-paste is shown in figure 3. There is close agreement between the intensity as observed and the intensity as calculated. The hump between 15° 2θ and 25° 2θ is created by the Kapton foil which covered the sample in order to avoid interaction with the atmospheric CO2 or water loss. The background of the Kapton foil and the water was considered using a special peaks phase model (Hesse et al., 2009).
FIGURE 3 RIETVELD REFINEMENT OF A PASTE AFTER 11 HOURS HYDRATION; WATER/ALITE-RATIO =
0.5; T= 37 °C
Figure 4 shows a level plot of all patterns calculated as well as measured of the system at 23 °C and a water/alite ratio of 0.5 as a function of time representative for all measurements performed and refined. All Rietveld refinements were as good as the refinement shown in figure 4.

Dissertation Daniel Jansen, University Erlangen
FIGURE 4 LEVEL PLOT OF ALL PATTERNS MEASURED AS WE
°C AND WATER/ALITE RATIO OF 0.5
The results from the XRD inthat the reaction of the phase alite strongly depends on both temperature and w/cSince about 96 wt.-% of crystalline alite could be detected in the dran absolute alite content of around 64 wt.water/alite-ratio of 0.5. A water /alitein the paste, assuming that no alite reacts immFigure 5 shows that no dissolution of the phase alite could be proven directly after mixing by means of the G-factor method. This leads us to the conclusion that either no alite reacts immediately with water or only very low amounts of alite are dissolved immediately, said amounts being lower than the standard deviations of the results of our experiments (+/%).
Dissertation Daniel Jansen, University Erlangen-Nürnberg, 2011
- 73 -
TERNS MEASURED AS WELL AS CALCULATED OF THE SYSTEM AT
0.5 (PORTLANDITE PEAKS ARE MARKED, REMAINING PEAKS ARE
ALITE PEAKS)
The results from the XRD in-situ experiments are shown in figure 5. It can be seen that the reaction of the phase alite strongly depends on both temperature and w/c
crystalline alite could be detected in the dry sample, we can expect an absolute alite content of around 64 wt.-% in the cement paste, when working with a
ratio of 0.5. A water /alite-ratio of 1 would result in an amount of 48 wt.in the paste, assuming that no alite reacts immediately after mixing the alite with water. Figure 5 shows that no dissolution of the phase alite could be proven directly after mixing by
factor method. This leads us to the conclusion that either no alite reacts nly very low amounts of alite are dissolved immediately, said
amounts being lower than the standard deviations of the results of our experiments (+/
THE SYSTEM AT 23
REMAINING PEAKS ARE
situ experiments are shown in figure 5. It can be seen that the reaction of the phase alite strongly depends on both temperature and w/c-ratio.
y sample, we can expect % in the cement paste, when working with a
ratio of 1 would result in an amount of 48 wt.-% of alite ediately after mixing the alite with water.
Figure 5 shows that no dissolution of the phase alite could be proven directly after mixing by factor method. This leads us to the conclusion that either no alite reacts
nly very low amounts of alite are dissolved immediately, said amounts being lower than the standard deviations of the results of our experiments (+/- 2 wt.-
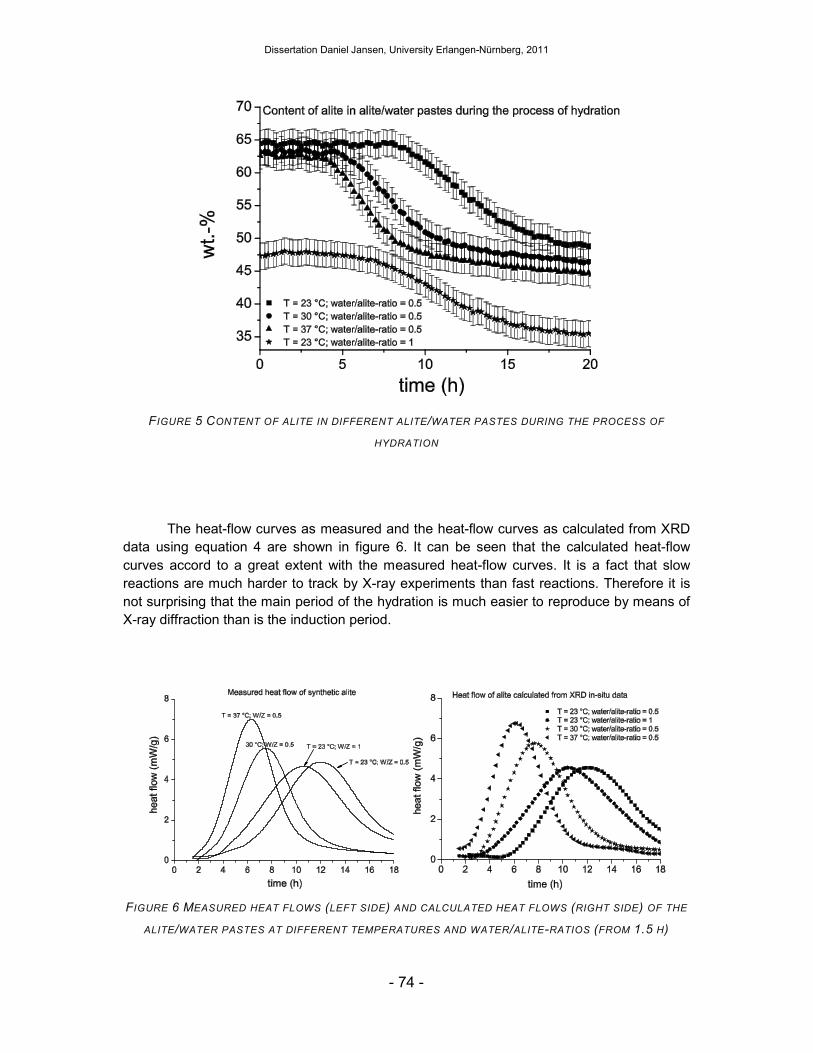
Dissertation Daniel Jansen, University Erlangen-Nürnberg, 2011
- 74 -
FIGURE 5 CONTENT OF ALITE IN DIFFERENT ALITE/WATER PASTES DURING THE PROCESS OF
HYDRATION
The heat-flow curves as measured and the heat-flow curves as calculated from XRD data using equation 4 are shown in figure 6. It can be seen that the calculated heat-flow curves accord to a great extent with the measured heat-flow curves. It is a fact that slow reactions are much harder to track by X-ray experiments than fast reactions. Therefore it is not surprising that the main period of the hydration is much easier to reproduce by means of X-ray diffraction than is the induction period.
FIGURE 6 MEASURED HEAT FLOWS (LEFT SIDE) AND CALCULATED HEAT FLOWS (RIGHT SIDE) OF THE
ALITE/WATER PASTES AT DIFFERENT TEMPERATURES AND WATER/ALITE-RATIOS (FROM 1.5 H)
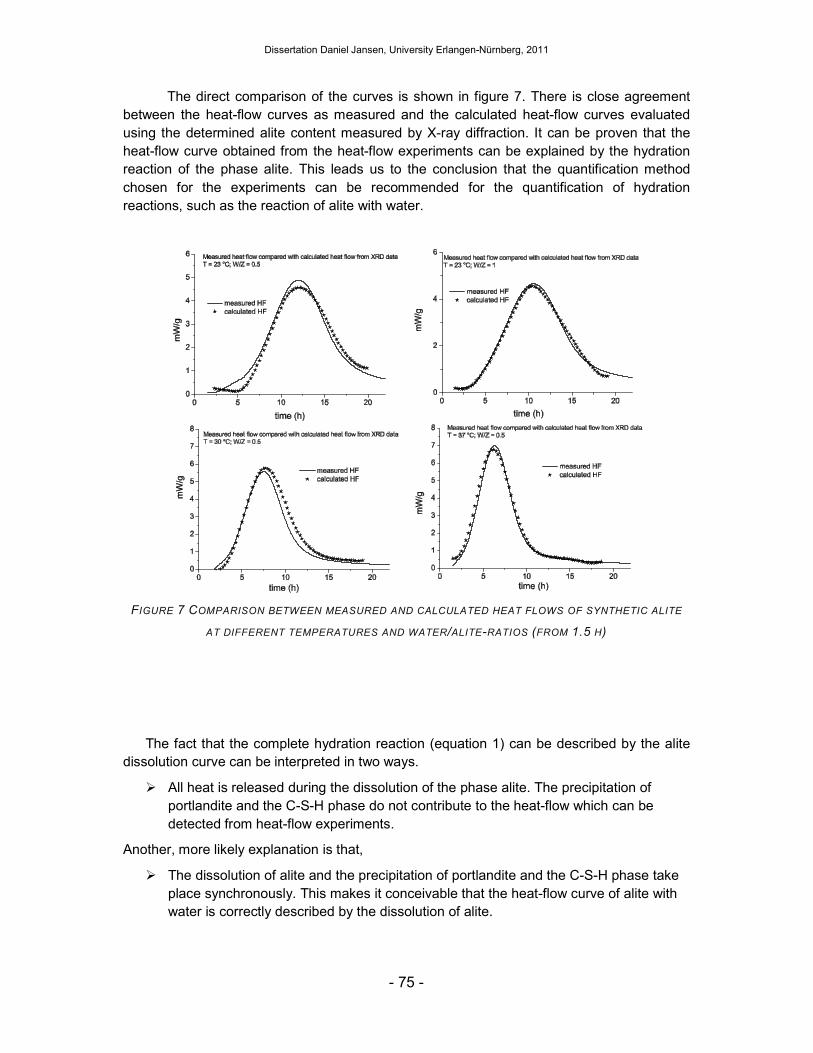
Dissertation Daniel Jansen, University Erlangen-Nürnberg, 2011
- 75 -
The direct comparison of the curves is shown in figure 7. There is close agreement between the heat-flow curves as measured and the calculated heat-flow curves evaluated using the determined alite content measured by X-ray diffraction. It can be proven that the heat-flow curve obtained from the heat-flow experiments can be explained by the hydration reaction of the phase alite. This leads us to the conclusion that the quantification method chosen for the experiments can be recommended for the quantification of hydration reactions, such as the reaction of alite with water.
FIGURE 7 COMPARISON BETWEEN MEASURED AND CALCULATED HEAT FLOWS OF SYNTHETIC ALITE
AT DIFFERENT TEMPERATURES AND WATER/ALITE-RATIOS (FROM 1.5 H)
The fact that the complete hydration reaction (equation 1) can be described by the alite dissolution curve can be interpreted in two ways.
� All heat is released during the dissolution of the phase alite. The precipitation of portlandite and the C-S-H phase do not contribute to the heat-flow which can be detected from heat-flow experiments.
Another, more likely explanation is that,
� The dissolution of alite and the precipitation of portlandite and the C-S-H phase take place synchronously. This makes it conceivable that the heat-flow curve of alite with water is correctly described by the dissolution of alite.

Dissertation Daniel Jansen, University Erlangen-Nürnberg, 2011
- 76 -
The plot of the alite curve and the portlandite curve in the same diagram also show that the dissolution of the phase alite and the precipitation of the phase portlandite emerge synchronously. Figure 8 shows both curves at a water/alite-ratio of 0.5 and at a temperature of 37 °C, representative for all experiments performed. Under these conditions, the dissolution of alite and the precipitation of portlandite begin at a point in time some 3.5 hours after mixing the reactants.
FIGURE 8 QUANTITATIVE PHASE DEVELOPMENT OF ALITE AND PORTLANDITE DURING THE HYDRATION
OF ALITE AND WATER (WATER/ALITE = 0,5; T = 37 °C)

Dissertation Daniel Jansen, University Erlangen-Nürnberg, 2011
- 77 -
Conclusion
The method presented by O´Connor and Raven (1988) was a crucial step in developing a method for quantifying materials with amorphous portions. The implementation of this method for the characterization of hydration processes turned out to be very promising. The calculation of a calibration factor G turned out to be of excellent practical usefulness in the day-to-day work of a laboratory where hydration processes of materials containing crystalline phases are under examination.
It could be shown that the dissolution of alite which was quantified by means of X-ray diffraction using the G-factor method is suitable to characterize the kinetics of the reaction of alite and water. The heat-flow curves obtained from heat-flow experiments could be simulated by using the quantitative XRD data for the calculation of heat-flow diagrams.
It is, however, in every case imperative that the user of the G-factor method always takes care to ensure that the right factor G is used. This is because said factor depends on the performance of the X-ray tube and the detector and therefore strongly depends on time. As shown in figure 9, it is not advisable to calculate the factor G a long time before or after the point in time at which the experiment is actually performed.
FIGURE 9 DEVELOPMENT OF THE SCALE FACTOR OF A QUARTZ STANDARD MATERIAL OVER TIME
Acknowledgements The authors would like to thank Natalia Illenseer, Sebastian Klaus and Sebastian Scherb for their support during the performing of the experiments.
Dissertation Daniel Jansen, University Erlangen-Nürnberg, 2011
- 78 -
References
Allen, A. J., Thomas, J. J., & Jennings, H. M. (2007). Composition and density of nanoscale calcium-silicate-hydrate in cement. Nature Materials, 6 , 311-316.
Busing, W. R., & Levy, H. A. (1986). Neutron diffraction study of calcium hydroxide. Acta
Crystallographica B, 42 , 51-55.
Crystallography, I. U. (2004). International Tables for Crystallography, Volume C:
Mathematical, Physical and Chemical Tables. Boston: Kluwer.
De La Torre, A. G., Bruque, S., Campo, S., & Aranda, M. (2002). The superstructure of C3S from synchroton and neutron powder diffraction and its role in quantitative phase analysis. Cement and Concrete Research, 32 , 1347-1356.
Escalante-Garcia, J. I., & Sharp, J. H. (1999). Variation in the Composition of C-S-H Gel in Portland Cement Pastes Cured at Various Temperatures. Journal of the American Ceramic
Society, 82 , 3237-41.
Fuji, K., & Kondo, W. (1983). Communications of the American Ceramic Society: Estimation of Thermochemical Data for Calcium Silicate Hydrate (C-S-H). Journal of the American
Ceramic Society, 66 , C-220-C-221.
Garrault, S., & Nonat, A. (2001). Hydrated Layer Formation on Tricalcium and Dicalcium Silicate Surfaces: Experimental Study and Numerical Simulations. Langmuir, 17 , 8131-8138.
Gartner, E. M., & Gaidis, J. M. (1989). Hydration mechanisms. In J. P. Skalny, Materials
Science of Concrete I (pp. 95-125). Westerville, OH: The American Ceramic Society.
Hesse, C., Degenkolb, M., Gäberlein, M., Goetz-Neunhoeffer, F., Neubauer, J., & Schwarz, V. (2008). Investigation into the influence of temperature and w/c-ratio on the early hydration of white cement. Cement International, 6 , 68-78.
Hesse, C., Goetz-Neunhoeffer, F., & Neubauer, J. (2011). A new approach in quantitative in-situ XRD of cement pastes. Cement and Concrete Research,41 , 123-128.
Hesse, C., Goetz-Neunhoeffer, F., Neubauer, J., Braeu, M., & Gaeberlein, P. (2009). Quantitative in situ X-ray diffraction analysis of early hydration of Portland cement at defined temperatures. Powder Diffraction, 24 , 112-115.
Hill, R. J., & Howard, C. J. (1987). Quantitative phase analysis from neutron powder diffraction data using the Rietveld method. Journal of Applied Crystallography , 467-474.
Hummel, W., Berner, U., Curti, E., Pearson, F. J., & Thoenen, T. (2002). Nagra/PSI Chemical
Thermodynamic Data Base 01/01. . USA: Universal Publishers/uPUBLISH.com.
Jansen, D., Goetz-Neunhoeffer, F., Stabler, C., & Neubauer, J. (2011b). A Remastered External Standard Method Applied to the Quantification of Early OPC Hydration. Cement and
Concrete Research, 41, 602-608.
Jansen, D., Stabler, C., Goetz-Neunhoeffer, F., Dittrich, S., & Neubauer, J. (2011a). Does Ordinary Portland Cement contain amorphous phase? A quantitative study using an external standard method. Powder Diffraction, 26, 31-38.

Dissertation Daniel Jansen, University Erlangen-Nürnberg, 2011
- 79 -
Juilland, P., Gallucci, E., Flatt, R., & Scrivener, K. (2010). Dissolution theory applied to the induction period in alite hydration. Cement and Concrete Research, 40 , 831-844.
Kulik, D. (2010). GEMS-PSI 3.0 2010, available at http://gems.web.psi.ch. PSI-Villingen, Switzerland.
Lasaga, A. C., & Luttge, A. (2001). Variation of Crystal Dissolution Rate Based on a Dissolution Stepwave Model. Science, 291 , 2400-2405.
Livingston, R. A., Schweitzer, J. S., Rolfs, C., Becker, H. -W., Kubsky, S., Spillane, T., et al. (2010). Heavy ion beam measurements of the hydration of cementious materials. Applied
Radiation and Isotopes, 68 , 683-687.
Locher, F. W. (1967). Stoichiometry of the hydration of tricalcium silicate. Zement-Kalk-Gips,
20 , 402-7.
Lothenbach, B., Matschei, T., Möschner, G., & Glasser, F. P. (2008). Thermodynamic modelling of the effect of temperature on the hydration and porosity of Portland cement. Cement and Concrete Research, 38 , 1-18.
O`Connor, B. H., & Raven, M. D. (1988). Application of the Rietveld Refinement Procedure in Assaying Powdered Mixtures. Powder Diffraction (Vol. 3) , 2-6.
Pelletier, L., Winnefeld, F., & Lothenbach, B. (2009). Hydration mechanism of the ternary system Portland cement-calcium sulphoaluminate-anhydrite. Tagungsbericht 17.
Internationale Baustofftagung, Weimar , 1-0277-1-0282.
Peterson, V. K., & Whitten, A. E. (2009). Hydration Processes in Tricalcium Silicate: Application of the Boundary Nucleation Model to Quasielastic Neutron Scattering Data. Journal of Physical Chemistry C, 113 , 2347-2351.
Pöllmann, H., Fylak, M., & Wenda, R. (2009). Investigations on hydration reactions and hydration behavior of cements and cement phases. Tagungsbericht 17. Internationale
Baustofftagung, Weimar , 1-0161-1-0176.
Richardson, I. G. (1999). The nature of C-S-H in hardened cements. Cement and Concrete
Research, 29 , 1134-1147.
Rietveld, H. M. (1969). A profile refinement method for nuclear and magnetic structures. J.
Appl. Crystallogr., 2 , 65-71.
Rodgers, S. A., Groves, G. W., Clayden, N. J., & Dobson, C. M. (1988). Hydration of tricalcium silicate followed by 29Si NMR cith cross-polarization. Journal of the American
Ceramic Society, 71 , 91-96.
Schreyer, M., Guo, L., Tjahjono, M., & Garland, M. (2011). Three approaches to total quantitative phase analysis of organic mixtures using an external standard. Journal of
Applied Crystallography , 17-24.
Scrivener, K. L., Füllmann, T., Gallucci, E., Walenta, G., & Bermejo, E. (2004). Quantitative study of Portland cement hydration by X-ray diffraction/Tietveld analysis and independent methods. Cement and Concrete Research, 34 , 1541-1547.

Dissertation Daniel Jansen, University Erlangen-Nürnberg, 2011
- 80 -
Stein, H. N., & Stevels, J. M. (1964). Influence of silica on the hydration of 3CaO*SiO₂. Journal of applied chemistry, 14 , 338-346.
Thoenen, T., & Kulik, D. (2003). Nagra/PSI chemical thermodynamic database 01/01 for the
GEM-Selektor (V.2-PSI) geochemical modeling code. Villingen.
Thomas, J. J. (2007). A new approach to modeling the nucleation and growth kinetics of tricalcium silicate hydration. Journal of the American Ceramic Society, 90 , 3282–3288.
Thomas, J. J., Allen, A. J., & Jennings, H. M. (2009). Hydration Kinetics and Microstructure Developement of Normal and CaCl₂-Accelerated Tricalcium Silicate Pastes. Journal of
Physical Chemistry C, 113 , 19836-19844.
Többens, D. M., Stuesser, N., Knorr, K., Mayer, H. M., & Lampert, G. (2001). The new high-resolution neutron powder diffractometer at the Berlin neutron scattering center . Mater. Sc.
Forum , 378-381.
Westphal, T., Füllmann, T., & Pöllmann, H. (2009). Rietveld quantification of amorphous portions with an internal standard-Mathematical consequences of the experimental approach. Powder Diffraction, 21 , 239-243.

Dissertation Daniel Jansen, University Erlangen-Nürnberg, 2011
- 81 -
4.4. THE EARLY HYDRATION OF ORDINARY PORTLAND CEMENT (PUBLISHED IN CCR)
The early hydration of Ordinary Portland Cement (OPC): An approach comparing measured heat flow with calculated heat flow from QXRD
D. Jansen a, F. Goetz-Neunhoeffer a, B. Lothenbach b and J. Neubauer a
a University Erlangen-Nuernberg, Mineralogy,
b Empa, Laboratory for Concrete and Construction Chemistry
Published in: Cement and Concrete Research, 42 (2012) 134-138
Abstract
Heat flow was calculated from XRD data and compared with measured heat flow from calorimetric experiments. It was shown that the heat released during the hydration of a commercial Ordinary Portland Cement can be assigned mainly to three mechanisms, the silicate reaction (sum of dissolution of alite and precipitation of C-S-H-phase and portlandite), the dissolution of C3A, and the precipitation of ettringite. The contributions made by anhydrite dissolution and gypsum dissolution to the heat released during hydration turned out to be quite small. It is possible to explain, on the basis of the data produced, the origin of the heat flow curve of the cement used.
Introduction
Although Ordinary Portland Cements (OPC) have been the object of study for decades, the hydration process of OPCs still remains a subject of scientific debate. The hydration in question is quite a complex process which includes dissolution and precipitation reactions. One important unresolved question is how to explain the influence of different factors on the hydration kinetics, as visible in typical heat flow diagrams [1].
The process of the hydration of OPCs is commonly subdivided into several periods. These periods are called: the initial period (I), the induction period (II) the acceleration period (III) and the retardation period (IV) (figure 1). It is possible to sum up the acceleration period and the retardation period together under the denomination “main period”.
Many OPCs display two significant heat flow maxima during the main period. The first is attained several hours after the beginning of the acceleration period, while the second one

Dissertation Daniel Jansen, University Erlangen-Nürnberg, 2011
- 82 -
appears during the deceleration period. The second heat flow maximum has already been described by Lerch [2] who calls it the “sulfate depletion peak”, due to the fact that its occurrence is a function of the sulfate content of the cement [3]. Hesse et al. [4] have confirmed the findings of Lerch and have been able to show that a renewed C3A dissolution and an accelerated ettringite precipitation are the reasons for that additional heat flow which can be detected at the second heat flow maximum during the retardation period.
FIGURE 1 HEAT FLOW DIAGRAM OF AN ORDINARY PORTLAND CEMENT
During early cement hydration, i.e. up to 20 hours, two reactions, namely the silicate reaction (equation 1) and the aluminate reaction (equation 2), dominate the measured heat flow [5].
Equ.1 C3S + 3.9 H → C1.7SH2.6 + 1.3 CH (silicate reaction)
Equ.2 C3A + 3 Cs + 32 H → C3A*3Cs*H32 ettringite (aluminate reaction)
Recently it has been shown that a whole set of different approaches are all suitable for understanding the occurrence of the typical heat flow diagrams of hydrating cements or alite-water mixtures. Bishnoi and Scrivener have presented a new platform called µic [6] for

Dissertation Daniel Jansen, University Erlangen-Nürnberg, 2011
- 83 -
the modeling of the hydration of cements, especially the microstructural evolution, and have implemented the platform successfully in order to clarify the development of heat during the hydration of alite [7]. They showed that, very often, nucleation and growth mechanisms can be used in order to reproduce reaction kinetics during the first 24 hours of alite hydration. Thomas (2007) [8] has also modeled the nucleation and growth kinetics of alite using a mathematical “boundary nucleation” model and has successfully reproduced heat flow curves measured using an isothermal calorimeter. Hesse et al. [4] have made use of XRD data of cement pastes in order to calculate heat flow diagrams and have clarified the occurrence of a heat flow curve of a synthetic Portland Cement consisting only of alite, cubic C3A and calcium sulfates. It is the intention of the present work to continue the research of Hesse et al. [4] and to apply it to the examination of the hydration of a commercial Portland Cement containing 12 phases. In comparison to Hesse et al. [4] dissolution and precipitation reactions of the aluminate reaction are treated separately in the present work.
Materials and Methods
Materials
Chosen for the experiments was a commercial Ordinary Portland Cement 52.5 R, which is used very often in the dry mix mortar industry. In order to ensure a proper detection of all phases in the OPC, minor phase enrichment experiments were performed [9, 10]. Representative samples for the experiments were obtained by means of the cone and quarter method. The chemical composition of the cement was measured using X-ray fluorescence and is shown in table 1. The mineralogical composition of the cement is also shown in table 1. The composition was determined via Rietveld refinement [11] using the fundamental parameters approach [12], the software Topas V4.2, and the G-factor method [13, 14]. The structures used for the Rietveld refinement and the respective ICSD codes are shown in table 2. A detailed discussion concerning the amorphous content of a commercial OPC, as well as more literature about said topic, was reported elsewhere [14].
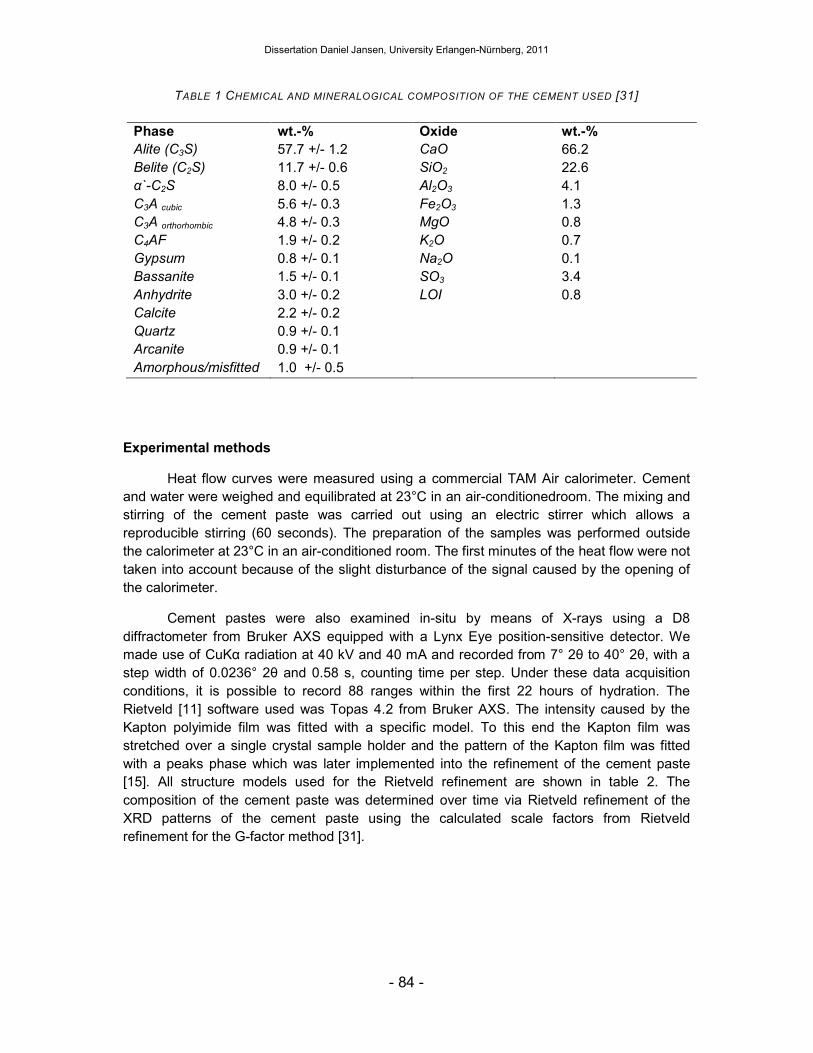
Dissertation Daniel Jansen, University Erlangen-Nürnberg, 2011
- 84 -
TABLE 1 CHEMICAL AND MINERALOGICAL COMPOSITION OF THE CEMENT USED [31]
Phase wt.-% Oxide wt.-%
Alite (C3S) 57.7 +/- 1.2 CaO 66.2 Belite (C2S) 11.7 +/- 0.6 SiO2 22.6 α`-C2S 8.0 +/- 0.5 Al2O3 4.1 C3A cubic 5.6 +/- 0.3 Fe2O3 1.3 C3A orthorhombic 4.8 +/- 0.3 MgO 0.8 C4AF 1.9 +/- 0.2 K2O 0.7 Gypsum 0.8 +/- 0.1 Na2O 0.1 Bassanite 1.5 +/- 0.1 SO3 3.4 Anhydrite 3.0 +/- 0.2 LOI 0.8 Calcite 2.2 +/- 0.2 Quartz 0.9 +/- 0.1 Arcanite 0.9 +/- 0.1 Amorphous/misfitted 1.0 +/- 0.5
Experimental methods
Heat flow curves were measured using a commercial TAM Air calorimeter. Cement and water were weighed and equilibrated at 23°C in an air-conditionedroom. The mixing and stirring of the cement paste was carried out using an electric stirrer which allows a reproducible stirring (60 seconds). The preparation of the samples was performed outside the calorimeter at 23°C in an air-conditioned room. The first minutes of the heat flow were not taken into account because of the slight disturbance of the signal caused by the opening of the calorimeter.
Cement pastes were also examined in-situ by means of X-rays using a D8 diffractometer from Bruker AXS equipped with a Lynx Eye position-sensitive detector. We made use of CuKα radiation at 40 kV and 40 mA and recorded from 7° 2θ to 40° 2θ, with a step width of 0.0236° 2θ and 0.58 s, counting time per step. Under these data acquisition conditions, it is possible to record 88 ranges within the first 22 hours of hydration. The Rietveld [11] software used was Topas 4.2 from Bruker AXS. The intensity caused by the Kapton polyimide film was fitted with a specific model. To this end the Kapton film was stretched over a single crystal sample holder and the pattern of the Kapton film was fitted with a peaks phase which was later implemented into the refinement of the cement paste [15]. All structure models used for the Rietveld refinement are shown in table 2. The composition of the cement paste was determined over time via Rietveld refinement of the XRD patterns of the cement paste using the calculated scale factors from Rietveld refinement for the G-factor method [31].

Dissertation Daniel Jansen, University Erlangen-Nürnberg, 2011
- 85 -
The G-factor method is based on the calculation of a calibration constant for the diffractometer using a standard material (in our case silicon [31]).
where SSi = Rietveld scale factor of silicon from Rietveld analysis
ρSi = Density of silicon
VSi = Unit-cell volume of silicon
CSi = Weight fraction of silicon (100 wt.-%)
µ*Si
=Mass attenuation coefficient of silicon
The factor G is then used in order to calculate the amount of each single crystalline phase in the cement paste, taking into account the density of each phase j (ρj), the unit-cell volume of each phase j (Vj), the calculated scale factor for each phase j (sj)and the mass attenuation coefficient of the whole sample µ*SAMPLE (68.7 cm2/g) which in our case was determined from XRF data (dry cement 97.9 cm2/g; water 10.3 cm2/g; w/c = 0.5).
A detailed discussion and evaluation of the method is given elsewhere [14, 31].
si
sisisisi
c
VsG
*2µρ=
G
Vsc
SAMPLEjj
jj
*2µρ=

Dissertation Daniel Jansen, University Erlangen-Nürnberg, 2011
- 86 -
TABLE 2 STRUCTURES USED FOR THE RIETVELD REFINEMENT [31]
Phase ICSD Code Reference
Alite (C3S) 94742 De La Torre et al. (2002) [16] Belite (C2S) 963 Jost et al. (1977) [17] α`-C2S - Mueller (2001) [18] C3A cubic 1841 Mondal and Jeffery (1975) [19] C3A orthorhombic 100220 Takéuchi and Nishi (1980) [20] C4AF 51265 Jupe et al. (2001) [21] Gypsum 27221 Pedersen et al. (1982) [22] Bassanite 380286 Weiss and Bräu (2009) [23] Anhydrite 16382 Kirfel and Will (1980) [24] Calcite 80869 Maslen (1995) [25] Quartz 174 Le Page and Donnay (1976) [26] Arcanite 79777 Ojima et al. (1995) [27] Ettringite 155395 Goetz-Neunhoeffer and Neubauer (2006) [28] Portlandite 34241 Busing and Levy (1986) [29] Silicon 51688 Többens et al. (2001) [30]
Calculation of the reaction enthalpies
It has been demonstrated by Hesse et al. [4] that the heat generated by the reaction of alite and aluminate with calcium sulfates can be calculated from the experimentally determined dissolution, and from the enthalpies, of the different solids. The calculated heat flow curves help us to understand the respective contributions of the different reactions to the typical heat flow curves of alite and aluminate. In the present paper more precise calculations were carried out in order to understand the contribution of the different dissolution and precipitation reactions to the heat flow measured during the hydration of an OPC.
As a first step, the most likely reactions in the cement paste during hydration had to be identified: The two main reactions during the hydration of cements are the silicate reaction and the aluminate reaction (equ. 1 and equ. 2). While the dissolution of alite (equation 1) seems to result directly in the simultaneous formation of equimolar amounts of C-S-H and portlandite (see chapter results and [32]), the dissolution reactions of C3A and calcium sulfates (equation 2) do not occur isochronously with the precipitation of ettringite (see chapter results and [31]). Therefore, the heat contribution of the silicate reaction can be calculated representatively using the determined amount of C3S reacted in the cement paste (thermodynamic calculations indicate that the contribution of the dissolved species in a 1:1 H2O:C3S mixture is less than 1% compared to the total heat of the reaction). Based on the experimental observations, however, the aluminate and calcium sulfate reaction has to be subdivided into several dissolution and precipitation reactions.
As the reactions take place in an OPC paste, where pH values in the range of 13 to 13.5 are present, the dissolution and precipitation reactions given below all refer to a pH
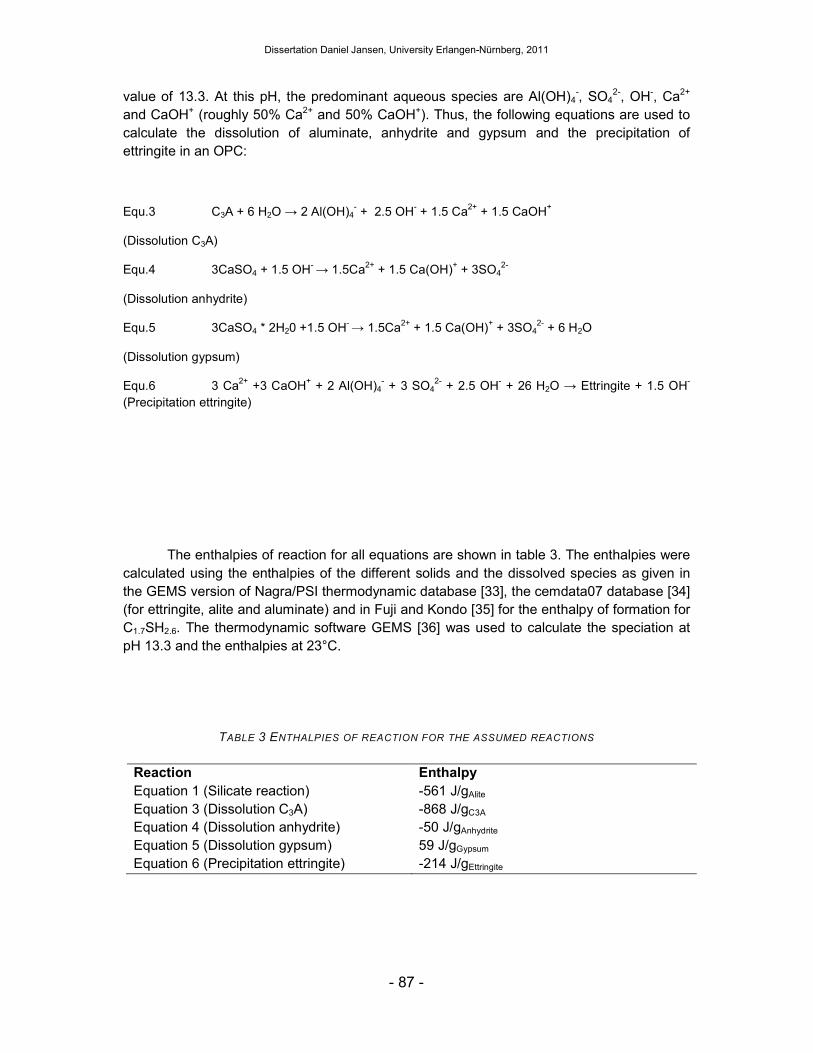
Dissertation Daniel Jansen, University Erlangen-Nürnberg, 2011
- 87 -
value of 13.3. At this pH, the predominant aqueous species are Al(OH)4-, SO4
2-, OH-, Ca2+ and CaOH+ (roughly 50% Ca2+ and 50% CaOH+). Thus, the following equations are used to calculate the dissolution of aluminate, anhydrite and gypsum and the precipitation of ettringite in an OPC:
Equ.3 C3A + 6 H2O → 2 Al(OH)4- + 2.5 OH- + 1.5 Ca2+ + 1.5 CaOH+
(Dissolution C3A)
Equ.4 3CaSO4 + 1.5 OH- → 1.5Ca2+ + 1.5 Ca(OH)+ + 3SO42-
(Dissolution anhydrite)
Equ.5 3CaSO4 * 2H20 +1.5 OH- → 1.5Ca2+ + 1.5 Ca(OH)+ + 3SO42- + 6 H2O
(Dissolution gypsum)
Equ.6 3 Ca2+ +3 CaOH+ + 2 Al(OH)4- + 3 SO4
2- + 2.5 OH- + 26 H2O → Ettringite + 1.5 OH- (Precipitation ettringite)
The enthalpies of reaction for all equations are shown in table 3. The enthalpies were calculated using the enthalpies of the different solids and the dissolved species as given in the GEMS version of Nagra/PSI thermodynamic database [33], the cemdata07 database [34] (for ettringite, alite and aluminate) and in Fuji and Kondo [35] for the enthalpy of formation for C1.7SH2.6. The thermodynamic software GEMS [36] was used to calculate the speciation at pH 13.3 and the enthalpies at 23°C.
TABLE 3 ENTHALPIES OF REACTION FOR THE ASSUMED REACTIONS
Reaction Enthalpy
Equation 1 (Silicate reaction) -561 J/gAlite Equation 3 (Dissolution C3A) -868 J/gC3A Equation 4 (Dissolution anhydrite) -50 J/gAnhydrite Equation 5 (Dissolution gypsum) 59 J/gGypsum Equation 6 (Precipitation ettringite) -214 J/gEttringite

Dissertation Daniel Jansen, University Erlangen-Nürnberg, 2011
- 88 -
The calculation of heat flow curves from XRD data was carried out according to the following pattern (modified in accordance with Hesse et al., 2011 [4]) and the values given in table 3.
Equ. 7 HF �� ��. % 9:!;$
��
%��< ∆HR < +,1. where
/ 01.�% 23415
/1 = Derivative of the phase content curves
∆HR = Enthalpy of reaction
Results
Figure 2 shows the heat flow of the cement paste as obtained from the heat flow experiments, as well as the phase content of alite as determined by means of X-ray diffraction.
It can be seen that the dissolution of alite commences at the beginning of the acceleration period. The thin line in figure 2 shows the heat flow calculated from the alite dissolution curve determined by in situ X-ray diffraction. It was already shown that the dissolution of alite is suitable for characterizing the kinetics of the reaction of pure alite with water [32]. Hence, it can be assumed that the heat flow contribution of the silicate reaction corresponds to the thin line.
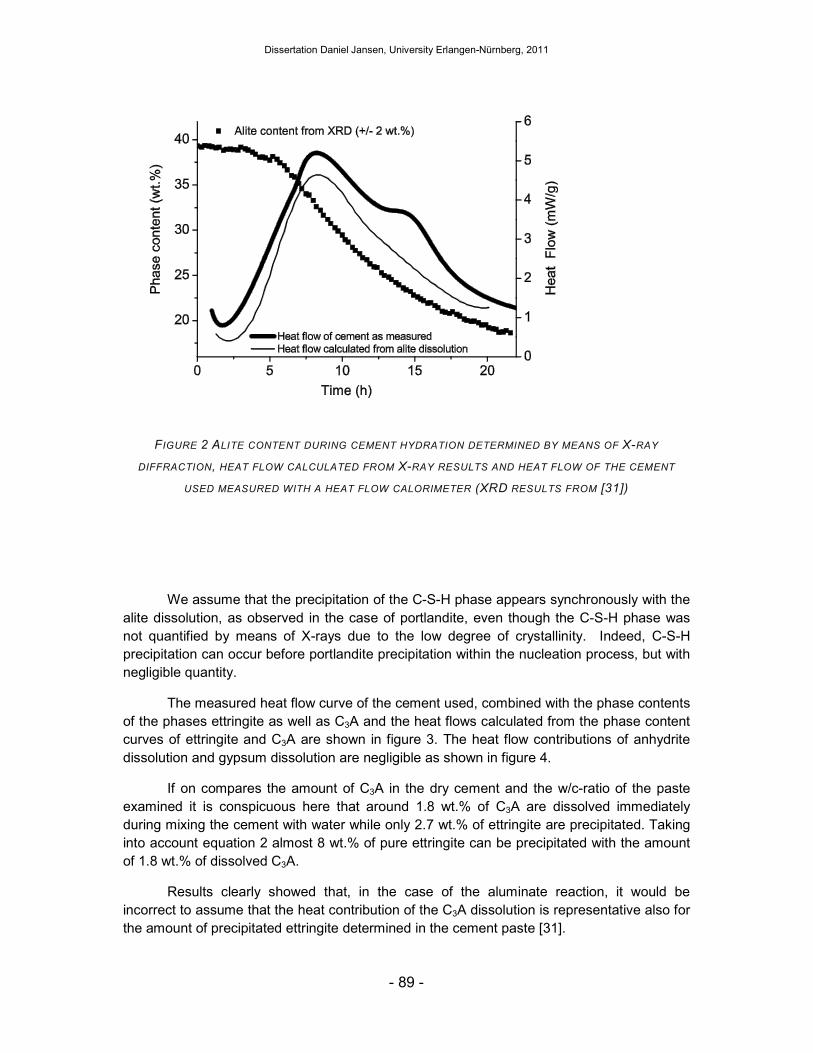
Dissertation Daniel Jansen, University Erlangen-Nürnberg, 2011
- 89 -
FIGURE 2 ALITE CONTENT DURING CEMENT HYDRATION DETERMINED BY MEANS OF X-RAY
DIFFRACTION, HEAT FLOW CALCULATED FROM X-RAY RESULTS AND HEAT FLOW OF THE CEMENT
USED MEASURED WITH A HEAT FLOW CALORIMETER (XRD RESULTS FROM [31])
We assume that the precipitation of the C-S-H phase appears synchronously with the alite dissolution, as observed in the case of portlandite, even though the C-S-H phase was not quantified by means of X-rays due to the low degree of crystallinity. Indeed, C-S-H precipitation can occur before portlandite precipitation within the nucleation process, but with negligible quantity.
The measured heat flow curve of the cement used, combined with the phase contents of the phases ettringite as well as C3A and the heat flows calculated from the phase content curves of ettringite and C3A are shown in figure 3. The heat flow contributions of anhydrite dissolution and gypsum dissolution are negligible as shown in figure 4.
If on compares the amount of C3A in the dry cement and the w/c-ratio of the paste examined it is conspicuous here that around 1.8 wt.% of C3A are dissolved immediately during mixing the cement with water while only 2.7 wt.% of ettringite are precipitated. Taking into account equation 2 almost 8 wt.% of pure ettringite can be precipitated with the amount of 1.8 wt.% of dissolved C3A.
Results clearly showed that, in the case of the aluminate reaction, it would be incorrect to assume that the heat contribution of the C3A dissolution is representative also for the amount of precipitated ettringite determined in the cement paste [31].

Dissertation Daniel Jansen, University Erlangen-Nürnberg, 2011
- 90 -
Besides that, precipitation of ettringite does not signify the dissolution of C3A and sulfate carrier at the same point of time as formulated in equation 2 [31]. C3A dissolution ceases after the initial dissolution and recommences after 12 h, whereas ettringite is formed continuously from the point of beginning measurement up to 22 h of hydration [31].
FIGURE 3 ETTRINGITE AND C3A CONTENTS DURING CEMENT HYDRATION DETERMINED BY MEANS OF
X-RAY DIFFRACTION, HEAT FLOW CALCULATED FROM X-RAY RESULTS AND HEAT FLOW OF THE
CEMENT USED MEASURED WITH A HEAT FLOW CALORIMETER (XRD RESULTS FROM [31])
It can be seen from figure 3 that the heat flow maximum at 15 hours is mainly characterized by the heat caused by the dissolution of C3A. The heat from ettringite precipitation contributes to the heat flow over the whole main period. All calculated heat flow curves shown were computed using the enthalpy data given in Table 3.

Dissertation Daniel Jansen, University Erlangen-Nürnberg, 2011
- 91 -
Figure 4 shows the heat flow curve of the cement as measured by means of isothermal heat flow calorimetry (TAM Air) along with the heat flow curves as calculated from the XRD data. It can be seen that the calculated heat flow matches the measured heat flow reasonably well. The heat released during the first maximum of heat flow (here called the “silicate reaction peak”) is mainly to be attributed to the heat released from the silicate reaction, which in our case includes the dissolution of the phase alite and the precipitation of portlandite and C-S-H phase.
The second heat flow maximum, occurring after about 15 hours (here called the “sulfate depletion peak”) is characterized by the fact of the heat’s being released due to the dissolution of C3A and the precipitation of ettringite, even though the silicate reaction still contributes significantly (about 2 mW/g) to the heat flow, which reaches, at the point of the second maximum, a level of 3.8 mW/g.
The contributions of the anhydrite dissolution and the gypsum dissolution to the heat flow are negligible in comparison with the contributions made by the other reactions.
FIGURE 4 COMPARISON BETWEEN CALCULATED HEAT FLOW AND MEASURED HEAT FLOW.
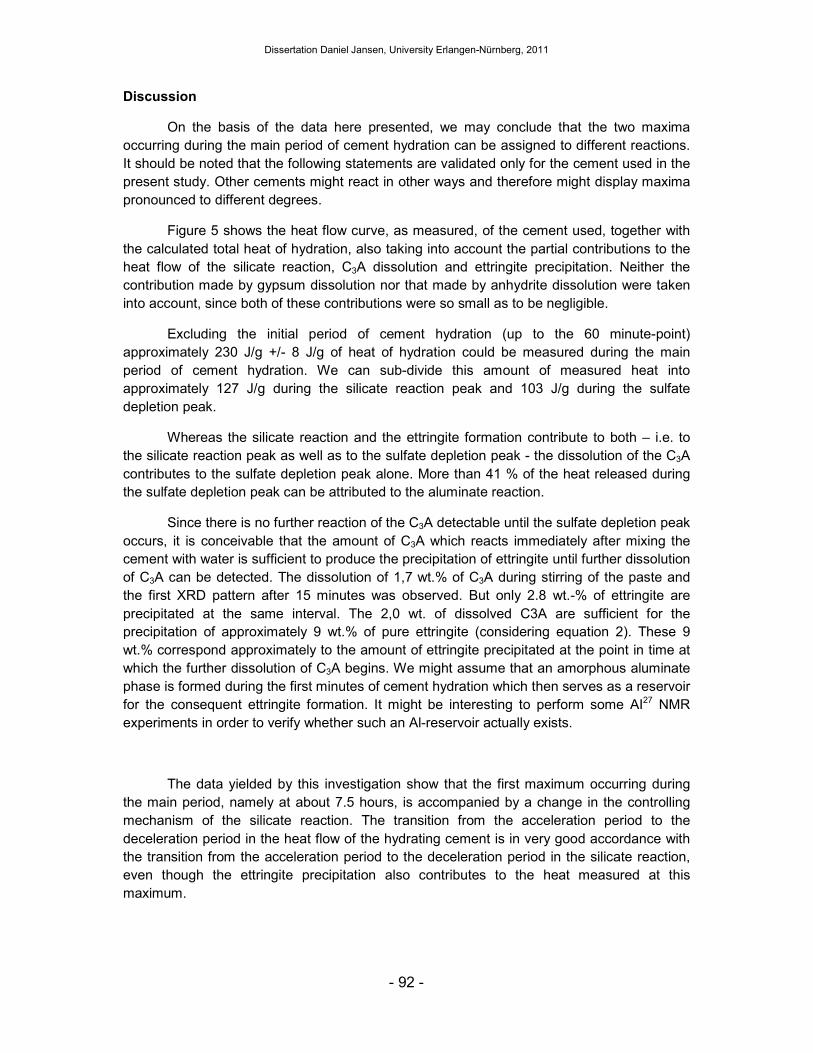
Dissertation Daniel Jansen, University Erlangen-Nürnberg, 2011
- 92 -
Discussion
On the basis of the data here presented, we may conclude that the two maxima occurring during the main period of cement hydration can be assigned to different reactions. It should be noted that the following statements are validated only for the cement used in the present study. Other cements might react in other ways and therefore might display maxima pronounced to different degrees.
Figure 5 shows the heat flow curve, as measured, of the cement used, together with the calculated total heat of hydration, also taking into account the partial contributions to the heat flow of the silicate reaction, C3A dissolution and ettringite precipitation. Neither the contribution made by gypsum dissolution nor that made by anhydrite dissolution were taken into account, since both of these contributions were so small as to be negligible.
Excluding the initial period of cement hydration (up to the 60 minute-point) approximately 230 J/g +/- 8 J/g of heat of hydration could be measured during the main period of cement hydration. We can sub-divide this amount of measured heat into approximately 127 J/g during the silicate reaction peak and 103 J/g during the sulfate depletion peak.
Whereas the silicate reaction and the ettringite formation contribute to both – i.e. to the silicate reaction peak as well as to the sulfate depletion peak - the dissolution of the C3A contributes to the sulfate depletion peak alone. More than 41 % of the heat released during the sulfate depletion peak can be attributed to the aluminate reaction.
Since there is no further reaction of the C3A detectable until the sulfate depletion peak occurs, it is conceivable that the amount of C3A which reacts immediately after mixing the cement with water is sufficient to produce the precipitation of ettringite until further dissolution of C3A can be detected. The dissolution of 1,7 wt.% of C3A during stirring of the paste and the first XRD pattern after 15 minutes was observed. But only 2.8 wt.-% of ettringite are precipitated at the same interval. The 2,0 wt. of dissolved C3A are sufficient for the precipitation of approximately 9 wt.% of pure ettringite (considering equation 2). These 9 wt.% correspond approximately to the amount of ettringite precipitated at the point in time at which the further dissolution of C3A begins. We might assume that an amorphous aluminate phase is formed during the first minutes of cement hydration which then serves as a reservoir for the consequent ettringite formation. It might be interesting to perform some AI27 NMR experiments in order to verify whether such an Al-reservoir actually exists.
The data yielded by this investigation show that the first maximum occurring during the main period, namely at about 7.5 hours, is accompanied by a change in the controlling mechanism of the silicate reaction. The transition from the acceleration period to the deceleration period in the heat flow of the hydrating cement is in very good accordance with the transition from the acceleration period to the deceleration period in the silicate reaction, even though the ettringite precipitation also contributes to the heat measured at this maximum.

Dissertation Daniel Jansen, University Erlangen-Nürnberg, 2011
- 93 -
Since the further reaction of the C3A and the accelerated ettringite precipitation strongly depends on the presence (amount and reactivity) of the sulfate carriers [2, 3, 4, 31], the heat flow maximum occurring during the deceleration period (we say this even though the maximum in question does not always occur during the deceleration period) is designated as the “sulfate depletion” peak [2]. The heat flow as measured is caused by the silicate reaction, C3A dissolution and accelerated ettringite precipitation: However, the accelerated ettringite precipitation in our system is not as pronounced as it is in other systems [4].

Dissertation Daniel Jansen, University Erlangen-Nürnberg, 2011
- 94 -
FIGURE 5 HEAT FLOW AND TOTAL HEAT OF HYDRATION DURING THE HYDRATION OF THE OPC USED
Acknowledgement
The authors would like to thank Florian Deschner for his support.

Dissertation Daniel Jansen, University Erlangen-Nürnberg, 2011
- 95 -
References
[1] J. W. Bullard, H. M. Jennings, R. A. Livingston, A. Nonat, G. W. Scherer, J. S. Schweitzer, K. L. Scrivener, J. J. Thomas, Mechanisms of cement hydration, Cement and Concrete Research, In Press, Corrected Proof, Available online 29 October 2010, ISSN 0008-8846, DOI: 10.1016/j.cemconres.2010.09.011.
[2] W. Lerch, The influence of gypsum on the hydration and properties of Portland cementpastes, American Society for Testing Materials, 46 (1946) 1252-1297
[3] P. Sandberg, L.R. Roberts, Studies of cement-Admixture Interactions Related to Aluminate Hydration Control by Isothermal Calorimetry, American Concrete Institute, 217 (2003) 529-542
[4] C. Hesse, F. Goetz-Neunhoeffer, J. Neubauer, A new approach in quantitative in-situ XRD of cement pastes: Correlation of heat flow curves with early hydration reactions, Cement and Concrete Research, 41 (2010) 123-128
[5] H.F.W. Taylor, Cement Chemistry, 2nd ed. Thomas Telford Publishing, 1997.
[6] S. Bishnoi, K.L. Scrivener, µic: A new platform for modeling the hydration of cements, Cement and Concrete Research, 39 (2009) 266-274
[7] S. Bishnoi, K.L. Scrivener, Studying nucleation and growth kinetics of alite hydration using µic, Cement and Concrete Research, 39 (2009) 849-860
[8] J.J. Thomas, A new approach to modeling the nucleation and growth kinetics of tricalcium silicate hydration, J. Am. Ceram. Soc., 90 (2007) 3282-3288
[9] W.A. Gutteridge, On the Dissolution of the Interstitial Phases in Portland Cement, Cement and Concrete Research, 9 (1979) 319-324
[10] L.J. Struble, The Effect of Water on Maleic Acid and Salicylic Acid Extractions, Cement and Concrete Research, 15 (1985) 631-636
[11] H.M. Rietveld, A profile refinement method for nuclear and magnetic structures, J. Appl. Crystallogr., 2 (1969) 65-71
[12] R.W. Cheary, A. Coelho, A fundamental parameters approach to X-ray line-profile fitting, J. Appl. Cryst., 25 (1992) 109-121
[13] B.H. O´Connor, M.D. Raven, Application of the Rietveld Refinement Procedure in Assaying Powdered Mixtures, Powder Diffraction, 3 (1988) 2-6
[14] D. Jansen, Ch. Stabler, F. Goetz-Neunhoeffer, S. Dittrich, J. Neubauer, Does Ordinary Portland Cement contain amorphous phase? A quantitative study using an external standard method, Powder Diffraction, 26 (2011), 31-38
[15] C. Hesse, F. Goetz-Neunhoeffer, J. Neubauer, M. Braeu, P. Gaeberlein, Quantitative in situ X-ray diffraction analysis of early hydration of Portland cement at defined temperatures, Powder Diffraction, 24 (2009) 112-115

Dissertation Daniel Jansen, University Erlangen-Nürnberg, 2011
- 96 -
[16] A.G. De La Torre, S. Bruque, J. Campo, M.A.G. Aranda, The superstructure of C3S from synchrotron and neutron powder diffraction and its role in quantitative phase analysis, Cement and Concrete Research, 32 (2002) 1347-1356
[17] K.H. Jost, B. Ziemer, R. Seydel, Redetermination of the structure of β-dicalcium silicate, Acta Crystallogr., Sect. B: Struct. Crystallogr. Cryst. Chem., 33 (1977) 1696-1700
[18] R. Mueller, Stabilisierung verschiedener Dicalciumsilikat-Modifikationen durch den Einbau von Phosphat: Synthese, Rietveld-analyse, Kalorimetrie, Diploma-thesis (2001) University of Erlangen.
[19] P. Mondal, J. Jeffery, The crystal structure of tricalcium aluminate, Ca3Al2O6, Acta Crystallogr., Sect. B: Struct. Crystallogr. Cryst. Chem., 31 (1975) 689-697
[20] Y. Takéuchi, F. Nishi, Crystal-chemical characterization of the Al2O3-Na2O solid-solution series, Z. Kristallogr., 152 (1980) 259-307
[21] A.C. Jupe, J.K. Cockcroft, P. Barnes, S.L. Colston, G. Sankar, C. Hall, The site occupancy of Mg in the brownmillerite structure and its effect on hydration properties: An X-ray/neutron diffraction and EXAFS study, J. Appl. Crystallogr., 34 (2001) 55-61
[22] B.F. Pedersen, Neutron diffraction refinement of the structure of gypsum, Acta Crystallogr., Sect. B, Struct. Crystallogr. Cryst. Chem., 38 (1982) 1074-1077
[23] H. Weiss, M.F. Bräu, How much water does calcined gypsum contain?, Angew. Chem., Int. Ed., 48 (2009) 3520-3524
[24] A. Kirfel, G. Will, Charge density in anhydrite CaSO4, from X-ray and neutron diffraction measurements, Acta Crystallogr., Sect.B: Struct. Crystallogr. Cryst. Chem., 36 (1980) 2881-2890
[25] E.N. Maslen, V.A. Streltsov, N.R. Streltsova, Electron density and optical anisotropy in rhombohedral carbonates. III. Synchroton X-ray studies of CaCO3, MgCO3 and MnCO3, Acta Crystallogr., Sect. B: Struct. Sci., 51 (1995) 929-939
[26] Y. Le Page, G. Donnay, Refinement of the crystal structure of low-quartz, Acta Crystallogr., Sect.B: Struct. Crystallogr. Cryst. Chem., 32 (1976) 2456-2459
[27] K. Ojima, Y. Hishihata, A. Sawada, Structure of potassium sulfate at temperatures from 296 K down to 15 K, Acta Crystallogr., Sect. B: Struct. Sci. 51 (1995) 287-293
[28] F. Goetz-Neunhoeffer, J. Neubauer, Refined ettringite structure for quantitative X-ray diffraction analysis, Powder Diffraction, 21 (2006) 4-11
[29] W.R. Busing, H.A. Levy, Neutron diffraction study of calcium hydroxide, Acta Crystallogr., Sect. B: Struct. Sci. 42 (1986) 51-55
[30] D.M. Többens, N. Stuesser, K. Knorr, H.M. Mayer, G. Lampert, The new high-resolution neutron powder diffractometer at the Berlin neutron scattering center, Materials Science Forum, 378 (2001) 288-193

Dissertation Daniel Jansen, University Erlangen-Nürnberg, 2011
- 97 -
[31] D. Jansen, F. Goetz-Neunhoeffer, Ch. Stabler, J. Neubauer, A remastered external standard method applied to the quantification of early OPC hydration, Cement and Concrete Research 41 (2011) 602-608
[32] D. Jansen, S. T. Bergold, F. Goetz-Neunhoeffer, J. Neubauer, The hydration of alite: a time-resolved quantitative X-ray diffraction approach using the G-factor method compared with heat release, Journal of Applied Crystallography, 44 (2011),doi:10.1107/S0021889811025933
[33] Kulik, D., GEMS-PSI 3.0 2010, available at http://gems.web.psi.ch/. PSI-Villigen, Switzerland.
[34] Lothenbach, B., T. Matschei, G. Möschner and F.P. Glasser, Thermodynamic modeling of the effect of temperature on the hydration and porosity of Portland cement, Cement and Concrete Research, 38 (2008) 1-18.
[35] K. Fuji, W. Kondo, Communications of the American ceramic society: Estimation of thermochemical data for calcium silicate hydrate (C-S-H), Journal of the American Ceramic Society, 66 (1983) C-220-C-221
[36] Hummel, W., U. Berner, E. Curti, F.J. Pearson and T. Thoenen, Nagra/PSI Chemical Thermodynamic Data Base 01/01. 2002, USA, also published as Nagra Technical Report NTB 02-16, Wettingen, Switzerland. Universal Publishers/uPUBLISH.com. 565.
Dissertation Daniel Jansen, University Erlangen-Nürnberg, 2011
- 98 -
4.5. INFLUENCE OF PDADMAC ON THE HYDRATION OF CEMI 52.5R( SUBMITTED TO CCC)
Effect of Polymers on Cement Hydration: A Case Study Using Substituted PDADMA
D. Jansen 1, J. Neubauer 1, F. Goetz-Neunhoeffer 1, R. Haerzschel 2, W.-D. Hergeth 2
1 Mineralogy, GeoZentrum Nordbayern, University of Erlangen-Nuremberg, D-91054 Erlangen, Germany
2 Wacker Chemie AG, Muenchen, Germany
Submitted to: Cement and Concrete Composites
Abstract
A study was carried out, using heat flow calorimetry and quantitative X-ray diffractometry, of the different influences which are exerted by types of cationic Polydiallyldimethylammonium (PDADMA) displaying different anionic counterions on the hydration behavior of an Ordinary Portland Cement (OPC). It was shown that the influence of the cationic polymer PDADMA on the hydration of the cement will tend to be strongly dependent on the nature of the anionic counterion. In case of OH- , more calcium sulfate will tend to be dissolved in the early stages, which acts in turn as an accelerator for the hydration of the C3S phase. In case of SO4
2- there will tend to occur a secondary gypsum precipitation, which will in turn act to lower the Ca2+ -content in the mix water, leading to a retardation of the hydration process compared to the hydration in absence of polymer.
Keywords OPC hydration, PDADMAC, calorimetry, XRD analysis, G factor
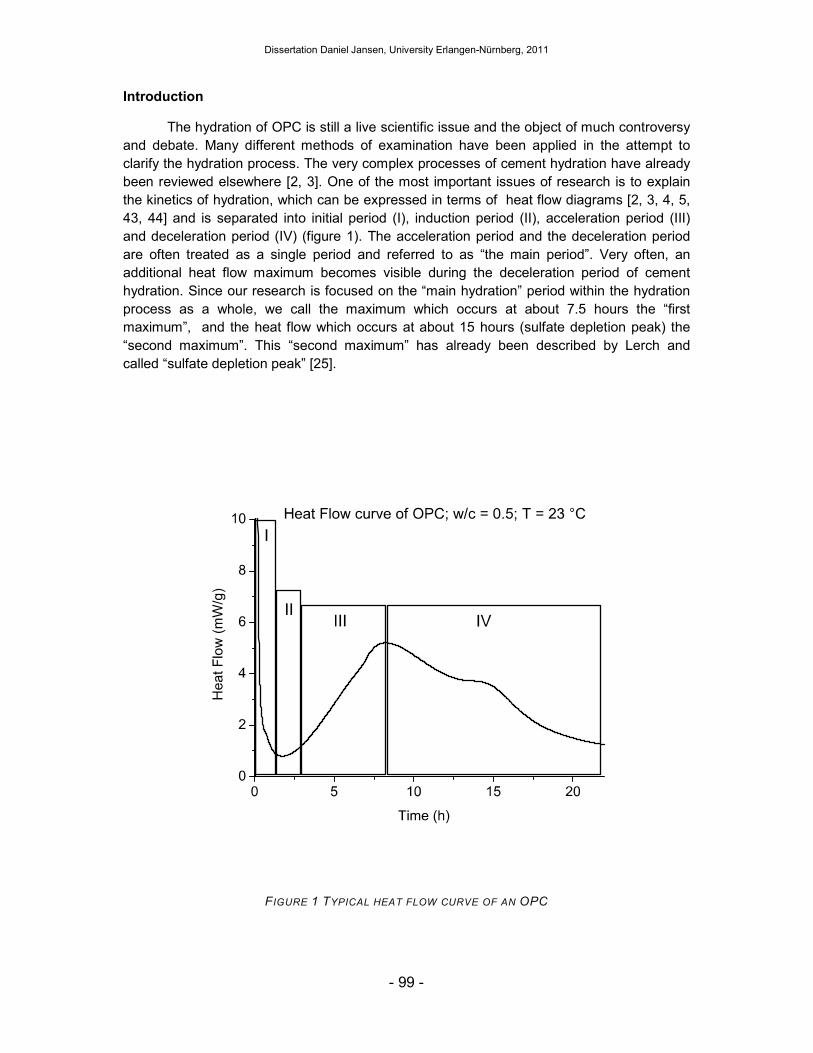
Dissertation Daniel Jansen, University Erlangen-Nürnberg, 2011
- 99 -
Introduction
The hydration of OPC is still a live scientific issue and the object of much controversy and debate. Many different methods of examination have been applied in the attempt to clarify the hydration process. The very complex processes of cement hydration have already been reviewed elsewhere [2, 3]. One of the most important issues of research is to explain the kinetics of hydration, which can be expressed in terms of heat flow diagrams [2, 3, 4, 5, 43, 44] and is separated into initial period (I), induction period (II), acceleration period (III) and deceleration period (IV) (figure 1). The acceleration period and the deceleration period are often treated as a single period and referred to as “the main period”. Very often, an additional heat flow maximum becomes visible during the deceleration period of cement hydration. Since our research is focused on the “main hydration” period within the hydration process as a whole, we call the maximum which occurs at about 7.5 hours the “first maximum”, and the heat flow which occurs at about 15 hours (sulfate depletion peak) the “second maximum”. This “second maximum” has already been described by Lerch and called “sulfate depletion peak” [25].
FIGURE 1 TYPICAL HEAT FLOW CURVE OF AN OPC
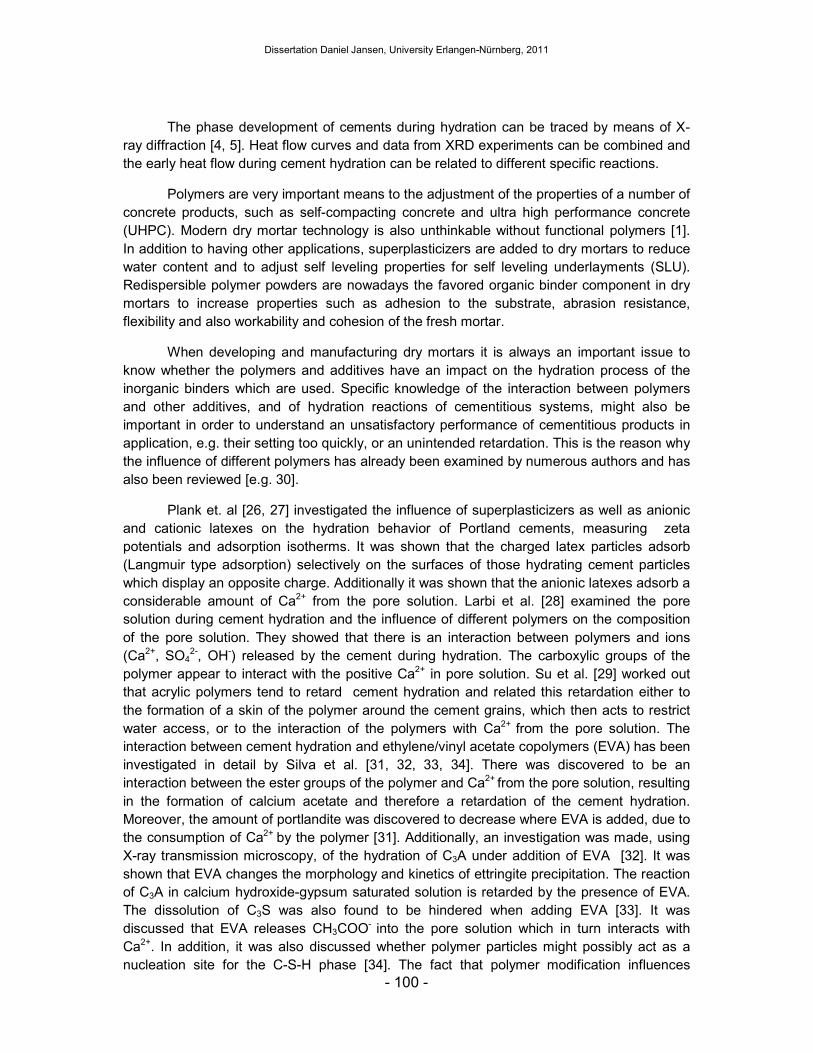
Dissertation Daniel Jansen, University Erlangen-Nürnberg, 2011
- 100 -
The phase development of cements during hydration can be traced by means of X-ray diffraction [4, 5]. Heat flow curves and data from XRD experiments can be combined and the early heat flow during cement hydration can be related to different specific reactions.
Polymers are very important means to the adjustment of the properties of a number of concrete products, such as self-compacting concrete and ultra high performance concrete (UHPC). Modern dry mortar technology is also unthinkable without functional polymers [1]. In addition to having other applications, superplasticizers are added to dry mortars to reduce water content and to adjust self leveling properties for self leveling underlayments (SLU). Redispersible polymer powders are nowadays the favored organic binder component in dry mortars to increase properties such as adhesion to the substrate, abrasion resistance, flexibility and also workability and cohesion of the fresh mortar.
When developing and manufacturing dry mortars it is always an important issue to know whether the polymers and additives have an impact on the hydration process of the inorganic binders which are used. Specific knowledge of the interaction between polymers and other additives, and of hydration reactions of cementitious systems, might also be important in order to understand an unsatisfactory performance of cementitious products in application, e.g. their setting too quickly, or an unintended retardation. This is the reason why the influence of different polymers has already been examined by numerous authors and has also been reviewed [e.g. 30].
Plank et. al [26, 27] investigated the influence of superplasticizers as well as anionic and cationic latexes on the hydration behavior of Portland cements, measuring zeta potentials and adsorption isotherms. It was shown that the charged latex particles adsorb (Langmuir type adsorption) selectively on the surfaces of those hydrating cement particles which display an opposite charge. Additionally it was shown that the anionic latexes adsorb a considerable amount of Ca2+ from the pore solution. Larbi et al. [28] examined the pore solution during cement hydration and the influence of different polymers on the composition of the pore solution. They showed that there is an interaction between polymers and ions (Ca2+, SO4
2-, OH-) released by the cement during hydration. The carboxylic groups of the polymer appear to interact with the positive Ca2+ in pore solution. Su et al. [29] worked out that acrylic polymers tend to retard cement hydration and related this retardation either to the formation of a skin of the polymer around the cement grains, which then acts to restrict water access, or to the interaction of the polymers with Ca2+ from the pore solution. The interaction between cement hydration and ethylene/vinyl acetate copolymers (EVA) has been investigated in detail by Silva et al. [31, 32, 33, 34]. There was discovered to be an interaction between the ester groups of the polymer and Ca2+ from the pore solution, resulting in the formation of calcium acetate and therefore a retardation of the cement hydration. Moreover, the amount of portlandite was discovered to decrease where EVA is added, due to the consumption of Ca2+ by the polymer [31]. Additionally, an investigation was made, using X-ray transmission microscopy, of the hydration of C3A under addition of EVA [32]. It was shown that EVA changes the morphology and kinetics of ettringite precipitation. The reaction of C3A in calcium hydroxide-gypsum saturated solution is retarded by the presence of EVA. The dissolution of C3S was also found to be hindered when adding EVA [33]. It was discussed that EVA releases CH3COO- into the pore solution which in turn interacts with Ca2+. In addition, it was also discussed whether polymer particles might possibly act as a nucleation site for the C-S-H phase [34]. The fact that polymer modification influences

Dissertation Daniel Jansen, University Erlangen-Nürnberg, 2011
- 101 -
cement hydration and cement microstructure was also described by Dimmig-Osburg [35]. It was shown that polymer modification delays and slows the reaction of the clinker phases, alternatively the precipitation of ettringite and C-S-H phase.
Materials and Methods
Polydiallyldimethylammonium chloride (PDADMAC), a homo-polymer of Diallyldimethylammonium chloride, is a cationic polymer with a high charge density and with a molecular weight of hundreds of thousands of grams per mole. PDADMAC is synthesized by radical polymerization and is soluble in water. The counterion to the positive charge of the nitrogen is chloride. PDADMAC is mainly employed in the papermaking process, inasmuch as it can be used in order to control disturbing substances. In addition to this, PDADMAC can be used as an organic coagulant in waste water treatment. Another interesting use of PDADMAC is its use in dry mix mortar technology [6]. For our experiments, the counterion Cl- at PDADMAC was substituted for both OH- and SO4
2-. The structure of PDADMAC is shown in figure 2.
FIGURE 2 STRUCTURE OF POLYDIALLYLDIMETHYLAMMONIUM CHLORIDE (PDADMAC)

Dissertation Daniel Jansen, University Erlangen-Nürnberg, 2011
- 102 -
The PDADMAC has a molecular weight of appr. Mw ~ 200 000 g/mol and a chlorine content of 20.3 %.A 100 g aqueous PDADMAC solution of 41.4 % total solids was charged to a dialysis membrane tubing DTV12000.05.000 (Medicell International Ltd; London) having a pore width corresponding to Mw ~ 12000 – 14000 Daltons. This tubing was placed in a glass beaker containing 3 L of a 1 molar solution of either NaOH or Na2SO4 for 14 days of equilibration without stirring.
Data of the PDADMA-X solutions after dialysis, along with the original PDADMAC solution, are summarized in Table 1. The elemental composition represents the total ion concentrations of the PDADMA-X polyelectrolyte solutions (i.e. at equilibrium dissociation).
TABLE 1 CHARACTERIZATION OF THE PDADMA-X USED
Cl
[g / 100 g polymer]
S
[g / 100 g polymer]
Na
[g / 100 g polymer]
PDADMAC 20.3 - -
PDADMA-OH 2.5 - 16.1
PDADMA-SO4 2.0 17.8 21.1
The polymer used was dissolved in the water which was mixed with the cement when starting the experiments. In our experiments we made use of 2 wt.-% of polymer in proportion to the amount of cement.
Heat flow experiments were performed using a commercial TAM Air calorimeter. The cement was mixed and prepared into a sample holder in an air-conditioned room at a temperature of 23°C. The sample holder was then placed in the calorimeter and the heat flow was measured and plotted over time. Because of the disturbance of the signal when opening the calorimeter, the first 30 minutes of the signal have to be interpreted with care. Since our research focuses on the main hydration process of the cement between 2.5 and 22 hours this just-mentioned disturbing influence on the recorded data does not affect our interpretation.
The OPC used was a commercial CEMI 52.5 R which is commonly used in dry mix mortar technology. The phase composition, which was derived from Rietveld analysis (applying the G-factor method presented later in this manuscript), as well as the chemical composition, are shown in Table 2. A detailed discussion about the amorphous content of the investigated OPC can be found elsewhere [8].

Dissertation Daniel Jansen, University Erlangen-Nürnberg, 2011
- 103 -
TABLE 2 MINERALOGICAL AND CHEMICAL COMPOSITION OF THE OPC USED
Phase Wt.-% Oxide Wt.-%
Alite (C3S) 57.7 +/- 1.2 CaO 66.2 Belite (C2S) 11.7 +/- 0.6 SiO2 22.6 α`-C2S 8.0 +/- 0.5 Al2O3 4.1 C3A cubic 5.6 +/- 0.3 Fe2O3 1.3 C3A orthorombic 4.8 +/- 0.3 MgO 0.8 C4AF 1.9 +/- 0.2 K2O 0.7 Gypsum 0.8 +/- 0.1 Na2O 0.1 Bassanite 1.5 +/- 0.1 SO3 3.4 Anhydrite 3.0 +/- 0.2 LOI 0.8 Calcite 2.2 +/- 0.2 Quartz 0.9 +/- 0.1 Arcanite 0.9 +/- 0.1 Amorphous/misfitted 1.0 +/- 0.5
The method used for the quantification of the XRD pattern of the hydrating cement pastes was a Rietveld refinement [9] employing a fundamental parameter approach [39] and using the Rietveld software Topas V4.0. The external standard method used was based on the suggestion of O`Connor and Raven, using a calibration factor (in our case called G) in order to calculate absolute quantities [7, 8].
The special problem when using X-ray diffraction in OPC pastes is the fact that the C-S-H phase and the water cannot be quantified directly by means of X-ray. In addition, it can also happen that the AFm phase precipitates with a quite low degree of crystallinity, which makes determination of precise quantities very difficult.
The use of Rietveld software for the quantification of XRD diagrams has the disadvantage that the results are normalized to 100 wt.-% so that there is a falsification of the data as soon as amorphous or misfitted phases prove to be present in the cement paste.
Therefore an adequate method, based on an internal or external standard, should be employed for the quantification of cement pastes. It has been shown that the G-factor method which was first described by O´Connor [7] is the most suitable method for the quantification of hydration reactions [5].
This method involves the calibration of the diffractometer with a well known standard (in our case silicon powder derived from milling of a single crystal). A calibration factor G is calculated using equation 1.
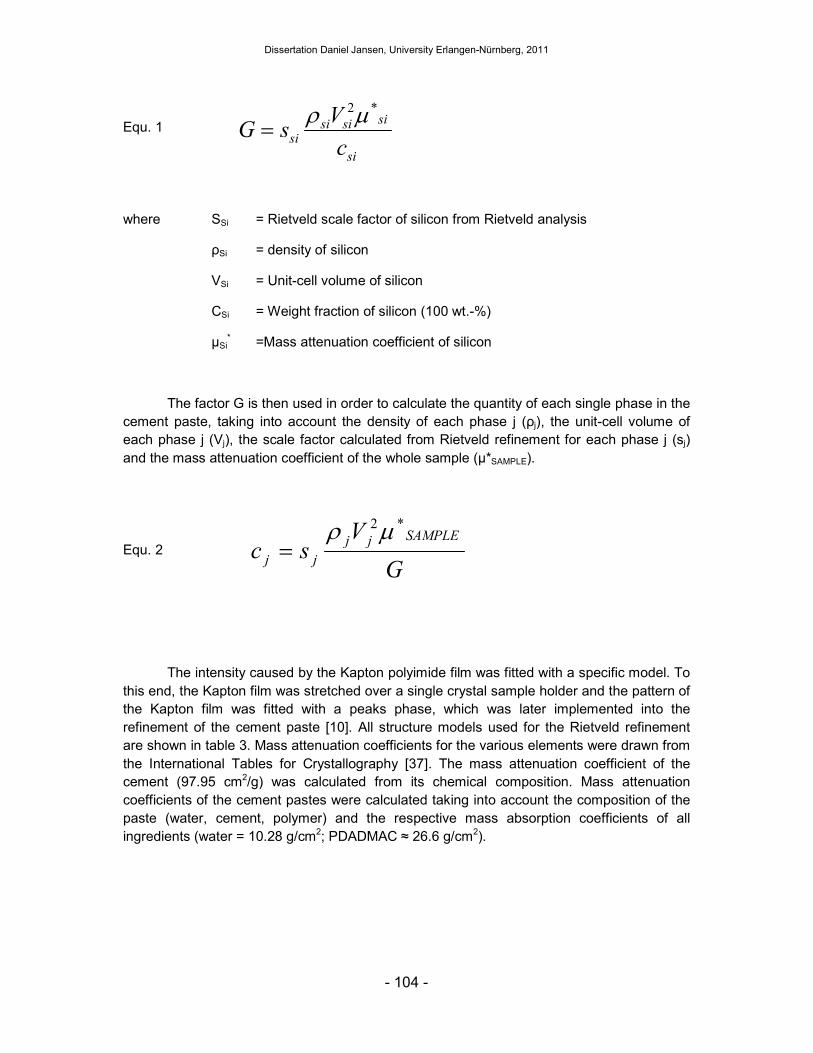
Dissertation Daniel Jansen, University Erlangen-Nürnberg, 2011
- 104 -
Equ. 1
where SSi = Rietveld scale factor of silicon from Rietveld analysis
ρSi = density of silicon
VSi = Unit-cell volume of silicon
CSi = Weight fraction of silicon (100 wt.-%)
µSi* =Mass attenuation coefficient of silicon
The factor G is then used in order to calculate the quantity of each single phase in the cement paste, taking into account the density of each phase j (ρj), the unit-cell volume of each phase j (Vj), the scale factor calculated from Rietveld refinement for each phase j (sj) and the mass attenuation coefficient of the whole sample (µ*SAMPLE).
Equ. 2
The intensity caused by the Kapton polyimide film was fitted with a specific model. To this end, the Kapton film was stretched over a single crystal sample holder and the pattern of the Kapton film was fitted with a peaks phase, which was later implemented into the refinement of the cement paste [10]. All structure models used for the Rietveld refinement are shown in table 3. Mass attenuation coefficients for the various elements were drawn from the International Tables for Crystallography [37]. The mass attenuation coefficient of the cement (97.95 cm2/g) was calculated from its chemical composition. Mass attenuation coefficients of the cement pastes were calculated taking into account the composition of the paste (water, cement, polymer) and the respective mass absorption coefficients of all ingredients (water = 10.28 g/cm2; PDADMAC ≈ 26.6 g/cm2).
si
sisisisi
c
VsG
*2µρ=
G
Vsc
SAMPLEjj
jj
*2µρ=

Dissertation Daniel Jansen, University Erlangen-Nürnberg, 2011
- 105 -
TABLE 3 STRUCTURES USED FOR RIETVELD-REFINEMENT
Phase ICSD Code Reference
Alite (C3S) 94742 De La Torre et al. (2002) [11] Belite (C2S) 963 Jost et al. (1977) [12]
α`-C2S - Mueller (2001) [13] C3A cubic 1841 Mondal and Jeffery (1975) [14]
C3A orthorombic 100220 Takéuchi and Nishi (1980) [15] C4AF 51265 Jupe et al. (2001) [16]
Gypsum 27221 Pedersen et al. (1982) [17] Bassanite 380286 Weiss and Bräu (2009) [18] Anhydrite 16382 Kirfel and Will (1980) [19]
Calcite 80869 Maslen (1995) [20] Quartz 174 Le Page and Donnay (1976) [21]
Arcanite 79777 Ojima et al. (1995) [22] Ettringite 155395 Goetz-Neunhoeffer and Neubauer (2006) [23]
Portlandite 34241 Busing and Levy (1986) [24] Silicon 51688 Többens et al. (2001) [36]
It was recently shown that the calculation of heat flow curves from XRD in-situ data concords well with heat flow diagrams measured by heat flow experiments [4]. This approach indeed has many advantages when it comes to showing clearly where the influence of additives on the hydration process is visible.
To this end, equation 3 is assumed for the silicate reaction [45].
Equ. 3 C3S + 3.9 H → C1.7SH2.6 + 1.3 CH ∆HR = -561J/g
The enthalpy of reaction was calculated using the enthalpy of formation of water from the GEMS version of the Nagra/PSI thermodynamic database [40]. The enthalpies of formation for alite and portlandite were taken from the cemdata07 database [41] and the data of Fuji and Kondo [42] for the enthalpy of formation for C1.7SH2.6.The calculation of heat flow curves (HF) from XRD data generally follows equation 4 [4].
Dissertation Daniel Jansen, University Erlangen-Nürnberg, 2011
- 106 -
Equ. 4 �� �� ��. % 9:!;$
��
%��хΔHR where
/ 01.�% @A2B5
/1 = derivative of the phase content curves
∆HR = enthalpy of reaction
In the present research, heat flow curves were calculated for the silicate reaction alone, in order to illustrate particularly clearly the influence of the polymers used on the silicate reaction during hydration of the cement.
Results
Figure 3 shows the measured heat flow curves of the cement used with and without addition of the substituted PDADMA. It can be seen that the different types of PDADMA affect the cement hydration in different ways. The OH--substituted PDADMA causes an acceleration of the cement hydration. Where PDAMA (OH) is added, the two local heat flow maxima, which occur respectively at 8 hours and 15 hours after the start of hydration in the system without polymer added cannot be separated from each other, they seem to overlap. By contrast, the adding of SO4
2--substituted PDADMA produces a noticeable retardation of the cement hydration. Nevertheless, despite this retardation of the cement hydration, it can be seen in the heat flow diagrams that it is still possible to separate the two heat flow maxima from one another during the main reaction.

Dissertation Daniel Jansen, University Erlangen-Nürnberg, 2011
- 107 -
FIGURE 3 HEAT FLOW CURVES FOR THE OPC USED WITH AND WITHOUT POLYMER ADDITION
Figure 4 shows the change of phase contents of C3A, anhydrite and gypsum for all cement pastes examined (with and without polymer) within 22 h. It can be clearly seen that the polymers affect the dissolution of the phases, which react during the process of hydration in order to form the hydrate phase ettringite.

Dissertation Daniel Jansen, University Erlangen-Nürnberg, 2011
- 108 -
FIGURE 4 PHASE CONTENTS OF GYPSUM (+/-0.1 WT.%), ANHYDRITE (+/- 0.2 WT.%) AND C3A (+/-
0.5 WT.%) IN THE CEMENT PASTES WITH AND WITHOUT POLYMER ADDITION
Where the OH--substituted PDADMA is added, there is no gypsum detectable in the first XRD pattern of the cement paste (figure 5). In the system without polymer addition, and in the system where it is rather the SO4
2--substituted PDADMA that is added, there is the same amount of gypsum detectable in the first XRD pattern as was determined in the dry cement (concerning the w/c-ratio of 0.5).

Dissertation Daniel Jansen, University Erlangen-Nürnberg, 2011
- 109 -
FIGURE 5 FIRST XRD PATTERNS OF THE CEMENT PASTES RECORDED WITH AND WITHOUT POLYMER
ADDITION
The addition of the SO42--substituted PDADMA leads to a secondary gypsum
precipitation during the first hours of hydration. The dissolution of the phase anhydrite begins, in the system with the OH--substituted PDADMA, immediately after the mixing of the cement with the polymer-water mixture. In the other systems examined, there is also a dissolution of anhydrite detectable immediately after the beginning of hydration. However, this latter dissolution ceases at a point between 3 and 7 h, while the dissolution of gypsum continues to be detectable.
In none of the systems examined did the C3A dissolution begin before the dissolution of anhydrite, the last available sulfate carrier, was slowed down. Therefore, the dissolution of the C3A in the system with OH--substituted PDADMA occurs at least 5 h earlier than it does in either the system without addition of any polymer or the system with SO4
2--substituted PDADMA added.
Because of the secondary gypsum precipitation, sulfate carriers are available for a longer period in the cement paste with PDADMA (SO4) and further dissolution of C3A is delayed by higher SO4
2- concentration in the pore solution.
Co
un
ts
0
1000
2000
3000
°2 (CuK )θ α
10 20 30 40
gypsum 020
without polymer
with PDADMAC (OH)
with PDADMAC (SO )4
anhydrite 020
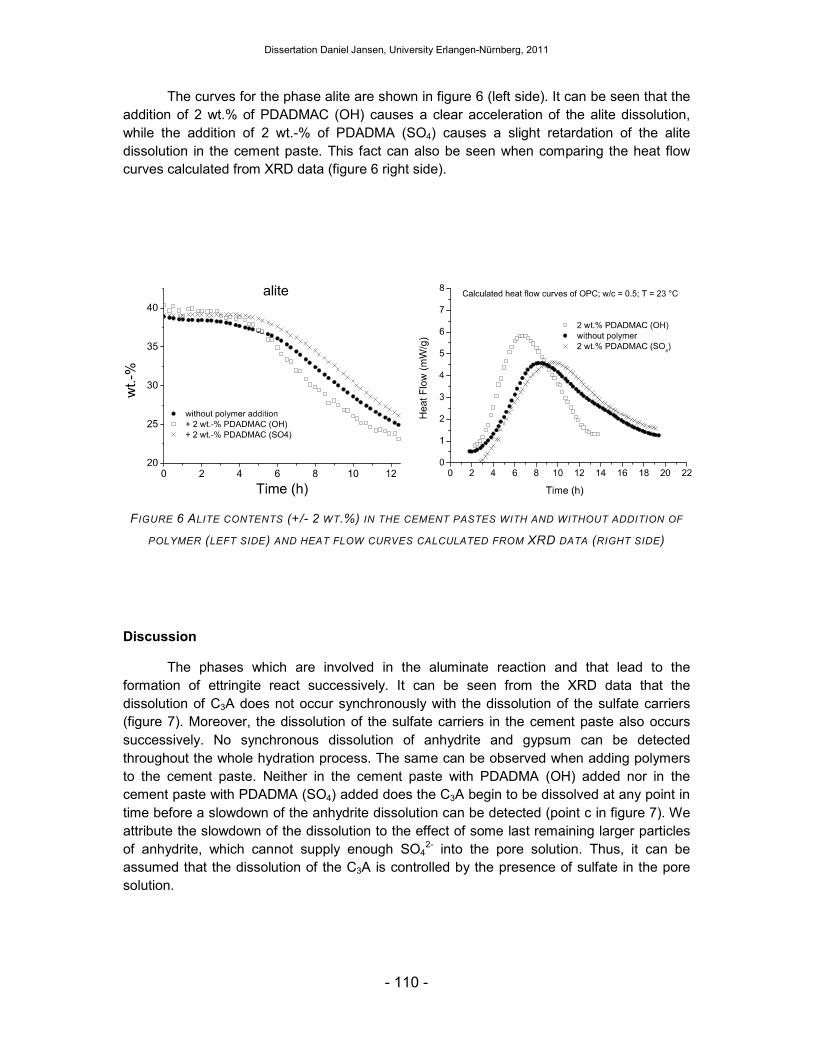
Dissertation Daniel Jansen, University Erlangen-Nürnberg, 2011
- 110 -
The curves for the phase alite are shown in figure 6 (left side). It can be seen that the addition of 2 wt.% of PDADMAC (OH) causes a clear acceleration of the alite dissolution, while the addition of 2 wt.-% of PDADMA (SO4) causes a slight retardation of the alite dissolution in the cement paste. This fact can also be seen when comparing the heat flow curves calculated from XRD data (figure 6 right side).
FIGURE 6 ALITE CONTENTS (+/- 2 WT.%) IN THE CEMENT PASTES WITH AND WITHOUT ADDITION OF
POLYMER (LEFT SIDE) AND HEAT FLOW CURVES CALCULATED FROM XRD DATA (RIGHT SIDE)
Discussion
The phases which are involved in the aluminate reaction and that lead to the formation of ettringite react successively. It can be seen from the XRD data that the dissolution of C3A does not occur synchronously with the dissolution of the sulfate carriers (figure 7). Moreover, the dissolution of the sulfate carriers in the cement paste also occurs successively. No synchronous dissolution of anhydrite and gypsum can be detected throughout the whole hydration process. The same can be observed when adding polymers to the cement paste. Neither in the cement paste with PDADMA (OH) added nor in the cement paste with PDADMA (SO4) added does the C3A begin to be dissolved at any point in time before a slowdown of the anhydrite dissolution can be detected (point c in figure 7). We attribute the slowdown of the dissolution to the effect of some last remaining larger particles of anhydrite, which cannot supply enough SO4
2- into the pore solution. Thus, it can be assumed that the dissolution of the C3A is controlled by the presence of sulfate in the pore solution.
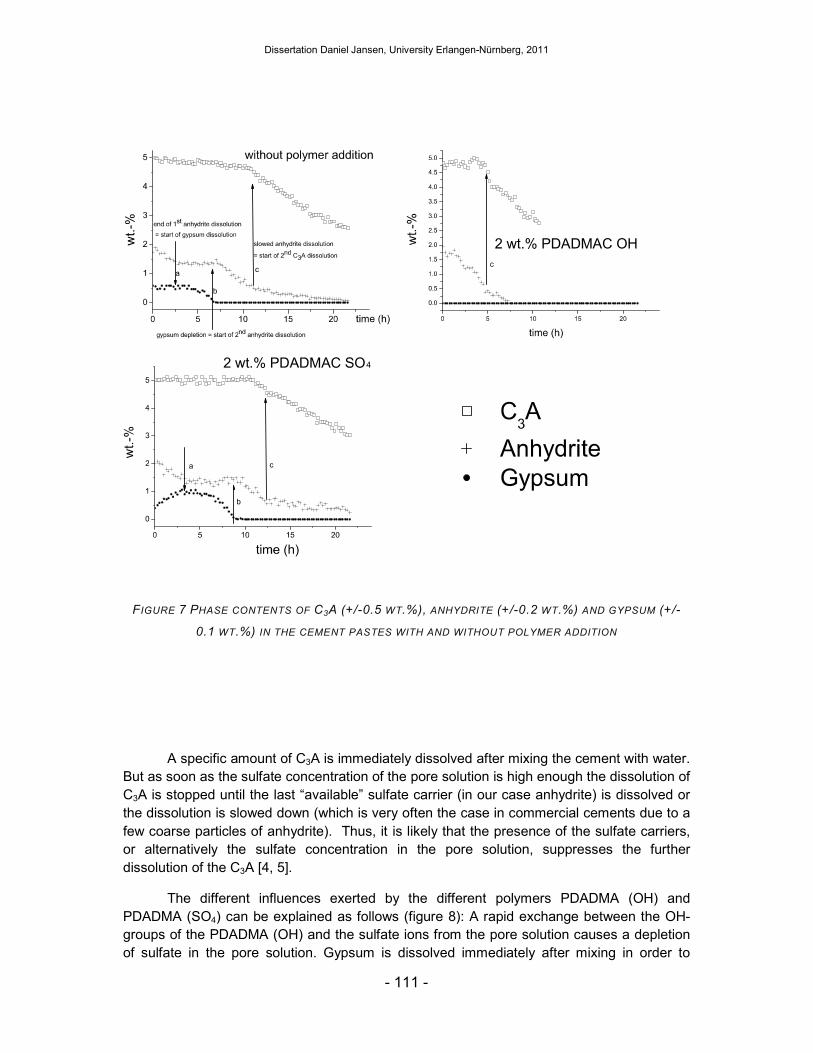
Dissertation Daniel Jansen, University Erlangen-Nürnberg, 2011
- 111 -
FIGURE 7 PHASE CONTENTS OF C3A (+/-0.5 WT.%), ANHYDRITE (+/-0.2 WT.%) AND GYPSUM (+/-
0.1 WT.%) IN THE CEMENT PASTES WITH AND WITHOUT POLYMER ADDITION
A specific amount of C3A is immediately dissolved after mixing the cement with water. But as soon as the sulfate concentration of the pore solution is high enough the dissolution of C3A is stopped until the last “available” sulfate carrier (in our case anhydrite) is dissolved or the dissolution is slowed down (which is very often the case in commercial cements due to a few coarse particles of anhydrite). Thus, it is likely that the presence of the sulfate carriers, or alternatively the sulfate concentration in the pore solution, suppresses the further dissolution of the C3A [4, 5].
The different influences exerted by the different polymers PDADMA (OH) and PDADMA (SO4) can be explained as follows (figure 8): A rapid exchange between the OH- groups of the PDADMA (OH) and the sulfate ions from the pore solution causes a depletion of sulfate in the pore solution. Gypsum is dissolved immediately after mixing in order to
2 wt.% PDADMAC OH
2 wt.% PDADMAC SO4

Dissertation Daniel Jansen, University Erlangen-Nürnberg, 2011
- 112 -
adjust equilibrium between the pore solution and the solid. Thus, gypsum can no longer be detected in the first XRD pattern with PDADMA (OH) added (figure 5). Since there is no gypsum available in the cement paste, an immediate dissolution of anhydrite can be detected in the system with PDADMA (OH) added. After about 5 hours, a retardation of the anhydrite dissolution causes the onset of further dissolution of the C3A. The acceleration of the alite dissolution is a secondary effect of the rapid dissolution of the sulfate carriers. The rapid dissolution of the sulfate carriers causes a higher Ca2+ concentration in the pore solution and this in consequence may lead to an acceleration of the alite dissolution or of the silicate reaction respectively. The accelerating influence of Ca-providing compounds such as Ca-formate and CaCl2 have been described very often [38] in construction chemistry. In the case of the PDADMA (OH) system the Ca-providing compound is the sulfate carrier of the cement. Another aspect which should be mentioned is the possibility that both polymers might have an impact on the pH-value of the cement paste. The PDADMA (OH) releases OH groups into the pore solution and might therefore increase the pH-value while the PDADMA (SO4) might decrease the pH-value inasmuch as it takes away OH groups from the pore solution.
FIGURE 8 MODELS FOR THE INFLUENCE OF THE DIFFERENT PDADMACS ON THE HYDRATION OF THE
OPC USED IN THE STUDY
While the addition of the PDADMA (OH) leads to a more rapid dissolution of the sulfate carriers, C3A and alite, the addition of the PDADMA (SO4) causes a secondary gypsum formation during the first hours of hydration and retards the dissolution of the reactive phases C3A and alite. The presence of an increased sulfate concentration in the pore solution can be traced back to an exchange occurring between SO4
2- supplied by the polymer and OH- ions from the pore solution. The formation of secondary gypsum, which can be detected with X-rays, leads to a depletion of Ca2+ in the pore solution, which in turn
0 5 10 150
2
4
6
8
10
mW
/g
time (h)
PDADMAC(OH)
+ + + + + + + +
OH-
SO42-
from pore solution
- faster dissolution of sulfate carriers- faster dissolution of C A3
Ca- ions from sulfate carriers accelerate silicate reaction
without polymer+ 2 wt.-% PDADMAC (OH)
PDADMAC( )
+ + + + + + + +
OH-
SO42-
from pore solution
- sulfate from polymer causes secondary gypsum precipitation- Final dissolution of sulfate carriers is delayed- Dissolution of C A is delayed3
0 5 10 15 200
2
4
6
8
10
without polymer+ 2 wt.-% PDADMAC (SO
4)
time (h)
SO42-
consumption of Ca for secondary gypsum precipitationcauses delay of silicate reaction
mW
/g

Dissertation Daniel Jansen, University Erlangen-Nürnberg, 2011
- 113 -
causes the prolongation of the induction period. The further dissolution of the C3A is retarded because of the increased content of available SO4
2-. Since there is more gypsum in the cement paste, the complete dissolution of the sulfate carriers takes more time than in the system without polymer added. The dissolution of gypsum is entirely completed after 7.5 hours in the system without polymer added and at about 9 hours in the system with PDADMA (SO4) added (figure 7). Thus, the further dissolution of anhydrite is delayed leading to a further retardation of the C3A dissolution. The second heat flow maximum, which can be ascribed to the dissolution of the C3A and an accelerated ettringite precipitation, occurs at later points of time than in the system without polymer.
Finally, figure 9 shows the measured heat flow curves of all cement pastes examined, as well as the heat flow curves for the silicate reaction as calculated from XRD data. The influence of the polymers on the alite dissolution (and C-S-H-, portlandite precipitation) can be clearly demonstrated. It can be seen that the PDADMA (OH) clearly accelerates the silicate reaction and that the PDADMA (SO4) slightly retards the silicate reaction. It must be emphasized that the calculated heat flow curves do not include the heat released by the dissolution of C3A, anhydrite, or gypsum, nor do they include the heat released during the precipitation of ettringite.
FIGURE 9 COMPARISON BETWEEN MEASURED HEAT FLOW AND THE HEAT FLOW CALCULATED FROM
XRD DATA.

Dissertation Daniel Jansen, University Erlangen-Nürnberg, 2011
- 114 -
References
[1] Bayer, R., Lutz, H., Dry Mortars, Ullmann`s Encyclopedia of Industrial Chemistry, 2009
[2] P. Juilland, E. Gallucci, R. Flatt, K. Scrivener, Dissolution theory applied to the induction period in alite hydration, Cement and Concrete Research, 40 (2010) 831-844
[3] J. W. Bullard, H. M. Jennings, R. A. Livingston, A. Nonat, G. W. Scherer, J. S. Schweitzer, K. L. Scrivener, J. J. Thomas, Mechanisms of cement hydration, Cement and Concrete Research, In Press, Corrected Proof, Available online 29 October 2010, ISSN 0008-8846, DOI: 10.1016/j.cemconres.2010.09.011.
[4] C. Hesse, F. Goetz-Neunhoeffer, J. Neubauer, A new approach in quantitative in-situ XRD of cement pastes: Correlation of heat flow curves with early hydration reactions, Cement and Concrete Research, 41 (2010) 123-128
[5] D. Jansen et al., A remastered external standard method applied to the quantification of early OPC hydration, Cement and Concrete Research, 41 (2011) 602-608
[6] EP 1984 428, Wacker Chemie AG; Schorm, A, Weitzel, H.P., Killat, S., Lutz, H.
[7] B.H. O´Connor, M.D. Raven, Application of the Rietveld Refinement Procedure in Assaying Powdered Mixtures, Powder Diffraction, 3 (1988) 2-6
[8] D. Jansen, Ch. Stabler, F. Goetz-Neunhoeffer, S. Dittrich, J. Neubauer, Does Ordinary Portland Cement contain amorphous phase? A quantitative study using an external standard method, Powder Diffraction, 26 (2011) 31-38
[9] H.M. Rietveld, A profile refinement method for nuclear and magnetic structures, J. Appl. Crystallogr., 2 (1969) 65-71
[10] C. Hesse, F. Goetz-Neunhoeffer, J. Neubauer, M. Braeu, P. Gaeberlein, Quantitative in situ X-ray diffraction analysis of early hydration of Portland cement at defined temperatures, Powder Diffraction, 24 (2009) 112-115
[11] A.G. De La Torre, S. Bruque, J. Campo, M.A.G. Aranda, The superstructure of C3S from synchrotron and neutron powder diffraction and its role in quantitative phase analysis, Cement and Concrete Research, 32 (2002) 1347-1356
[12] K.H. Jost, B. Ziemer, R. Seydel, Redetermination of the structure of β-dicalcium silicate, Acta Crystallogr., Sect. B: Struct. Crystallogr. Cryst. Chem., 33 (1977) 1696-1700
[13] R. Mueller, Stabilisierung verschiedener Dicalciumsilikat-Modifikationen durch den Einbau von Phosphat: Synthese, Rietveld-analyse, Kalorimetrie, Diplom-thesis (2001) University of Erlangen.
[14] P. Mondal, J. Jeffery, The crystal structure of tricalcium aluminate, Ca3Al2O6, Acta Crystallogr., Sect. B: Struct. Crystallogr. Cryst. Chem., 31 (1975) 689-697
[15] Y. Takéuchi, F. Nishi, Crystal-chemical characterization of the Al2O3-Na2O solid-solution series, Z. Kristallogr., 152 (1980) 259-307

Dissertation Daniel Jansen, University Erlangen-Nürnberg, 2011
- 115 -
[16] A.C. Jupe, J.K. Cockcroft, P. Barnes, S.L. Colston, G. Sankar, C. Hall, The site occupancy of Mg in the brownmillerite structure and its effect on hydration properties: An X-ray/neutron diffraction and EXAFS study, J. Appl. Crystallogr., 34 (2001) 55-61
[17] B.F. Pedersen, Neutron diffraction refinement of the structure of gypsum, Acta Crystallogr., Sect. B, Struct. Crystallogr. Cryst. Chem., 38 (1982) 1074-1077
[18] H. Weiss, M.F. Bräu, How much water does calcined gypsum contain?, Angew. Chem., Int. Ed., 48 (2009) 3520-3524
[19] A. Kirfel, G. Will, Charge density in anhydrite CaSO4, from X-ray and neutron diffraction measurements, Acta Crystallogr., Sect.B: Struct. Crystallogr. Cryst. Chem., 36 (1980) 2881-2890
[20] E.N. Maslen, V.A. Streltsov, N.R. Streltsova, Electron density and optical anisotropy in rhombohedral carbonates. III. Synchroton X-ray studies of CaCO3, MgCO3 and MnCO3, Acta Crystallogr., Sect. B: Struct. Sci., 51 (1995) 929-939
[21] Y. Le Page, G. Donnay, Refinement of the crystal structure of low-quartz, Acta Crystallogr., Sect.B: Struct. Crystallogr. Cryst. Chem., 32 (1976) 2456-2459
[22] K. Ojima, Y. Hishihata, A. Sawada, Structure of potassium sulfate at temperatures from 296 K down to 15 K, Acta Crystallogr., Sect. B: Struct. Sci. 51 (1995) 287-293
[23] F. Goetz-Neunhoeffer, J. Neubauer, Refined ettringite structure for quantitative X-ray diffraction analysis, Powder Diffraction, 21 (2006) 4-11
[24] W.R. Busing, H.A. Levy, Neutron diffraction study of calcium hydroxide, Acta Crystallogr., Sect. B: Struct. Sci., 42 (1986) 51-55
[25] W. Lerch, The influence of gypsum on the hydration and properties of Portland cementpastes, American Society for Testing Materials, 46 (1946) 1252-1297
[26] J. Plank, M. Gretz, Study on the interaction between anionic and cationic latex particles and Portland cement, Colloids and Surfaces A: Physicochem. Eng. Aspects, 330 (2008) 227-233
[27] J. Plank, P. Chatziagorastou, C. Hirsch, New model describing distribution ofadsorbed superplasticizer on the surface of hydrating cement grain, J. Build.Mater., 10 (2007) 7–13.
[28] J.A. Larbi, J. Bijen, Interaction of polymers with Portland cement during hydration- a study of the chemistry of the pore solution of polymer-modified cement systems, Cement and Concrete Research, 20 (1990) 139-147
[29] Z. Su, J.M.J.M Bijen, J.A. Larbi, Influence of polymer modification on the hydration of Portland cement, Cement and Concrete Research, 21 (1991) 242-250
[30] S. Chandra, P. Flodin, Interactions of polymers and organic admixtures on Portland cement hydration, Cement and Concrete Research, 17 (1987) 875-890
[31] D.A. Silva, H.R. Roman, P.J.P. Gleize, Evidences of chemical interaction between EVA and hydrating Portland cement, Cement and Concrete Research, 32 (2002) 1383-1390

Dissertation Daniel Jansen, University Erlangen-Nürnberg, 2011
- 116 -
[32] D.A. Silva, P.J.M. Monteiro, Analysis of C3A hydration using soft X-rays transmission microscopy: Effect of EVA copolymer, Cem. Con. Res., 35 (2005) 2026-2032
[33] D.A. Silva, P.J.M Monteiro, Hydration evolution of C3S-EVA composites analyzed by soft X-ray microscopy, Cement and Concrete Research, 35 (2005) 351-357
[34] D. A. Silva, P.J.M. Monteiro, The influence of polymers on the hydration of Portland cement phases analyzed by soft X-ray transmission microscopy, Cement and Concrete Research, 36 (2006) 1501-1507
[35] A. Dimmig-Osburg, I. Pietsch, J. Pakusch, Polymer additives and their influence on the cement microstructure in the early stages of hardening, ZKG International, 59 (2006) 72-83
[36] D.M. Többens, N. Stuesser, K. Knorr, H.M. Mayer, G. Lampert, The new high-resolution neutron powder diffractometer at the Berlin neutron scattering center, Mater. Sci. Forum, 378-381 (2001) 288-293
[37] International Union for Crystallography, International Tables for Crystallography, Volume C: Mathematical, Physical and Chemical Tables, 3rd ed., edited by E. Prince, Kluwer, Boston (2004)
[38] V. Dodson, Concrete admixtures, Structural Engineering Series, Van Nostrand Reinhold, New York (1990)
[39] R.W. Cheary, A. Coelho, A fundamental parameters approach to X-ray Line-Profile Fitting, J. Appl. Cryst, 25 (1992) 109-121
[40] W. Hummel, U. Berner, E. Curti, F.J. Pearson and T. Thoenen, Nagra/PSI Chemical Thermodynamic Data Base 01/01. 2002, USA, also published as Nagra Technical Report NTB 02-16, Wettin-gen, Switzerland. Universal Publishers/uPUBLISH.com. 565.
[41] B. Lothenbach, T. Matschei, G. Möschner and F.P. Glasser, Thermodynamic modeling of the effect of temperature on the hydration and porosity of Portland cement, Cement and Concrete Research, 38 (2008) 1-18.
[42] K. Fuji, W. Kondo, Communications of the American ceramic society: Estimation of thermochemical data for calcium silicate hydrate (C-S-H), Journal of the American ceramic Society, 66 (1983) C-220-C-221
[43] S. Bishnoi, K.L. Scrivener, Studying nucleation and growth kinetics of alite hydration using µic, Cement and Concrete Research, 39 (2009) 849-860
[44] J.J. Thomas, A new approach to modeling the nucleation and growth kinetics of tricalcium silicate hydration, J. Am. Ceram. Soc., 90 (2007) 3282-3288
[45] A. J. Allen, J. J. Thomas, H.M. Jennings, Composition and density of nanoscale calcium-silicate-hydrate in cement, Nature Materials, 6 (2007) 311-316.

Dissertation Daniel Jansen, University Erlangen-Nürnberg, 2011
- 117 -
4.6. INFLUENCE OF SUPERPLASTICIZERS ON THE HYDRATION OF CEMI 52.5 R (PUBLISHED IN
CCR)
Change in reaction kinetics of a Portland Cement caused by a superplasticizer – Calculation of heat flow curves from XRD data
D. Jansen 1, J. Neubauer 1, F. Goetz-Neunhoeffer 1, R. Haerzschel 2, W.-D. Hergeth 2
1 Mineralogy, GeoZentrum Nordbayern, University of Erlangen-Nuremberg, D-91054 Erlangen, Germany
2 Wacker Chemie AG, Muenchen, Germany
Published in: Cement and Concrete Research, doi:10.1016/j.cemconres.2011.10.005
Abstract
The hydration process of a commercial Portland cement was followed by means of heat flow calorimetry. The measured heat flow was compared with calculated heat flow curves based on XRD data. Examined in particular was the influence of one selected superplasticizer on the hydration of the Portland Cement. It was shown that the superplasticizer in question retards both the aluminate reaction and the silicate reaction. It is certainly conceivable that there are more than only one explanation for the interaction between the superplasticizer and the cement. A complexation of Ca2+ ions from pore solution by the superplasticizer is as thinkable as the adsorption of the polymer on the nuclei or the anhydrous grain surfaces which in turn might lead to the prevention of the growth of the nuclei or the dissolution of the anhydrous grains.
Dissertation Daniel Jansen, University Erlangen-Nürnberg, 2011
- 118 -
Introduction
Superplasticizers are an irreplaceable compound for construction chemistry inasmuch as they improve the workability and flowability of concrete and mortar. They can be used in order to produce modern products such as self levelling compounds [1] and high performance concrete [2]. When they are used in concrete a reduction of the water content can result in improved mechanical properties [3]. If superplasticizers are added to binders without reducing the water content an improved flowability is achieved. This improved flowability is a fundamental requirement for self leveling underlayments or screeds.
Modern superplasticizers in cementitious systems are comb-shaped polycarboxylate-ethers. The liquefaction of the paste is caused by the adsorption of the large molecules on the surfaces of the inorganic grains (cement particles, aggregate). Repulsive forces obtaining between the different grains hinder coagulation and sedimentation and ensure a liquid-like rheology. The role of the different forces (steric or electrostatic) acting in the cement pastes where superplasticizers are present is also a topic of scientific debate and has already been discussed in detail [6, 7].
Much research has been performed concerning the effects of superplasticizers on the hydration of cement in general, and their effects on the morphology and the microstructural development of hardened cementitious products in particular. These findings are summarized in several review articles [4, 5, 11].
Like many organic compounds, superplasticizers have an impact on the hardening process of the inorganic binder cement. These interactions can lead to undesired effects, such as unintended retardation of the whole product, early slump loss, or poor flow behavior. Hence, many efforts have been undertaken to examine the compatibility or incompatibility of different cements with different superplasticizers [8, 9, 10].
In the past, much research on the interaction of superplasticizers with hydrating cements was focused on adsorption and rheology experiments [20, 21, 22, 23].Research has also been focused on the chemical structure of the superplasticizers. Winnefeld et al. [24] have investigated the interaction between polycarboxylate superplasticizers with different molecular structures and hydrating Portland Cements. They concluded that the duration of the dormant period during cement hydration with SP added is a function of charge density and of the side chain density of the SPs used. Yamada et al. [25] concluded that longer side chains, combined with shorter mean backbone chains, give more fluidity at the same dosage.
Models for the interaction between superplasticizers and cements range from preferred adsorption and intercalation of parts of said large molecules [14] to interaction of macromolecules with ions in the pore solution of the cement/mortar/concrete-paste.
Yoshioka [12] and Plank [13] showed that the adsorption of the superplasticizers on the surfaces of cement particles depends on the surface charge of said particles. Hence, superplasticizers preferentially adsorb on the surface of minerals displaying opposite charge in solution, such as C3A and ettringite.
Dissertation Daniel Jansen, University Erlangen-Nürnberg, 2011
- 119 -
Another focus of research has been the influence of superplasticizers on the reaction rate of cements and cement phases. It has been shown that polycarboxylate superplasticizers retard the dissolution of the phase alite as a function of charge density [15, 16]. However, several authors concur in finding that the superplasticizer exerts no effect on the composition of the pore solution [16].
In contrast to these findings, Plank and Larbi [17, 18, 19] assumed an interaction of superplasticizers as well as latexes with cations in a pore solution displaying opposite charge, though a difference in Ca2+ concentration in pore solution could not be detected within the first 24 hours of hydration when adding a superplasticizer.
The present work focuses, from a mineralogical point of view, on the tracking of the retardation process, caused by a superplasticizer, of a commercial OPC. To this end X-ray diffraction techniques were combined with heat flow experiments. The evolution of the sample hardness was also tracked using a Gillmore needle apparatus.
Experimental
A special linear polycarboxylate-based superplasticizer was used for the examinations. The superplasticizers were added to the cement by dissolving them in the mixing water.
The OPC used in this study was a commercial OPC which is used very often in dry-mix mortar technology. A w/c-ratio of 0.5 and a 0.3 wt.% quantity - calculated on the basis of the dry cement - of the new generation comb-shaped polycarboxylate-based superplasticizer were used.
Heat flow experiments were performed using a commercial TAM Air calorimeter from TA Instruments. External stirring was performed using an electrical stirrer which allows a reproducible mixing. This means that the first hour of the signal has to be interpreted with care because of the possible disturbance of the signal when opening the calorimeter.
In situ X-ray experiments were performed using a D8 diffractometer equipped with a Lynx-Eye position sensitive detector. For each preparation 88 ranges were recorded during the first 22 hours of hydration. Rietveld analysis [26] of the dry cement as well as of the cement pastes was performed using the software Topas V4.2 from Bruker (fundamental parameter approach [27]). All structures used, the quantities of the phases present in the dry cement, and the amounts normalized to a cement paste of a w/c ratio of 0.5 are shown in Table 1. Absolute quantities in the cement and cement pastes were calculated using the G-factor method [28, 29]. This method involves using a well known crystalline standard (in our case silicon powder from a single crystal) to determine the calibration constant G for the diffractometer. This calibration constant is then used to calculate the concentration of each crystalline phase in the sample (here in the cement paste) taking into account the scale

Dissertation Daniel Jansen, University Erlangen-Nürnberg, 2011
- 120 -
factor calculated by Rietveld refinement. A detailed evaluation of this method for the quantification of cement pastes is given elsewhere [30].
TABLE 1 STRUCTURES USED FOR RIETVELD REFINEMENT AND MINERALOGICAL COMPOSITION OF
THE OPC WITH AND WITHOUT RESPECT TO THE CEMENT PASTE (W/C=0.5)
Phase ICSD – Code Wt.% Dry Cement
Expected amount in
cement paste w/c=0.5
[wt.%]
Silicon 51688 [31] Standard Standard Alite 94742 [32] 57.7 +/- 1.2 38.5 +/- 1.2
Belite 963 [33] 11.7 +/- 0.6 7.8 +/- 0.6 α`-C2S [34] 8.0 +/- 0.5 5.3 +/- 0.5 C3Acub 1841 [35] 5.6 +/- 0.3 3.7 +/- 0.3 C3Aortho 100220 [36] 4.8 +/- 0.3 3.2 +/- 0.3 C4AF 51265 [37] 1.9 +/- 0.2 1.3 +/- 0.2
Gypsum 27221 [38] 0.8 +/- 0.1 0.5 +/- 0.1 Bassanite 79529 [39] 1.5 +/- 0.1 1 +/- 0.1 Anhydrite 16382 [40] 3.0 +/- 0.2 2 +/- 0.2
Calcite 80869 [41] 2.2 +/- 0.2 1.5 +/- 0.2 Quartz 174 [42] 0.9 +/- 0.1 0.6 +/- 0.1
Arcanite 79777 [43] 0.9 +/- 0.1 0.6 +/- 0.1 Ettringite 155395 [44] - -
Portlandite 34241 [45] - - Amorphous/misfitted - 1.0 +/- 0.5 34 (water+misfitted)
It was shown, using the thermodynamic software GEMS [46, 47] and the thermodynamic data for cement phases [48], that the following equations should be used in order to calculate heat flow diagrams from XRD data [49].

Dissertation Daniel Jansen, University Erlangen-Nürnberg, 2011
- 121 -
C3S + 3.9 H → C1.7SH2.6 + 1.3 CH (Eq. 1)
C3A + 6 H2O → 2 Al(OH)4- + 2.5 OH- + 1.5 Ca2+ + 1.5 CaOH+ (Eq. 2)
3CaSO4 + 1.5 OH- → 1.5Ca2+ + 1.5 Ca(OH)+ + 3SO42- (Eq. 3)
3CaSO4 * 2H2O +1.5 OH- → 1.5Ca2+ + 1.5 Ca(OH)+ + 3SO42- + 6 H2O (Eq. 4)
3 Ca2+ +3 CaOH+ + 2 Al(OH)4- + 3 SO42- + 2.5 OH- + 26 H2O → Ettringite + 1.5 OH- (Eq. 5)
The enthalpies of reaction are shown in table 2.
The calculation of heat flow curves (HF) from XRD data generally follows equation 6 [50].
Equ. 6 HF �� ��. % 9:!;$
��
%��х∆HR
where
/ 01.�% @A2B5
/1 = derivation of the phase content curves
∆HR = enthalpy of reaction

Dissertation Daniel Jansen, University Erlangen-Nürnberg, 2011
- 122 -
TABLE 2: ENTHALPIES OF REACTION OF DISSOLUTION AND PRECIPITATION REACTIONS
Reaction Enthalpy
Equation 1 (Silicate reaction) -561 J/gAlite Equation 2 (Dissolution C3A) -868 J/gC3A
Equation 3 (Dissolution anhydrite) -52 J/gAnhydrite Equation 4 (Dissolution gypsum) 57 J/gGypsum
Equation 5 (Precipitation ettringite) -214 J/gEttringite
The setting time of the cements was determined using a Gillmore needle apparatus (imeter) (MSB Breitwieser, Augsburg, Germany). The cement paste was placed into a special sample holder and measured over the first 24 hours of hydration (30 min intervals). In order to measure the hardness, the sample is automatically lifted against a needle of 212 g and a diameter of 0.692 mm. At each measurement point the time dependent weight reduction of the needle and the corresponding penetration depth is recorded and the hardness of the cement paste (the so-called “imeter-hardness”) is calculated from the relation “strength per penetration depth”, standardised by the diameter of the needle used. The resulting value Hi20 is calculated according to the following equation [51]: Equ. 7 Hi20 = Fmax/(dmax* A) Hi20 = imeter hardness according to method No.20 [Mpa/mm] Fmax = maximum value of the force acting during indentation dFmax = penetration depth of the needle at maximum force A = cross-section area of the needle
For the used measurement system the initial setting time (IST) or final setting time (FST) according to ASTM C266 complies with an imeter value Hi20 (IST/FST) of 3.94 MPa/mm or 63.0 MPa/mm respectively. The setting times of the cement pastes were measured at 23ºC and >60% humidity. Each measurement was performed two times and the average value was calculated.
All experiments were performed at a temperature of 23 °C +/- 0.5 °C.

Dissertation Daniel Jansen, University Erlangen-Nürnberg, 2011
- 123 -
Results
The plot of the heat of hydration, as well as the imeter hardness Hi20 in the same diagram, clearly show that there exists a close agreement between the heat evolution and the hardening of the cement paste. The plot of the heat flow and the increase of the imeter hardness over time also show that the hardening of the cement paste starts immediately after the beginning of the acceleration period. It can be clearly seen that the addition of the superplasticizer leads to a distinct retardation of the cement hydration. This means that the hardening process is correlatively significantly retarded.
FIGURE 1 HEAT FLOW, HEAT OF HYDRATION AND IMETER HARDNESS H I20 OF THE CEMENT USED
DURING HYDRATION WITH AND WITHOUT [30] ADDITION OF SUPERPLASTICIZER
It is known that the acceleration period resulting in the hardening of the cement paste is mainly defined by the silicate reaction. When plotting the determined amounts of the phases alite and portlandite and the imeter hardness it can be seen that there is an obvious connection between the beginning of the dissolution of the phase alite/precipitation of portlandite and the start of the hardening of the cement paste figure 2). Since the superplasticizer clearly retards the dissolution of the phase alite, there can also be detected a distinct retardation of the hardening of the cement paste where the superplasticizer is added.

Dissertation Daniel Jansen, University Erlangen-Nürnberg, 2011
- 124 -
FIGURE 2 ALITE AND PORTLANDITE CONTENT AND IMETER HARDNESS DURING THE HYDRATION OF
THE OPC WITH AND WITHOUT [30] ADDITION OF SUPERPLASTICIZER
Not only the silicate reaction but also the aluminate reaction is significantly retarded where a superplasticizer is added to the cement (figure 3). The aluminate reaction, the reaction of the C3A with sulfate carriers and water forming ettringite, follows a defined pattern. Firstly, there is an immediate dissolution of C3A (here about 2 wt.%) which is traceable when considering the amount of C3A in the dry cement compared with the amount in the first XRD pattern of the cement paste (table1, figure3, see also figure 6). There is no synchronous dissolution of two sulfate carriers detectable. Since no bassanite is detectable in the cement paste we assume that bassanite is dissolved firstly during the mixing of the cement. The anhydrite present in the cement seems to have three different solubilities. Firstly anydrite is dissolved before gypsum is dissolved until 2.5 hours. Secondly anhydrite is dissolved after gypsum is completely dissolved between 6.6 hours and 12.5 hours. While the dissolution of gypsum can be detected there is no dissolution of anhydrite detectable. Thirdly, after 12.5 hours there is a decrease in the reaction rate of the anhydrite dissolution detectable, although anhydrite is the last sulfate carrier available. We can find the same way of reaction of the aluminate reaction in the cement system with superplasticizer added, but significantly retarded.
The two most significant points in time described here (namely, the beginning of the second anhydrite dissolution, and the beginning of further C3A dissolution) occur significantly later in the system where superplasticizer is added (figure 3). The beginning of the anhydrite dissolution occurs at 12.5 hours in comparison to 6.6 hours in the system without addition of superplasticizers. The further dissolution of C3A is delayed for almost 4 hours. Therefore, the sulfate depletion peak, which is caused by the dissolution of C3A and an accelerated

Dissertation Daniel Jansen, University Erlangen-Nürnberg, 2011
- 125 -
ettringite precipitation [30, 50] and which strongly depends on the amount of sulfate carriers available [52, 53], occurs at later points in time where superplasticizer is added.
FIGURE 3 HEAT FLOW AND PHASE CONTENT OF THE PHASES INVOLVED IN THE ALUMINATE REACTION
DURING HYDRATION OF THE OPC USED WITH (RIGHT SIDE) AND WITHOUT [30] (LEFT SIDE)
SUPERPLASTICIZER
Indeed, it is worth mentioning that, after the retardation of the further C3A dissolution, the dissolution of the C3A takes place at a significantly faster rate when superplasticizer is present. This in turn gives rise to the circumstance that the first maximum, occurring during the main period at 7.5 hours in the system without superplasticizer, and the second maximum, called the “sulfate depletion peak”, tend to draw closer together in the system with superplasticizer added, so that it becomes difficult to distinguish the difference between both maxima.
The slowdown of the anhydrite dissolution, resulting in the further dissolution of the C3A, also shows differences in both systems. In both systems – namely, with and without superplasticizer added – there is a significant slowdown of the visible anhydrite dissolution, although the amount of anhydrite remaining tends to differ. Nevertheless, it can be safely assumed that the slowdown of the dissolution of the last sulfate carrier available in combination with an ongoing ettringite precipitation results in a sulfate depletion in the pore solution and a resorption of sulfate ions from surfaces of the cement grains [see also 30]. This in turn allows the further dissolution of the C3A. The further C3A dissolution occurs though there is still a significant amount of crystalline anhydrite present. We assume that there is an amount of anhydrite which is less reactive than the anhydrite which is dissolved quite fast before the further C3A reactions occurs. The worse reactivity of parts of the anhydrite might be caused by either bigger grains or better crystallinity of the anhydrite. The decelerated reaction rate of the anhydrite and the ongoing ettringite precipitation cause the sulfate depletion in the pore solution.

Dissertation Daniel Jansen, University Erlangen-Nürnberg, 2011
- 126 -
Figure 4 shows the heat flow curves as measured as well as the calculated heat flow curves, using the results from in-situ X-ray analysis and the enthalpies of reaction as shown in table 2. Neither the contribution of the gypsum dissolution nor that of the anhydrite dissolution was taken into account, since their contributions are below 0.1 mW. It can be seen that the heat flow as measured can be explained quite well, taking into account the findings from the X-ray experiments performed. It can be shown that the superplasticizer retards both the silicate reaction and the aluminate reaction. After a distinct retardation, both reactions emerge on a faster timeline. Hence, the calculated heat flow curve for cement with superplasticizer added does not show the two significant heat flow maxima during the main period between 2.5 and 20 hours. However, the heat flow curve as actually measured can be resolved into two maxima.
FIGURE 4 MEASURED AND CALCULATED HEAT FLOW CURVES OF THE OPC USED WITH (RIGHT) AND
WITHOUT (LEFT) SUPERPLASTICIZER ADDED
Figure 5, finally, shows the calculated heat flow curves from XRD data as well as the imeter hardness as measured. This figure demonstrates once more that the methods applied to the evaluation of the cement hydration confirm one another.
The retardation of the setting of the cement is caused by the suppression of both the silicate reaction and the aluminate reaction, which in turn leads to a retardation of the hardening of the cement paste.

Dissertation Daniel Jansen, University Erlangen-Nürnberg, 2011
- 127 -
FIGURE 5 CALCULATED HEAT FLOW CURVES AND IMETER HARDNESS DURING THE HYDRATION OF THE
OPC USED WITH AND WITHOUT ADDITION OF SUPERPLASTICIZER
Discussion
It can be shown that the superplasticizer retards both the silicate reaction and the aluminate reaction. The typical process of the aluminate reaction is not altered by addition of the superplasticizer, although all reactions are significantly retarded.
It is generally assumed that there obtains a preferred adsorption of anionic superplasticizers on those cement surfaces displaying opposite charge (C3A, ettringite). This is obviously the requirement for the mode of action of superplasticizers. On the basis of the research performed several mechanisms are thinkable.
The first mechanism which is conceivable is the complexation of Ca2+-ions from pore solution. The withdrawal of the Ca2+ ions from the pore solution by the superplasticizer might lead to a Ca2+ depletion in the pore solution and result in the retardation of both, the silicate reaction and the aluminate reaction. Ca2+ is an ion which is necessary for the precipitation of C-S-H, portlandite as well as ettringite. This hypothesis could, indeed, be confirmed by additional experimental data such as pore solution analysis.
But it is also conceivable that the superplasticizer added to the cement acts in another manner. It is furthermore thinkable that the superplasticizer added acts during the nucleation and growth phase of the hydration process. An adsorption of the superplasticizer on the nuclei of the hydrate phases and as a result the prevention of the growth of the hydrate phases might also be an explanation for the retardation of the hydration process.
Besides that, it is also thinkable that there is an adsorption of the macromolecules on the surfaces of the cement/clinker phases. The prevention of the dissolution of the anhydrous
Dissertation Daniel Jansen, University Erlangen-Nürnberg, 2011
- 128 -
cement phases caused by the adsorption of the polymer is a possible result from this mechanism.
If the adsorption process is responsible for the retardation process of the cement further thoughts need to be given to the fact that both reactions, namely the silicate reaction and the aluminate reaction are retarded. According to other authors there is a preferred adsorption of the superplasticizers on the grain surfaces showing opposite charge [12, 13]. Hence, the fact that both reactions are retarded in the same extent contradicts the findings that polymers show a preferred adsorption, unless the nuclei of all hydrate phases show same charge.
Our assumption is that the complexation of the Ca2+-ions is the most conceivable mechanism responsible for the retardation of the cement hydration.
Concerning the sulfate depletion we want to make the following assumption. In contrast to the system without addition of superplasticizers, there is no precipitation of ettringite detectable in the system with superplasticizer added between 1 and 10 hours. Since ettringite acts as a sulfate sink, a high SO4
2- concentration remains in the pore solution, especially at times after about 5 hours. This prevents the further dissolution of the C3A. Without consumption of sulfate from the pore solution there is no need for the further dissolution of any sulfate carrier.
For the cement used in the present investigation 9 wt.% quantity of ettringite is the critical quantity of ettringite in both systems required in order to reduce the SO4
2- concentration of the pore solution permanently, which in turn permits further C3A dissolution. This critical quantity of 9 wt.% is reached significantly later in the cement paste to which superplasticizer has been added (see figure 6). After the 9 wt.% of ettringite have been precipitated more sulfate is removed from pore solution by ettringite precipitation than sulfate is added by dissolution of any sulfate carrier. This in turn causes the depletion of sulfate in the pore solution and/or desorption of sulfate ions from grain surfaces and the further dissolution of C3A.
Further thought needs to be given to the fact that, in the system to which superplasticizer is added, more ettringite tends to be precipitated immediately after mixing the cement with water, even though the precipitation of ettringite is clearly retarded in the subsequent stages of development.
Finally, the research performed shows that the retardation of cement hydration can be tracked by means of in-situ X-ray diffraction.

Dissertation Daniel Jansen, University Erlangen-Nürnberg, 2011
- 129 -
FIGURE 6 HEAT FLOW CURVES, ETTRINGITE CONTENT AND C3A CONTENT OF THE OPC WITH AND
WITHOUT SUPERPLASTICIZER [30] ADDED

Dissertation Daniel Jansen, University Erlangen-Nürnberg, 2011
- 130 -
[1] R. Bayer, R. Lutz, Dry Mortars, Ullmann`s Encyclopedia of Industrial Chemistry 2009
[2] A. Neville, P.-C. Aitcin, High Performance Concrete- An Overview, Materials and Structures, 31 (1998) 111-117
[3] P.-C. Aitcin, A. Neville, How the Water-Cement ration affects Concrete Strength, Cement International, (2003) 51-58
[4] J. F. Young, A review of the mechanisms of set-retardation in portland cement pastes containing organic admixtures, Cement and Concrete Research, 2 (1972) 415-433
[5] S. Chandra, P. Flodin, Interactions of polymers and organic admixtures on Portland Cement hydration, Cement and Concrete Research, 17 (1987) 875-890
[6] H. Uchikawa, S. Hanehara, D. Sawaki, The role of steric repulsive force in the dispersion of cement particles in fresh paste prepared with organic mixture, Cement and Concrete Research, 27 (1997) 37-50
[7] J. Plank, D. Vlad, A. Brandl, P. Chatziagorastou, Colloidal chemistry examination of the steric effect of polycarboxylate superplasticizers, Cement International, 3 (2005) 100-110
[8] W. Prince, M. Espagne, P.-C. Aitcin, Ettringite formation; A crucial step in cement superplasticizer compatibility, Cement and Concrete Research, 33 (2003) 635-641
[9] S. Erdogdu, Compatibility of superplasticizers with cements different in composition, Cement and Concrete Research, 30 (2000) 767-773
[10] S.K. Agarwal, I. Masood, S.K. Malhotra, Compatibility of superplasticizers with different cements, Construction and Building Materials, 14 (2000) 253-259
[11] M.Y.A. Mollah, W.J. Adams, R. Schennach, D.L. Cocke, A review of cement-superplasticizer interactions and their models, Advances in Cement Research, 12 (2000) 153-161
[12] K. Yoshioka, E. Tazawa, K. Kawai, T. Enohata, Adsorption characteristics of superplasticizers on cement component minerals, Cement and Concrete Research, 32 (2002) 1507-1513
[13] J. Plank, C. Hirsch, Impact of zeta potential of early cement hydration phases on superplasticizer adsorption, Cement and Concrete Research, 37 (2007) 537-542
[14] J. Plank, D. Zhimin, H. Keller, F. Hössle, W. Seidl, Fundamental mechanisms for polycarboxylate intercalation into C3A hydrate phases and the role of sulfate present in cement, Cement and Concrete Research, 40 (2010) 45-57
[15] S. Pourchet, C. Comparet, L. Nicoleau, A. Nonat, Influence of PC superplasticizer on tricalcium silicate hydration, 12th International Congress on the Chemistry of Cement - ICCC 2007., Montreal : Canada (2007)
[16] B. Lothenbach, F. Winnefeld, R. Figi, The influence of superplasticizers on the hydration of Portland cement, 12th International Congress on the Chemistry of Cement - ICCC 2007., Montreal : Canada (2007)

Dissertation Daniel Jansen, University Erlangen-Nürnberg, 2011
- 131 -
[17] J. Plank, M. Gretz, Study on the interaction between anionic and cationic latex particles and Portland cement, Colloids and Surfaces A: Physicochem. Eng. Aspects, 330 (2008) 227-233
[18] J. Plank, P. Chatziagorastou, C. Hirsch, New model describing distribution ofadsorbed superplasticizer on the surface of hydrating cement grain, J. Build.Mater., 10 (2007) 7–13
[19] J.A. Larbi, J. Bijen, Interaction of polymers with Portland cement during hydration- a study of the chemistry of the pore solution of polymer-modified cement systems, Cement and Concrete Research, 20 (1990) 139-147
[20] P.J.Andersen,D.M.Roy,J.M.Gaidis, W.R. Grace, The effects of adsorption of superplasticizers on the surface of cement, Cement and Concrete Research, 17 (1987) 805-813
[21] G. Chiocchio, A.E. Paolini, Optimum time for adding superplasticizer to Portland cement pastes, Cement and Concrete Research, 15 (1985) 901-908
[22] M. Daimon, D.M. Roy, Rheological properties of cement mixes: I. Methods, preliminary experiments, and adsorption studies; Cement and Concrete Research, 8 (1978) 753-764
[23] M. Daimon,D.M. Roy, Rheological properties of cement mixes: II. Zeta potential and preliminary viscosity studies, Cement and Concrete Research, 9 (1979) 103-109
[24] F. Winnefeld, A. Zingg, L. Holzer, R. Figi, J. Pakusch, S. Becker, Interaction of Polycarboxylate-based Superplasticizers and Cements: Influence of Polymer Structure and C3A-content of Cement, Cement and Concrete Composites, 29 (2007) 251-262.
[25] K. Yamada, T. Takahashi, S. Hanehara, M. Matsuhisa, Effects of the chemical structure on the properties of polycarboxylate-type superplasticizers, Cement and Concrete Research, 30 (2000) 197-207
[26] H.M. Rietveld, A profile refinement method for nuclear and magnetic structures, J. Appl. Crystallogr., 2 (1969) 65-71
[27] A.A. Kern, A.A. Coelho, A new fundamental parameters approach in profile analysis of powder data, Powder Diffraction, (1998), 144-151
[28] B.H. O´Connor, M.D. Raven, Application of the Rietveld Refinement Procedure in Assaying Powdered Mixtures, Powder Diffraction, 3 (1988) 2-6
[29] D. Jansen, Ch. Stabler, F. Goetz-Neunhoeffer, S. Dittrich, J. Neubauer, Does Ordinary Portland Cement contain amorphous phase? A quantitative study using an external standard method, Powder Diffraction, 26 (2011), 31-38
[30] D. Jansen, F. Goetz-Neunhoeffer, Ch. Stabler , J. Neubauer, A remastered external standard method applied to the quantification of early OPC hydration, Cement and Concrete Research, 41 (2011) 602-608
[31] D.M. Többens, N. Stuesser, K. Knorr, H.M. Mayer, G. Lampert, The new high-resolution neutron powder diffractometer at the Berlin neutron scattering center, Mater. Sci. Forum, 378-381 (2001) 288-293

Dissertation Daniel Jansen, University Erlangen-Nürnberg, 2011
- 132 -
[32] A.G. De La Torre, S. Bruque, J. Campo, M.A.G. Aranda, The superstructure of C3S from synchrotron and neutron powder diffraction and its role in quantitative phase analysis, Cem. Concr. Res. 32 (2002) 1347-1356
[33] K.H. Jost, B. Ziemer, R. Seydel, Redetermination of the structure of β-dicalcium silicate, Acta Crystallogr., Sect. B: Struct. Crystallogr. Cryst. Chem. 33, (1977) 1696-1700
[34] R. Mueller, Stabilisierung verschiedener Dicalciumsilikat-Modifikationen durch den Einbau von Phosphat: Synthese, Rietveld-analyse, Kalorimetrie, Diplom-thesis (2001) University of Erlangen.
[35] P. Mondal, J. Jeffery, The crystal structure of tricalcium aluminate, Ca3Al2O6, Acta Crystallogr., Sect. B: Struct. Crystallogr. Cryst. Chem., 31 (1975) 689-697
[36] Y. Takéuchi, F. Nishi, Crystal-chemical characterization of the Al2O3-Na2O solid-solution series, Z. Kristallogr., 152 (1980) 259-307
[37] A.C. Jupe, J.K. Cockcroft, P. Barnes, S.L. Colston, G. Sankar, C. Hall, The site occupancy of Mg in the brownmillerite structure and its effect on hydration properties: An X-ray/neutron diffraction and EXAFS study, J. Appl. Crystallogr., 34 (2001) 55-61
[38] B.F. Pedersen, Neutron diffraction refinement of the structure of gypsum, Acta Crystallogr., Sect. B, Struct. Crystallogr. Cryst. Chem., 38 (1982) 1074-1077
[39] H. Weiss, M.F. Bräu, How much water does calcined gypsum contain?, Angew. Chem., Int. Ed., 48 (2009) 3520-3524
[40] A. Kirfel, G. Will, Charge density in anhydrite CaSO4, from X-ray and neutron diffraction measurements, Acta Crystallogr., Sect.B: Struct. Crystallogr. Cryst. Chem., 36 (1980) 2881-2890
[41] E.N. Maslen, V.A. Streltsov, N.R. Streltsova, Electron density and optical anisotropy in rhombohedral carbonates. III. Synchroton X-ray studies of CaCO3, MgCO3 and MnCO3, Acta Crystallogr., Sect. B: Struct. Sci., 51 (1995) 929-939
[42] Y. Le Page, G. Donnay, Refinement of the crystal structure of low-quartz, Acta Crystallogr., Sect.B: Struct. Crystallogr. Cryst. Chem., 32 (1976) 2456-2459
[43] K. Ojima, Y. Hishihata, A. Sawada, Structure of potassium sulfate at temperatures from 296 K down to 15 K, Acta Crystallogr., Sect. B: Struct. Sci. 51 (1995) 287-293
[44] F. Goetz-Neunhoeffer, J. Neubauer, Refined ettringite structure for quantitative X-ray diffraction analysis, Powder Diffraction, 21 (2006) 4-11
[45] W.R. Busing, H.A. Levy, Neutron diffraction study of calcium hydroxide, Acta Crystallogr., Sect. B: Struct. Sci., 42 (1986) 51-55
[46] Kulik, D., GEMS-PSI 3.0 2010, available at http://gems.web.psi.ch/. PSI-Villigen, Switzerland.
[47] Hummel, W., U. Berner, E. Curti, F.J. Pearson and T. Thoenen, Nagra/PSI Chemical Thermodynamic Data Base 01/01. 2002, USA, also published as Nagra Technical Report NTB 02-16, Wettingen, Switzerland. Universal Publishers/uPUBLISH.com. 565.

Dissertation Daniel Jansen, University Erlangen-Nürnberg, 2011
- 133 -
[48] B. Lothenbach, T. Matschei, G. Möschner and F.P. Glasser, Thermodynamic modeling of the effect of temperature on the hydration and porosity of Portland cement, Cement and Concrete Research, 38 (2008) 1-18.
[49] D. Jansen, F. Goetz-Neunhoeffer, B. Lothenbach, J. Neubauer, The early hydration of Ordinary Portland Cement (OPC): An approach comparing measured heat flow with calculated heat flow from QXRD, Cement and Concrete Research, 42 (2012) 134-138
[50] C. Hesse, F. Goetz-Neunhoeffer, J. Neubauer, A new approach in quantitative in-situ XRD of cement pastes: Correlation of heat flow curves with early hydration reactions, Cement and Concrete Research, 41 (2010) 123-128
[51] G. Berger, Ch. Ullner, G. Neumann, H. Marx, New characterization of setting times of alkali containing calcium phosphate cements by using an automatically working device according to gillmore needle test, Key Eng. Mat., 309-311 (2006) 825-828
[52] P. Sandberg, L.R. Roberts, Studies of cement-Admixture Interactions Related to Aluminate Hydration Control by Isothermal Calorimetry, American Concrete Institute, 217 (2003) 529-542
[53] W. Lerch, The influence of gypsum on the hydration and properties of Portland cement pastes, American Society for Testing Materials, 46 (1946) 1252-1297

Dissertation Daniel Jansen, University Erlangen-Nürnberg, 2011
- 134 -
5. CONCLUSION
On the basis of the research performed, the questions posed in chapter 2 can be answered and the following conclusions can be drawn:
i. The Ordinary Portland Cement (OPC) used does not contain amorphous phases such as have been described by several authors for other cements (see also chapter 4.1.). The use of X-ray diffraction for the determination of amorphous contents strongly depends on the quality of the structures used for the Rietveld refinement, and quite especially on the dislocation parameters of the atoms. As can be seen from Figure 1 there was no evidence for amorphous phase in the cement used. The use of wrong values for the dislocation parameters might be one reason which leads to significant amounts of false amorphous content (figure 1, zircon 15759).
FIGURE 1 AMORPHOUS CONTENT OF THE OPC USED AS A FUNCTION OF STRUCTURES AND
ATOMIC DISPLACEMENT PARAMETERS[1]

Dissertation Daniel Jansen, University Erlangen-Nürnberg, 2011
- 135 -
ii. Hydration processes can be quantified successfully by X-ray diffraction (see also
chapter 4.2.). The problem of non-crystalline parts and unknown structures in the cement paste can be overcome by using an external standard method. The G factor method first described by O`Connor (1988), and now applied to the quantification of cement pastes, seems to be the best method available. The method allows the determination of absolute quantities for the phases of interest in mixtures of crystalline and amorphous phases. On the basis of the X-ray experiments performed, the following conclusions concerning the hydration of the OPC used can be drawn (figure 2).
FIGURE 2 CHANGES DETECTED IN THE PHASE COMPOSITION OF THE OPC PASTE,
ASSIGNED TO THE DIFFERENT PERIODS OF OPC HYDRATION[2]

Dissertation Daniel Jansen, University Erlangen-Nürnberg, 2011
- 136 -
iii. The heat flow of the silicate reaction can indeed be calculated from the dissolution
curve of the phase alite as determined by means of X-ray diffraction (see also chapter 4.3.). The concordance between the measured heat flow curves and the calculated heat flow curves is very close in systems of alite and water (Figure 3). The data prove that the dissolution of alite and the precipitation of portlandite and C-S-H-phase occur synchronously. Therefore it can indeed be assumed that it is possible to evaluate the contribution of the silicate reaction to the heat flow of a cementitious system by the determination of the dissolution curve of alite.
FIGURE 3 COMPARISON BETWEEN MEASURED AND CALCULATED HEAT FLOWS OF
SYNTHETIC ALITE AT DIFFERENT TEMPERATURES AND WATER/ALITE-RATIOS (FROM 1.5
H)[3]

Dissertation Daniel Jansen, University Erlangen-Nürnberg, 2011
- 137 -
iv. In contrast to the silicate reaction, the aluminate reaction has to be divided up into
dissolution and precipitation reactions (see also chapter 4.4.). The dissolution of the C3A and the sulfate carriers does not occur synchronously with the precipitation of ettringite. Therefore it is necessary to divide up the contribution made by the aluminate reaction to heat flow into two separate types of contribution: namely, the dissolution of C3A and of sulfate carriers (although the heat released by the dissolution of the sulfate carriers is in fact negligible) and the precipitation of ettringite. On the basis of this knowledge, it is possible to calculate the heat flow during cement hydration using the results from the quantitative X-ray diffraction experiments performed (figure 4). These calculations help us to understand the release of heat of hydration during the reaction of cement with water. Heat flow maxima can be assigned to specific reactions.
FIGURE 4 COMPARISON BETWEEN CALCULATED HEAT FLOW AND MEASURED HEAT FLOW
OF THE OPC USED[4]

Dissertation Daniel Jansen, University Erlangen-Nürnberg, 2011
- 138 -
The calculation of heat flow curves which was initiated by Hesse et al. (2011) could be improved, and is to be recommended especially when illustrating any changes brought about in the hydration kinetics of inorganic binders, such as OPCs, by additives or aggregates. As shown in Figure 5, there is close agreement between the calculated and the measured heat flow curves in all systems examined within the scope of the present work.
FIGURE 5 COMPARISON BETWEEN CALCULATED AND MEASURED HEAT FLOW OF THE OPC
USED WITH AND WITHOUT POLYMER ADDITION
Polymers might have an impact on the hydration of Portland Cements. On the basis of the research performed, it seems most likely that the influence of polymers on hydration behavior is caused by the interaction between the polymers and ions in the pore solution. After evaluation of the analysis data, the following conclusions regarding the influences of the two different polymers on the hydration of the OPC used can be drawn.

Dissertation Daniel Jansen, University Erlangen-Nürnberg, 2011
- 139 -
v. The PDADMA-X influences hydration behavior as a function of the anionic counterion
(see also chapter 4.5.). The fundamental mechanism seems to be an exchange between the counterions on the polymer and different anions from pore solution. Among the effects of the counterion on the polymer there is to be detected either an acceleration of the cement hydration or a deceleration of the hydration (Figures 6a, 6b). The polymers mainly affect the dissolution of the sulfate carriers, which is accelerated where the PADMA-OH is added, and decelerated where PDADMA-SO4 is added. This in turn might indirectly affect the cationic composition of the pore solution, which then goes on to affect the silicate reaction.
FIGURE 6A MODEL FOR THE INFLUENCE OF THE PDADMA(OH) ON THE HYDRATION OF
THE OPC USED IN THE STUDY[5]
0 5 10 150
2
4
6
8
10
mW
/g
time (h)
PDADMAC(OH)
+ + + + + + + +
OH-
SO42-
from pore solution
- faster dissolution of sulfate carriers- faster dissolution of C A3
Ca- ions from sulfate carriers accelerate silicate reaction
without polymer+ 2 wt.-% PDADMAC (OH)
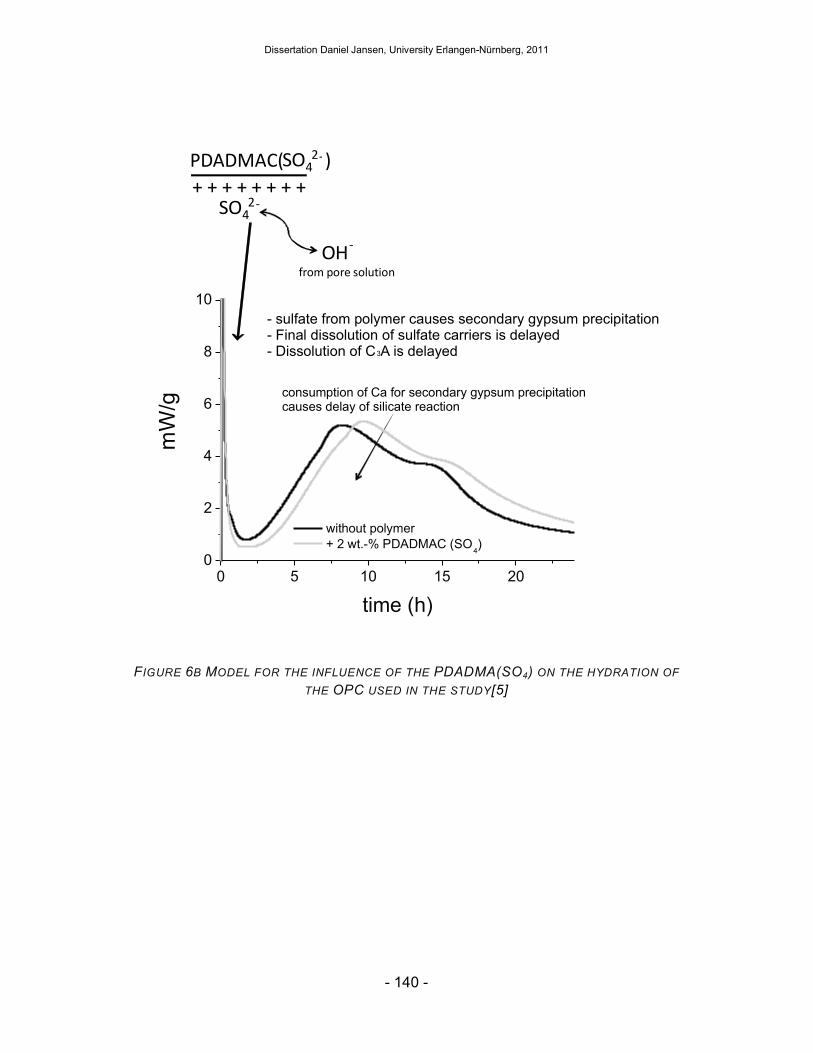
Dissertation Daniel Jansen, University Erlangen-Nürnberg, 2011
- 140 -
FIGURE 6B MODEL FOR THE INFLUENCE OF THE PDADMA(SO4) ON THE HYDRATION OF
THE OPC USED IN THE STUDY[5]
PDADMAC( )
+ + + + + + + +
OH-
SO42-
from pore solution
- sulfate from polymer causes secondary gypsum precipitation- Final dissolution of sulfate carriers is delayed- Dissolution of C A is delayed3
0 5 10 15 200
2
4
6
8
10
without polymer+ 2 wt.-% PDADMAC (SO
4)
time (h)
SO42-
consumption of Ca for secondary gypsum precipitationcauses delay of silicate reaction
mW
/g

Dissertation Daniel Jansen, University Erlangen-Nürnberg, 2011
- 141 -
vi. The polycarboxylate-based superplasticizer does indeed retard the hydration reaction of the cement used (see also chapter 4.6.). It retards both the silicate reaction and the aluminate reaction. It seems most likely that the interaction is caused by the withdrawal of calcium ions from the cement pore solution by the polymer (figure 7). A depletion of Ca2+-ions in the pore solution affects both, the silicate reaction with the precipitation of portlandite and C-S-H-phase and the aluminate reaction with the formation of ettringite.
FIGURE 7 ASSUMED MECHANISM FOR THE INTERACTION BETWEEN THE SUPERPLASTICIZER
USED AND THE HYDRATION OF THE OPC USED [6]

Dissertation Daniel Jansen, University Erlangen-Nürnberg, 2011
- 142 -
The typical heat flow curves recorded by heat flow experiments can be separated into defined reactions (figure 8). This in turn helps us to understand the hydration process of the inorganic binder cement and the change in the reaction kinetics when additives are added.
FIGURE 8 INTERPRETATION OF THE HEAT FLOW CURVES MEASURED WITH AND WITHOUT
ADDITION OF POLYMERS
___measured heat flow
Dissertation Daniel Jansen, University Erlangen-Nürnberg, 2011
- 143 -
The heat flow curves of all the systems measured are dominated by the contribution of the silicate reaction and the contributions of the dissolution of the phase C3A and the precipitation of ettringite. It is possible to change the temporal sequence of the reactions completely by the addition of any polymer.
[1] D. Jansen, Ch. Stabler, F. Goetz-Neunhoeffer, S. Dittrich, J. Neubauer, Does Ordinary Portland Cement contain amorphous phase? A quantitative study using an external standard method, Powder Diffraction, 26 (2011) 31-38
[2] D. Jansen, F. Goetz-Neunhoeffer, Ch. Stabler , J. Neubauer, A remastered external standard method applied to the quantification of early OPC hydration, Cement and Concrete Research, 41 (2011) 602-608
[3] D. Jansen, S.T. Bergold, F. Goetz-Neunhoeffer, J. Neubauer, The hydration of alite: A time-resolved diffraction approach using the G-factor method compared with heat release, Journal of Applied Crystallography, 44 (2011) 895-901
[4] D. Jansen, F. Goetz-Neunhoeffer, B. Lothenbach, J. Neubauer, The early hydration of Ordinary Portland Cement (OPC): An approach comparing measured heat flow with calculated heat flow from QXRD, Cement and Concrete Research, 42 (2012) 134-138
[5] D. Jansen, F. Goetz-Neunhoeffer, J. Neubauer, R. Haerzschel, W.-D. Hergeth, Effect of Polymers on Cement Hydration: A Case Study Using Substituted PDADMA, Cement and Concrete Composites, submitted
[6] D. Jansen, F. Goetz-Neunhoeffer, J. Neubauer, R. Haerzschel, W.-D. Hergeth, Change in reaction kinetics of a Portland Cement caused by a superplasticizer – Calculation of heat flow curves from XRD data, Cement and Concrete Research, Published in: Cement and
Concrete Research, doi:10.1016/j.cemconres.2011.10.005

Dissertation Daniel Jansen, University Erlangen-Nürnberg, 2011
- 144 -
ACKNOWLEDGEMENT
Herzlicher Dank gebührt Frau Prof. Dr. F. Götz-Neunhoeffer für die Möglichkeit, zu diesem Thema eine Promotion zu verfassen. Weiterhin möchte ich mich herzlich für das mir geschenkte Vertrauen und die tatkräftige Unterstützung während der letzten Jahre bedanken.
Ebenso gilt Herrn Prof. Dr. J. Neubauer mein voller Dank für die Förderung, die Unterstützung und die Hilfe während der Arbeit in Erlangen.
Herrn Prof. Dr. M. Göbbels möchte ich auch sehr herzlich für die Unterstützung, die vielen Hilfestellungen und die Motivation während der Zeit an der Universität danken.
Den Herren Dr. W.-D. Hergeth und Dr. R. Härzschel von der Wacker Chemie AG möchte ich ich ebenso danken, sowohl für die finanzielle Unterstützung im Projekt, als auch für die hilfreichen Diskussionen und außerdem für die tolle Gastfreundschaft in Burghausen.
Meinem jahrelangen Weggefährten Dr. Sebastian Seufert möchte ich herzlich für die guten Jahre und die hilfreichen Diskussionen sowie die Unterstützung danken.
Allen weiteren Mitautoren der Publikationen, Christopher Stabler, Sebastian Bergold, Sebastian Dittrich und Dr. Barbara Lothenbach möchte ich von Herzen für die tolle Zusammenarbeit und die gewinnbringenden Diskussionen danken. Sie alle haben entscheidende Impulse für das Gelingen der Arbeit beigetragen.
Meinen studentischen Mitarbeitern im Projekt, Markus Bernhardt, Sebastian Scherb, Natalia Illenseer und Sebastian Klaus möchte ich herzlich für die zuverlässige Arbeit und die Unterstützung danken.
Den Herren Dr. Ch. Hesse und Dr. S. Seifert möchte ich auch herzlich für die fachlich hervorragenden Diskussionen während der gemeinsamen Zeit in der Arbeitsgruppe danken.
Herrn Bernd Schleifer gilt außerdem besonderer Dank für die Unterstützung. Viele gute Gedanken wurden erst Dank seiner tatkräftigen Arbeit in die Realität umgesetzt.
Kerstin Kress und Ingrid Nicholson möchte ich für die Unterstützung im Labor sowie für die gute Zusammenarbeit danken.
Zuletzt gilt mein großer Dank noch meiner Familie und meiner Freundin Hannah, welche mich immer tatkräftig unterstützt haben und mir immer ein starker Rückhalt sind.