THE HUMAN RIGHTS IMPACT OF FISCAL AND TAX POLICY … · de una deuda pública de 610,820 millones...
29
1 THE HUMAN RIGHTS IMPACT OF FISCAL AND TAX POLICY RESPONSES TO QUESTIONNAIRE FROM SPECIAL RAPPORTEUR ON EXTREME POVERTY The following responses to the Special Rapporteur’s questionnaire on the human rights impact of fiscal and tax policy were compiled by the International Budget Partnership (IBP), and include country-specific contributions by the following partner organizations and individuals: Brazil: Inesc - Instituto de Estudos Socioeconômicos. Contact person: Nathalie Beghin, [email protected] India: Centre for Budget and Governance Accountability (CGBA India) and Ravi Duggal, IBP. Contact person, Ravi Duggal, [email protected] Mexico: Fundar, Centro de Análisis e Investigación. Contact person: Diego de la Mora, [email protected] South Africa: Public Service Accountability Monitor (PSAM). Contact person: Jay Kruuse, [email protected] Questions about specific country responses should be directed to the contact persons indicated. Questions about the submission overall or about General Comments should be directed to IBP—Helena Hofbauer ([email protected]) or Ann Blyberg ([email protected]). TAXATION 1. Is your government’s tax policy compatible with the obligation to use maximum available resources to realize economic and social rights? If not, why? Do obstacles of a national or international nature impinge on your government’s ability to mobilize the maximum available resources through taxation? General comments The obligation to use the maximum of available resources needs to be considered in conjunction with the obligations of progressive realization and non-discrimination. A government can maximize its current resources, for example, by borrowing to increase spending on social programs. However, the size or terms of the debt may be such that repayment will draw significantly from future budgets, resulting in a decrease in future funding for the same social programs, thereby potentially resulting in retrogression. Similarly, different types of revenue affect different groups differently. The value-added tax is administratively a relatively easy one for a government to collect, which would argue for greater reliance on this tax, particularly in countries where civil servants’ capacities are limited. However, poorer families and individuals typically pay proportionately more of their income in VAT than they would in income tax, so increasing revenue through upping the rate on VAT could have a discriminatory effect. When assessing the human rights impact of tax policy, it is important to consider what is happening on the expenditure side. A government may increase taxes that hit the poor harder, but if the government at the same time increases funding to programs (or creates new
Transcript of THE HUMAN RIGHTS IMPACT OF FISCAL AND TAX POLICY … · de una deuda pública de 610,820 millones...
1
THE HUMAN RIGHTS IMPACT OF FISCAL AND TAX POLICY
RESPONSES TO QUESTIONNAIRE FROM SPECIAL RAPPORTEUR ON EXTREME POVERTY
The following responses to the Special Rapporteur’s questionnaire on the human rights impact of fiscal
and tax policy were compiled by the International Budget Partnership (IBP), and include country-specific
contributions by the following partner organizations and individuals:
Brazil: Inesc - Instituto de Estudos Socioeconômicos. Contact person: Nathalie Beghin,
India: Centre for Budget and Governance Accountability (CGBA India) and Ravi Duggal, IBP. Contact
person, Ravi Duggal, [email protected]
Mexico: Fundar, Centro de Análisis e Investigación. Contact person: Diego de la Mora,
South Africa: Public Service Accountability Monitor (PSAM). Contact person: Jay Kruuse,
Questions about specific country responses should be directed to the contact persons indicated.
Questions about the submission overall or about General Comments should be directed to IBP—Helena
Hofbauer ([email protected]) or Ann Blyberg ([email protected]).
TAXATION
1. Is your government’s tax policy compatible with the obligation to use maximum available
resources to realize economic and social rights? If not, why? Do obstacles of a national or
international nature impinge on your government’s ability to mobilize the maximum available
resources through taxation?
General comments
The obligation to use the maximum of available resources needs to be considered in conjunction
with the obligations of progressive realization and non-discrimination. A government can
maximize its current resources, for example, by borrowing to increase spending on social
programs. However, the size or terms of the debt may be such that repayment will draw
significantly from future budgets, resulting in a decrease in future funding for the same social
programs, thereby potentially resulting in retrogression. Similarly, different types of revenue
affect different groups differently. The value-added tax is administratively a relatively easy one
for a government to collect, which would argue for greater reliance on this tax, particularly in
countries where civil servants’ capacities are limited. However, poorer families and individuals
typically pay proportionately more of their income in VAT than they would in income tax, so
increasing revenue through upping the rate on VAT could have a discriminatory effect.
When assessing the human rights impact of tax policy, it is important to consider what is
happening on the expenditure side. A government may increase taxes that hit the poor harder,
but if the government at the same time increases funding to programs (or creates new

2
programs) designed to assist the same people (and is effective in doing so), so that the net
effect of the increased taxes is neutral or even enhanced well-being for the poor, then the
negative impact of the tax would likely not entail a failure of non-discrimination.
Some macroeconomic policies, such as capping public expenditures or eliminating tariffs on
imports in order to enhance trade, may inhibit a government’s capacity or willingness to
maximize revenue through taxation. In such a situation, a government should be asked to
justify in human rights terms the adoption of such policies by questions such as: In what
concrete ways does capping public expenditures (and relying on private investment to spur
growth) lead to greater realization of human rights? A simple assurance from the government
that such an approach will lead to greater rights enjoyment is inadequate. The government
should, for example, be able to point to a solid benefit incidence analysis to support its claim,
and should monitor the impact of its policies over the medium- and long-term.
Response from Brazil
No. The tax system in Brazil is regressive. Poor people pay, on average, almost twice the
proportion that rich people pay. The responsibility to change the system is national, needing an
urgent tax reform.
Response from India
In India the financial sector, which is a very large proportion of the economy, is the least
taxed. For instance, the speculative turnover of stock in commodity markets and
currency markets daily is over $50 billion. A financial transaction tax would substantially
raise the tax: GDP ratio and generate huge resources for social sector budgets.
Tax expenditures to corporates in India are huge. In fiscal year 2012-13, tax
expenditures (called “revenue forgone” in the Indian budget) was as much as 70% of
total tax revenues collected. These are huge subsidies which largely benefit the rich.
Response from Mexico
Uno de los principales retos que enfrenta el gobierno mexicano para poder cumplir con la
garantía de todos los derechos humanos para toda la población es la baja tasa de recaudación
del régimen fiscal, problema estructural de la economía y sistema político mexicanos desde hace
poco más de tres décadas.
Este hecho está relacionado con el segundo gran reto de las finanzas públicas del país, que es su
alta dependencia de los ingresos generados por la explotación petrolera. Dado que el petróleo
es un recurso no renovable, el hecho de que financie el 32% del presupuesto público supone
riesgos para la garantía de los derechos humanos en el mediano y largo plazos. Esto se debe a
que inevitablemente la disponibilidad de este bien irá disminuyendo hasta llegar a su eventual
agotamiento, lo que consecuentemente implicará menos recursos para el financiamiento del
3
Estado, incluyendo aquellos dirigidos a la realización de los derechos humanos.1 Además, el
precio de este bien—fijado a nivel internacional—es sumamente volátil, lo que puede poner en
peligro el gasto público en épocas de crisis, cuando el precio cae por debajo del estimado en la
Ley de Ingresos de la Federación, como ocurrió en 2009.2 Pese a estos riesgos, el gobierno no
está implementando las medidas necesarias para “despetrolizar” las finanzas públicas—la
Reforma Hacendaria no incluyó acciones en este sentido—ni para contar con un mecanismo de
ahorro efectivo—el Fondo de Estabilización de los Ingresos Petroleros creado para este fin, no
cuenta con recursos suficientes para hacer frente a una caída del precio internacional del
petróleo.
Además, una de las principales explicaciones sobre por qué México no logra desplegar su
potencial y alcanzar la garantía plena de derechos humanos para toda su población, se
encuentra en una gestión macroeconómica que ha privilegiado la estabilidad sobre el
crecimiento equitativo. Autores como Gerardo Esquivel han señalado cómo la persecución de la
estabilidad económica ha jugado en contra del crecimiento sostenido:
(…) la política económica en México se maneja, prácticamente, con un ‘piloto automático’
que depende de factores exógenos, concretamente la economía norteamericana y que, por
otra parte, tiene un carácter de tipo procíclico en materia de política fiscal o que puede
exacerbar los efectos negativos de choques exógenos mediante las decisiones de política
monetaria.3
Aunque este manejo inercial de la política macroeconómica ha dado un giro con la aprobación
de una deuda pública de 610,820 millones de pesos, lo que significa un déficit de 0.4% para lo
que resta del 2013, y de 1.5% para el 2014, con el argumento de las autoridades de la Secretaría
de Hacienda y Crédito Público de que la economía mexicana se encuentra en un periodo de
desaceleración y por tanto es necesario aumentar el gasto público para reactivar el ciclo
económico (Ley de Ingresos 2014, art. 1º).
1 Fundar (2013). Ingresos Petroleros del Sector Público Presupuestario. Disponible en
http://www.fundar.org.mx/ingresospetroleros/2abase/ipdelsectorpublico.htm 2 En 2009, debido a la caída del precio del petróleo el erario público dejó de recibir 187,417.4 millones de pesos. Fundar
(2013). Ingresos Excedentes de acuerdo a la LFPRH. Disponible en
http://www.fundar.org.mx/ingresospetroleros/ingresos_excendentes2009.htm 3 Gerardo Esquivel. (2010). De la inestabilidad macroeconómica al estancamiento estabilizador: el papel del diseño y la
conducción de la política económica. En: Nora Lusting. Los grandes problemas de México. Vol. IX, Crecimiento Económico y
Equidad. El Colegio de México

4
2. In general, would you say that the tax regime is regressive or progressive? Why? Please provide
examples (for instance: proportions of wealth, income, and consumption taxes in total revenue;
distributional impacts of tax schemes between and within households, including deduction and
exemptions for women, people living in poverty, single household heads, or based on marital
status). What are the shares of tax revenue paid by different groups and the rate of taxation on
different social groups?
General comments
See comments on question 1.
Response from Brazil
As stressed before, the system is regressive, mostly because of indirect taxation which accounts
for almost half of the tax burden. As a consequence, poor people pay much more, as a
proportion of their income, than rich people.
Inesc has produced some research in this field, but it is in Portuguese. A recent publication in
English from the International Policy Center for Inclusive Growth details the unfairness of
Brazilian tax system (http://www.ipc-undp.org/pub/IPCWorkingPaper115.pdf)
Response from India
The tax regime in India is regressive with direct tax share in total taxes being only 37.7%. Even
developing countries like South Africa (57.5 %), Indonesia (55.85 %) and Russia (41.3 %) have a
more progressive tax ‘structure’, in terms of the contribution of Direct Taxes to total tax
revenue.
Property Taxes contributed, on an average, around 15.1 % (USA), 5.8 % (South Africa), 5.1 %
(China), 4.87 % (Russia) and 4.25 % (Brazil) to total taxes over the period 2000 to 2007-08.
However, for India, the contribution has stagnated at around 0.44 % for years.
Property Taxes to GDP ratio: Argentina (2.9 %), China (1.7 %), South Africa (1.4 %), Brazil (1.3 %),
Russia (1.2 %), and Indonesia (0.57 %) are performing much better than India whose Property
Tax to GDP ratio of 0.48 % (as of 2009-10) is one of the lowest amongst G20 countries.
Wealth Taxes in India contribute only around 0.007 % of GDP in India (in 2009-10). Estate Duty
(Inheritance Tax) was suspended in India in 1985 and Gift tax collections are far too minimal.
Wealth inequality in India seems to have increased manifold since the reforms of 1990-91.
While the Planning Commission estimates that top 5 % of households possess 38 % total assets,
as per the Forbes List the combined net worth of 55 dollar billionaires of India stood at US $ 240
billion (Rs. 13,92,000 crore) in 2011.4
4 These observations are based on the Oxfam India- CBGA publication , Property Taxes Across G20 Countries: Can India Get
it Right? by Prashant Prakash: http://www.cbgaindia.org/files/recent_publications/Property%20Tax%20paper.pdf
5
Response from Mexico
La política fiscal mexicana no contribuye, como en otros países, a reducir la desigualdad. En
México, el índice de Gini prácticamente no se modifica antes y después de la recaudación fiscal.5
Lo anterior indica que la intervención estatal, por medio de la política hacendaria, no contribuye
a redistribuir la riqueza generada en el país, que actualmente se concentra en los deciles más
beneficiados por el acomodo macroeconómico, y no fluye hacia quienes se han visto más
perjudicados por el mismo; a diferencia de otros Estados de la Organización para la Cooperación
y el Desarrollo Económico (OCDE), las condiciones de desigualdad social en México permanecen
estables tras la intervención del Estado.6 Los impuestos no se cobran bajo los principios de
equidad y proporcionalidad a los que se refiere la fracción IV, del artículo 31 de la Constitución,
y el gasto público no puede garantizar que se realicen los derechos sociales consagrados en el
texto constitucional.
La distribución inequitativa de los impuestos y del gasto público hace que una parte de las y los
mexicanos viven en condiciones materiales similares a las de las y los ciudadanos de los países
más ricos del mundo. Algunos, inclusive figuran entre las personas más acaudaladas del planeta.
No obstante, esta situación de privilegio es para una minoría y coexiste con una realidad de
pobreza endémica en la cual se encuentran 53.3 millones de personas, mismas que no pueden
gozar de los derechos que les garantiza la Constitución.7 Algunos datos sobre la distribución de
la riqueza y el gasto público que ilustran la desigualdad en México son los siguientes:
- La acumulación de riqueza para el 1% más rico es de 39.33%. Por el contrario, el 10% más
pobre concentra apenas cerca del 0.67% de los ingresos. Esta diferencia es de 60 a 1.8
- Mientras que los deciles de ingreso IX y X obtienen 31.6% del gasto público destinado a
desarrollo humano, los deciles I y II reciben apenas 13.1% de dicho gasto.9
3. What is the tax/GDP ratio of your country? Would you say that the tax regime allows the State to:
a) raise adequate resources to ensure the realization of human rights, including sustainable
financing of social protection systems; b) mitigate poverty and inequalities; and c) ensure that
rights of disadvantaged and marginalized individuals and groups are not disproportionately
affected? Please explain. If the answer was negative, why are different rates or other types of
taxes not in place?
5 En los países de la OCDE, el índice de Gini disminuye 0.12 puntos en promedio después de impuestos y transferencias. Sin
embargo, en México la política fiscal apenas reduce este indicador pasa de 0.47 a 0.45, es decir, desciende tan solo 0.02
puntos (SHCP, Criterios Generales de Política Económica 2014). 6
Organización para la Cooperación y el Desarrollo Económico (OCDE). (2011). Disminución del índice GINI en México
después de la transferencia de impuestos. Disponible en línea (noviembre de 2013): http://is.gd/1mkuYG 7
Consejo Nacional de Evaluación de la Política de Desarrollo Social (Coneval). (2013). Medición de la pobreza en México y
en las Entidades Federativas 2012. 8 Centro de Investigaciones Económicas y Presupuestarias (CIEP). (2013), La distribución del ingreso en México según la
ENIGH 2012. 9
Programa de Naciones Unidas para el Desarrollo (PNUD). (2011). Informe sobre el Desarrollo Humano, México, p. 66.

6
General comments
Its budget is the most important tool that a government has to re-distribute wealth among the
people. When tax policies offer significant exemptions to industries and foreign investors in
order to attract capital and promote economic growth, the implicit choice it is making is to
undermine or diminish its own redistributive capacity. Poor communities might benefit from job
creation, but lose out on social protection, basic infrastructure, health services and access to
education, because the state cannot raise enough resources.
In order to assess whether a government is mobilizing the maximum of available resources,
some would argue that it is important to look not only at the tax: GDP ratio in a country, but also
at “tax effort.” The tax: GDP ratio in a country may be within the averages expected for the
particular type of country (developing, middle income, industrialized, etc.). However, that, in
itself, is an inadequate measure. It is important to assess what a government could bring in,
with greater effort, either in terms of additional forms of revenue or more effective tax
collection. See World Bank study available at:
http://econ.worldbank.org/external/default/main?pagePK=64165259&theSitePK=475520&piPK
=64165421&menuPK=64166093&entityID=000158349_20121025084902
Under-collection of revenue is a big problem in many countries. There are a number of reasons
for this, including, importantly, lack of capacity within government to monitor and enforce
complex tax regimes. A number of countries (e.g., South Africa, Cameroon) have demonstrated
that with adequate political will to address capacity and technical problems and to ensure
monitoring of compliance with tax codes, large gains in revenue can be made. These added
revenues are essential for ensuring that the rights of all and particularly those of disadvantaged
and marginalized individuals and groups are fulfilled.
Response from Brazil
Brazil’s tax: GDP ratio is around 35%. Despite having a regressive tax system, the country was
able in the last decade to tackle poverty and reduce inequalities. Studies show that an increase
in the tax burden was followed by a decrease in poverty rates and Gini Index. Nevertheless,
inequalities are still very high (between poor and rich, between black people and white people,
between women and man). That is why: (1) it is necessary to increase the tax: GDP ratio, but (2)
also to implement tax reform. Otherwise poor people will still be paying more taxes and the
inequalities will remain.
Response from India
With a total tax: GDP ratio of 15.5 % (as of 2009-10), India has one of the lowest tax
bases among G20 countries (beating only Mexico and Indonesia). In addition to BRICS
countries like Brazil (25.4 %), Russia (22.9 %), China (18.9 %) and South Africa (26.5 %);
other developing countries like Argentina (24.7 %) and Turkey (21.1 %) also perform
better than India. Needless to add that all developed G20 countries perform much
better with tax: GDP ratio figures as high as 28.7 % of (for Italy).
7
In the Budget Speech (2013-14) India’s Finance Minister, Mr. P. Chidambaram, himself
admitted that these tax ratios are inadequate for inclusive and sustainable
development.
“In 2011-12, the tax GDP ratio was 5.5 percent for direct taxes and 4.4 percent for
indirect taxes. These ratios are one of the lowest for any large developing country
and will not garner adequate resources for inclusive and sustainable development.”10
Budget Speech of P. Chidambaram, Minister of Finance, 2013-14
More than half of the work force is self-employed, running small businesses. The mechanisms
for collecting taxes from such persons/businesses are very weak, with the result that huge
revenues remain uncollected.
Response from Mexico
México presenta una de las tasas más bajas de recaudación de América Latina y de los países
integrantes de la Organización para la Cooperación y el Desarrollo Económico (OCDE). En 2010
presentó una recaudación de 18.8 puntos porcentuales de su producto interno bruto (PIB),11 la
tasa más baja entre todos los integrantes de la OCDE y la quinta más baja de América Latina. Sin
embargo, si descontamos los ingresos provenientes de la explotación de hidrocarburos por
parte de la paraestatal Petróleos Mexicanos (Pemex), la recaudación mexicana desciende a un
14.1% del PIB para 2010,12 quedando como la cuarta más baja de América Latina. Es importante
subrayar este hecho: desde principios de la década de 1980, el sistema fiscal mexicano ha
generado una gran dependencia con respecto a los ingresos petroleros. A los mismos no se les
ha considerado como lo que son: recursos extraordinarios provenientes de una fuente finita,
cuya explotación merma paulatina y constantemente la riqueza de futuras generaciones de
mexicanos. Estos recursos representan más de la tercera parte de los ingresos del gobierno
federal.
Además, en el caso de los ingresos petroleros excedentes, es decir, de aquellos que se producen
cuando el precio real del petróleo se sitúa por encima del precio estimado en el Ley de Ingresos,
se utilizan de manera poco transparente y discrecional, lo que ha supuesto que la mayor parte
de los mismos se haya utilizado para financiar, no proyectos de desarrollo con visión a mediano
y largo plazos—el uso más razonable que se le puede dar a los ingresos extraordinarios—, sino
el gasto corriente del Estado mexicano que debería ser cubierto por una recaudación fiscal
10
These ratios are for Gross Central Taxes only. The combined ratios for Central and State Taxes is 5.99% for direct tax and 10.65% for indirect taxes (2011-12)
11 OECD Stats. Disponible en línea (noviembre de 2014): http://stats.oecd.org
12 Calculo propio con base en cifras sobre cuentas públicas del Banco de Información Económica del Instituto Nacional de
Estadística y Geografía (http://www.inegi.org.mx/sistemas/bie/) y los Anexos Financieros del Informe sobre la situación económica, las finanzas públicas y la deuda pública para el cuarto trimestre de 2010 de la Secretaría de Hacienda y Crédito Público (disponible en: http://is.gd/J5Qq86).
8
sana.13 Así, por poner sólo un ejemplo, en 2012 el 67.8% de los excedentes fue destinado a este
tipo de gasto en detrimento del gasto de inversión.14
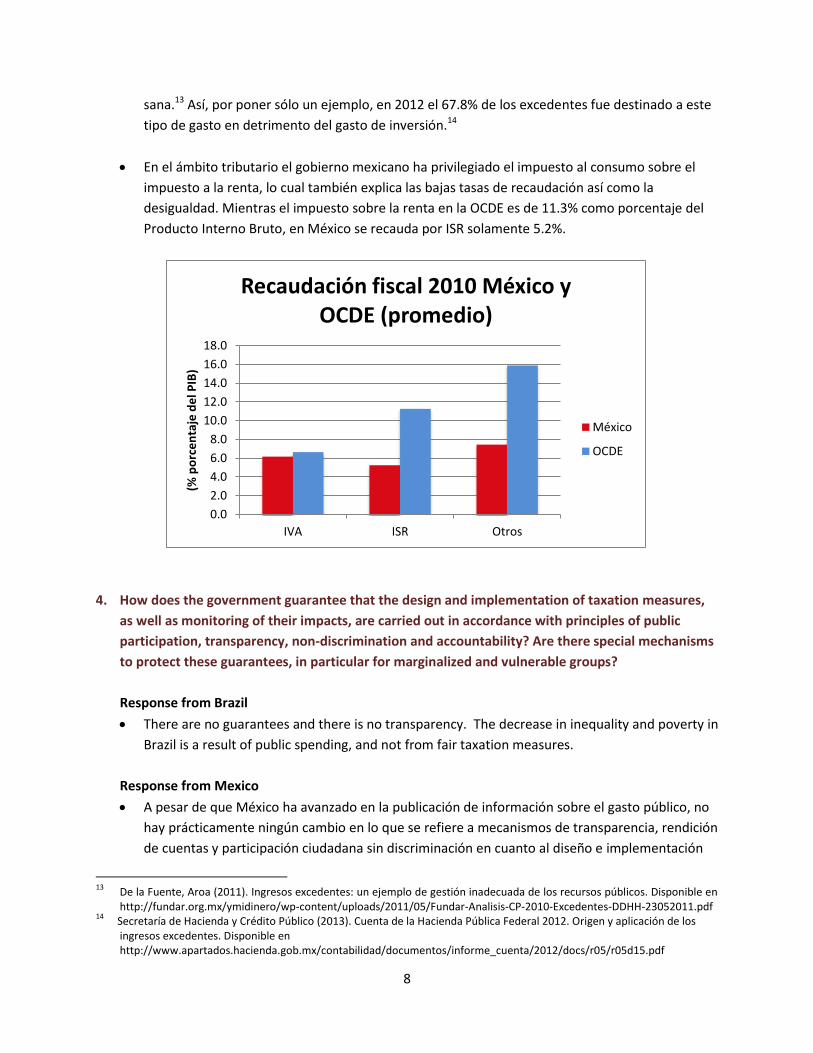
En el ámbito tributario el gobierno mexicano ha privilegiado el impuesto al consumo sobre el
impuesto a la renta, lo cual también explica las bajas tasas de recaudación así como la
desigualdad. Mientras el impuesto sobre la renta en la OCDE es de 11.3% como porcentaje del
Producto Interno Bruto, en México se recauda por ISR solamente 5.2%.
4. How does the government guarantee that the design and implementation of taxation measures,
as well as monitoring of their impacts, are carried out in accordance with principles of public
participation, transparency, non-discrimination and accountability? Are there special mechanisms
to protect these guarantees, in particular for marginalized and vulnerable groups?
Response from Brazil
There are no guarantees and there is no transparency. The decrease in inequality and poverty in
Brazil is a result of public spending, and not from fair taxation measures.
Response from Mexico
A pesar de que México ha avanzado en la publicación de información sobre el gasto público, no
hay prácticamente ningún cambio en lo que se refiere a mecanismos de transparencia, rendición
de cuentas y participación ciudadana sin discriminación en cuanto al diseño e implementación
13
De la Fuente, Aroa (2011). Ingresos excedentes: un ejemplo de gestión inadecuada de los recursos públicos. Disponible en http://fundar.org.mx/ymidinero/wp-content/uploads/2011/05/Fundar-Analisis-CP-2010-Excedentes-DDHH-23052011.pdf
14 Secretaría de Hacienda y Crédito Público (2013). Cuenta de la Hacienda Pública Federal 2012. Origen y aplicación de los
ingresos excedentes. Disponible en http://www.apartados.hacienda.gob.mx/contabilidad/documentos/informe_cuenta/2012/docs/r05/r05d15.pdf
0.0
2.0
4.0
6.0
8.0
10.0
12.0
14.0
16.0
18.0
IVA ISR Otros
(% p
orc
en
taje
de
l PIB
)
Recaudación fiscal 2010 México y OCDE (promedio)
México
OCDE
9
de medidas tributarias ni sus impactos. De hecho, hasta la reforma hacendaria aprobada en
octubre de 2013, el artículo 69 del Código Fiscal de la Federación preveía la posibilidad de
reservar de manera absoluta la información fiscal en poder del Estado mexicano. La reforma
exceptúa de la reserva prevista en el artículo 69 cuando los contribuyentes:
i) tengan a su cargo créditos firme
ii) tengan a su cargo créditos determinados exigibles que no se encuentren pagados o
garantizados,
iii) se encuentren como no localizados, o,
iv) que exista sentencia condenatoria firme por la comisión de un delito fiscal.
Ingresos petroleros excedentes y la garantía de los derechos humanos
La inadecuada gestión de los recursos excedentes procedentes de la explotación del petróleo
supone riesgos para el cumplimiento de diferentes principios que las finanzas públicas deben
contemplar para la garantía de los derechos humanos.
- Máximo uso de recursos disponibles. El hecho de que la mayor parte de los recursos
excedentes sea destinado a un aumento del gasto corriente—67.8% en 2012—podría
suponer una violación a este principio. Más cuando sabemos que el rubro al que más
recursos recibe es Servicios Generales—en el año 2012 el gobierno le asignó el 42% del
gasto corriente—,15 es decir, a contrataciones con personas físicas y morales de los
sectores privado y social, a servicios de consultorías y a gastos de servidores públicos por
servicios oficiales y especiales, entre otros. Lo que, en épocas de bonanza petrolera, suele
suponer la contratación de nuevo personal y el pago de primas y sobresueldos adicionales,
sobre todo a los servidores públicos de mandos medios y superiores.
- Realización progresiva de los derechos y no retroceso. Debido a la volatilidad en el precio del
petróleo, éste puede variar dramáticamente de un año a otro y sin previo aviso. Ello supone
que si bien hay años en que existen ingresos excedentes, hay otros en el que el presupuesto
se puede ver disminuido, lo que tiene impactos en el gasto público. Un ejemplo claro de ello
es lo ocurrido en 2009, cuando a raíz de la crisis financiera de ese año el erario dejó de
ingresar 187,417.4 millones de pesos en concepto de derechos a los hidrocarburos.16 Este
último hecho puede suponer la necesidad de recortar el gasto previsto para un año dado—
en 2009 el presupuesto ejercido en asistencia social se redujo en 56.7% en comparación a
2008—, lo cual puede implicar retrocesos en la garantía de los derechos humanos, al
suponer que el Estado no cuente con recursos suficientes para implementar las acciones
necesarias para este fin. Con un Fondo de Estabilización de los Ingresos Petroleros sin
recursos suficientes para compensar una caída en el precio del petróleo—al primer
semestre de 2013 contaba con 27,291 millones de pesos—. cabe preguntarse cómo el
Estado podría mantener los niveles de gasto en los que se embarca en épocas de bonanza
del precio del petróleo y cuáles son sus implicaciones en cuanto la realización progresiva y
no retroceso en los derechos.
15
Óp. Cit. Secretaria de Hacienda y Crédito Público. 16
Óp. Cit. Fundar.

10
- Transparencia y rendición de cuentas. Existe muy poca información sobre el destino y uso de
los ingresos excedentes. La información que se publica es demasiado general y no permite
conocer cuáles son las acciones concretas que se implementan con estos recursos ni, por
consiguiente, los impactos de los mismos en el cumplimiento de los derechos humanos.
Tampoco hay manera de conocer cuáles son los criterios que el Ejecutivo utiliza para asignar
estos recursos y qué papel juegan los derechos en la toma de decisiones.
- Participación ciudadana. La falta de transparencia y rendición de cuentas son obstáculos
para la participación de la ciudadanía tanto en la evaluación del uso de los excedentes y su
impacto en los derechos humanos, como en la toma de decisiones sobre su uso. Esto puede
tener un impacto en la adecuación de las acciones implementadas al cumplimiento de los
derechos de la población, ya que impide que ésta plantee sus necesidades y prioridades.17
Migrantes
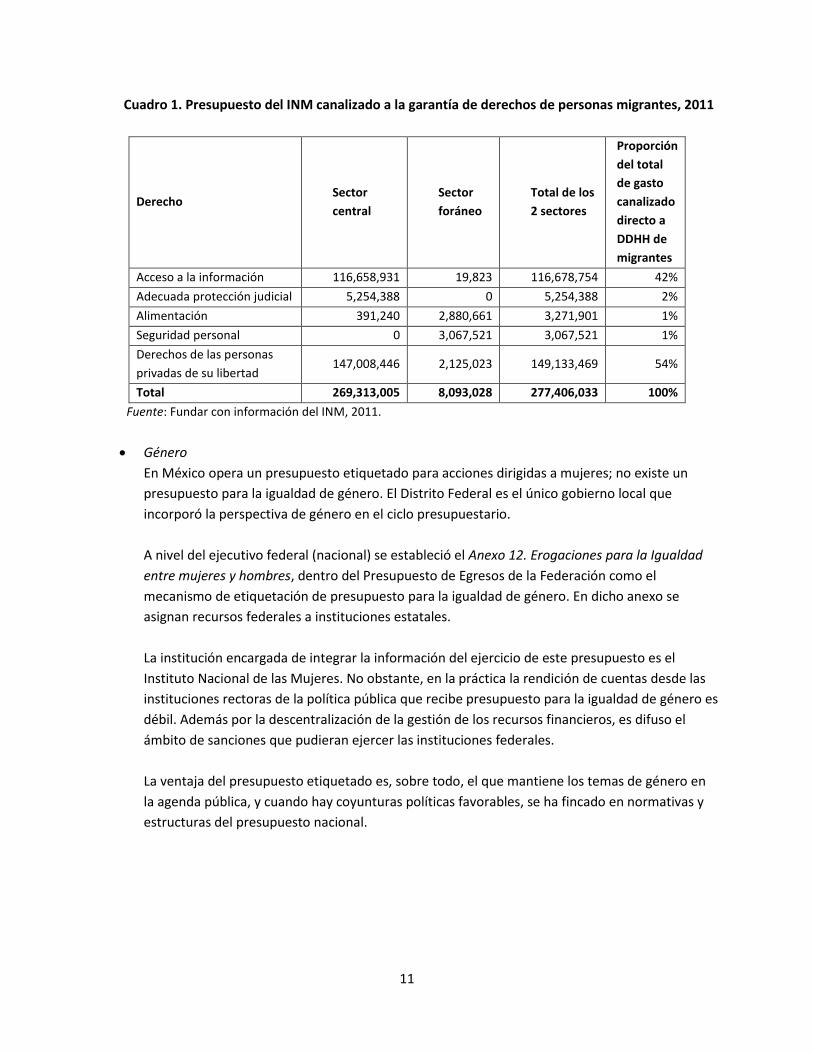
Un estudio de Fundar muestra que durante 2011, el Instituto Nacional de Migración (INM) gastó
poco más de 2,943 millones de pesos (mdp).18 La información que se presenta en este informe
muestra que la mayor parte de estos recursos, 2,360 mdp (82%) se canalizaron a actividades
relacionadas con la gestión y el control migratorio. Le siguen los montos canalizados a operar
programas de protección a migrantes, con 331 mdp (11%) y lo que se destina para dar construir
y dar mantenimiento a centros de detención y para actividades relacionadas a repatriaciones y
retornos asistidos, con 173 mdp (6%). Únicamente se encuentra el monto que se destinó
directamente a migrantes, con 19 mdp (1%).
Si se analiza el presupuesto desde la óptica de DH, el panorama no cambia significativamente
(Cuadro 1). Del presupuesto total ejercido por el INM en 2011, que osciló en los 2,943 millones
de pesos, solo 277 millones se canalizaron directamente a garantizar algún derecho para
personas migrantes (9% del total). De esos 277 millones el 54% se canalizó a detención de
migrantes (derechos de las personas detenidas) y 42% a campañas informativas, guías, etc.
(derecho de acceso a la información). Esto significa que únicamente fueron 11.6 millones de
pesos (0.4% del presupuesto total ejercido por el INM) los que se destinaron a garantizar
derechos de primera necesidad: adecuada protección judicial, alimentación y seguridad
personal.
17
Óp. Cit. De la Fuente, Aroa. 18
Córdova Alcaraz, Rodolfo (coord.) 2013. Una mirada al presupuesto del Instituto Nacional de Migración: ¿Dónde estuvieron sus prioridades durante 2011? Fundar, Centro de Análisis e Investigación, AC. Disponible en: http://fundar.org.mx/mexico/?p=9894
11
Cuadro 1. Presupuesto del INM canalizado a la garantía de derechos de personas migrantes, 2011
Derecho Sector
central
Sector
foráneo
Total de los
2 sectores
Proporción
del total
de gasto
canalizado
directo a
DDHH de
migrantes
Acceso a la información 116,658,931 19,823 116,678,754 42%
Adecuada protección judicial 5,254,388 0 5,254,388 2%
Alimentación 391,240 2,880,661 3,271,901 1%
Seguridad personal 0 3,067,521 3,067,521 1%
Derechos de las personas
privadas de su libertad 147,008,446 2,125,023 149,133,469 54%
Total 269,313,005 8,093,028 277,406,033 100%
Fuente: Fundar con información del INM, 2011.
Género
En México opera un presupuesto etiquetado para acciones dirigidas a mujeres; no existe un
presupuesto para la igualdad de género. El Distrito Federal es el único gobierno local que
incorporó la perspectiva de género en el ciclo presupuestario.
A nivel del ejecutivo federal (nacional) se estableció el Anexo 12. Erogaciones para la Igualdad
entre mujeres y hombres, dentro del Presupuesto de Egresos de la Federación como el
mecanismo de etiquetación de presupuesto para la igualdad de género. En dicho anexo se
asignan recursos federales a instituciones estatales.
La institución encargada de integrar la información del ejercicio de este presupuesto es el
Instituto Nacional de las Mujeres. No obstante, en la práctica la rendición de cuentas desde las
instituciones rectoras de la política pública que recibe presupuesto para la igualdad de género es
débil. Además por la descentralización de la gestión de los recursos financieros, es difuso el
ámbito de sanciones que pudieran ejercer las instituciones federales.
La ventaja del presupuesto etiquetado es, sobre todo, el que mantiene los temas de género en
la agenda pública, y cuando hay coyunturas políticas favorables, se ha fincado en normativas y
estructuras del presupuesto nacional.

12
5. If the government has recently introduced tax cuts, which sectors of society have benefited most?
How has your government justified any reduction in revenue, which may result from these tax
cuts? What is your country’s corporate tax rate?
Response from Brazil
Government recently introduced tax reduction to try to tackle the economic crisis—to stimulate
production and consumption. The private sector has benefited from these measures and results
concerning the impact on growth are not satisfactory. The middle class benefited, especially
concerning car acquisition and what is called the “white products” (refrigerators, washing
machines, etc.).
The argument was that it would stimulate growth.
Response from India
The total magnitude of tax revenue foregone due to exemptions/ deductions/ incentives in the
Central government tax system is estimated (by the Union Ministry of Finance) to be a
staggering 5.9 % of GDP for 2011-12 and 5.7 % of GDP for 2012-13.
The proportion of tax revenue foregone is the highest (at 44 % of total revenue foregone) in
case of exemptions in Customs Duties, followed by an almost equally high proportion of revenue
foregone (around 37 %) in case of exemptions in Excise Duties. Exemptions in Corporate Income
Tax have accounted for a much smaller 12 % of the total revenue foregone, while that in
Personal Income Tax have accounted for 8 % of the total revenue foregone in the figures
pertaining to financial year 2012-13.
According to the Statement of Revenue Foregone under the Central Tax System, for the financial
year 2011-12, the effective tax rates (ETRs) paid by both the manufacturing and service sectors
(in the corporate sector) were much less than the statutory tax rate of 33.21 %. While the ETR
for the manufacturing sector was 24.83 %, that for the service sector (in the corporate sector)
was even less at 23.40 %. The ETR for the entire sample of companies in the corporate sector
was 24.10 % (excluding dividend distribution tax). For the financial year 2012-13, the overall ETR
for the entire sample of companies in the corporate sector is even less at 22.85 %.
As per the Statement of Revenue Foregone under the Central Tax System, companies with higher
levels of profits are paying lower ETR than those in the lower range of profits. For instance,
companies making profits in the range of Rs. 0-1 crore paid an ETR of 26.26 %, whereas
companies making profits in the range of Greater than Rs. 500 crore paid an ETR of 21.67 % (for
the year 2012-13)19.
The available information and relevant arguments strongly suggest that exemptions need to be
minimised, carefully designed and justified with sound social and economic reasons. There is a
need to review the extent and nature of tax exemptions provided to Special Economic Zones
(deduction of export profits of units located in SEZs), diamond and gold (precious stones and
19
Given the difference in number of companies for each profit range, the comparison may not be perfect, but the Effective Tax Rates(ETRs) of large profit-making companies are lower compared to their profits for the data given.
13
jewellery), mineral fuels and mineral oils and the power sector, among others. The policy
measures by the government could focus more on infrastructure and communication facilities,
etc., instead of relying heavily on tax breaks. Tax breaks need to be project-specific, and should
not be treated as a “cost-saving” source for corporations seeking sustained tax holidays. SEZs
should be used as a strategic instrument specifically for export promotion purposes and not
become a haven for other corporations seeking tax sops.20
Response from Mexico
La reforma hacendaria recién aprobada en octubre de 2013 hace exactamente lo contrario:
aumenta los impuestos de manera progresiva. En dicha reforma se reformaron una serie de
impuestos para hacerlos más progresivos (ISR a personas físicas con ingresos superiores a 60 mil
pesos; la transformación de la consolidación fiscal); introducir otros que recaudan desde
actividades lucrativas que no estaban gravadas como las operaciones en bolsa o la extracción
minera; generar impuestos para productos que propician y fomentan problemas de salud que
generan elevados costos para el Estado como las bebidas azucaradas y la comida chatarra; y, no
gravó alimentos, medicinas, vivienda y colegiaturas escolares, lo cual hubiera afectado
directamente los derechos de las personas con menores ingresos.
Sin embargo, debido a la gran brecha de desigualdad, las reformas recientes son una medida
muy incipiente pues en el país la política fiscal no es redistributiva, como se explicó en la
pregunta 2, no modifica la distribución de la riqueza.
6. What is the fiscal pressure on the financial sector? Would you characterize the financial sector as
paying a fair share of taxes? On what basis?
Response from India
See 1 above.
7. Are there any particular industries that receive tax subsidies (for example, agriculture, housing)?
Are these subsidies related to government’s commitments to specific human rights (for example,
right to adequate housing or food), or do they follow other human rights-based rationale?
Response from Brazil
Yes, automobile and “white products” industries, among others.
This decision has nothing to do with a human rights rationale. It bets that it will stimulate
private investment and consumption, and that it will result in an increase in economic growth.
20
CBGA discussion paper, Tax Exemptions in India- Issues and Challenges, by Sankhanath Bandyopadhyay: http://www.cbgaindia.org/files/recent_publications/Tax%20Exemptions%20in%20India.pdf

14
Response from India
Farmers receive subsidies for fertilizers, seeds, etc., as well as a minimum price protection by
the government for various agricultural products. This public procurement then gets linked to
food subsidy programs for the poor (public distribution system). The latter has recently been
legislated into the National Food Security Act.
8. Has your government proposed or supported increased intergovernmental tax cooperation? What
is its official position on tax havens? What is its official position on illicit flows of capital, e.g.
measures to stop transfer pricing, proposals on country-by-country reporting, automatic exchange
of information, disclosure of beneficiary ownership?
Response from Brazil
In Brazil the “super rich” have the equivalent of one third of the GDP in tax havens (see The
Price of Offshore Revisited:
http://www.taxjustice.net/cms/upload/pdf/Price_of_Offshore_Revisited_120722.pdf)
And more: tax havens are the destination of significant amounts of Brazilian foreign
investments.
Brazil has signed several Exchange of Information Agreements (EOI) with different countries and
it is working to fight tax evasions through the G20. But it is going very slowly and more is
needed.
Response from India
India has been very supportive of increased intergovernmental tax cooperation on forums such
as G20 and BRICS.
The Prime Minister of India had made strong statements on G20 tackling issues of tax havens,
illicit flows: http://ibnlive.in.com/news/pm-asks-g20-to-send-strong-message-to-stop-tax-
evasion/198996-2.html. But the Government of India continues to be wary about taking on
foreign investors resulting in several key transparency measures being postponed or not
pursued such as postponement of general anti-avoidance rules, renegotiation of the India-
Mauritius treaty, pursuing Vodafone with the retrospective amendments as passed by
Parliament instead of ‘conciliation’ talks.
Government of India has officially and consistently supported automatic information exchange.
For more details:
http://www.tpa-global.com/files/StreamFile48987/130130_manual-on-exchange-of-
information.pdf
Addressing transfer mispricing is a focus for Revenue Authorities in India. They have recently
enacted provisions for entering into Advance Pricing Agreements to address the increasing
disputes in this area. The India chapter in the UN Transfer Pricing Manual lays out the official
detailed position on Indian transfer pricing approach:
http://www.un.org/esa/ffd/tax/eighthsession/Chap10_CPIndia_20120904_v3_HC-accp.pdf
15
While the Revenue Department has been willing to address the issue of tax havens and illicit
flows, political considerations and wariness on the part of Government of India to pursue this as
well has resulted in contradictory actions. The sometimes misplaced importance given to
sentiments of foreign investors proves to be a challenge in India where the Government
ultimately gives in to pressure from investor/business lobbies.
9. Has your government proposed or supported international tax policies such as a financial
transactions tax? If so, please specify in which form. If not, please explain the nature of its
objection. Do revenues from such taxes (if in place) go into general revenue or are they earmarked
for specific sectors or programmes? If the latter, which programmes?
Response from Brazil
Brazil’s position regarding ITT is ambiguous: the government says it is in favor of the measure,
but doesn’t introduce the issue onto the G20’s agenda, for instance.
In the past, government implemented a tax that was similar to ITT, called CPMF. It is over now,
because of societal pressure regarding increasing tax burden. The resources from CPMF were
destined to public health policies.
Response from India
India has a Securities Transaction Tax in place, but it is very small and amounts to 0.7% of total
tax revenue or 0.115% of GDP. The revenue from this tax goes into general revenue and is not
earmarked for specific sectors or programmes.
10. Is your government party to international investment or trade agreements that curtail your
country’s capacity to levy taxes, or the capacity of your partner country/ies to levy taxes? Is your
government party to investment contracts or concessions that restrict your government’s ability
to levy taxes on certain companies or sectors? What measures (if any) were taken to mitigate
impacts of these limitations on your country’s (or other countries’) ability to raise adequate
resources in order to fulfil human rights obligations?
Response from India
India’s Double Taxation Avoidance Agreements with tax havens such as Mauritius, Singapore
and Cyprus deprives revenue in the form of capital gains tax to India. As per these double tax
treaties, the residence country (Mauritius/Singapore/Cyprus) has the right to levy capital gains
tax which is 0% in those jurisdictions. Additionally, secrecy benefits provided by such tax havens
results in indirect revenue losses by aiding capital flight out of the country through money
laundering channels for instance.
A comprehensive review of all tax treaties and investment treaties signed by India is required to
understand its impact on revenue generation.

16
Response from Mexico
México tiene un Presupuesto de Gastos Fiscales (PGF) en el que integra una serie de exenciones
de impuestos para distintas empresas y consumidores.21 Dichos gastos ascendieron a 5.0% del
PIB en 2012 y a 3.9% del PIB en 2013.22 Sin embargo, el PGF no proporciona cifras agregadas ni
clasificaciones funcionales, por lo que no es posible saber cuáles son los ramos económicos a los
que se intenta estimular con estas exenciones fiscales.
SPENDING
1. Are gender equality and economic and social rights criteria considered in budget planning and
execution? If so, how are they integrated and monitored? Since when? Have you or your
government been able to track the effect of these criteria? If so, what results have you obtained
by applying these criteria?
General Comments
Two case studies documented by IBP—about the right to education in Argentina and the right to
health in South Africa—provide examples of civil society monitoring of government plans and
spending using a human rights framework. In both cases the advocacy resulted in funding in these
areas more in line with the governments’ human rights obligations.
Response from Brazil
Yes and no.
Yes, because federal government has a Ministry for gender issues that helps to highlight and
fight gender inequality. Yes, because social spending has increased the last decades. Evidence,
official data, show that inequalities in general have decreased in the country.
Inesc, for human rights in general, and Cfemea, for gender issues, are two national NGOs that
monitor the national budget.
No, because inequalities are still huge, the resources for social policies are still not enough, and
the power of government bodies regarding HR and gender issues (Ministers of Human Rights
and Policies for Women) are weak within the federal administration, not allowing for effective
mainstreaming of these dimensions in the national budget.
Response from India
Gender equality, social and economic rights are partially accounted for in the plan budgets in
India. The Planning Commission of India follows a routine exercise of drawing up a detailed
sector wise plan document every five years. According to the social sector outcome targets set
in the Plan document, the Union Budget every year attempts to allocate plan fund to that
respect. However, budgetary allocations towards the social sector needs are monitored by the
21
Disponible en línea (noviembre de 2014): http://is.gd/zSAFW6 22
Fundación Ethos. (2013). El presupuesto de Gastos Fiscales 2012, lo bueno, lo malo y lo que falta.

17
budget groups at the state and central levels (civil society organisations). The government also
engages itself in a monitoring exercise on its planning by reporting a Mid-term appraisal of the
Five Year Plans.
CBGA brings out, as part of its monitoring exercise over union budgets, an annual document
called ‘Response to Union Budget’ every year within 24 hours of budget presentation. The
document itself is a volume that monitors expenditure commitment of the government towards
the social sectors and towards the disadvantaged sections of the population. Apart from this,
throughout the year CBGA engages itself in tracking certain important government programmes
in terms of its allocations and design and highlights deficiencies within the same.
Response from Mexico
El diseño del Plan Nacional de Desarrollo 2013-2018 reconoció en su diagnóstico la privación de
derechos sociales entre las personas y grupos sociales, e inclusive la uno de los cinco objetivos
sexenales es “Garantizar el ejercicio efectivo de los derechos sociales para toda la población”,
sin embargo no existen criterios explícitos para tomar en cuenta los derechos económicos y
sociales en los programas sectoriales y en la ejecución del presupuesto.
A partir de 2008, el sistema presupuestario mexicano se ha transformado desde un presupuesto
por programas a uno basado en resultados que busca hacer más eficiente el uso de los recursos
públicos. Sin embargo, a pesar de que los derechos humanos están reconocidos en el artículo 1º
e la Constitución (que además reconoce el principio de progresividad) y de que están
enunciados en algunos documentos de la Secretaría de Hacienda, no hay una metodología para
integrar los criterios de derechos humanos en las políticas públicas y en el presupuesto.
Response from South Africa
The Constitution, the cornerstone of South Africa’s democracy, outlines the rights of all people
living in the country. The Bill of Rights concerns rights to adequate housing, water and basic
services as well as access to healthcare, food, education, water, social security and the
environment. Government Departments of Housing, Water Affairs, Local Government,
Education, Health, Social Development at the national and provincial levels are annually
allocated budgets and plans for progressively realizing the rights enshrined in the Bill of Rights.
Furthermore, the government has a national as well as provincial Departments of Social Welfare
and Department of Women, Children and Disabilities meant to safeguard the rights of
vulnerable groups. These departments are responsible for ensuring impact and progress for
vulnerable groups. They target poor, marginalised and disadvantaged groups, mostly children,
women, youth, the elderly and people with disabilities when budgeting and planning for service
delivery.
The National Development Plan 2030 (NDP) is the first long term plan for South Africa which sets
out the planning framework for improving economic growth and quality of life for all. Budget
expenditure and planning will be strongly aligned with the National Development Plan as well as

18
the Bill of Rights. For more on the NDP please refer to http://www.info.gov.za/issues/national-
development-plan/
The core priorities of the NDP are to eliminate poverty and reduce inequality by lowering the
costs of living and doing business (i.e., increasing exports, creating more jobs, developing more
inclusive economic growth and capital investments in economic and social infrastructure.) The
NDP also emphasizes the importance of reducing the cost of living of low income and working
class households in order to broaden economic participation and growth.
Government contributes to reducing the cost of living in three ways:
- Investment in the social wage, comprising education, health services, social development,
public transport, housing and local amenities.
- Support to vulnerable households through the old age grant, the child support grant and
other social assistance grants.
- Contributory social security, including unemployment insurance, injury compensation and
death or disability benefits.
Please read further Budget Review 2013, National Treasury Republic of South Africa published
27 Feb 2013 at
http://www.treasury.gov.za/documents/national%20budget/2013/review/FullReview.pdf
The economic and social rights criteria are monitored by the South African Human Rights
Commission. For more on the South African Human Rights Commission, see
http://www.sahrc.org.za/home/ or Section 184 of the South African Constitution
http://www.info.gov.za/documents/constitution/1996/a108-96.pdf. Each year, various state
departments must provide the Commission with information on the measures that they have
taken towards the realisation of the rights in the Bill of Rights, concerning housing, health care,
food, water, social security, education and the environment. The Commission is also responsible
for taking corrective steps and action against those found to be violating human rights. They are
also responsible for promoting and integrating a culture of human rights within the South
African State and Society.
Between 2009 and 2010 two units from the Office of the President became dedicated national
departments. These are the Department of Performance Monitoring and Evaluation responsible
for monitoring and evaluation of performance by state departments. For more on DPME and
Budget 2013 go to
http://www.treasury.gov.za/documents/national%20budget/2013/enebooklets/Vote%206%20P
erfomance%20Monitoring%20and%20Evaluation.pdf This restructuring has enabled
performance assessments on various planned and budgeted services to be easily conducted on
an annual basis. In 2009/10 The Department of Women, Children and Disabilities also became
an independent government department with an internal monitoring programme. The
“Monitoring and Evaluation for Gender Equality” is a sub-programme within the Department of
Women, Children and Disabilities which is solely responsible for tracking delivery on
constitutional, regional and international mandates on gender equality. To read further go to
http://www.treasury.gov.za/documents/national%20budget/2013/enebooklets/Vote%208%20
Women,%20Children%20and%20People%20with%20Disabilities.pdf

19
2. Has your government engaged, or is it planning to engage, in fiscal austerity measures, such as
cutting spending on social services? If so, what safeguards did, or will, it put in place to ensure
that such measures are consistent with human rights obligations? Are the cuts temporary or
permanent? Are they necessary in the sense that their absence would have meant greater harm
to economic and social rights of the population? Has the government identified the minimum
content of rights that should not be affected? Have the cuts been accompanied by mitigating
measures to ensure that vulnerable and marginalized populations are not disproportionately
affected? If yes, please provide examples of some of those measures.
General comments
Some civil society groups have identified non-essential expenditures in a government budget. Their
experiences, even when not occurring in times of fiscal austerity, have relevance for such situations.
See, for example, a case affecting the right to health in Tanzania.
Response from Brazil
Government is not cutting resources for social policies, but it is not increasing them either. For
instance, we, civil society, maintain that the education sector needs at least 10% of the GDP
(today is around 6%); the health sector, 10% of national gross revenue (today it is around 7%).
Social spending in Brazil is increasing and this increase contributes to poverty alleviation and
inequality reduction. In the 80s it was around 14% of the GDP. Nowadays it is around 23%. But
this is not enough to eliminate the enormous social gap that still exists.
Response from Mexico
El artículo 58 de la Ley Federal de Presupuesto y Responsabilidad Hacendaria establece que ”no
se podrán realizar reducciones a los programas presupuestarios ni a las inversiones dirigidas a la
atención de la Igualdad entre Mujeres y Hombres, al Programa de Ciencia, Tecnología e
Innovación; las erogaciones correspondientes al Desarrollo Integral de los Pueblos Indígenas y
Comunidades Indígenas y la Atención a Grupos Vulnerables, salvo en los supuestos establecidos
en la presente Ley y con la opinión de la Cámara de Diputados”.
Sin embargo, tal regulación no impide el recorte de presupuesto parcial o total a temas de
derechos humanos tales como la igualdad de género, los DDHH de las mujeres y de los pueblos
indígenas. Tal es el caso de lo que sucedió en el Presupuesto de Egresos de la Federación 2014
en el que, pese al reclamo de organizaciones de la sociedad civil y la academia vinculadas al
tema, se eliminó el programa presupuestario “Acciones para la igualdad de género con
población indígena”. Dicho programa era el único dirigido específicamente a promover la
igualdad de género entre la población indígena y contaba con cuatro vertientes de trabajo con

20
instancias de gobierno, organizaciones de la sociedad civil, casas de la mujer indígena e
instituciones de formación, atendiendo a un total de 267 mil personas en 2013. 23
Response from South Africa
In response to the cumulative effects of the slowdown in growth and revenue, government has
appropriately decided to reduce aggregate spending by R10.4 billion over the next three years.
Read further at Budget Review 2013, National Treasury Republic of South Africa published 27
Feb 2013 at
http://www.treasury.gov.za/documents/national%20budget/2013/review/FullReview.pdf
In order to avoid compromising spending priorities, Treasury has requested that all institutions
increase their efficiency and effectiveness in terms of service delivery, particularly in the use of
available budgets.
Government will over the next three years invest R827 billion in building and upgrading
infrastructure. It is believed that these investments will result in improving access by South
Africans to healthcare, housing, education, social services, water and other basic amenities.
Government remains committed to the provision of housing for low-income groups. In line with
this commitment, it has set aside R3 billion over the next three years for social housing
(medium-density rental housing in urban areas). It has also allocatedR23.9 billion to provinces
in the form of an education infrastructure grant for the building, upgrading or maintenance of
existing infrastructure. Government will also continue to invest in health infrastructure. The
largest share, for example, of the combined R29.5 billion allocated to the provincial
departments of health over the next three years, is for infrastructure at district and regional
hospitals. The social assistance programme has been allocated R113 billion for 2013/14, is
increasing to R129.5 billion in 2015/16. The number of grants beneficiaries will increase from
nearly 16.1 million people in 2012/13 to 17.2 million in 2015/16. Government also provides a
minimum of free basic services such as free clean water. These are provided by municipalities
and will cost R28 billion in 2013/14. For further reading go to “The People’s Guide to the
Budget 2013”
http://www.treasury.gov.za/documents/national%20budget/2013/guides/2013%20People's%2
0Guide_English.pdf
23
Área de investigación e incidencia. Kinal Antzetik Distrito Federal A.C Retos del PEF 2014. Una mirada a los presupuestos para salud materna e igualdad de género en población indígena. Disponible en http://las10faltantes.com/lasdiez2014/?page_id=241#etiqueta1

21
3. What measures were put in place to ensure public participation, transparency, non-discrimination
and accountability in the design and implementation of spending cuts and in the monitoring of
their impacts? To what extent do these rely on disaggregated data by sex, age, income and place
and up-to-date information on poverty?
General comments
Many civil society groups undertake advocacy around issues of participation, transparency, non-
discrimination and accountability. Although most of these are undertaken in times other than those
of fiscal austerity, the experiences of these groups have more general relevance. One such example
relates to the right to housing in Northern Ireland, the other, the right to sanitation in South Africa.
Response from India
Public participation in the annual budgets preparation in India is restricted to a pre-budget
consultative process held by the Ministry of Finance, GOI. Consultations to take into cognizance,
the concerns expressed by various sections of the population, the Ministry meets Agriculture
sector, Economists, Banking and Financial Instituions, Trade and industry, state finance
Ministers, development sector, trade unions and the civil society. The last two groups were
added later to the list of consultative bodies.
Response from South Africa
The National Treasury has a comprehensive website containing detailed subnational budgets
and considerably disaggregated actual revenue and expenditure information. Provincial
Treasuries also maintain up-to-date websites with the aforesaid information. The South African
government provides comprehensive and fully transparent government budgets and plans, and
a Citizen’s budget, which explains budget and planning decisions made by government. Budget
information is published in multiple indigenous languages.
The public is invited annually to make inputs into each Provincial Legislature’s Finance Portfolio
Committee. At local government level, municipal councils annually afford communities (through
various public meetings) the opportunity to consider draft budgets and make inputs on
suggested areas of priority. It is the PSAM’s experience that these forums are either poorly
attended by the public or when well attended, communities inevitably use the opportunity to
lodge complaints regarding inadequate service delivery, rather than actively engage with the
material related to the budgets.
There are technical committees set up by National and Provincial Treasury; the committees are
responsible for evaluating budget submissions prepared by government. In the provincial and
national context, civil society should increase its efforts to access Medium Term Expenditure
Committee hearings where draft budgets are interrogated and should endeavor to make well-
considered inputs at such hearings. Currently these committee hearings are strictly by
invitation. However, their decisions are made public. For further information, see Preparation
of Expenditure Estimates for the 2014 Medium Term Expenditure Framework at
http://www.treasury.gov.za/publications/guidelines/2014%20MTEF%20guidelines.pdf
22
South Africa’s budget at central level contains comprehensive information taken from Statistics
South Africa 2011 on Census population and socio-economic demographics. This is used on
intergovernmental transfers and on the formula and data used for redistributive purposes. The
data and inputs which impact upon the formula used are also made available to the public in
electronic and hard copy formats. Documents providing comprehensive details of funds
distributed to district and local levels of government are available through the Government
Gazette and are also accessible in electronic format. To read further on the formula and data,
see: Budget Review 2013, National Treasury, February 2013, Annexture W1, Explanatory
Memorandum to the Division of Revenue
http://www.treasury.gov.za/documents/national%20budget/2013/review/Annexure%20W1.pdf
4. What is the distribution of expenditure between different social groups (e.g. women-men, rural-
urban, different age groups)? What percentages of the national budget does your government
allocate and spend on health services, public education, and social welfare compared to military
expenditure?
General comments
The national budget may be a very inadequate measure of a government’s compliance with its
human rights obligations. Much of the service delivery relevant to basic ESC rights, such as
health, education and social welfare programs, is often handled by sub-national governments. It
is thus essential to know the structure of government in a particular country in order to know
the relevance and role of the national budget in these spheres. If a country has a decentralized
form of national government with limited revenue-raising capacity and authority at sub-national
levels, then the national budget is central to this calculation. If, however, the country has a
federal system, where states or other sub-national units have considerable revenue-raising
authority and substantial control over their own budgets, then an assessment of the compliance
of government with its basic ESC rights obligations must take into account what is raised and
spent at the sub-national level.
Also important to include in data about different social groups is information about the
distribution of expenditures disaggregated by income level. It is often the case, for example,
that proportionately more funding is directed to wealthier neighborhoods, to those who are
better able to access their rights without government assistance. (See Argentina case
referenced above, under Spending, 1)
When looking at shares of a budget directed to specific spheres, it is also important to ask: Who
needs the funding the most? Who benefits most from the funding? If a health care system, for
example, is structured around private health insurance, where the middle class and wealthy rely
on their health insurance to secure services, then fewer people depend on the public health
system and that budget can be smaller. In such a case a budget may be proportionately smaller
than in comparable countries, but may nonetheless provide adequate services to those who
need them.

23
Response from India
In India expenditure data is not disaggregated by sex, location or age group. It is given at the
level of states and centre. The tables below provide the detailed expenditure pattern in social
sectors :
Table 1: Priority for Social Services in the Union Budget
Year
Expenditure from
the Union Budget
on Social Services*
(in Rs. Crore)
Expenditure from the Union
Budget on Social Services*
as % of Total
Expenditure from the
Union Budget
as % of GDP
2004-05 39,123 7.9 1.2
2005-06 49,535 9.8 1.3
2006-07 55,246 9.5 1.3
2007-08 78,818 11.1 1.6
2008-09 1,10,542 12.5 2.0
2009-10 1,22,345 11.9 1.9
2010-11 1,51,013 12.6 2.0
2011-12 1,49,053 11.4 1.7
2012-13 (RE) 1,70,682 11.9 1.7
2013-14 (BE) 2,13,689 12.8 1.9
Table 2: Priorities for Selected Ministries in the Union Budget (2011-12 to 2013-14)
(Figures in Rs. Crore,
except where mentioned as % of GDP)
2011-12
(Actuals)
2012-13
(BE) 2012-13 (RE) 2013-14 (BE)
A GDP (at current market prices) 89,74,947 100,28,118 100,28,118 113,71,886
B Total Union Budget 13,04,365 14,90,925 14,30,825 16,65,297
as % of GDP 14.5 14.9 14.3 14.6
BUDGET FOR THE UNION MINISTRY OF
1 Agriculture (excluding Special Central
Asst. for State Plans, like, RKVY) 14,936.8 18,714.6 16,272.1 19,818.8
as % of Total Union Budget 1.15 1.26 1.14 1.19
as % of GDP 0.17 0.19 0.16 0.17
2 Consumer Affairs, Food and Public
Distribution 74,277.5 76,869.4 86,707.5 91,591.4
as % of Total Union Budget 5.69 5.16 6.06 5.50
as % of GDP 0.83 0.77 0.86 0.81
3 Defence (including Defence - Civil
Estimates) 2,13,673.3 2,38,205.5 2,23,003.5 2,53,345.9
as % of Total Union Budget 16.38 15.98 15.59 15.21
as % of GDP 2.38 2.38 2.22 2.23

24
(Figures in Rs. Crore,
except where mentioned as % of GDP)
2011-12
(Actuals)
2012-13
(BE) 2012-13 (RE) 2013-14 (BE)
4 Drinking Water and Sanitation 9,997.7 14,005.2 13,005.3 15,265.7
as % of Total Union Budget 0.77 0.94 0.91 0.92
as % of GDP 0.11 0.14 0.13 0.13
5 Health and Family Welfare 27,198.5 34,488.0 29,272.6 37,330.0
as % of Total Union Budget 2.09 2.31 2.05 2.24
as % of GDP 0.30 0.34 0.29 0.33
6 Housing and Urban Poverty Alleviation 957.1 1,163.0 957.3 1,468.0
as % of Total Union Budget 0.07 0.08 0.07 0.09
as % of GDP 0.01 0.01 0.01 0.01
7 Human Resource Development 60,146.4 74,056.0 66,819.0 79,451.0
as % of Total Union Budget 4.61 4.97 4.67 4.77
as % of GDP 0.67 0.74 0.67 0.70
8 Labour and Employment 3,317.8 4,333.7 3,943.9 5,081.2
as % of Total Union Budget 0.25 0.29 0.28 0.31
as % of GDP 0.04 0.04 0.04 0.04
9 Minority Affairs 2,297.5 3,154.7 2,218.3 3,531.0
as % of Total Union Budget 0.18 0.21 0.16 0.21
as % of GDP 0.03 0.03 0.02 0.03
10 New and Renewable Energy 1,196.8 1,397.8 1,163.5 1,533.5
as % of Total Union Budget 0.09 0.09 0.08 0.09
as % of GDP 0.01 0.01 0.01 0.01
11 Petroleum and Natural Gas 70,099.7 43,759.8 97,514.1 65,188.4
as % of Total Union Budget 5.37 2.94 6.82 3.91
as % of GDP 0.78 0.44 0.97 0.57
12 Power 4,315.8 9,519.1 7,901.9 10,073.1
as % of Total Union Budget 0.33 0.64 0.55 0.60
as % of GDP 0.05 0.09 0.08 0.09
13
Road Transport and Highways
(excluding Special Central Asst. for
State Plans)
23,784.0 28,438.2 20,465.2 28,942.2
as % of Total Union Budget 1.82 1.91 1.43 1.74
as % of GDP 0.27 0.28 0.20 0.25
14 Rural Development 66,689.2 76,430.0 55,052.0 80,250.5
as % of Total Union Budget 5.11 5.13 3.85 4.82
as % of GDP 0.74 0.76 0.55 0.71
15 Social Justice and Empowerment 5,029.3 6,008.3 5,105.2 6,725.3
as % of Total Union Budget 0.39 0.40 0.36 0.40
as % of GDP 0.06 0.06 0.05 0.06
16 Tribal Affairs (excluding Special Central
Asst. for State Plans) 1,576.5 1,591.0 1,443.0 1,778.9
25
(Figures in Rs. Crore,
except where mentioned as % of GDP)
2011-12
(Actuals)
2012-13
(BE) 2012-13 (RE) 2013-14 (BE)
as % of Total Union Budget 0.12 0.11 0.10 0.11
as % of GDP 0.02 0.02 0.01 0.02
17 Urban Development 8,619.0 9,686.0 8,423.6 10,363.7
as % of Total Union Budget 0.66 0.65 0.59 0.62
as % of GDP 0.10 0.10 0.08 0.09
18 Water Resources 10,43.1 2,041.0 1,209.8 2,076.5
as % of Total Union Budget 0.08 0.14 0.08 0.12
as % of GDP 0.01 0.02 0.01 0.02
19 Women and Child Development 15,671.1 18,584.0 17,263.0 20,440.0
as % of Total Union Budget 1.20 1.25 1.21 1.23
as % of GDP 0.17 0.19 0.17 0.18
20 Youth Affairs and Sports 970.3 1,152.0 1,005.6 1,219.0
as % of Total Union Budget 0.07 0.08 0.07 0.07
as % of GDP 0.01 0.01 0.01 0.01
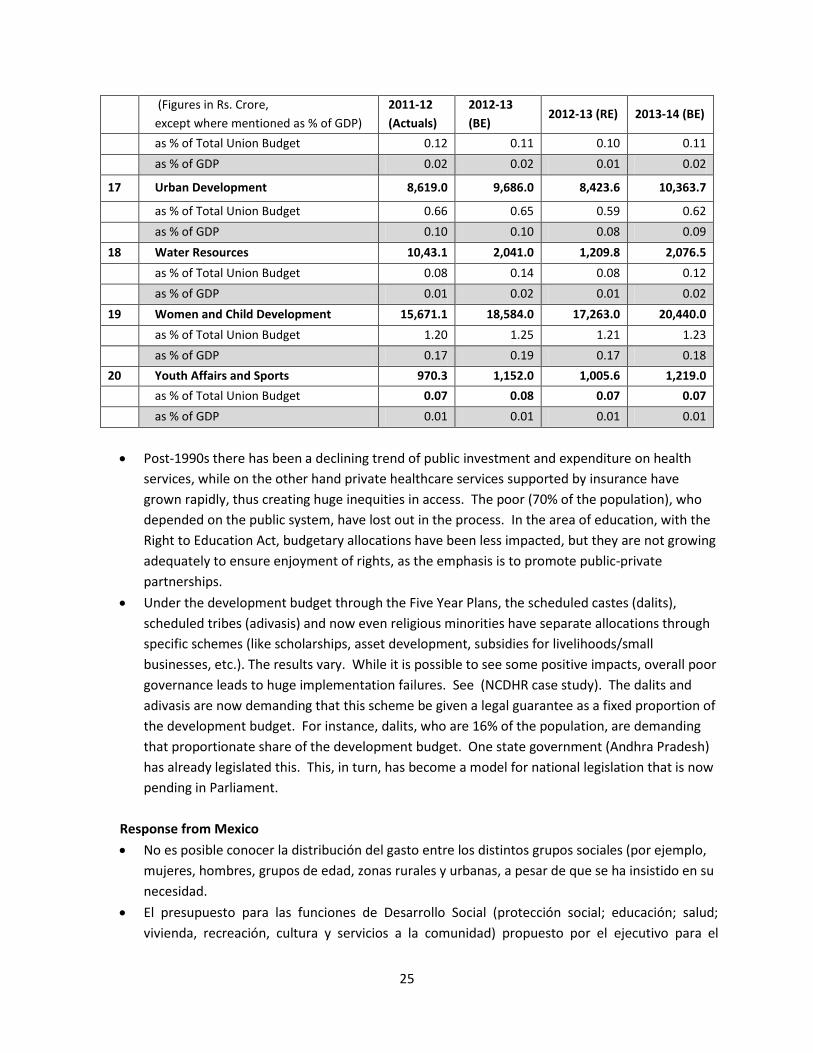
Post-1990s there has been a declining trend of public investment and expenditure on health
services, while on the other hand private healthcare services supported by insurance have
grown rapidly, thus creating huge inequities in access. The poor (70% of the population), who
depended on the public system, have lost out in the process. In the area of education, with the
Right to Education Act, budgetary allocations have been less impacted, but they are not growing
adequately to ensure enjoyment of rights, as the emphasis is to promote public-private
partnerships.
Under the development budget through the Five Year Plans, the scheduled castes (dalits),
scheduled tribes (adivasis) and now even religious minorities have separate allocations through
specific schemes (like scholarships, asset development, subsidies for livelihoods/small
businesses, etc.). The results vary. While it is possible to see some positive impacts, overall poor
governance leads to huge implementation failures. See (NCDHR case study). The dalits and
adivasis are now demanding that this scheme be given a legal guarantee as a fixed proportion of
the development budget. For instance, dalits, who are 16% of the population, are demanding
that proportionate share of the development budget. One state government (Andhra Pradesh)
has already legislated this. This, in turn, has become a model for national legislation that is now
pending in Parliament.
Response from Mexico
No es posible conocer la distribución del gasto entre los distintos grupos sociales (por ejemplo,
mujeres, hombres, grupos de edad, zonas rurales y urbanas, a pesar de que se ha insistido en su
necesidad.
El presupuesto para las funciones de Desarrollo Social (protección social; educación; salud;
vivienda, recreación, cultura y servicios a la comunidad) propuesto por el ejecutivo para el
26
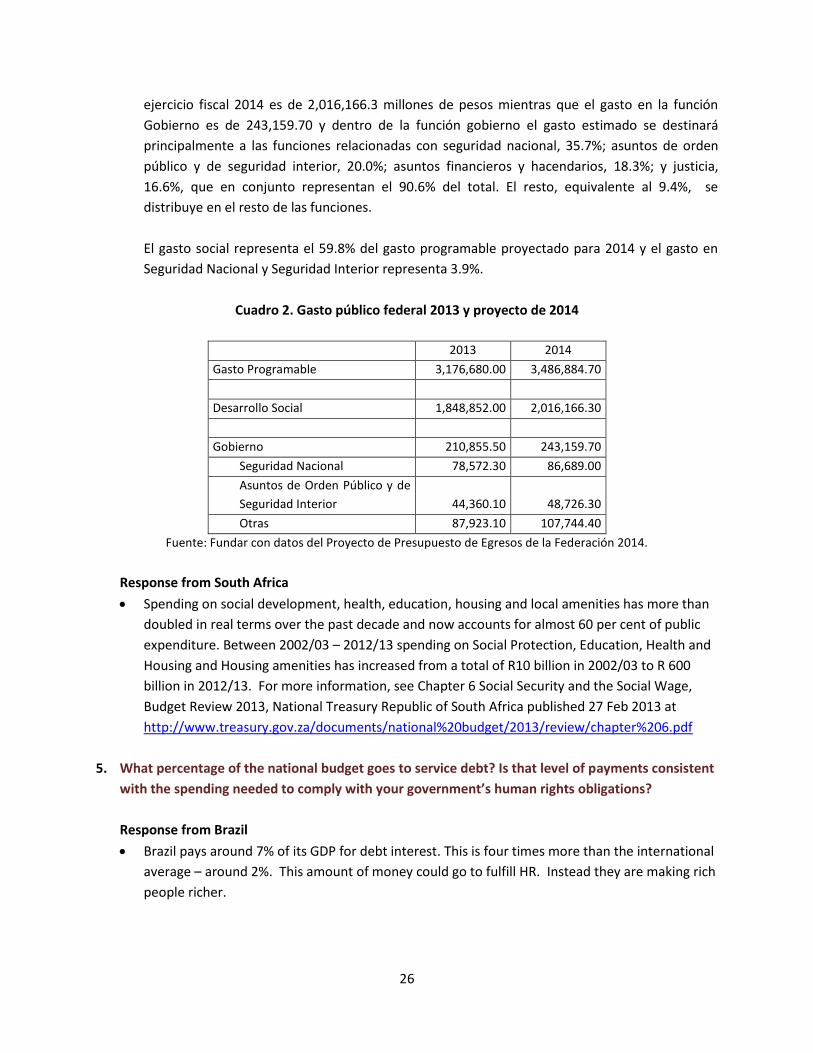
ejercicio fiscal 2014 es de 2,016,166.3 millones de pesos mientras que el gasto en la función
Gobierno es de 243,159.70 y dentro de la función gobierno el gasto estimado se destinará
principalmente a las funciones relacionadas con seguridad nacional, 35.7%; asuntos de orden
público y de seguridad interior, 20.0%; asuntos financieros y hacendarios, 18.3%; y justicia,
16.6%, que en conjunto representan el 90.6% del total. El resto, equivalente al 9.4%, se
distribuye en el resto de las funciones.
El gasto social representa el 59.8% del gasto programable proyectado para 2014 y el gasto en
Seguridad Nacional y Seguridad Interior representa 3.9%.
Cuadro 2. Gasto público federal 2013 y proyecto de 2014
2013 2014
Gasto Programable 3,176,680.00 3,486,884.70
Desarrollo Social 1,848,852.00 2,016,166.30
Gobierno 210,855.50 243,159.70
Seguridad Nacional 78,572.30 86,689.00
Asuntos de Orden Público y de
Seguridad Interior 44,360.10 48,726.30
Otras 87,923.10 107,744.40
Fuente: Fundar con datos del Proyecto de Presupuesto de Egresos de la Federación 2014.
Response from South Africa
Spending on social development, health, education, housing and local amenities has more than
doubled in real terms over the past decade and now accounts for almost 60 per cent of public
expenditure. Between 2002/03 – 2012/13 spending on Social Protection, Education, Health and
Housing and Housing amenities has increased from a total of R10 billion in 2002/03 to R 600
billion in 2012/13. For more information, see Chapter 6 Social Security and the Social Wage,
Budget Review 2013, National Treasury Republic of South Africa published 27 Feb 2013 at
http://www.treasury.gov.za/documents/national%20budget/2013/review/chapter%206.pdf
5. What percentage of the national budget goes to service debt? Is that level of payments consistent
with the spending needed to comply with your government’s human rights obligations?
Response from Brazil
Brazil pays around 7% of its GDP for debt interest. This is four times more than the international
average – around 2%. This amount of money could go to fulfill HR. Instead they are making rich
people richer.

27
Response from Mexico
La deuda pública subnacional se ha incrementado considerablemente durante los últimos años.
Al 30 de Junio de 2013, la deuda de los estados y municipios registrada superaba los 443 mil
millones de pesos. Esto representa alrededor de 10% del Presupuesto de Egresos de la
Federación 2014. Se desconoce el verdadero monto de la deuda pues sólo se registra ante
Hacienda la que se garantiza con cargo a las participaciones o aportaciones federales.
La regulación en materia de deuda ha sido permisiva y laxa. El incremento de la deuda se había
venido dando sin leyes u ordenamientos generales, ni instituciones gubernamentales
claramente facultadas para limitar el monto de endeudamiento de cada entidad federativa,
municipio, u organismos dependientes de ellos. Los límites y condiciones para contratar deuda
los deben establecer los Congresos Locales en sus respectivas leyes de deuda pública. Las
autoridades financieras no han intervenido en la proliferación de financiamientos a gobiernos
subnacionales por parte de la banca comercial, ni emitido medidas sobre dicho fenómeno, aun
cuando el monto de esas operaciones pudiera llegar a afectar los niveles de capitalización de las
instituciones de crédito, debido al riesgo o la capacidad de solvencia del estado o municipio
deudor. Tampoco se tiene un mecanismo de verificación del destino de los recursos que evite
que no se utilicen en gasto corriente, y que garantice que se ejerzan de manera transparente, en
proyectos de inversión pública verdaderamente productivos, ni tampoco se da prioridad a
invertir los recursos derivados de la contratación de deuda en aquellos proyectos que puedan
generar ingresos propios, que faciliten e incrementen la recaudación local o mejoren la calidad
de vida de la población.
Recientemente se aprobaron reformas a la Constitución que prevén un mejor marco normativo
para el manejo de la deuda pública subnacional, que prevén la intervención federal en estados
de la república o municipios a efecto de sanear las finanzas de los estados altamente
endeudados. La reforma sin embargo no prevé mejores mecanismos de sanción para aquellos
que en el futuro afecten negativamente las finanzas locales y por ende la calidad de los servicios
públicos en detrimento de los derechos humanos.
El aumento de la deuda subnacional obligó a las y los legisladores a reformar la Constitución, no
obstante aún no se cuenta con un marco conceptual y metodológico sobre el sistema de
información, los formatos, procedimientos, indicadores y demás elementos necesarios para la
regulación, integración, registro y análisis de la deuda pública. De igual forma se carece de
esquemas de transparencia y asequibilidad en la información de obligaciones y pasivos
financieros en las entidades federativas y municipios.
Es previsible que con la Ley General de Contabilidad Gubernamental y sus recientes reformas
pueda haber un mejor control de la deuda subnacional, toda vez que mandata al Congreso de la
Unión a aprobar las modificaciones que sean necesarias al marco jurídico para reformar los
registros de deuda pública actuales con la finalidad de transparentar todas las obligaciones de
pago a cargo de la Federación, las entidades federativas y municipios.
28
Dicha ley establece la obligación de que los gobiernos locales incluyan en sus respectivas leyes
de ingresos y presupuestos de egresos: Las obligaciones de garantía o pago causante de deuda
pública. Otro dato relevante de la deuda subnacional es que la deuda con la banca comercial
representa más del 65% del total. En ese sentido la mayoría de las acotaciones y precisiones
jurídicas que se requieren en materia de deuda deben hacerse a efecto de regular la relación de
los gobiernos locales con las instituciones de banca múltiple.
Es indispensable en principio que previamente al otorgamiento de un crédito, se conozca si la
deuda tendrá relación o no con obras públicas que generen ingresos o garanticen a la vez cierto
nivel de desarrollo del estado o municipio. Para ello los gobiernos y los bancos deben modificar,
por un lado, las leyes de deuda pública y por otro, los requisitos para el otorgamiento de
créditos. De igual manera es indispensable que se establezcan sanciones, locales e incluso
federales cuando la eventual afectación al erario público se dé en el ámbito de la coordinación
fiscal.
6. What is your assessment of the Government's capacity in terms of tax collection, treasury
management, budget execution, accounting and auditing?
General comments
Government capacity is sorely lacking in all of these areas in many countries. As a result, funds
directed to increasing these capacities—depending upon the context, the facts of the situation,
etc.—could be considered necessary to help fulfill a government’s human rights obligation.
Response from Brazil
The federal government is relatively transparent concerning budget issues (Brazil occupies the
12th position on International Budget Partnership – IBP OBI – Open Budget Index). It is has good
capacities to collect, execute and audit the budget.
But it still has a lot to improve regarding transparency and social spending as well as
implementing tax reform. It has also to improve in implementing an HR framework to monitor
tax collection and budget spending. Otherwise it will be impossible to continue presenting good
results concerning poverty and inequality, remembering that the country is still one of the most
unequal in the world.
Response from Mexico
Como se adelantó en las preguntas anteriores, existen diversas acciones a nivel federal que han
mejorado tanto la calidad del gasto público como la progresividad del régimen fiscal. Sin
embargo, el Estado mexicano no cuenta con los recursos suficientes para hacer frente a sus
obligaciones de derechos humanos, lo cual es evidente ante el número de personas en
condiciones de pobreza y pobreza extrema que difícilmente pueden gozar de los niveles básicos
de bienestar.

29
Desde 2008 también se ha implementado una reforma importante en materia de armonización
contable que tiene como objetivo hacer compatibles y comparables las cuentas nacionales y las
de los gobiernos subnacionales. Esta reforma contempla mecanismos de transparencia y
rendición de cuentas que deben ser implementados por las dependencias del gobierno federal y
de los estados y municipios a partir de diciembre de 2013.
Response from South Africa
Although spending in health and education has increased substantially over the last decade,
equitable access to quality public health and education remains a challenge for the majority of
poor citizens. Poor public school and health infrastructure as well as shortages of education and
health care professionals perpetuate inequalities. While funding has been increased to deal with
school and health infrastructure and personnel backlogs, provincial education departments,
particularly in the Eastern Cape and Limpopo provinces, have not been able to improve
conditions, mostly because of under spending, misallocation and under performance in
Education and Health Infrastructure Grants.
This is further compounded by a lack of monitoring by oversight bodies and failure by them to
hold public officials accountable along with a failure by provincial Health and Education
Departments to provide clear plans for improving performance and expenditure.
There is also a lack of financial management and monitoring skills at the provincial and local
level to ensure consultative planning and efficient execution of budgets.
All provincial departments and entities alongside local government municipalities are audited
annually by the Office of the Auditor General, which is solely accountable to Parliament.
Legislation requires that the annual audit reports be made publicly available within a reasonable
time after having been tabled before provincial legislatures and municipal councils. The
Auditor-General’s website is regularly updated with annual audit reports as and when they are
completed, tabled and subsequently made publicly available.
Internal audit capacity remains a significant challenge in many government departments of
South Africa, which display either an unwillingness or inability to recruit and retain skilled
personnel to fulfill critical financial management responsibilities. The Office of the Auditor-
General often raises serious concerns regarding these problems in his/her annual audit of
departments, entities and municipalities. Remedying this recurrent problem will require
improved leadership by both political and administrative heads of government.