The Human Oculomotor System
141
The Human Oculomotor System A clinical, physiological and methodological study of voluntary eye movements ELINA ISOTALO HELSINKI 1999
Transcript of The Human Oculomotor System
The Human Oculomotor System
A clinical, physiological and methodological
study of voluntary eye movements
ELINA ISOTALO
HELSINKI 1999
From the Department of Otorhinolaryngology, Head and Neck
Surgery, Helsinki University Central Hospital, Helsinki, Finland
The Human Oculomotor System
A clinical, physiological and methodological
study of voluntary eye movements
ELINA ISOTALO
Academic dissertation
To be presented with the consent of the Medical Faculty of the University of
Helsinki for public examination in the Auditorium of the Otolaryngological
Hospital, Haartmaninkatu 4 E, Helsinki, on December 3rd, 1999
at 12 o'clock noon.
HELSINKI 1999

2
ISBN 951-45-9002-3 (PDF version)©Elina Isotalo
Helsingin yliopiston verkkojulkaisut
Helsinki 2000

3
To patients
5
Supervised by:
Professor Ilmari Pyykkö, M.D.,
Department of Otolaryngology,
Karolinska Hospital,
Stockholm, Sweden
and
Professor Martti Juhola, Ph.D.,
Department of Computer Science ,
University of Tampere,
Tampere, Finland
Reviewed by:
Docent Ville Jäntti, M.D.,
Department of Clinical Neurophysiology,
Oulu University Central Hospital,
Oulu, Finland
and
Docent Kirsi Setälä, M.D.,
Department of Ophthalmology,
Helsinki University Central Hospital,
Helsinki, Finland
Opponent:
Docent Lycyna Schalén, M.D.,
Department of Otolaryngology,
Lund University Hospital,
Lund, Sweden

6
C O N T E N T S
ABBREVIATIONS . . . . . . . . . . . . . . . . . . . . . . . . . . . . . . . . . . . . . . . . 9
1. INTRODUCTION . . . . . . . . . . . . . . . . . . . . . . . . . . . . . . . . . . . . . . . . . 10
2. REVIEW OF THE LITERATURE . . . . . . . . . . . . . . . . . . . . . . . . . . . 11
2. A. Anatomical and physiological aspects of voluntary eye movements
in primates . . . . . . . . . . . . . . . . . . . . . . . . . . . . . . . . . . . . . . . . . . 11
2. A. 1. Saccadic eye movements . . . . . . . . . . . . . . . . . . . . . . . . . . . . . 11
2. A. 2. Pursuit eye movements . . . . . . . . . . . . . . . . . . . . . . . . . . . . . . . 14
2. A. 3. Supratentorial representation of voluntary eye movements . . . . 16
Intracortical connections, and connections to cerebellum
and brain stem . . . . . . . . . . . . . . . . . . . . . . . . . . . . . . . . . . . . . . 17
2. A. 4. Cerebellum . . . . . . . . . . . . . . . . . . . . . . . . . . . . . . . . . . . . . . . . 19
2. A. 5. Brain stem . . . . . . . . . . . . . . . . . . . . . . . . . . . . . . . . . . . . . . . . 23
2. B. Aging and voluntary eye movements . . . . . . . . . . . . . . . . . . . . . . . . . . 28
2. C. Measurement of voluntary eye movements . . . . . . . . . . . . . . . . . . . . 29
2. C. 1. Recording techniques . . . . . . . . . . . . . . . . . . . . . . . . . . . . . . . . . 29
2. C. 2. Stimulation techniques . . . . . . . . . . . . . . . . . . . . . . . . . . . . . . 31
2. C. 3. Analysis techniques and computer systems, filtering,
and sampling frequency . . . . . . . . . . . . . . . . . . . . . . . . . . . . . . . . . 32
2. C. 4. Consistency of voluntary eye movements . . . . . . . . . . . . . . . . . . 34
2. C. 5. Prediction of stimulus and voluntary eye movements . . . . . . . . 34
2. D. Voluntary eye movements in normal subjects . . . . . . . . . . . . . . . . . 35
2. D. 1. Normal saccades . . . . . . . . . . . . . . . . . . . . . . . . . . . . . . . . . . . . 35
2. D. 2. Normal pursuit eye movements . . . . . . . . . . . . . . . . . . . . . . . . . 36
2. D. 3. Effect of environmental factors on voluntary eye movements . . . 37
2. E. Voluntary eye movements and disease . . . . . . . . . . . . . . . . . . . . . . . . 38
2. E. 1. Pathophysiological aspects of voluntary eye movements . . . . . . . 38
2. E. 2. Voluntary eye movements in some specified disorders: . . . . . . . . 41
a) Menière’s disease . . . . . . . . . . . . . . . . . . . . . . . . . . . . . . . . . . . . . 41
b) Cerebello-pontine angle tumors . . . . . . . . . . . . . . . . . . . . . . . . . . 42
c) Hemangioblastomas . . . . . . . . . . . . . . . . . . . . . . . . . . . . . . . . . . . 46
d) Infarction of cerebello-brain stem . . . . . . . . . . . . . . . . . . . . . . . . . 47
2. F. Diagnostic aspects . . . . . . . . . . . . . . . . . . . . . . . . . . . . . . . . . . . . . . 50
2. G. Knowledge-based systems, decision tree analysis and
oculomotor deficits . . . . . . . . . . . . . . . . . . . . . . . . . . . . . . . . . . . . . 52
3. PURPOSE OF THE STUDY . . . . . . . . . . . . . . . . . . . . . . . . . . . . . . . . 54
4. SUBJECTS AND METHODS . . . . . . . . . . . . . . . . . . . . . . . . . . . . . . . 55
4. A. Subjects . . . . . . . . . . . . . . . . . . . . . . . . . . . . . . . . . . . . . . . . . . . . . . . 55
4. A. 1. Control subjects . . . . . . . . . . . . . . . . . . . . . . . . . . . . . . . . . . . . 55
7
a. Normative data . . . . . . . . . . . . . . . . . . . . . . . . . . . . . . . . . . . . . . . 55
b. Aging . . . . . . . . . . . . . . . . . . . . . . . . . . . . . . . . . . . . . . . . . . . . . . 55
c. Gender . . . . . . . . . . . . . . . . . . . . . . . . . . . . . . . . . . . . . . . . . . . . 55
d. Side difference . . . . . . . . . . . . . . . . . . . . . . . . . . . . . . . . . . . . . . . 55
e. Repeatability . . . . . . . . . . . . . . . . . . . . . . . . . . . . . . . . . . . . . . . . 55
f. EOG and MOG measurement . . . . . . . . . . . . . . . . . . . . . . . . . . . . 56
4. A. 2. Patients . . . . . . . . . . . . . . . . . . . . . . . . . . . . . . . . . . . . . . . . . . . 56
a. Menière’s disease . . . . . . . . . . . . . . . . . . . . . . . . . . . . . . . . . 56
b. Operated cerebello-pontine angle tumors . . . . . . . . . . . . . . . . . . . 57
c. Operated hemangioblastoma . . . . . . . . . . . . . . . . . . . . . . . . . . . . . 59
d. Infarctions of the cerebello-brain stem . . . . . . . . . . . . . . . . . . . . . . 59
4. B. Equipment and program. . . . . . . . . . . . . . . . . . . . . . . . . . . . . . . . . . . . 60
4. B. 1. Recording methods . . . . . . . . . . . . . . . . . . . . . . . . . . . . . . . . . . . 60
4. B. 2. Stimulus . . . . . . . . . . . . . . . . . . . . . . . . . . . . . . . . . . . . . . . . 61
4. B. 3. Equipment and signal analysis . . . . . . . . . . . . . . . . . . . . . . . . . 62
a. Saccades . . . . . . . . . . . . . . . . . . . . . . . . . . . . . . . . . . . . . . . . . . . . 64
b. Pseudo-random pursuit eye movements . . . . . . . . . . . . . . . . . . . . 64
4. C. Parameters analyzed in the eye movement tests . . . . . . . . . . . . . . . . 65
4. C. 1. Saccades. . . . . . . . . . . . . . . . . . . . . . . . . . . . . . . . . . . . . . . . . . . . 65
4. C. 2. Pseudo-random pursuit eye movements . . . . . . . . . . . . . . . . . . . 65
4. D. Test conditions. . . . . . . . . . . . . . . . . . . . . . . . . . . . . . . . . . . . . . . . . . . 65
4. E. The site of lesion and voluntary eye movement deficits . . . . . . . . . . . . 66
4. F. Decision tree analysis . . . . . . . . . . . . . . . . . . . . . . . . . . . . . . . . . . . . . . 66
4. G. Statistical analysis . . . . . . . . . . . . . . . . . . . . . . . . . . . . . . . . . . . . . . . 67
5. RESULTS . . . . . . . . . . . . . . . . . . . . . . . . . . . . . . . . . 69
5. A. Control subjects. . . . . . . . . . . . . . . . . . . . . . . . . . . . . . . . . . . . . . . . . . . 69
5. A. 1. Normative data. . . . . . . . . . . . . . . . . . . . . . . . . . . . . . . . . . . . . . . 69
5. A. 2. Aging and voluntary eye movements . . . . . . . . . . . . . . . . . . . . . . . 69
5. A. 3. Gender and voluntary eye movements . . . . . . . . . . . . . . . . . . . . . 71
5. A. 4. Side difference and saccades. . . . . . . . . . . . . . . . . . . . . . . . . . . . . 71
5. A. 5. Repeatability of pseudo-random pursuit eye movements . . . . . . . 72
5. A. 6. Voluntary eye movements recorded by EOG and MOG methods . . 72
5. B. Patients . . . . . . . . . . . . . . . . . . . . . . . . . . . . . . . . . . . . . . . . . . . . . . . . 74
5. B. 1. Menière’s disease . . . . . . . . . . . . . . . . . . . . . . . . . . . . . . . . . . . . . 74
5. B. 2. Operated cerebello-pontine angle tumor . . . . . . . . . . . . . . . . . . . . 75
5. B. 3. Operated hemangioblastoma . . . . . . . . . . . . . . . . . . . . . . . . . . . . 76
5. B. 4. Infarction of cerebello-brain stem . . . . . . . . . . . . . . . . . . . . . . . . . 77
5. C. Control subjects and patient groups . . . . . . . . . . . . . . . . . . . . . . . . . . . 81
5. C. 1. Differences in voluntary eye movements between control
subjects and patients . . . . . . . . . . . . . . . . . . . . . . . . . . . . . . . . . 81
a. Saccades . . . . . . . . . . . . . . . . . . . . . . . . . . . . . . . . . . . . . . . . . . . . . 81
8
b. Pseudo-random pursuit eye movements . . . . . . . . . . . . . . . . . . . . . 84
5. C. 2. Discriminatory power of voluntary eye movements of patients
and control subjects . . . . . . . . . . . . . . . . . . . . . . . . . . . . . . . . . 87
5. C. 3. The site of lesion and voluntary eye movement deficits . . . . . . . . 89
5. C. 4. Decision tree analysis and oculomotor deficits . . . . . . . . . . . . . . . 93
6. DISCUSSION . . . . . . . . . . . . . . . . . . . . . . . . . . . . . . . . . . 96
6.1. General comments . . . . . . . . . . . . . . . . . . . . . . . . . . . . . . . . . . . . . . . . 96
6.2. Voluntary eye movements in normal subjects . . . . . . . . . . . . . . . . . . . 96
6. 3. Age and the oculomotor system . . . . . . . . . . . . . . . . . . . . . . . . . . . . . . 98
6. 4. Gender and voluntary eye movements . . . . . . . . . . . . . . . . . . . . . . . . . 102
6. 5. Laterality and saccades . . . . . . . . . . . . . . . . . . . . . . . . . . . . . . . . . . . 102
6. 6. Methodological aspects . . . . . . . . . . . . . . . . . . . . . . . . . . . . . . . . . . . 104
a. Repeatability of pseudo-random pursuit eye movement tests . . . . . . . 104
b. Differences of voluntary eye movements recorded by EOG
and MOG methods . . . . . . . . . . . . . . . . . . . . . . . . . . . . . . . . . . . . 105
6. 7. Physiological aspects . . . . . . . . . . . . . . . . . . . . . . . . . . . . . . . . . . . . . 106
a. Prediction of stimulus and saccadic eye movements . . . . . . . . . . . . . . . 106
b. Effect of different frequency combinations on pseudo-random
pursuit eye movements . . . . . . . . . . . . . . . . . . . . . . . . . . . . . . . . 107
6. 8. Voluntary eye movements and severity of the disease in patients with . . 108
a. Menière’s disease . . . . . . . . . . . . . . . . . . . . . . . . . . . . . . . . . . . . . . . 108
b. Operated cerebello-pontine angle tumor . . . . . . . . . . . . . . . . . . . . . 109
c. Operated hemangioblastoma and subsequent oculomotor deficits . . . 111
d. Infarction of cerebello-brain stem and subsequent oculomotor deficits 112
e. MRI findings and oculomotor deficits in operated hemangioblastomas,
and infarction of cerebello-brain stem . . . . . . . . . . . . . . . . . . . . . 112
6.9. Site of lesion and voluntary eye movement deficits . . . . . . . . . . . . . 115
6.10. Decision tree analysis and oculomotor deficits . . . . . . . . . . . . . . 117
7. CONCLUSIONS . . . . . . . . . . . . . . . . . . . . . . . . . . . . . . . . . . . . . . . . 119
8. SUMMARY . . . . . . . . . . . . . . . . . . . . . . . . . . . . . . . . . . . . . . . . 121
9. ACKNOWLEDGMENTS . . . . . . . . . . . . . . . . . . . . . . . . . . . . . . . . . 123
10. REFERENCES . . . . . . . . . . . . . . . . . . . . . . . . . . . . . . . . . . . . . . . . . 125
9
A B B R E V I A T I O N S
ABR = auditory brain stem response
AICA = anterior inferior cerebellar artery
ANOVA = analysis of variance
CNS = central nervous system
CPA = cerebello-pontine angle
CT = computerized tomography
DLPN = dorsolateral pontine nucleus
EEG = electroencephalography
EMG = electromyography
ENG = electronystagmography (including caloric test, saccades, pursuit and
different nystagmus tests)
EOG = electro-oculography
FEF = frontal eye field
GA = gain by amplitude
Gd-DTPA = the gadolinium product used in MRIs with gadolinium enhancement
GLM = general linear model
HAB = hemangioblastoma
IO = inferior olive
IROG = infra-red oculography
LED = light emitting diode
MOG = magneto-oculography, the electromagnetic search coil technique
MRI = magnetic resonance imaging
NF2 = neurofibromatosis type 2
PICA = posterior inferior cerebellar artery
PEM = pursuit eye movement
PPRF = paramedian pontine reticular formation
PRPEM = pseudo-random pursuit eye movement
PTA = pure tone average
riMLF = rostral interstitial nucleus of medial longitudinal fasciculus
SA = saccadic accuracy
SD = standard deviation
SPV = saccadic peak velocity
SRT = saccadic reaction time
VOG = video-oculography
10
1. I N T R O D U C T I O N
Vertigo, dizziness, disequilibrium and loss of balance are common complaints of
vestibular system disorders. The vestibular system controls spatial orientation and
upright stance. Its symptoms can be peripheral in origin, affecting the vestibular end
organ or nerve, or it may be central in origin, affecting the pathways traversing in
multiple locations of the central nervous system (CNS).
Saccades are fast eye movements that are used when gazing at different objects,
scanning the horizon, or when bringing targets of interest onto the fovea. Their
function is to move the eyes so that a new target of interest will be seen on the fovea.
Pursuit eye movements (PEMs) are slow eye movements used to monitor a moving
target constantly by utilizing a negative visual feedback (Robinson 1965; Robinson
1981; Pyykkö and Schalén 1982; Leigh and Zee 1983b). The velocity of PEMs matches
the velocity of a target of interest. Vision remains clear throughout the movement, and
the image of the moving object is attended and kept on the fovea. The trajectories of
voluntary eye movements travel commonly through the same neural circuitries as
those of the central vestibular system (Gilman et al. 1981; Ito 1984). Disorders of the
vestibular system can also affect the oculomotor system.
Disorders causing vertigo can be vascular (Fisher 1967), inflammatory (Jackson
and Nissen 1993), autoimmunologic (McCabe 1979), traumatic (Rubin et al. 1993),
iatrogenic (Goodhill and Harris 1993; Rubin et al. 1993), metabolic (Rubin et al. 1993),
or can be caused by neoplasms of the cerebello-pontine angle, or other parts of
posterior fossa (Wennmo 1982; Nedzelski 1983; Constans et al. 1986; Selesnick and
Jackler 1992; Selesnick et al. 1993; Resche et al. 1993; Jackler 1994). In many
instances, the oculomotor tests can be used to reveal the site of the lesion.
This study focuses on the accuracy of voluntary eye movements to reveal certain
diseases affecting the peripheral or central vestibular system and the central
oculomotor system. Because voluntary eye movements are used to exclude central
causes of vertigo, it is important to know the discriminatory power of voluntary eye
movement deficits in certain lesions. Methodological and physiological aspects and
the vulnerability of the oculomotor system are also studied. This work focuses only on
the horizontal saccadic eye movements and PEMs.

11
2. R E V I E W O F T H E L I T E R A T U R E
2. A. Anatomical and physiological aspects of voluntary eye movements in
primates
2. A. 1. Saccadic eye movements
The programming of the saccades consists of a pulse and a step (Robinson 1964;
Optican and Robinson 1980; Optican et al. 1986; Robinson et al. 1990). To create the
needed change in neural activity (determined by step) for the new eye position
(Westheimer 1954a), a saccadic velocity and metric command (determined by pulse) is
generated in the reticular formation (Luschei and Fuchs 1972; Keller 1974; Hoyt and
Frisen 1975; Henn and Cohen 1976; Hepp and Henn 1983). The frequency and
duration of the neural discharge (controlled by pulse) determine the velocity and
duration of a saccade, and determine the amplitude of a saccade (Optican and
Robinson 1980). Thus, the pulse command is used to move the eye to a new position
(Robinson 1964; Robinson 1970; Optican and Robinson 1980; Robinson 1981; Fuchs
et al. 1985), while the step command is responsible for maintaining the eyes at the
new position (Robinson 1964; Robinson 1970; Fuchs and Luschei 1970; Schiller
1970; Optican and Robinson 1980; Robinson 1981; Fuchs et al. 1985). After the
saccade, a new steady-state firing frequency is achieved (Robinson 1964; Robinson
1970; Fuchs and Luschei 1970; Schiller 1970; Optican and Robinson 1980; Robinson
1981; Fuchs et al. 1985). The pulse command is related to the number of spikes in
burst neurons of paramedian pontine reticular formation (PPRF) (Henn and Cohen
1976; Hepp and Henn 1983). The step change command is related to the so-called
tonic neurons in PPRF (Keller 1974). According to Becker and Fuchs (1969), saccadic
eye movements, in general, exhibit highly reproducible trajectories.
A glissade is the final process where the eye finally slides to the predetermined
position (Robinson 1964; Fuchs and Luschei 1970). It occurs when the pulse is too
small or too large for the demanded amplitude change. This causes the saccade to be
hypo- or hyper-metric and to glide (Weber and Daroff 1971; Weber and Daroff 1972;
Optican and Robinson 1980). Bilateral ablations of the flocculi and portions of
paraflocculi severely impair the mechanism that suppresses the glissade, and
flocculectomized animals also fail to adapt to optically imposed post-saccadic slip
(Optican et al. 1980; Optican et al. 1986). It seems that the flocculus and/or
paraflocculus are necessary for the successful suppression of the glissade (Optican et
al. 1986).
12
According to Zee et al. (1976a), normal saccades may be produced by a neural network
that computes a position in the orbit to which the eye is driven, rather than a distance the
eye is moved. The brain is known to be capable of making saccades to a head coordinate
system when there is no retinal error (Zee et al. 1976a). Target position in space (i.e.,
target position with respect to the head) can be calculated by adding eye positions in the
orbit to retinal error (Zee et al. 1976a). Normal saccades may not necessarily be ballistic or
preprogrammed, but only seem to be such because of high velocities and brief durations
(Zee et al. 1976a). It appears that the cerebellum, and particularly the vermis, participates
in the modulation of the amplitude of saccades (Zee et al. 1976b). In order to make
accurate saccades, the brain must compute the position of the target of interest with
respect to the position of the head in space (Zee et al. 1976a). The degree and magnitude
of saccade dysmetria may depend upon the initial position of the eye in the orbit (Zee et al.
1976b). It seems that the miscalculation causing dysmetria operates on both retinal error
and its visual recall, which is why dysmetria probably occurs in lesions of immediate pre-
motor circuits of the CNS (Zee et al. 1976b).
A visual position error signal is used to elicit the oculomotor response, and this signal
can be stored for about 350 ms (Becker and Fuchs 1969). The estimation of visual error is
concluded about 75-100 ms before the execution of a saccade (Wheeless et al. 1966;
Becker and Fuchs 1969). According to Wheeless et al. (1966), the eye has a 32% chance of
altering its response if the target change occurs 85 ms before a saccade. If the target
change occurs 185 ms before the saccade, the eye has a 75-80% chance to alter its
response (Wheeless et al. 1966). In some instances, the saccades can be interrupted or
can be generated with short saccadic reaction times (SRTs) (Fischer and Boch 1983). The
distribution of SRT in monkeys has been found to have a first peak at about 70 ms and a
second peak at about 140ms. The first peak was called “express saccades” and the
second peak was thought to be “regular” saccades (Fischer and Boch 1983).
Express saccades have also been found in humans, with the SRT of about 100 ms
(Fischer and Ramsperger 1984). According to Kalesnykas and Hallet (1987), the express
saccades have an SRT of 110-160 ms and the anticipatory saccades have an SRT of <110
ms. In their studies, the combination of directional errors and amplitude errors provided a
definition of what an anticipatory saccade and a visually-guided saccade is in any given
subject (Kalesnykas and Hallet 1987).
Saccades larger than 15° are usually hypometric, consisting of a primary
hypometric saccade and a corrective saccade addition (Becker and Fuchs 1969). In
saccades, there is a presaccadic drift, typically attributed to expectation (Lemij and
Collewijn 1989). The presaccadic drift varies from 0.4 to 1.5°, and it is in the direction
of the next target position, prior to movement of the target (Lemij and Collewijn 1989).
Bahill et al. (1975b), demonstrated that about 70% of horizontal saccadic eye
movements of 0 - 20º amplitude in normal control subjects have dynamic overshoot,
and that 5% of these horizontal saccades have dynamic undershoot. The eye has
13
overshoot when it travels beyond its final position and then returns to the opposite
direction, and the dynamic overshoot is the most common of the overshoot types
(Bahill et al. 1975b). Dynamic overshoot occurs when a primary saccade is followed
by a smaller rapid saccade in the opposite direction, with no delay (Bahill et al.
1975a). Dynamic overshoot is 0.15-0.5º on average (Bahill et al. 1975b; Kapoula et al.
1986). The saccadic commands to each eye must, to some extent, be different,
because the dynamic overshoot in one eye is seen in normal subjects (Kapoula et al.
1986).
About models of saccadic eye movements
According to Westheimer (1954b), the saccadic system was ballistic. He found that
the saccadic system could react to only one stimulus at a time, and there was a
refractory period after the first, during which a second saccade could not be initiated.
According to Young and Stark (1963), the type of behavior seen in Westheimer’s
experiments could be considered as a sampled data system. The visual information
(retinal error) is sampled, then the size, direction and duration of the upcoming
saccade is calculated, and a decision to make a saccade is made (Young and Stark
1963). A preprogrammed saccadic command is then generated based upon the visual
information that has been acquired during the initial visual sample (Young and Stark
1963). According to Young and Stark (1963), information about the visual world is
again sampled, once the saccade is completed, in order to find if a correcting saccade
is needed.
However, in later studies it has been discovered that visual information can be
continuously acquired and used to modify the initial saccade until just about 70 ms
before the movement begins (Wheeless et al. 1966; Becker and Jürgens 1979; Ottes et
al. 1984). This has been found in experiments where the so-called double-step
stimulus has been used. In the condition of double-step stimulus where there is no
obligatory refractory period, two saccades can occur with virtually no intersaccadic
interval. It has also been found that when there is a two-dimensional double-step
stimulus, normal subjects can make a single curved saccade (van Gisbergen et al.
1987). This indicates that the saccade trajectory has been modified in flight with
these cases (van Gisbergen et al. 1987).
According to present knowledge, saccadic eye movements are not ballistic in
type. A local feedback system controls the saccadic size. An internal negative
feedback loop controls the discharge of burst neurons, which intern determines the
amplitude of the saccadic pulse (Robinson 1975; Zee et al. 1976a). This occurs by
comparing continuously the desired eye position signal and the actual eye position.
The neurons of saccadic pulse generator are driven until the eye reaches the target
14
(Robinson 1975; Zee et al. 1976a). At this point, the neurons stop discharging
(Robinson 1975; Zee et al. 1976a). To this model, new concepts were later added
(Carpenter 1988; Jürgens et al. 1981; McKenzie and Lisberger 1986; Scudder 1988).
The input and output of the final common integrator are summed to generate the
pulse-step, and consequently, the motor neuron activity required to produce a saccade
(Carpenter 1988). The output of the integrator which is also an internal
representation of the position of the eye at any moment, is compared with a signal
carrying the target position, i.e. the desired eye position (Carpenter 1988). The
difference between these two constitutes a motor error signal (Carpenter 1988). In
real saccades, however, the saccadic pulse is abruptly switched on and off, so the
model could be called a bang-bang model of saccadic generation (Carpenter 1988).
Jürgens et al. (1981); McKenzie and Lisberger (1986); Scudder (1988) added to
the local feed-back model a concept that the command signal is most likely the
desired change in eye position. There seems to be two separate integrators, one
common integrator for conversion of eye velocity signal to eye position commands (for
all types of eye movements) and a separate neural network to integrate saccadic
velocity commands for use in the feedback loop controlling the duration of the
saccadic pulse command (Jürgens et al. 1981; Sparks et al. 1987; Sparks and Mays
1990).
Moreover, it seems clear that saccades are influenced by parallel cognitive
processing in complicated ways right up to and possibly during the time of their
execution (Robinson 1981). The different models are incomplete, and may require
modifications, alterations and additions.
2. A. 2. Pursuit eye movements
Once the moving target is at the fovea, the image is stabilized on the retina by the
PEM and vestibular system. According to Leigh and Zee (1983b), and Versino and
Cosi (1990), the PEM system conducts three tasks: 1) continuous visualization of
target moving in a stable visual environment, 2) suppression of vestibulo-ocular reflex
during eye tracking, and 3) image stabilization during fixation. In different situations
this involves vestibulo-ocular reflex system, and optokinetic system (Zee et al. 1974;
Mack et al. 1982). Any impairment in PEM involves all three functions (Versino and
Cosi 1990).
The PEM is triggered to movement of a target of interest by measuring the retinal
error velocity (Rashbass 1961; Young and Stark 1963). Changes of target position can
also trigger PEMs (Pola and Wyatt 1980). The reaction time of PEM system to random
moving targets is approximately 100 ms in monkeys (Lisberger and Westbrook 1985),
and 125 ms in humans (Becker and Fuchs 1985). Frontal eye field (FEF) seems to
15
play a role in predictive PEMs (Keating et al. 1985; Keating 1991). When humans
track predictable targets, they quickly lock onto the target movement and are able to
track it without any latency (Bahill et al. 1980). Humans appear to try to anticipate
the future path of moving targets in PEMs (Kowler 1989). Their behavior suggests that
they create an internal model of the target movement, and then track the output of
this model, rather than the actual visual target (Bahill et al. 1980, Kowler 1989).
Higher order CNS processes are presumably used in this internal model, to analyze
the target movement and to predict future target positions (Bahill et al. 1980; Kowler
1989).
The neural reconstruction of the target velocity signal with respect to the
environment requires information about target slip on the retina, eye velocity on the
head, and in case of vestibulo-ocular reflex, head velocity with respect to the
environment (Young 1977). In the control of PEM, the perception also influences by
selecting the visual target (Mack et al. 1982).
About models of pursuit eye movements
PEM system uses continuous negative visual feedback to reduce the retinal error
velocity during pursuit (Robinson 1965). The difference between target velocity and
eye velocity is the error velocity signal in the model by Robinson (1965). The so-called
open-loop (internal) gain/amplification factor determines the velocity of the resulting
PEM (Leigh and Zee 1983b). The overall gain of the PEM system in this model is a
closed-loop gain (Leigh and Zee 1983b).
In another model, the stimulus to the PEM system is not the retinal error velocity,
but an internal representation of the motion of the target in space (Yasui and Young
1975). This representation is obtained by combining retinal error velocity with an eye
velocity signal based on monitoring of efferent commands (= efference copy; corollary
discharge) (Yasui and Young 1975).
Robinson (1981) considers that although the main stimulus for pursuit is the
velocity of image slip on the retina, the PEM system also responds to the position of the
target with respect to the fovea.
According to Carpenter (1988), PEM is primarily a function of retinal slip/error
velocity. He considers that the closed-loop or open-loop models of PEM studies have
defects, therefore, these models cannot explain PEMs in all different conditions.
Lisberger and Westbrook (1985) have studied the whole trajectory of PEMs. They
found that by looking at the first 100ms of pursuit of a target that suddenly starts to
move (which implies an effective open-loop response, since there is no time for visual
feedback) shows that there are two components of response. In the first 20 ms, the
acceleration of the eye is constant and unrelated to any aspect of the stimulus
16
(Lisberger and Westbrook 1985). Thereafter, the acceleration of the eye is strongly
dependent on the position and velocity of the target, and on the background (Lisberger
and Westbrook 1985). The models of PEM are defective, and subject to alterations and
modifications.
2. A. 3. Supratentorial representation of voluntary eye movements
During PEM and visually evoked saccades, neurons in area 7 of the posterior parietal lobe
are active (Lynch et al. 1977). The neurons are active during visual attention, and they
contain neural circuits for focusing the object of interest (Lynch et al. 1977). It is likely that
area 7 is not solely sensory or motor, but is involved in higher order aspects of sensory-
motor integration (Andersen et al. 1987). The findings of Lynch et al. (1977) underlined
that area 7 could be a mechanism for the selection of objects of interest. Both the eye
position and eye movement signals of these neurons might be important in establishing or
maintaining perceptual stability of space, and in providing the motor systems with the
head-centered coordinates of targets that are necessary for calculating the correct
trajectories of eye (Andersen et al. 1987). Robinson et al. (1978), reported that area 7 in
primates is related to visual attention, and in this context is also related to movement.
According to Bruce and Goldberg (1985), FEF such as Broadman area 8, has an
important role in generating voluntary eye movements. Visual activity of FEF may provide
targets for visually guided saccades (Bruce and Goldberg 1985). FEF is involved in the
processes of saccade generation (Bruce and Goldberg 1985; Deng et al. 1984). Goldberg
and Robinson (1977) proposed that neurons in FEF and area 7 of the parietal lobe signal
the presence of an important stimulus in the visual environment. According to Luria et al.
(1966), in frontal lobe lesions the active control of eye movements is disturbed. Patients
with a frontal lobe lesion have difficulties with attention span and their visual attention
can be easily disturbed (Luria et al. 1966; Pyykkö et al. 1984). According to Pyykkö et al.
(1984), FEF seems to govern the “preprogramming” of voluntary eye movements, therefore,
a FEF lesion leads to difficulties in initiation of oculomotor tasks. In FEF, there are also
neurons responding to fixation of foveal visual stimuli and to PEM (Bruce and Goldberg
1985; Bruce et al. 1985). Patients with frontal lobe lesions can have pursuit deficits (Luria
et al. 1966; Henriksson et al. 1981). According to Keating (1991), FEF ablations or lesions
with cooling, impair predictive pursuit and degrade visually guided foveal pursuit of all
targets.
A small population of FEF cells encodes the current eye position in PEM (Bruce and
Goldberg 1985). A FEF lesion transiently impairs predictive and visually guided PEM, and
PEM appears to be more vulnerable to lesions than saccades (Keating 1991).
Saccadic eye movements have been found to be elicited by delicate, well-defined and
restricted electrical stimulation of FEF (Robinson and Fuchs 1969), and FEFs have been
found to have transcallosal connections (Künzle and Akert 1977; Bruce and Goldman-
Rakic 1984). The callosal innervation is columnar, and the organization of saccade
directions parallels the anatomical columns (Bruce and Goldman-Rakic 1984). Vertical
saccades are thought to involve FEF bilaterally, whereas horizontal saccades are directed
17
into the contralateral field (Bruce and Goldman-Rakic 1984). Three types of presaccadic
activity in neurons are observed; 1) activity linked to visual targeting, 2) activity related to
movement of the eyes, and 3) anticipatory activity for target selection. A given neuron can
have any or all three of these activities (Bruce and Goldberg 1985; Bruce et al. 1985).
Cells of FEF associated with saccades are more or less topographically arranged (Bruce et
al. 1985). Combined lesions of FEF and superior colliculus have a devastating effect on
the saccadic eye movements, by reducing the frequency and range (Schiller et al. 1980). A
lesion on either of these sites alone has a subtle affect (Schiller et al. 1980).
FEF does not appear to be involved in the generation of the express saccades of monkey
(Schiller et al. 1987). However, according to Mayfrank et al. (1986), both FEF and area 7
seem to be necessary for the generation of express saccades in humans.
Hubel and Wiesel (1962; 1965) found that the visual cortex of cat has activity related to
saccades and PEM. In the development of visual cortex, the visual experience in infancy
plays an important role (Tychsen and Lisberger 1986). Humans who had treated or
untreated strabismus early in life, have deficits in the perception of depth using binocular
cues (Mohindra et al. 1985). The magnitude of the PEM deficits is correlated with the
severity of strabismus in adults who have had monocular fixation since infancy due to
strabismus (Tychsen and Lisberger 1986). The deficits are apparent in the perception of
target motion (Tychsen and Lisberger 1986). These deficits may be due to the
maldevelopment of visual motion processing in the visual cortex or its pathways. These
pathways provide signals that are used for both the perception of motion and the initiation
of PEMs (Tychsen and Lisberger 1986).
After removal of striatal cortex, the monkeys at first appear to be completely blind (Zee
et al. 1987). But after a recovery time the monkeys regain their ability to make visually
guided saccades and PEMs to small targets (Zee et al. 1987). However, this happens with
increased saccadic or pursuit reaction times, increased variability of saccadic amplitudes,
and more variable and erroneous trajectories of PEM (Zee et al. 1987). In these instances,
the monkey uses extrastriate pathways to generate more volitional types of visual-ocular
motor behavior, such as PEM and saccades (Zee et al. 1987).
It seems that superior temporal sulcus might contribute to the visual orientation system
with posterior parietal and frontal cortical mechanisms (Luh et al. 1984). Middle temporal
visual area is important for the initiation and maintenance of foveal pursuit (Newsome et
al. 1985; Dürsteler et al. 1987). Pursuit deficit following a lesion to middle temporal visual
area result from an inability to determine the speed of target motion (Newsome et al. 1985).
Generation of pursuit by a position error seems to be mediated by areas other than middle
temporal visual area (Newsome et al. 1985). Middle temporal visual area is selectively
related to visual processing of motion information (Dürsteler et al. 1987).
Intracortical connections, and connections to cerebellum and brain stem
According to Goldberg and Robinson (1977), there are two different cortical
mechanisms underlying gaze: 1) a qualitative analysis of the visual world provided by
striate and prestriate cortex; and 2) signals of a significant object in the environment
18
provided by FEF and posterior parietal cortex. These two mechanisms are both visual
because they describe the visual world to the oculomotor system (Goldberg and
Robinson 1977).
Cortical areas associated with eye movements share many internal connections.
The middle temporal visual area receives a direct projection from striate cortex
(Newsome et al. 1985). Connections are found between area 7 and the temporal lobe
(Petras 1971), between FEF and the middle and medial superior temporal area
(Keating 1991), between FEF and area 7, FEF and the pretectal regions and the
superior colliculus (Astruc 1971; Petras 1971; Künzle and Akert 1977; Stanton et al.
1982). The FEF participating in the PEM system connects the middle temporal visual
area and the pontine nuclei (Newsome et al. 1985; Dürsteler and Wurtz 1988; Keating
1991). The pontine nuclei involved in the eye movements function as relay stations to
the vestibulocerebellum (Brodal 1979). Apparently, FEF is not the sole pathway
transmitting the selective command signals of the visual neurons of area 7 to the eye
movement centers in the brain stem (Lynch et al. 1977).
Movement signal of FEF is largely mediated by the superior colliculus which can
ignore the FEF signals and may trigger saccades in the absence of FEF signals (Bruce
and Goldberg 1985). FEF also has projections to other nuclei in the brain stem related
to eye movements (i.e. tegmental and basilar nuclei of the pons), but not to the
extraocular motor nuclei, “accessory oculomotor” nuclei, or the PPRF (Astruc 1971;
Künzle and Akert 1977; Stanton et al. 1982). The superior colliculus receives
convergent projections from the retina and striate cortex (Wilson and Toyne 1970), and
receives descending projections from frontal, temporal and parietal lobes (Kuypers and
Lawrence 1967; Petras 1971; Künzle and Akert 1977). The superior colliculus is
involved in the generation of saccade amplitude and direction (van Opstal and van
Gisbergen 1989). According to Robinson (1972), the “collicular motor map” is
organized in spatial (polar) coordinates (amplitude and direction).
Efferent projections from the superior colliculus reach the eye movement centers
located in PPRF (Harting 1977; Lynch et al. 1977). The functional properties of the
visual neurons in parietal lobe match completely with those of the premotor neural
activity recorded in PPRF (Lynch et al. 1977), indicating a functional connection.
Unlike the normal saccades, the express saccades cannot be generated without the
superior colliculus (Schiller et al. 1987). The superior colliculus also plays a role in
the generation of normal saccades, because a lesion of superior colliculus lengthens
the SRTs of contralateral visual saccades (Schiller et al. 1987).
Middle temporal area, medial superior temporal area and some extrastriate areas
have projections also to the dorsolateral pontine nucleus (DLPN) (Glickstein et al.
1980; Ungerleider et al. 1984; May and Andersen 1986). The DLPN and nucleus
reticularis tegmenti pontis also receive inputs from the superior colliculus (Harting
19
1977). The DLPN has cells that discharge during PEMs (Suzuki and Keller 1984;
Suzuki et al. 1984). The pontine nuclei (Langer et al. 1980) in turn seem to project to
the contralateral or to the ipsi- and contralateral flocculus of the cerebellum (Langer et
al. 1980; Brodal 1982; Langer et al. 1985a). According to Suzuki and Keller (1984),
the DLPN could provide the PEM system with a retinal slip velocity component based
an internal neural correlate of target velocity in space. Shinnar et al. (1973) and
Brodal (1979) have found that DLPN also has connections to the vermal lobules VI and
VII, and so it is also involved with the saccadic system.
2. A. 4. Cerebellum
The flocculus is a well-defined and relatively isolated part of the cerebellum (Alley
1977), and in primates it is intimately involved in visuomotor tasks (Takemori and
Cohen 1974; Zee et al. 1976b; Alley 1977; Waespe et al. 1983; Keller 1988). The
flocculus modulates the vestibular system via the visual system. Removal of the
flocculus causes loss of visual suppression of vestibular responses (Takemori and
Cohen 1974). The flocculus seems to inhibit the brain stem neurons responsible for
transmitting vestibular information to the oculomotor system (Fukuda et al. 1972).
The flocculus exerts a control of visual inputs for PEMs through a pathway coming
from the brain stem (Langer et al. 1980; May et al. 1988; Brodal 1982; Langer et al.
1980).
In mammals, the flocculus receives input from variable brain stem parts mediating eye
movements (Alley et al. 1975; Alley 1977; Lisberger and Fuchs 1978; Langer et al. 1980;
Langer et al. 1985a). It receives afferents from the retina with directionally selective inputs
(possibly via the inferior olive), (Maekawa and Simpson 1973; Simpson and Alley 1974). It
also receives a direct projection from the vestibular nerve and secondary inputs from the
specific vestibular nuclei, as well as projections from the perihypoglossal complex (Alley et
al. 1975; Alley 1977; Winfield et al. 1978; Langer et al. 1980; Langer et al. 1985a). The
perihypoglossal complex also includes prepositus hypoglossi nucleus (Alley et al. 1975;
Langer et al. 1980; Langer et al. 1985a). Visual influx to flocculus is conveyed through the
inferior olive from the striate cortex (Winfield et al. 1978; Langer et al. 1980; Langer et al.
1985a). There are afferents from the abducens nucleus, nucleus reticularis tegmenti
pontis, PPRF, DLPN and ventrolateral nuclei of pons (Langer et al. 1980; Brodal 1982;
Langer et al. 1985a; May et al. 1988).
There are three major efferent pathways, through which the flocculus influences or
controls the extra-ocular motoneuron complex (Noda and Suzuki 1979; Zee et al. 1981). The
flocculus projects to nuclei of extra-ocular motoneurons (Haines 1977; Alley 1977; Noda
and Suzuki 1979; Langer et al. 1985b) through the ipsilateral vestibular nuclei (Carpenter
and McMasters 1963; McMasters et al. 1966; Tarlov 1970; Langer et al. 1985b). Through
this projection the flocculus seems to transmit vestibular information to the oculomotor
20
system (Fukuda et al. 1972), and this projection is also a part of the vestibulo-ocular reflex
arc (Fukuda et al. 1972). The second pathway travels from the flocculus to the prepositus
hypoglossi nucleus (Alley 1977; Noda and Suzuki 1979). The ipsilateral prepositus
hypoglossi nucleus has a monosynaptic excitatory projection to trochlear nucleus (Baker et
al. 1977). The ipsi- and contralateral prepositus hypoglossi nuclei have projections to the
abducens nucleus (Maciewitz et al. 1977) and to the oculomotor nucleus (Graybiel and
Hartwieg 1974). The third pathway (Noda and Suzuki 1979) conveys a projection from the
flocculus to the ventral portions of dentate nucleus (Carpenter and Strominger 1965;
Haines 1977) that projects to the oculomotor nucleus (Chan-Palay et al. 1976).
The activity of vestibular nuclei is not only coding the sensory inputs, (i.e., vestibular,
proprioceptive and exteroceptive) but also a pattern of oculomotor activity. This indicates
that the vestibular nuclei are also a premotor structure to the extra-ocular motoneuron
complex (Büttner et al. 1981). Thus, visually induced oculomotor responses also depend
upon the integrity of peripheral vestibular afferents (Büttner et al. 1981). The vestibular
nuclei and flocculus interact in a complementary fashion, extending considerably the range
of oculomotor functions (Büttner et al. 1981).
Flocculus functions to stabilize the images on the retina during head rotation and
assists in the foveation of the target (Zee et al. 1981). The input to the flocculus (regarding
eye position) is probably related to the proprioceptive impulses in the extraocular muscles,
to impulses from the visual system (the retina), or impulses from brain stem (Noda and
Warabi 1982). The output from flocculus is always related to the eye velocity with respect
to the world (Lisberger 1982). Flocculus and paraflocculus also participate in the control of
oculomotor reflexes that insure the visual acuity by preventing glissades (Zee et al. 1981).
The considerable deficits of PEMs in bilaterally flocculectomized monkeys imply
that the flocculus plays a major role in the control of PEMs (Zee et al. 1981). PEMs
can be elicited by electrical microstimulation of flocculus (Belknap and Noda 1987).
In saccades, the purpose of the neural activity of the flocculus is to adjust the
pulse size to eliminate a glissade (Optican and Robinson 1980). It seems that the
brain stem circuits that generate the amplitude of saccadic eye movements are slightly
hypermetric, and in normal situations the amplitude is made correct by the flocculus
(Optican and Robinson 1980). The flocculus seems to affect the fine adjustment of
saccadic eye movements and the control of delicate positioning of the eyes for fixation
(Noda and Suzuki 1979).
Oculomotor vermis of primates receives afferent projections from nucleus
reticularis tegmenti pontis, pontine nuclei (involving paramedian pontine nucleus,
pontine peduncular nucleus, DLPN), PPRF, vestibular nuclear complex, prepositus
hypoglossi nucleus, and from inferior olivary nucleus (Shinnar et al. 1973; Brodal
1980; Keller and Crandall 1980; Yamada and Noda 1987). A lesion somewhere in
these afferent pathways affects the function of oculomotor vermis. As there is ongoing
21
compensation and healing after the lesion of cerebellum, the oculomotor deficit may
be difficult to interpret.
Adaptive control of the pulse command and the neural discharge controlled by it
(which controls saccadic amplitude), is dependent upon the midline structures of the
cerebellum (Optican and Robinson 1980). More recent studies (Noda and Fujikado
1987a; Noda and Fujikado 1987b; Noda et al. 1988) with microstimulation techniques
have shown that the oculomotor vermis is situated in lobules VIc-VII of vermis in
primates. Efferent Purkinje cell projections from oculomotor vermis project solely to
fastigial nucleus (Yamada and Noda 1987); the oculomotor pathway first projects to
the ipsilateral fastigial nucleus from where the pathways decussate to the
contralateral fastigial nucleus (Noda and Fujikado 1987a; Noda and Fujikado 1987b;
Noda et al. 1988). The synapses of the Purkinje cell efferents are situated in the
contralateral fastigial nucleus (Noda et al. 1988). The direction of the saccade seems
to be topographically organized in the oculomotor vermis (Noda and Fujikado 1987b).
In microstimulation studies of oculomotor vermis, amplitude of the evoked saccade
has been found to increase by the stimulus duration and frequency (Noda and
Fujikado 1987b).
Vermal stimulation affects ipsilateral saccades and stimulation of neurons in the
fastigial nucleus affects contralateral saccades (Noda et al. 1988). The neurons of
fastigial nucleus are situated in the fastigial oculomotor region (Noda 1991). The
primary function of the fastigial oculomotor region is related to the control of
saccades, while regions related to vestibular and PEM functions are located rostral to
the fastigial nucleus (Noda et al. 1990; Noda 1991).
The fibers of fastigial oculomotor region terminate primarily in the regions of the medial
brain stem reticular formation (PPRF - horizontal preoculomotor neurons, rostral interstitial
nucleus of medial longitudinal fasciculus - vertical preoculomotor neurons) that have direct
projections to the extraocular motor nuclei (Noda et al. 1990; Noda 1991). The fastigial
oculomotor region also projects to such brain stem regions that project to the cerebellum.
For example, there are projections via the vestibular complex and the inferior olivary
complex to the cerebellum (Noda et al. 1990; Noda 1991). The cerebellar output, through
fastigial oculomotor region via the contralateral uncinate fasciculus (Noda and Ikeda 1989),
independently influences the horizontal and vertical saccades (Fujikado and Noda 1987).
It seems that a bulk of visual-oculomotor and cerebellar-oculomotor pathways projects to
PPRF before reaching the extraocular motor nuclei (Cohen and Komatsuzaki 1972).
During PEMs, the discharge of posterior vermal cells is proportional to target
velocity, while that of floccular cells depend upon eye velocity, retinal error velocity or
eye acceleration (Lisberger and Fuchs 1978; Keller 1988; Pierrot-Deseilligny et al.
22
1990). The anatomical pathways from the flocculus and the posterior vermis are
different. The posterior vermis projects via the fastigial nucleus to the neurons near
the abducens nucleus, which are involved in PEMs (Yamada and Noda 1987). The
vermis can partly compensate for the deficit in PEMs produced by limited floccular
lesions or vice-versa (Keller 1988), but surgical ablation of the posterior vermis cannot
be compensated for, as it causes saccadization of PEMs (Suzuki and Keller 1983).
Lesions in vermal lobules VI and VII in monkeys cause a gain reduction of 30-50% in
PEMs (Suzuki and Keller 1983), suggesting that vermal lobules VI and VII may also
take part in generating PEMs. The flocculus is more involved in the motor aspects of
maintaining ongoing pursuit, whereas vermal lobules VI and VII may influence the
PEM system during rapid changes in target velocity (Keller and Heinen 1991).
According to Suzuki and Keller (1983), the flocculus supplies a gaze velocity signal,
whereas oculomotor vermis generates a target velocity signal. Paraflocculus
participates in PEM generation as well (Zee et al. 1981). Both the flocculus and
paraflocculus, as well as vermal lobules VI and VII, receive projections from visual
nuclei of pons (Brodal 1979, Langer et al. 1985a).
It is possible that the flocculus, paraflocculus, nodulus and posterior vermis
(lobules VI and VII) are all required for PEMs, and only the removal of large amounts
of these structures can cause a profound deficit in PEMs (Zee et al. 1981; Suzuki and
Keller 1983; Keller and Heinen 1991). It is also possible that lateral hemispheres of
cerebellum and anterior superior vermis can participate in PEMs as well (Zee et al.
1981).
Cerebellum exerts control on PEMs through several pathways: the vestibular
nuclei (Langer et. al 1985a), the neurons near the abducens nucleus (Yamada and
Noda 1987), and the prepositus hypoglossi nucleus (Keller and Heinen 1991). The
prepositus hypoglossi nucleus is anatomically connected to the extra-ocular
motoneuron complex (Graybiel and Hartwieg 1974; Baker et al. 1977; Maciewitz et al.
1977).
Normally, each side of the cerebellum inhibits the vestibular nuclei ipsilaterally
(Fukuda et al. 1972). As a consequence of hemicerebellectomy, this ipsilateral
inhibition is absent (Westheimer and Blair 1974) and the imbalance in the steady-
state output of the vestibular nuclei is generated producing a contralaterally directed
drift in the darkness (Westheimer and Blair 1974).
23
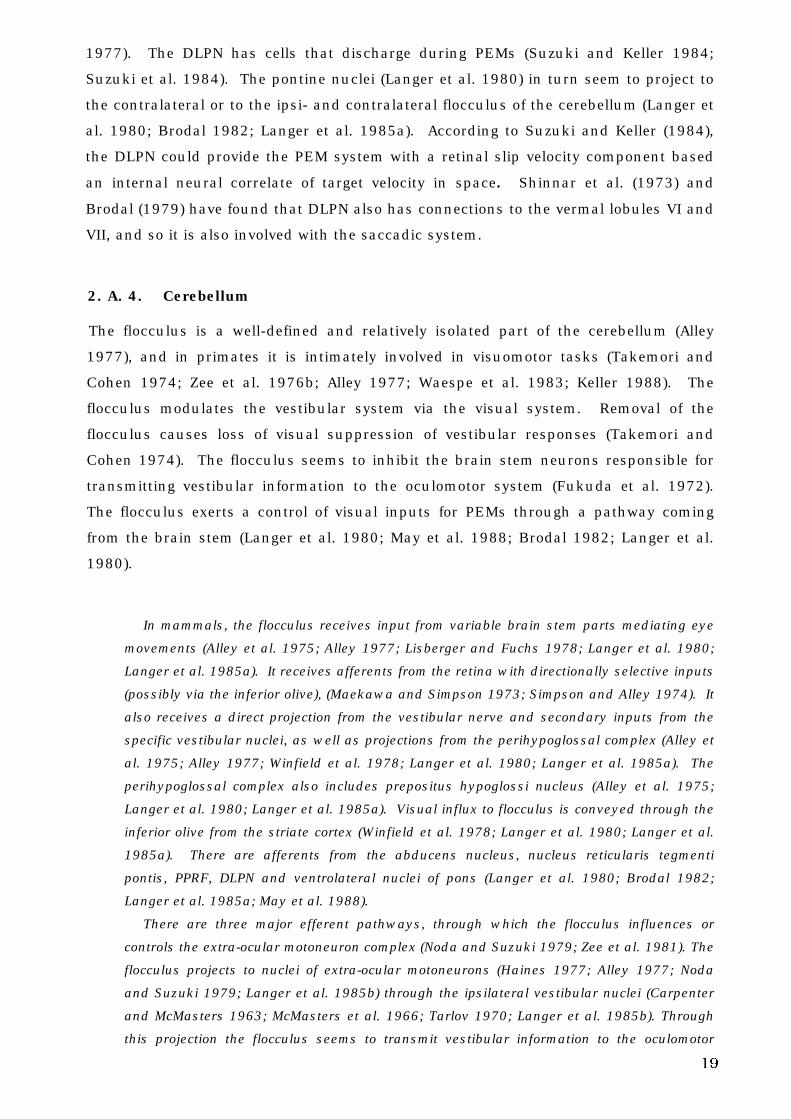
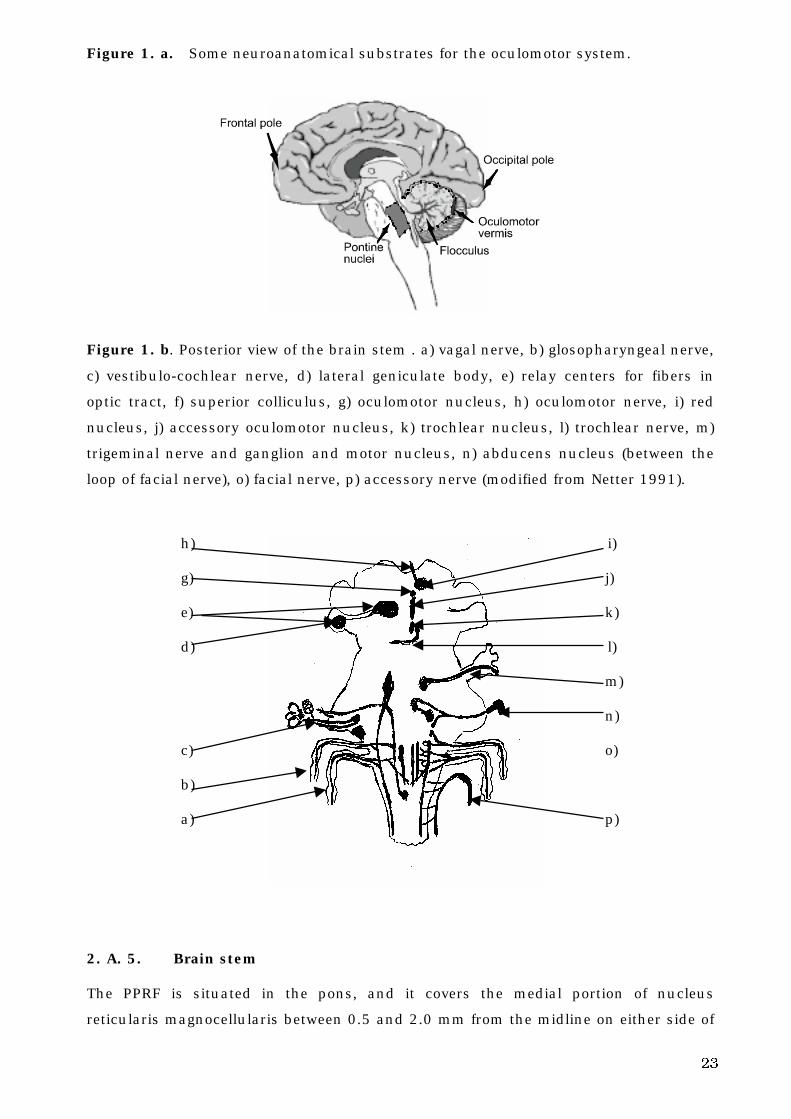
Figure 1. a. Some neuroanatomical substrates for the oculomotor system.
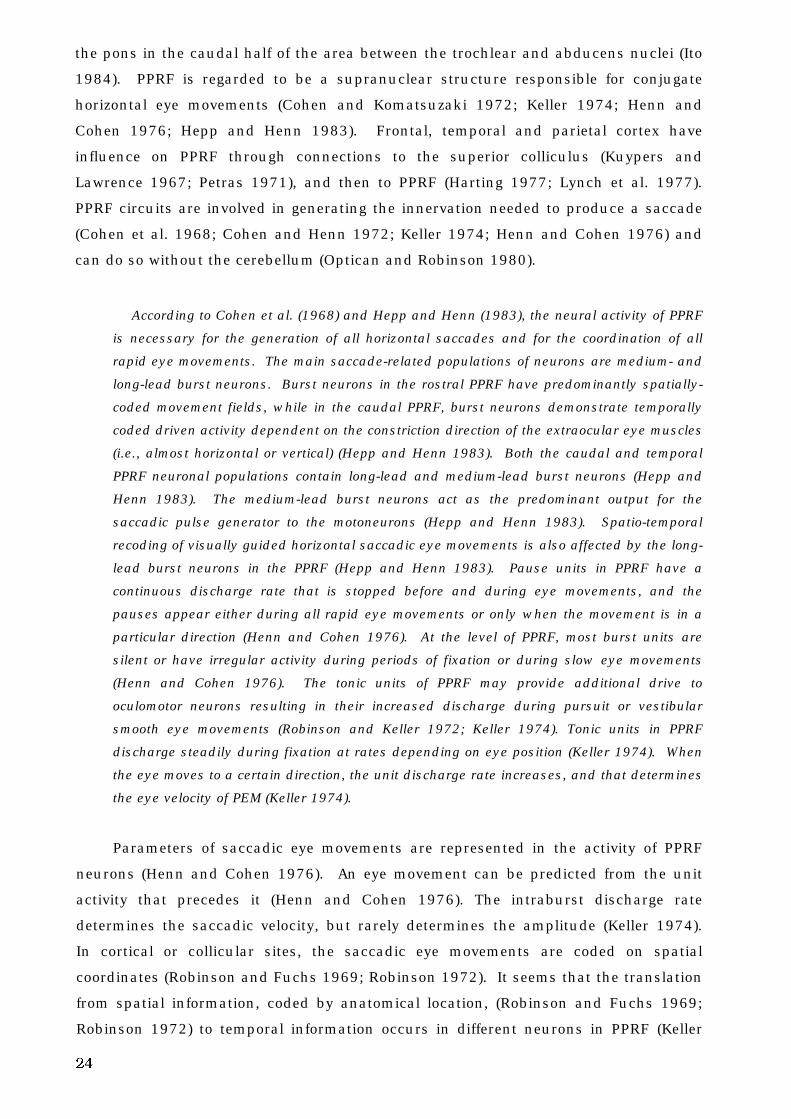
Figure 1. b. Posterior view of the brain stem . a) vagal nerve, b) glosopharyngeal nerve,
c) vestibulo-cochlear nerve, d) lateral geniculate body, e) relay centers for fibers in
optic tract, f) superior colliculus, g) oculomotor nucleus, h) oculomotor nerve, i) red
nucleus, j) accessory oculomotor nucleus, k) trochlear nucleus, l) trochlear nerve, m)
trigeminal nerve and ganglion and motor nucleus, n) abducens nucleus (between the
loop of facial nerve), o) facial nerve, p) accessory nerve (modified from Netter 1991).
h) i)
g) j)
e) k)
d) l)
m)
n)
c) o)
b)
a) p)
2. A. 5. Brain stem
The PPRF is situated in the pons, and it covers the medial portion of nucleus
reticularis magnocellularis between 0.5 and 2.0 mm from the midline on either side of
24
the pons in the caudal half of the area between the trochlear and abducens nuclei (Ito
1984). PPRF is regarded to be a supranuclear structure responsible for conjugate
horizontal eye movements (Cohen and Komatsuzaki 1972; Keller 1974; Henn and
Cohen 1976; Hepp and Henn 1983). Frontal, temporal and parietal cortex have
influence on PPRF through connections to the superior colliculus (Kuypers and
Lawrence 1967; Petras 1971), and then to PPRF (Harting 1977; Lynch et al. 1977).
PPRF circuits are involved in generating the innervation needed to produce a saccade
(Cohen et al. 1968; Cohen and Henn 1972; Keller 1974; Henn and Cohen 1976) and
can do so without the cerebellum (Optican and Robinson 1980).
According to Cohen et al. (1968) and Hepp and Henn (1983), the neural activity of PPRF
is necessary for the generation of all horizontal saccades and for the coordination of all
rapid eye movements. The main saccade-related populations of neurons are medium- and
long-lead burst neurons. Burst neurons in the rostral PPRF have predominantly spatially-
coded movement fields, while in the caudal PPRF, burst neurons demonstrate temporally
coded driven activity dependent on the constriction direction of the extraocular eye muscles
(i.e., almost horizontal or vertical) (Hepp and Henn 1983). Both the caudal and temporal
PPRF neuronal populations contain long-lead and medium-lead burst neurons (Hepp and
Henn 1983). The medium-lead burst neurons act as the predominant output for the
saccadic pulse generator to the motoneurons (Hepp and Henn 1983). Spatio-temporal
recoding of visually guided horizontal saccadic eye movements is also affected by the long-
lead burst neurons in the PPRF (Hepp and Henn 1983). Pause units in PPRF have a
continuous discharge rate that is stopped before and during eye movements, and the
pauses appear either during all rapid eye movements or only when the movement is in a
particular direction (Henn and Cohen 1976). At the level of PPRF, most burst units are
silent or have irregular activity during periods of fixation or during slow eye movements
(Henn and Cohen 1976). The tonic units of PPRF may provide additional drive to
oculomotor neurons resulting in their increased discharge during pursuit or vestibular
smooth eye movements (Robinson and Keller 1972; Keller 1974). Tonic units in PPRF
discharge steadily during fixation at rates depending on eye position (Keller 1974). When
the eye moves to a certain direction, the unit discharge rate increases, and that determines
the eye velocity of PEM (Keller 1974).
Parameters of saccadic eye movements are represented in the activity of PPRF
neurons (Henn and Cohen 1976). An eye movement can be predicted from the unit
activity that precedes it (Henn and Cohen 1976). The intraburst discharge rate
determines the saccadic velocity, but rarely determines the amplitude (Keller 1974).
In cortical or collicular sites, the saccadic eye movements are coded on spatial
coordinates (Robinson and Fuchs 1969; Robinson 1972). It seems that the translation
from spatial information, coded by anatomical location, (Robinson and Fuchs 1969;
Robinson 1972) to temporal information occurs in different neurons in PPRF (Keller
25
1974; Henn and Cohen 1976; Hepp and Henn 1983). The cerebellum (oculomotor
vermis, fastigial nucleus, flocculus) affects the function of PPRF by adjusting the
saccadic parameters (Zee et al. 1976a; Zee et al. 1976b; Noda and Suzuki 1979;
Optican and Robinson 1980; Zee et al. 1981; Optican et al. 1986; Fujikado and Noda
1987; Noda and Fujikado 1987a; Noda and Fujikado 1987b; Noda et al. 1988; Noda et
al. 1990; Noda 1991).
PPRF units project onto the extraocular motoneurons, either monosynaptically or
disynaptically (Highstein et al. 1974; Büttner-Ennever and Henn 1976). The oculomotor
nucleus receives a projection from contralateral PPRF via the contralateral abducens
nucleus (Graybiel and Hartwieg 1974; Büttner-Ennever and Henn 1976). Finally, the
information is transformed into a temporal discharge pattern of extra-ocular motoneurons
to generate a saccadic eye movement (Hepp and Henn 1983).
PPRF also has projections to the contralateral PPRF, the pretectal area, the prepositus
hypoglossi nucleus and medial vestibular nucleus (Büttner-Ennever and Henn 1976).
According to Büttner-Ennever and Henn (1976), these connections could act in the precise
co-ordination of all six pairs of extraocular muscles during eye movements.
Extraocular muscle proprioception participates in the control of eye movements in
primates (ocular alignment and eye movement conjugacy), and contributes to the long-term
adaptive mechanisms that regulate ocular alignment during fixation and saccades (Lewis
et al. 1994). A mismatch between the efferent activity and proprioceptive afferent activity
may act as an error signal needed in this process (Lewis et al. 1994). These findings
confirm the assumptions of Fricker and Sanders (1975), that the main movements in the
saccadic system are “preprogrammed” to a large extent, but the movements can be
modified significantly by a rapid feedback system. They thought that the feedback system
was too rapid to depend on visual information, and they suggested that the proprioceptors
in the oculomotor muscles or tendons with feedback loops to the brain stem could be
involved in that task (Fricker and Sanders 1975). Already Weber and Daroff (1972) had
suggested that a feedback from proprioceptors in extraocular muscles might play a role in
corrective saccadic eye movements rather than the visual feedback.
From the cerebral cortical pathways, the descending projections for PEMs appear to go
through pontine nuclei (Keller and Heinen 1991). The pontine nuclei involved in PEMs are
the inferior olive (Winfield et al. 1978; Langer et al. 1980; Langer et al. 1985a), nucleus
reticularis tegmenti pontis (Suzuki et al. 1990), DLPN (May et al. 1988; Suzuki et al. 1990),
lateral pontine nucleus (Nyby and Jansen 1951), and PPRF (Keller 1974; Raphan and
Cohen 1978). These pontine sites have outputs to cerebellar structures of PEMs (Brodal
1979; Brodal 1980; Brodal 1982; Langer et al. 1985a; May et al. 1988).
As the eye velocity signals have to be transformed to eye position signals
(Robinson 1975), there is a need for the so-called final common integrator (Robinson
1975). For all conjugate eye movements, the final common integrator (Robinson 1975)
processes information between the cerebellum, brain stem and supratentorial areas
26
(Robinson 1975; Cannon and Robinson 1987). Fixation is impaired if nucleus
prepositus hypoglossi and medial vestibular nucleus are lesioned unilaterally (Cannon
and Robinson 1987). Neural integration for horizontal conjugate eye movements is
severely impaired if nucleus prepositus hypoglossi and medial vestibular nucleus are
destroyed bilaterally (Cannon and Robinson 1987). Nucleus prepositus hypoglossi
and medial vestibular nucleus have reciprocal connections to the vestibulocerebellum
(Alley 1977; Lisberger and Fuchs 1978). All three oculomotor subsystems (saccadic,
PEM and vestibular systems) transmit a velocity signal to a final common integrator
that produces the appropriate position information to make the eye move and to hold it
in its new position (Zee et al. 1974). In the final common integrator, the eye-position
signal is created from the velocity command signal by integration with respect to time,
and is sent to the extraocular motoneurons in combination with the eye-velocity
command signal (Cannon and Robinson 1987). In the vestibular nerve, the eye
movement signal is coded in the time domain (i.e., firing frequency) (Wilson 1972;
Robinson 1975; Robinson 1981).
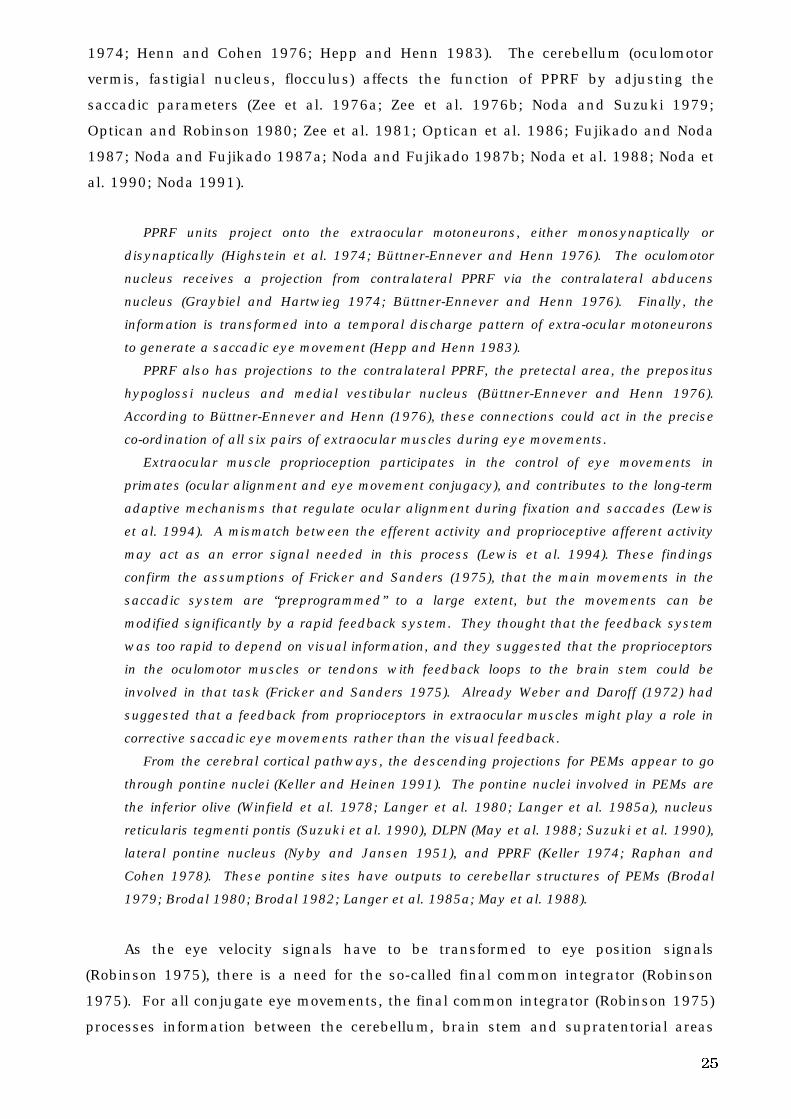
Figure 2a. Some important parts and pathways of the saccadic system. riMLF =
rostral interstitial nucleus of medial longitudinal fasciculus. Note the connection to
the PEM system via DLPN and flocculus.
SACCADES parietal lobe, FEF, visual cortex,
temporal lobe
basal ganglia, thalamus
oculomotor vermis
fastigial nucleus
uncinate fasciculus
PPRF, riMLF
extra-ocular motor nuclei
superior colliculus
PPRF
&
DLPN
flocculus
PEM system
SACCADES
27
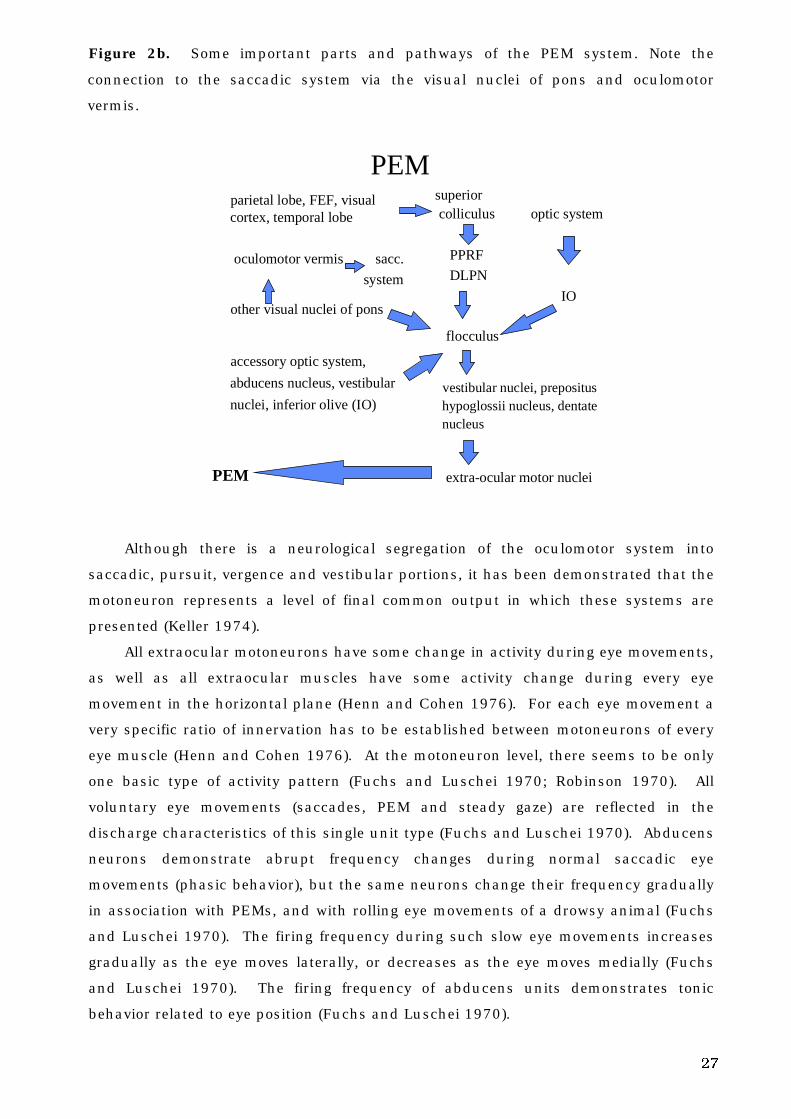
Figure 2b. Some important parts and pathways of the PEM system. Note the
connection to the saccadic system via the visual nuclei of pons and oculomotor
vermis.
PEM parietal lobe, FEF, visual
cortex, temporal lobe
oculomotor vermis sacc.
system
other visual nuclei of pons
accessory optic system,
abducens nucleus, vestibular
nuclei, inferior olive (IO)
PEM
superior colliculus optic system
PPRF
DLPN
IO
flocculus
vestibular nuclei, prepositushypoglossii nucleus, dentatenucleus
extra-ocular motor nuclei
Although there is a neurological segregation of the oculomotor system into
saccadic, pursuit, vergence and vestibular portions, it has been demonstrated that the
motoneuron represents a level of final common output in which these systems are
presented (Keller 1974).
All extraocular motoneurons have some change in activity during eye movements,
as well as all extraocular muscles have some activity change during every eye
movement in the horizontal plane (Henn and Cohen 1976). For each eye movement a
very specific ratio of innervation has to be established between motoneurons of every
eye muscle (Henn and Cohen 1976). At the motoneuron level, there seems to be only
one basic type of activity pattern (Fuchs and Luschei 1970; Robinson 1970). All
voluntary eye movements (saccades, PEM and steady gaze) are reflected in the
discharge characteristics of this single unit type (Fuchs and Luschei 1970). Abducens
neurons demonstrate abrupt frequency changes during normal saccadic eye
movements (phasic behavior), but the same neurons change their frequency gradually
in association with PEMs, and with rolling eye movements of a drowsy animal (Fuchs
and Luschei 1970). The firing frequency during such slow eye movements increases
gradually as the eye moves laterally, or decreases as the eye moves medially (Fuchs
and Luschei 1970). The firing frequency of abducens units demonstrates tonic
behavior related to eye position (Fuchs and Luschei 1970).
28
2. B. Aging and voluntary eye movements
Voluntary eye movements change with aging (Miller 1969; Sharpe and Sylvester
1978; Spooner et al. 1980; Henriksson et al. 1980; Majima et al. 1981; Carter et al.
1983; Abel et al. 1983; Warabi et al. 1984; Whitaker et al. 1986; Hutton and Pallet
1986; Sharpe and Zackon 1987; Larsby et al. 1988; Tedeschi et al. 1989; Morrow and
Sharpe 1993; Versino et al. 1993a; Paige 1994; Moschner and Baloh 1994; Kanayama
et al. 1994).
Saccadic accuracy has been found to be poorer in elderly subjects than in
middle-aged subjects (Sharpe and Zackon 1987; Tedeschi et al. 1989). Not all studies
have been able to demonstrate this difference (Moschner and Baloh 1994).
In nonpredictive saccades (Spooner et al. 1980; Carter et al. 1983; Whitaker et al.
1986; Sharpe and Zackon 1987; Tedeschi et al. 1989; Moschner and Baloh 1994) and
predictive saccades (Whitaker et al. 1986; Hutton and Pallet 1986; Sharpe and Zackon
1987), the SRTs are longer in elderly subjects than in middle-aged subjects. In
children (Miller 1969), SRTs are also longer than in middle-aged subjects, both in
nonpredictive and predictive saccades. According to Abel et al. (1983), the SRT is
significantly increased in the elderly when compared to the SRTs of the young.
According to Warabi et al. (1984), the most prominent change in saccades in healthy
elderly subjects is the prolongation of time to catch a target. This results from an
increase in SRTs and from a decrease in saccadic peak velocities (Warabi et al. 1984).
Saccadic peak velocity has been found to be lower in elderly subjects than in
middle-aged subjects in the studies of Spooner et al. (1980) and Tedeschi et al. (1989).
According to Majima et al. (1981), mean saccadic velocities are the highest at the age
of 20-29 years, then gradually become lower and at the age 70-79 years suddenly
decrease; the difference in velocity in their study was statistically significant in 10°
saccades but not in 20° saccades. Sharpe and Zackon (1987) found that saccadic
peak velocity is significantly reduced in the elderly compared to the young, for
saccades predictable by target amplitude and direction, but that there is no difference
between these groups in saccades that are nonpredictable by target amplitude and
direction. Moschner and Baloh (1994) found that saccadic peak velocity was lower in
the elderly than in the middle-aged only for a saccadic amplitude of ±30°. Abel et al.
(1983) did not observe any significant differences in saccadic velocity and duration
between the young and the elderly. The findings of these two studies are in line with
those of Henriksson et al. (1980).
Tedeschi et al. (1989) demonstrated that the saccadic accuracy declined
significantly and the SRT increased significantly in subjects older than 45 years. The
saccadic peak velocity declined significantly in subjects older than 65 years.
29
In studies on PEMs, the following was observed: 1) pursuit velocity and pursuit
velocity gain decreases in the elderly subjects when compared to middle-aged
subjects, at least with higher stimulus velocities (Sharpe and Sylvester 1978) or even
with all stimulus velocities (Larsby et al. 1988; Morrow and Sharpe 1993; Moschner
and Baloh 1994; Paige 1994; Kanayama et al. 1994), 2) phase lag seems to lengthen
in the elderly subjects when compared to middle-aged subjects (Sharpe and Sylvester
1978; Morrow and Sharpe 1993; Paige 1994), but, according to Larsby et al. (1988),
phase shift values (phase leads and phase lags) are not affected by age, and 3) in
children and teenagers the accuracy of PEMs is poorer than in the middle-aged
(Larsby et al 1988).
2. C. Measurement of voluntary eye movements
2. C. 1. Recording techniques
Robinson (1963) introduced the magneto-oculography (MOG), a technique of
measuring and recording eye movements using a scleral search coil in a magnetic
field. The MOG recording method allows one to obtain a precise and continuous
recording of eye movements. The coils placed on scleral annuli contain a flanking
copper coil in which a voltage is induced as the eye moves in a magnetic field
(Robinson 1963). The MOG method has been further developed by Collewijn et al.
(1975), Collewijn (1977), and by Behrens (1989). The MOG recording method is used
primarily in research, and is routinely used in some clinical laboratories (Yee et al.
1985). The semi-invasive placement of a search coil onto the eyeball restricts the
application of MOG technique in clinical situations (Scherer et al. 1991). Moreover,
the possibility of coil slippage, particularly during torsional movements, remains a
potential source of error (Scherer et al. 1991).
In the electro-oculography (EOG) method, the position of natural dipole (the
corneoretinal potential) is detected by electrodes placed on the canthi of the eyes
(Henriksson 1956; Schlag et al. 1983). In neurotological practice, voluntary eye
movements have been recorded by standard EOG methods for a long time, and it is
still the most common method used for recording eye movements in neurotologic
laboratories (Spooner et al. 1980; Carter et al. 1983; Larsby et al. 1988; Tedeschi et al.
1989; Chioran and Yee 1991; Moschner and Baloh 1994; Kanayama et al. 1994). One
problem with the EOG method is a so-called spike artifact (obviously of muscle origin),
however, that can be avoided if the electrodes are properly placed close enough to the
outer canthi, and if the recording is properly low-pass filtered with digital filtering
(Jäntti 1982a). If the spike artifact is not eliminated, it can affect and radically distort
the measured peak velocity, duration, mean velocity and reaction time of horizontal
30
saccades (Jäntti 1982a). The most common disturbances in EOG recordings are;
changes in the impedance of the skin (Jäntti 1982b), D.C. drift in corneoretinal
potentials (Henriksson 1956; Schlag et al. 1983), electrical disturbances (Jäntti
1982b), and EEG (Baloh and Honrubia 1979; Jäntti 1982b) and EMG artifacts
(Beaussart and Guieu 1977; Jäntti 1982a; Jäntti 1982b; Yee et al. 1985; Chioran and
Yee 1991).
Infrared oculography (IROG) using infrared reflection device is used in some
laboratories (e.g., Stark et al. 1962; Sharpe and Sylvester 1978; Hutton et al. 1983;
Yee et al. 1985; Whitaker et al. 1986; Hutton and Palet 1986; Sharpe and Zackon
1987; Fischer et al. 1993). The IROG method utilizes photocells positioned over the
limbus nasally and temporally to record horizontal eye movements. The photocells
detect the amount of infrared light reflected from the surface of the eye (Smith and
Warter 1960; Stark et al. 1962; Yee et al. 1985). According to Boghen et al. (1974),
the saccadic peak velocities at horizontal saccades in certain saccade amplitudes are
higher in normal subjects when recorded by the IROG method than when recorded by
the EOG method.
The newest method for recording eye movements, video-oculography (VOG) was
introduced by Clarke et al. (1991) and by Scherer et al. (1991). The VOG system can
record eye movements in three dimensions: horizontal, vertical and torsional (Scherer
et al 1991). The three components of ocular movements are video acquired and
processed to provide position data, typically at 25 Hz (Guillemant et al. 1995).
Through advanced image processing, VOG provides an estimate of the velocities,
reaction times and accuracies of saccades, and on line computation of the slow
velocity eye movements (Guillemant et al. 1995). The apparent position of the center
of the pupil is calculated with an accuracy of 0.25°, with an algorithm that detects the
shape of the pupil by analysis of its contours (Guillemant et al. 1995). The VOG
system is non-invasive, the recordings are free of drift and electrophysiological artifact,
and they remain stable in the presence of electromagnetic interference in the
experimental environment (Scherer et al. 1991). However, it is less precise than the
MOG technique (Scherer et al. 1991), because the sampling rate is too low to precisely
define saccades (Juhola et al. 1985a; Juhola 1986; Guillemant et al. 1995).
Until recently, there have been few studies of voluntary eye movements in which
both EOG and MOG recording methods have been used simultaneously (Chioran and
Yee 1991; Yee et al. 1985; Schlag et al. 1983). Chioran and Yee (1991) studied vertical
saccades with EOG and MOG recording methods in 5 normal subjects. The EOG
measurements of vertical saccades were generally less accurate than those obtained by
the search coil technique. The analysis of vertical saccades by EOG was, therefore,
limited by the waveform artifacts that occurred with both upward and downward
saccades (Chioran and Yee 1991). Peak velocity was especially affected by artifacts
31
(Chioran and Yee 1991). They concluded that there is evidence that the varying tissue
resistance, eyelid blinks and electrical activity, originating probably from the frontalis
and/or levator muscles, contribute to the production of EOG artifacts in vertical
saccades. No data from the horizontal saccades was available.
Yee et al. (1985) studied the differences between EOG, MOG and IROG recording
methods in vertical saccades. Differences between the peak velocities assessed with
different recording methods were found. With the MOG method, upward and
downward saccades had similar peak velocities in all fields of the orbit, and no
artifacts were found in the MOG. But in two subjects, the superior fornix of the
conjunctiva restricted the movement of contact lens in the 20-30° interval in the upper
field. However, the MOG recording method was the most accurate of the recording
methods studied. In EOG, artifacts from eyelid movements had major effects on
trajectories and peak velocities of saccades. The EOG method overestimated the
velocities of upward saccades. In most of the subjects, the IROG method could not
accurately record eye movements greater than 10° in upgaze or 20° in downgaze. The
peak velocities and amplitudes of upward saccades were underestimated in IROG. No
data from the horizontal saccades was available.
Schlag et al. (1983) studied EOG and MOG recording methods with eye
movements in cat and monkey. They studied both the horizontal and vertical eye
movements (saccades and PEM). They concluded that the major drawback in EOG
method is the slow D.C. drift which is still present, despite routine careful preparation
of electrodes. The D.C. level varies with lighting conditions over long periods of time
(Schlag et al. 1983). Consequently, frequent calibrations are an unavoidable necessity
with the EOG technique (Schlag et al. 1983). When the conditions of calibration are
adequate, however, the EOG technique is valuable (Schlag et al. 1983). Its advantages
are simplicity of equipment and low cost. The discrepancies between EOG and the
search coil technique seem to be less in horizontal eye movements than in vertical eye
movements (Schlag et al. 1983). Saccades in recording signals of vestibulo-ocular
reflex are detected at a 95% frequency, with both EOG and MOG techniques (Juhola et
al. 1995).
According to Robinson (1964) and Boghen et al. (1974), the electronics of the
recording system is very important, and systems using higher bandwidths have yielded
faster and more accurate velocities.
2. C. 2. Stimulation techniques
According to a proposed standard of American National Standards Institute (ANSI
S3.45-199X), red LEDs can be used as targets for saccade tests and pursuit tests. In
32
saccade tests, the LEDs must not subtend an angle greater than 1 degree of visual arc,
and in pursuit test the target must not subtend a visual angle of greater than 3
degrees (see Blakley 1998).
Light emitting diodes (LEDs) have been widely used as targets for saccadic eye
movements (e.g., Abel et al. 1979; Warabi et al. 1984) and for pursuit eye movements
(Versino and Cosi 1990; Versino et al. 1993a). A laser dot projected on the screen or
wall is also widely used (e.g., Bahill et al. 1980).
Constant and pseudo-randomized saccades (referring to the target displacement
method) have been used in different eye movement studies (e.g., Spooner et al. 1980;
Carter et al. 1983; Warabi et al. 1984; Takemori and Ida 1984; Sharpe and Zackon
1987; Tedeschi et al. 1989; Fischer 1993). In constant saccades, the target steps
have varied between ±4º, and ±60º (Fischer 1993; Takemori and Ida 1984). Often the
time delay between the predetermined target steps is pseudo-randomly presented in
order to avoid anticipatory saccades (Fricker and Sanders 1975). In pseudo-
randomized saccades, the range of target steps used has included: ±3º - ±36º, via ±5º
- ±40º, to ±30º - ±40º (Spooner et al. 1980; Sharpe and Zackon 1987; Tedeschi et al.
1989). The target steps have jumped across the center from right to left or left to right
(Takemori and Ida 1984; Sharpe and Zackon 1987), or the jump has been from the
center to right or left (Spooner et al. 1980, Carter et al. 1983; Sharpe and Zackon
1987; Tedeschi et al. 1989; Fischer 1993).
In the study of PEMs, ramps (Versino and Cosi 1990; Versino et al. 1993a),
sinusoidally moving targets (Stark et al. 1962), motion reflecting the vector sum of
several sinusoids (Stark et al. 1962; Barnes et al. 1987) and random motion targets
(Dallos and Jones 1963; Michael and Melvill Jones 1966; Barnes et al. 1987) all have
been used as stimuli.
2. C. 3. Analysis techniques and computer systems, filtering, and sampling
frequency
Analysis
The algorithm of the recording system is extremely important (Robinson 1964). Those
studies utilizing higher bandwidths have yielded faster and more accurate velocities
(Boghen et al. 1974). According to Boghen et al. (1974), laboratories conducting
clinical oculographic recordings should establish their own normative baseline values
with their own recording techniques and electronics for eye movement testing.
Until the 1980’s, eye movements were acquired on paper recorders (Schalén
1981) and the parameters were assessed from the paper recordings (Henriksson 1956;
Schalén 1981). Also, the storing of eye movements on electromagnetic tape for
33
computer analysis was used (Baloh et al. 1975a). During the 1980’s, computer
systems were developed for the analysis of eye movements, and on line analyzing of
eye movement recordings could be done on computer files on hard disc (Juhola 1987;
Barnes et al. 1987).
Measurement techniques
Filtering
Biological signals have to be filtered in order to eliminate the disturbances caused by
contaminating biological and physical artifacts. The noise can increase the noise
floor, thus reducing the sensitivity of the recording system or distort recorded signals,
thus changing the results computed from them. Linear filters have been used for this
purpose, but they often cannot preserve the sharp edges of signals (Nodes and
Gallagher 1982). Nonlinear median filter has been found to smooth the data but
preserve interesting phenomena (Heinonen and Neuvo 1987; Astola et al. 1987;
Juhola 1991b).
Sampling Frequency
For saccades, the sampling frequencies have varied between 200 and 1000 Hz in
previous studies (Baloh et al. 1975b; Bahill et al. 1981; Dick 1978). For PEMs, the
sampling frequencies have also varied between 200 and 1000 Hz (Juhola 1990).
Juhola et al. (1985b), Juhola (1986) and Juhola and Pyykkö (1987), observed that the
lowest sampling frequency should be 400Hz to allow for saccade identification.
Parameters
Saccades
SRT, saccadic accuracy and saccadic peak velocity have often been assessed in
saccade tests. The SRT can be assessed by computing the time from displacement of
target or the appearance of target, to the beginning of the saccadic eye movement.
Saccadic accuracy can be expressed in several ways: 1) assessing the amplitude of
the initial saccade (Schalén 1981), 2) assessing the ratio of saccade amplitude to
target amplitude, 3) expressing the above ratio as a percentage (Baloh et al. 1977), 4)
assessing the difference between the saccadic amplitude and the target amplitude, and
(5) expressing the difference as undershoot/overshoot (Weber and Daroff 1971).
Saccadic peak velocity can, for example, be assessed by estimating the tangent of
rapid eye movement (Schalén 1981), or by measuring the velocity over a 24ms period
at the midpoint of the excursion of the eye (Mastaglia et al. 1979).
Pursuit eye movement
Velocity gain has been widely assessed in PEM tests. Velocity gain is the ratio of eye
velocity: target velocity, usually computed to the point corresponding to the middle of
34
target trajectory or sometimes in some other points of the target ramp or sinusoid
(Versino et al. 1993a). In the study of Versino et al. (1993a), velocity gain was
replaced by pursuit index that is the ratio purified PEM: total target amplitude
(correcting saccades were identified and removed from PEM to get the purified PEM).
The benefit in using this index was that it enabled a global evaluation of smooth
pursuit over the entire ramp. According to Versino et al. (1993a) pursuit index
corresponds to the ratio of the integral of eye velocity signal (after catch-up saccades
were removed from it) to the integral of target velocity signal.
2. C. 4. Consistency of voluntary eye movements
There are few studies on the reliability of voluntary eye movement results (Boghen et
al. 1974; Schmidt et al. 1979; Tijssen et al. 1989; Brantberg 1992; Versino et al.
1993b). In these studies, the reliability of the tests has been evaluated by repeated
measurements, and the voluntary eye movements have been found to be repeatable
most often.
2. C. 5. Prediction of stimulus and voluntary eye movements
Takemori and Ida (1984) studied the influence of the prediction of saccades in 20
normal subjects, age ranging from 18 to 43 years. They found that the predictability
versus nonpredictability of the target did not produce any significant differences in
saccadic peak velocity or SRT.
According to Saslow (1967), neither the number of possible target positions (steps
of 2º - 4º 6 º- 8º to right or left) nor the location of the target (overall range from -4º to
+4)º affected the SRT. In the study of Saslow (1967), however, auditory guidance was
involved in the saccadic task, which could affect the results. The stimulus paradigm
did not fulfill conditions for pseudo-randomization of stimulus.
Findlay (1981) found that both spatial predictability and temporal predictability
reduce SRTs for visually elicited saccades. The timing of a saccade is controlled by a
separate mechanism from that which controls amplitude (Findlay 1981). For unpre-
dictable movements the SRT is typically 170-350 ms; but in the case of a target
making a predictable movement, the SRT can be reduced or even lost (Findlay 1981).
He considered saccades with a SRT< 100ms as anticipatory, and all saccades with a
SRT>100ms as visually guided. The stimulus movements were only ±1.9º in a series
of steps: (center) - (left/right) - (center) - (left/right) - (center), etc. The probability of
the stimulus to move to the left or right was 0.5 for each, so the required saccadic
amplitude was predictable. These experimental conditions may have affected his
findings.
35
2. D. Voluntary eye movements in normal subjects
2. D. 1. Normal saccades
The accuracy of human saccades is significantly affected by the temporospatial
arrangements of the targets and by their background illumination (Lemij and Collewijn
1989). The size of a saccade can vary considerably, from approximately 0.1º to 90º
(Robinson 1981). Normal subjects often undershoot the target displacement by 5-20%
and occasionally overshoot by 5-20% in saccadic performance (Weber and Daroff
1971). In the saccade test of Weber and Daroff (1971), the targets were continuously
visible, and the saccades were made to and from midline position; the target
displacement being the same in a given sequence. The majority of saccades were
normometric at saccadic eye movements of 10º, whereas at 20º and 30º saccades, the
frequency of normometric saccades was significantly decreased (Weber and Daroff
1971).
Visually controlled saccades to peripheral targets are slightly larger than the
visually controlled saccades to the center, and the size appears as an increasing
function of reaction time (Findlay 1981). Findlay’s analysis supports the idea of a
distinction in accuracy between the anticipatory and the visually guided saccades.
According to van Opstal and van Gisbergen (1989), the variability of saccadic
position errors is attributed to the noise occurring at the level of the motor map of the
superior colliculus. The computation of saccade amplitude and direction is subjected
to noise (van Opstal and van Gisbergen 1989). The ratio of amplitude to direction
scatter was approximately constant for all target positions tested in that study.
According to Warabi et al. (1984), SRT is dependent on the amplitude of the
saccade. In their work, the size of target displacement/step and direction as well as
the time interval of steps were randomized, and the steps were 10º, 20º, 30º or 40º to
the right or left at a distance of ±10º or ±20º from the midline position. According to
Saslow (1967), the lack of knowledge of the target trajectory does not necessarily affect
the SRT in pseudo-randomized saccades. But predictive settings lead to anticipatory
rather than “tracking” saccadic performance (Saslow 1967).
The lower limit of SRT for a “regular” saccade is 150ms (Stark et al. 1962).
According to Fuchs (1967a) and Robinson (1981), when a target suddenly jumps to
one side, a saccade follows in about 200-250 ms. SRT depends on the attention span,
the luminance, size of target displacement, target disappearance and reappearance
schedule (Robinson 1981). A typical SRT of 215 ms includes about 55 ms lost in the
retina and about 25 ms lost in the premotor circuits and muscles, leaving about 135
ms for central processing (Robinson 1981).
Saccadic peak velocity and saccadic amplitude have a non-linear relationship
(Zuber et al. 1965; Fuchs 1967a; Schmidt et al. 1979; Leigh and Zee 1983a); saccadic
36
peak velocity increases as saccadic amplitude increases. Anticipatory saccades
possess the same saccadic amplitude and saccadic peak velocity relationship as
visually controlled saccades (Findlay 1981). In EOG recordings, the mean of normal
saccadic peak velocity values for 20º saccades has been approximately 320º/s
(Wennmo et al. 1981; Schalén 1981), and for 60º saccades approximately 475º/s
(Wennmo et al. 1981; Schalén 1981). With standard photoelectric recording
techniques, the mean of normal peak velocity for 20º saccades is approximately
660º/s (Bahill et al. 1981). Sometimes, saccadic peak velocities may reach such
values as 700º/s (Leigh and Zee 1983a). According to Bahill et al. (1981), the
saccadic peak velocity is sensitive to the influence of the algorithms used to calculate
the saccadic peak velocity.
Visual suppression occurs during saccades, and results from a central inhibitory
process (Riggs et al. 1982), or from retinal smear (Volkmann 1962). Retinal smear is
supposed to decrease the photochemical effect of visual stimulation (Volkmann 1962).
According to Cambell and Wurtz (1978), in a contoured visual environment, a clear
image before and/or after the saccade can mask the gray-out during eye movement. A
gray-out would have been caused by a perception of a smeared visual scene during
the eye movement (Cambell and Wurtz 1978).
2. D. 2. Normal pursuit eye movements
Tracking a target consists of two separate paths: a saccadic path for correction of
position errors, to center the target image on the fovea; and a pursuit path for
correction of velocity errors, to stabilize the target image on the retina (Rashbass
1961; Young and Stark 1963). The accuracy of eye tracking (i.e., PEM) depends upon
cooperation between PEM and saccadic systems (Rashbash 1961; Fleming et al.
1969). Position errors less than approximately 0.5º are generally not corrected, since
the image lies on the parafovea (Rashbass 1961; Young and Stark 1963). The reaction
time and the refractory period of the PEM system is less than those of the saccadic
system (Young and Stark 1963).
When target velocity increases, PEM becomes more saccadic and the relative
share of pure PEM decreases (van den Berg and Collewijn 1986). When the velocity of
pure PEMs is reduced, the number of superimposed saccades is increased, while the
total amplitude of tracking may be normal or decreased (Pyykkö and Schalén 1984).
Velocity gain values of PEMs are influenced by target motion characteristics:
target velocity, target acceleration, motion amplitude, and target frequency (Versino
and Cosi 1990). The performance of the PEMs depends upon the spatio-temporal
characteristics of the target movement (i.e., the amplitude, pattern and velocity)
(Buizza and Schmid 1986).
37
The upper limit of human PEM velocity with a ramp stimulus is about 87 º/s and
with a target velocity of 100 º/s (Meyer et al. 1985). At this value, eye velocity
saturates (Meyer et al. 1985). According to Robinson (1981), the peak velocity of
normal PEMs is not certain. Robinson (1981) has summarized the findings of different
reports; the peak velocity of normal PEMs may range from 30º/s to 130º/s.
In velocity gain, there are no directional asymmetries according to van den Berg
and Collewijn (1986). They found that directional preferences are absent when a
subject pursues the target actively, and they showed that directional preferences are
enhanced if foveal function is lowered. The stronger cortical guidance of the eye
movements during pursuit decreases the variance of PEM with respect to the direction
of the stimulus movement (van den Berg and Collewijn 1986).
In PEMs, the reaction time to a sudden change in velocity is about 130 ms
(Robinson 1965). Of this time, 55 ms can be lost in the visual system and 25 ms in
the motor system; the 50 ms left reflects central processing (Robinson 1981).
2. D. 3. Effect of environmental factors on voluntary eye movements
Saccadic performance is affected by alertness and fatigue (Becker and Fuchs 1969;
Schmidt et al. 1979), alcohol (Franck and Kuhlo 1970; Wilkinson et al. 1974; Tedeschi
et al. 1986), drugs (Aschoff 1968; Gentles and Thomas 1971; Tedeschi et al. 1986)
among others.
With increasing fatigue, the PEM is increasingly replaced by saccades in the
tracking task (Bahil et al. 1980). Also, the PEM system is influenced by alcohol,
drugs, or by mental conditions (Rashbass 1961; Norris 1971; Wilkinson et al. 1974;
Flom et al. 1976; Baloh et al. 1976; Bahill et al. 1980). It seems that the PEM system
is more vulnerable than the saccadic system (Rashbass 1961).
In the study of Schmidt et al. (1979) fatigue of the extra-ocular muscles was not
found to influence the saccadic peak velocity, but mental fatigue reduced the saccadic
peak velocity. During normal use, the extra-ocular muscles never show symptoms of
fatigue (Fuchs and Binder 1983).
Tedeschi et al. (1986) studied the effects of drugs and alcohol on saccadic eye
movements. They found that: 1) amylobarbitone caused significant reduction of
saccadic peak velocity, 2) amphetamine taken perorally did not affect saccadic eye
movements; but when it was received in I.V. injections, it abolished a fatigue effect of
repeated testing on saccadic eye movements, and 3) alcohol impaired the saccadic eye
movements.
Alcohol reduces the peak and mean velocities of saccades (Franck and Kuhlo
1970; Lehtinen et al. 1979). Diazepam reduces mean saccadic velocity and
disintegrates the usual one-step saccade into several short steps (Aschoff 1968).
38
In the study of Norris (1971), the effect of a benzodiazepine (nitrazepam) on PEMs
was compared to that of a barbiturate (sodium phenobarbitone). Both caused
saccadization of PEMs.
Psychological factors, such as motivation and attention (Becker and Fuchs 1969;
Shagass et al. 1976; Schmidt et al. 1979; Robinson 1981; Siever et al. 1989; Versino
and Cosi 1990), and cognitive expectation (Kowler and Steinman 1981; Kowler 1989),
can affect the PEM and saccadic performance.
Saccades made in the dark are considerably slower than saccades made at
clearly visible targets (Becker and Fuchs 1969). Saccades made with monocular
viewing seem to be as accurate as those made with binocular viewing (Lemij and
Collewijn 1989). According to Robinson (1964), in most normal subjects, temporal
saccades are executed with a higher velocity and with more overshoot than nasal
saccades. This asynchrony of action can result in an instantaneous image disparity
between the two eyes of as much as 2.5º, as they make conjugate 15º saccades
(Robinson 1964).
Boghen et al. (1974) studied the effect of the direction of stimulus movements in
saccadic peak velocity. They tested temporal, nasal, centering, eccentric and across-
the-center saccades in 15 normal subjects with 5º, 10º, 20º and 30º saccades. They
found considerable intra- and intersubject variability, and they concluded that it is
necessary to record a sufficient number of subjects and eye movements (of certain
magnitude) to accurately define these responses. They found that there was no
significant difference among various types of saccades, except for the peak velocity of
nasal refixations that were significantly greater at the 30° amplitude than that of
temporal saccades.
In the study of Abel et al. (1979) on the peak velocity-amplitude differences in
extremes of lateral gaze (between targets at 30° and 40°), there was no significant
difference between temporal and nasal saccades. There were no peak velocity
differences between movements in the left and right fields of gaze or between the two
eyes moving in the same direction (Abel et al. 1979).
2. E. Voluntary eye movement and disease
2. E. 1. Pathophysiological aspects of voluntary eye movements
Lesions in the brain stem induce a reduction of saccadic peak velocity (Baloh et al.
1977). Because of the anatomical proximity of the brain stem and cerebellum most
pathology in the posterior fossa yields combined disorders of cerebellum and brain
stem (Pyykkö and Schalén 1984). In solitary cerebellar lesions, the saccadic peak
velocity is not reduced (Baloh et al. 1977; Pyykkö and Schalén 1984) or is even
enhanced (Pyykkö and Schalén 1984). In combined lesions, saccadic peak velocity is
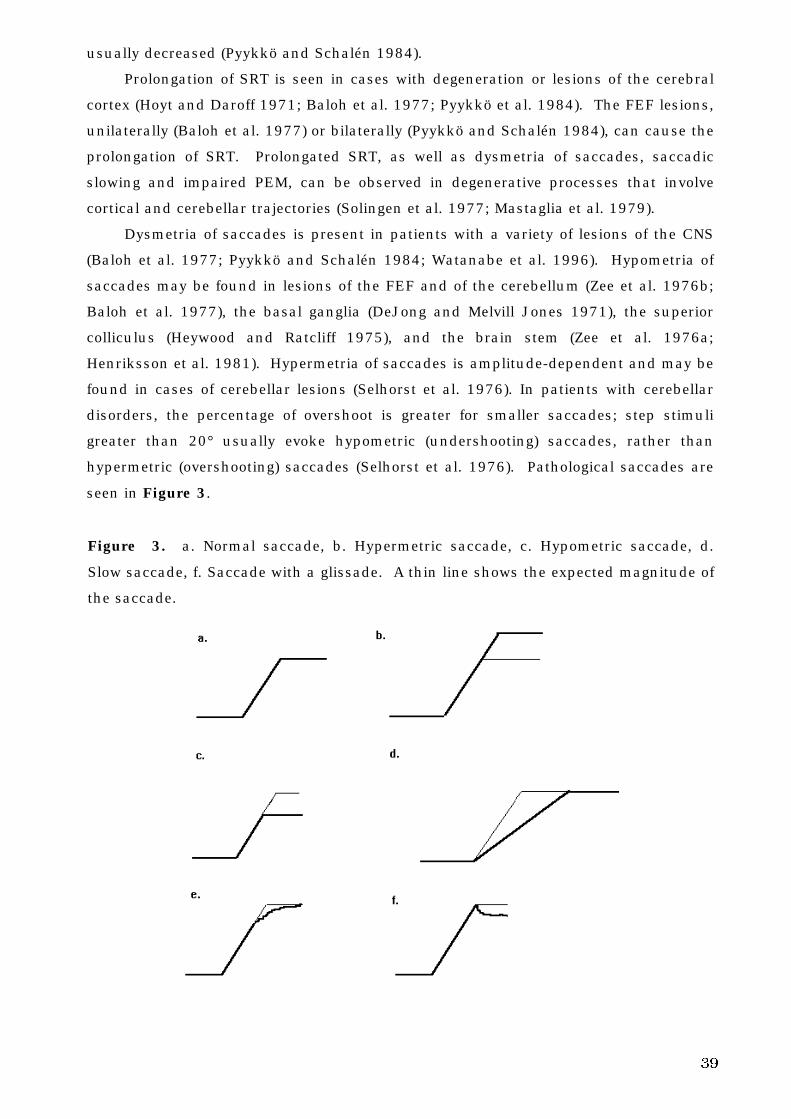
39
usually decreased (Pyykkö and Schalén 1984).
Prolongation of SRT is seen in cases with degeneration or lesions of the cerebral
cortex (Hoyt and Daroff 1971; Baloh et al. 1977; Pyykkö et al. 1984). The FEF lesions,
unilaterally (Baloh et al. 1977) or bilaterally (Pyykkö and Schalén 1984), can cause the
prolongation of SRT. Prolongated SRT, as well as dysmetria of saccades, saccadic
slowing and impaired PEM, can be observed in degenerative processes that involve
cortical and cerebellar trajectories (Solingen et al. 1977; Mastaglia et al. 1979).
Dysmetria of saccades is present in patients with a variety of lesions of the CNS
(Baloh et al. 1977; Pyykkö and Schalén 1984; Watanabe et al. 1996). Hypometria of
saccades may be found in lesions of the FEF and of the cerebellum (Zee et al. 1976b;
Baloh et al. 1977), the basal ganglia (DeJong and Melvill Jones 1971), the superior
colliculus (Heywood and Ratcliff 1975), and the brain stem (Zee et al. 1976a;
Henriksson et al. 1981). Hypermetria of saccades is amplitude-dependent and may be
found in cases of cerebellar lesions (Selhorst et al. 1976). In patients with cerebellar
disorders, the percentage of overshoot is greater for smaller saccades; step stimuli
greater than 20° usually evoke hypometric (undershooting) saccades, rather than
hypermetric (overshooting) saccades (Selhorst et al. 1976). Pathological saccades are
seen in Figure 3.
Figure 3. a. Normal saccade, b. Hypermetric saccade, c. Hypometric saccade, d.
Slow saccade, f. Saccade with a glissade. A thin line shows the expected magnitude of
the saccade.
40
Total cerebellectomy creates an enduring saccadic hypermetria and glissade
(Optican and Robinson 1980). From these findings, it can be concluded that total
cerebellectomy destroys both the pulse and step plasticity and the adaptive control of
the saccadic system, (i.e., it abolishes all adaptive repair of the saccadic system)
(Optican and Robinson 1980). Total cerebellectomy also severely impairs PEM and
optokinetic nystagmus (Westheimer and Blair 1973; Westheimer and Blair 1974;
Optican and Robinson 1980). When posterior vermis (lobules IV-IX) and paravermis
are injured, PEM is preserved, but saccades become abnormally hypermetric (Optican
and Robinson 1980). In these lesions, the glissade does not occur because the
adaptive plasticity of the step is spared (Optican and Robinson 1980).
Bilateral flocculectomies cause the adaptive control of glissade to be severely
injured (Optican et al. 1980; Optican et al. 1986), and it seems that the flocculus is
involved in the adaptive control of the step (Optican and Robinson 1980).
Deficits following a middle temporal visual area lesion seem to result from
disruption of visual processing, whereas the effects of lesions of higher cortical areas
(i.e., striate cortex or parietal cortex) have motor components as well (Newsome et al.
1985). Visual cortex is crucial for saccades and PEM (Goldberg et al. 1982; Tychsen
and Lisberger 1986; Zee et al. 1987). Damage to parieto-occipital areas of the
cerebral cortex associated with vision causes deficits in PEM (Baloh et al. 1980; Leigh
and Tusa 1985). Bilateral damage to lateral temporo-occipital areas of the cerebral
cortex associated with vision causes disturbance in perception of movement in depth
(Zihl et al. 1983). Both of these aforementioned cerebral lesions (Baloh et al. 1980;
Leigh and Tusa 1985; Zihl et al. 1983) are extensive by nature, and explain why
deficits in PEM are found. In monkeys, lesions in the primary visual cortex
(Broadman’s area 17, 18, 19) or the middle temporal visual area (Goldberg et al.
1982; Newsome et al. 1985; Zee et al. 1987) cause deficits in the initiation of pursuit.
Duhamel et al. (1992) observed during saccadic performance in a patient with a
fronto-parietal lesion, that the frontal and parietal lobes are critical for processing
both retinal and eye movement informations.
The final common integrator for the conjugate eye movement systems is affected
by lesions of the cerebellum, especially the flocculus and paraflocculus (Zee et al.
1981; Waespe et al. 1983).
Flocculectomy in primates causes a gaze deviation nystagmus, saccadic PEMs, a
downbeat nystagmus and a post-saccadic drift in saccades (Zee et al. 1981). Patients
with hereditary cerebellar ataxia, cannot produce normal PEMs (Zee et al. 1976b).
Pathological PEMs are seen in Figure 4.
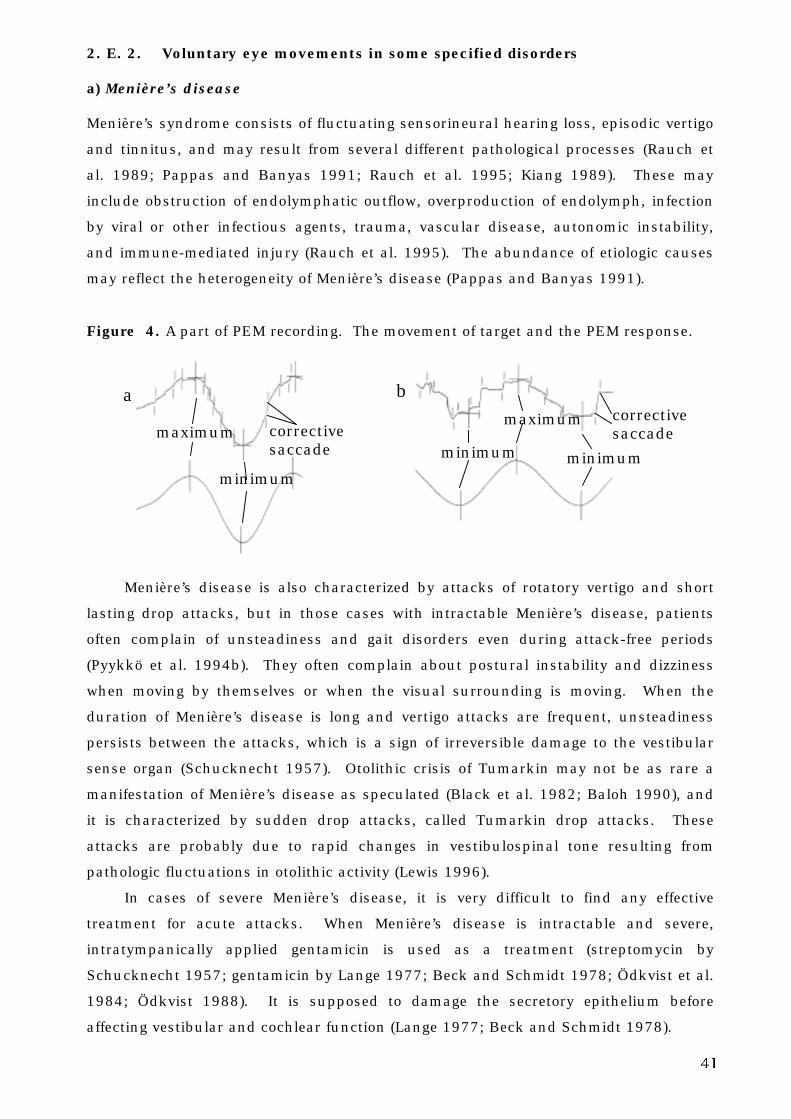
41
2. E. 2. Voluntary eye movements in some specified disorders
a) Menière’s disease
Menière’s syndrome consists of fluctuating sensorineural hearing loss, episodic vertigo
and tinnitus, and may result from several different pathological processes (Rauch et
al. 1989; Pappas and Banyas 1991; Rauch et al. 1995; Kiang 1989). These may
include obstruction of endolymphatic outflow, overproduction of endolymph, infection
by viral or other infectious agents, trauma, vascular disease, autonomic instability,
and immune-mediated injury (Rauch et al. 1995). The abundance of etiologic causes
may reflect the heterogeneity of Menière’s disease (Pappas and Banyas 1991).
Figure 4. A part of PEM recording. The movement of target and the PEM response.
Menière’s disease is also characterized by attacks of rotatory vertigo and short
lasting drop attacks, but in those cases with intractable Menière’s disease, patients
often complain of unsteadiness and gait disorders even during attack-free periods
(Pyykkö et al. 1994b). They often complain about postural instability and dizziness
when moving by themselves or when the visual surrounding is moving. When the
duration of Menière’s disease is long and vertigo attacks are frequent, unsteadiness
persists between the attacks, which is a sign of irreversible damage to the vestibular
sense organ (Schucknecht 1957). Otolithic crisis of Tumarkin may not be as rare a
manifestation of Menière’s disease as speculated (Black et al. 1982; Baloh 1990), and
it is characterized by sudden drop attacks, called Tumarkin drop attacks. These
attacks are probably due to rapid changes in vestibulospinal tone resulting from
pathologic fluctuations in otolithic activity (Lewis 1996).
In cases of severe Menière’s disease, it is very difficult to find any effective
treatment for acute attacks. When Menière’s disease is intractable and severe,
intratympanically applied gentamicin is used as a treatment (streptomycin by
Schucknecht 1957; gentamicin by Lange 1977; Beck and Schmidt 1978; Ödkvist et al.
1984; Ödkvist 1988). It is supposed to damage the secretory epithelium before
affecting vestibular and cochlear function (Lange 1977; Beck and Schmidt 1978).
minimum
maximum correctivesaccade
minimum
b
minimum
a
maximum correctivesaccade
42
Bergenius (1985) studied 205 patients having unilateral hearing loss with
audiovestibular tests. There were two patient groups: a cochlear group (117 patients;
6 of them with Menière’s disease, others with sudden deafness, hereditary factors,
head injuries, and unknown etiologies), and a retrocochlear group (88 patients, most
of them tumorous, some with brain stem hemorrhages). Deranged saccadic pursuit
and a significantly reduced peak velocity in voluntary saccades were considered
pathological. Pathological results of at least one of the oculomotor tests, as well as the
presence of gaze nystagmus, were denoted as oculomotor dysfunction. Bergenius
(1985) found that patients with cochlear hearing loss seldom have oculomotor
disturbance.
b) Cerebello-pontine angle tumors
The term cerebello-pontine angle (CPA) tumor is used in this study according to Lo
(1994). He divides CPA tumors in extra-axial (located in the extra-axial compartment),
extradural (extradural in origin but intrude into the CPA) and intra-axial (arising from
the brain) tumors. CPA tumors consist of about 10% of all intracranial tumors (Zülch
1986; Russell and Rubinstein 1989). The differential diagnosis of a space-occupying
lesion of the CPA consists primarily of vestibular schwannoma (from about 80 to 90%)
and meningioma (from 3 to 12%) (Thomsen 1976; Brackmann and Bartels 1980;
Berlinger et al. 1980; Nedzelski and Tator 1982; Eldridge and Parry 1992). The
remaining masses include primary cholesteatoma (2%), facial nerve neuroma (1%),
neuromas of other cranial nerves (0.2%) and other rare tumors (e.g., hemangioma,
astrocytoma, medulloblastoma, glomus tumor) (Thomsen 1976; Brackmann and
Bartels 1980; Berlinger et al. 1980).
Vestibular schwannoma
The largest and most common tumor in the CPA is vestibular schwannoma (Eldridge
and Parry 1992). Vestibular schwannoma occurs in two forms: sporadic or
neurofibromatosis type 2 (NF2). Sporadic tumors are unilateral and comprise almost
95% of the cases, while lesions associated with NF2 are typically bilateral and account
for about 5% of vestibular schwannoma patients (Jackler 1994).
Vestibular schwannomas arise from the vestibular division of the eighth cranial
nerve, and according to current opinion, originate from the superior or inferior
divisions of the nerve equally (Clemis et al. 1986; Jackler 1994). Almost all vestibular
schwannomas arise within the internal auditory canal (Jackler 1994; McKenna et al.
1993). Lanser et al. (1992) and Selesnick and Jackler (1992), suggest vestibular
schwannomas originate within the internal auditory canal at the junction of peripheral
and central myelin. In vestibular schwannoma (both sporadic and NF2), an aberration
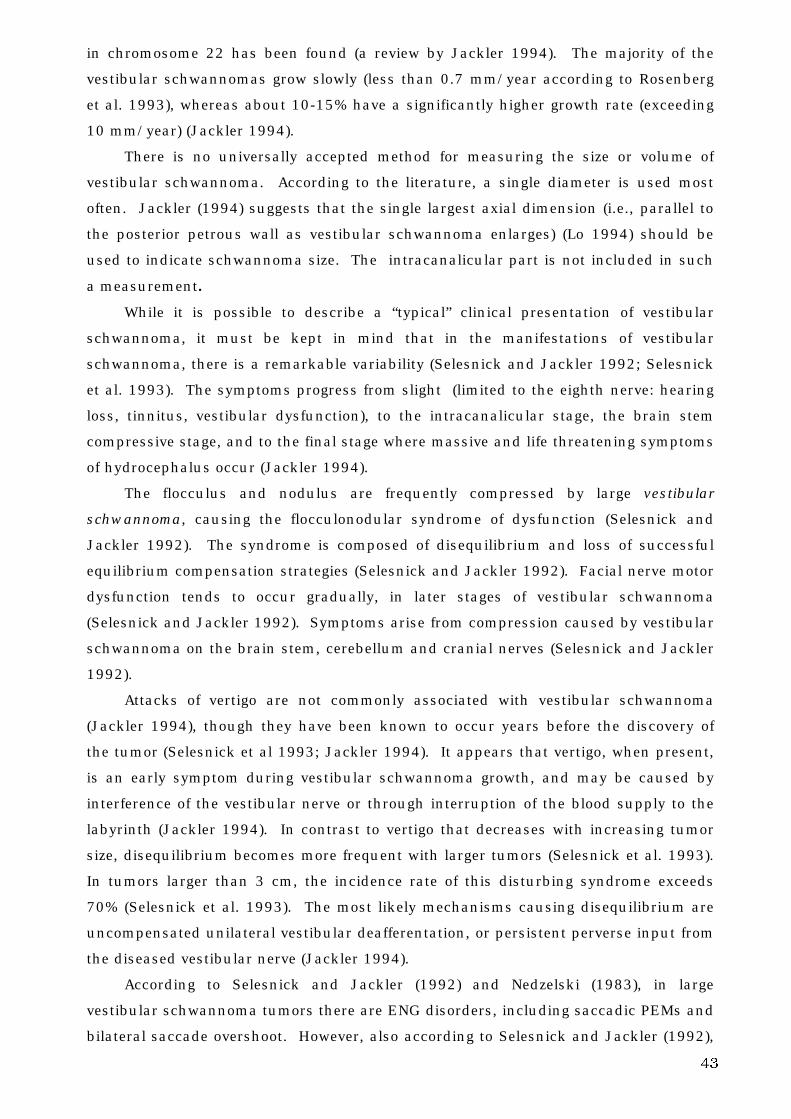
43
in chromosome 22 has been found (a review by Jackler 1994). The majority of the
vestibular schwannomas grow slowly (less than 0.7 mm/year according to Rosenberg
et al. 1993), whereas about 10-15% have a significantly higher growth rate (exceeding
10 mm/year) (Jackler 1994).
There is no universally accepted method for measuring the size or volume of
vestibular schwannoma. According to the literature, a single diameter is used most
often. Jackler (1994) suggests that the single largest axial dimension (i.e., parallel to
the posterior petrous wall as vestibular schwannoma enlarges) (Lo 1994) should be
used to indicate schwannoma size. The intracanalicular part is not included in such
a measurement.
While it is possible to describe a “typical” clinical presentation of vestibular
schwannoma, it must be kept in mind that in the manifestations of vestibular
schwannoma, there is a remarkable variability (Selesnick and Jackler 1992; Selesnick
et al. 1993). The symptoms progress from slight (limited to the eighth nerve: hearing
loss, tinnitus, vestibular dysfunction), to the intracanalicular stage, the brain stem
compressive stage, and to the final stage where massive and life threatening symptoms
of hydrocephalus occur (Jackler 1994).
The flocculus and nodulus are frequently compressed by large vestibular
schwannoma, causing the flocculonodular syndrome of dysfunction (Selesnick and
Jackler 1992). The syndrome is composed of disequilibrium and loss of successful
equilibrium compensation strategies (Selesnick and Jackler 1992). Facial nerve motor
dysfunction tends to occur gradually, in later stages of vestibular schwannoma
(Selesnick and Jackler 1992). Symptoms arise from compression caused by vestibular
schwannoma on the brain stem, cerebellum and cranial nerves (Selesnick and Jackler
1992).
Attacks of vertigo are not commonly associated with vestibular schwannoma
(Jackler 1994), though they have been known to occur years before the discovery of
the tumor (Selesnick et al 1993; Jackler 1994). It appears that vertigo, when present,
is an early symptom during vestibular schwannoma growth, and may be caused by
interference of the vestibular nerve or through interruption of the blood supply to the
labyrinth (Jackler 1994). In contrast to vertigo that decreases with increasing tumor
size, disequilibrium becomes more frequent with larger tumors (Selesnick et al. 1993).
In tumors larger than 3 cm, the incidence rate of this disturbing syndrome exceeds
70% (Selesnick et al. 1993). The most likely mechanisms causing disequilibrium are
uncompensated unilateral vestibular deafferentation, or persistent perverse input from
the diseased vestibular nerve (Jackler 1994).
According to Selesnick and Jackler (1992) and Nedzelski (1983), in large
vestibular schwannoma tumors there are ENG disorders, including saccadic PEMs and
bilateral saccade overshoot. However, also according to Selesnick and Jackler (1992),
44
large vestibular schwannoma tumors often show normal ENG results - i.e. no
spontaneous, positional or gaze nystagmus, normal saccades, PEMs, optokinetic
nystagmus, normal caloric test, and normal fixation suppression of caloric response.
Nedzelski (1983) found that abnormalities of PEMs, optokinetic nystagmus, gaze, and
saccades in patients with large CPA tumors are caused by bilateral flocculus
compression. He also reported that PEMs and optokinetic nystagmus were more
sensitive than other oculomotor functions to the compressive effects of a CPA tumor.
Mrazek (1989) studied 47 vestibular schwannoma patients. In large or giant
tumors, ocular dysmetria and lagging of the eyes during fixation on a moving target
compensated by corrective saccades, provided evidence on the size of the tumor
(Mrazek 1989). Symptoms were caused by compression of brain stem and the
flocculonodular part of the cerebellum, which correlate with surgical and CT findings
(Mrazek 1989).
Hulshof et al. (1989) examined 48 surgically confirmed vestibular schwannoma
patients preoperatively with tests of fixation, optokinetic, spontaneous, and positional
nystagmus, as well as caloric tests, saccades and PEMs. They found a significant
correlation with the size of the tumor and the occurrence of abnormal saccades
(dysmetria, flutter, opsoclonus), saccadic PEMs and the occurrence of gaze nystagmus,
respectively. These tests were sensitive in tumors larger than 2 cm. In the study of
Bergenius (1985), oculomotor disturbances were noted in nearly half of the
retrocochlear group. The presence of oculomotor disturbance in patients with
retrocochlear hearing loss strongly indicates brain stem and/or cerebellar involvement,
because when only those patients with lesions of the brain stem or cerebellum were
considered, all exhibited such disturbances (Bergenius 1985). According to Jackler
(1994), abnormalities in PEMs are seen in a minority of large vestibular schwannoma.
Meningioma
Meningiomas originate from cell elements that form meninges and their derivatives in
the meningeal spaces (Rubinstein 1972). The affinity of meningiomas for arachnoid
villi accounts for the regularity with which meningiomas are attached to the dura
(Rubinstein 1972). The preferential sites of origin of meningiomas correspond very
closely to the points where the villi are most prevalent (Rubinstein 1972).
Meningiomas account for about 13 to 18% of all primary intracranial tumors
(Rubinstein 1972). In the posterior fossa, the CPA is the most common location; two
thirds of the posterior fossa meningiomas arise at the porus acusticus or medial to it,
near the superior petrosal sinus (Nager and Masica 1970; Nager et al. 1983).
According to Brackmann and Bartels (1980) meningiomas account for 3.1% of the CPA
tumors (glomus tumors were excluded from their study).
45
Meningiomas occur at any age, most commonly between 20 and 60 years of age,
with the peak incidence rate at about 45 years (Nager et al. 1983). Incidence in
females is greater than in males (Rubinstein 1972). Small symptomless meningiomas
are often found in elderly, postmortem subjects (Rubinstein 1972). Symptoms of CPA
meningiomas can be minimal and often vague, even with large tumors (Kumar et al.
1988). Initial symptoms can be otologic (Kumar et al. 1988). Meningiomas represent
a serious form of neoplasm, characterized by frequent recurrences and metastases,
which spread beyond the skull (Nager et al. 1983). The predominant symptoms of
meningiomas involving the temporal bone are progressive hearing loss, headaches,
vertigo, tinnitus, otorrhea, otalgia, facial weakness and/or loss of taste (Nager et al.
1983).
Kumar et al. (1988) studied 5 patients with CPA meningiomas. Saccadic tests
were normal in all patients. The PEM test was saccadic in one patient and normal in
the others. Three of the patients had subjective feelings of imbalance or dizziness.
According to Lalwani (1992), clinical manifestations of CPA meningiomas are
similar to those of vestibular schwannoma (hearing loss and tinnitus) and are to some
extent, more common in vestibular schwannoma, but trigeminal dysfunction occurs
more often in CPA meningiomas. Lalwani (1992) reported that physical findings and
audiovestibular test results are also similar in vestibular schwannoma patients and
CPA meningioma patients.
Glomus jugulare tumor
Glomus jugulare tumors are benign but locally invasive neoplasms (Belal Jr. and Sanna
1982). They arise from elements that form part of the chemoreceptor system, and originate
in the middle ear from the glomus jugulare (which consists of a group of cells situated in
the adventitia of the jugular bulb), or along the ramus tympanicus of the glossopharyngeal
nerve (Rubinstein 1972). The histologic picture is identical with that of a carotid body
tumor; the diagnosis presents no difficulty in cases where the histologic picture is typical,
but may be missed in those examples presenting clinically as a posterior fossa tumor
(Rubinstein 1972). Glomus jugulare tumors often follow a consistent clinical pattern in
their growth and extension (Rosenwasser 1968). According to Rosenwasser (1968), some
glomus jugulare tumors originate or arise from glomus structures in the jugular bulb region,
and then spread elsewhere, while other tumors remain confined to the middle ear.
The diagnosis of glomus jugulare tumors is based on both clinical and radiological
studies (Belal Jr. and Sanna 1982). A history of unilateral progressive conductive hearing
loss, pulsating tinnitus synchronous with the heartbeat, and episodes of acute bleeding
from the ear are all symptoms of glomus jugulare tumors (Belal Jr. and Sanna 1982).
Large glomus jugulare tumors easily affect the inner ear (Belal Jr. and Sanna 1982);
sometimes patients with glomus jugulare tumors experience dizziness (Rosenwasser
1968). There appears to be no studies of saccade tests and pursuit tests in glomus
jugulare patients.
46
Medulloblastoma
Tumors of neuronal and glial origin arising from the cerebellum and brain stem of adult
patients may mimic an extra-axial CPA tumor (e.g., vestibular schwannoma, meningioma),
and not present as an intra-axial tumor (House and Burt 1985). The site of origin and
presumed tissue type may not be evident even after a complete neurotologic evaluation
and computed tomography (CT) (House and Burt 1985). But they behave more
aggressively than the more common extra-axial CPA tumors (House and Burt 1985).
Medulloblastoma is a malignant tumor of glial origin, a primary brain tumor occurring in
the cerebellum (Rubinstein 1972). Medulloblastoma cells are largely primitive or poorly
differentiated. Most medulloblatomas show little or no evidence of differentiation
(Rubinstein 1972). Medulloblastoma is a common mid-line posterior fossa tumor of
childhood, but it may occur in adults when it is more laterally placed (Rubinstein 1972;
House and Burt 1985). Approximately one-third of these cases will occur in adolescence
and early adulthood, between the ages of 15 and 35 years; mainly situated in the lateral
lobes (Rubinstein 1972). It may sometimes present in the CPA (House and Burt 1985;
Brackmann and Bartels 1980).
The clinical picture of medulloblastoma is almost always that of a posterior fossa
tumor (Rubinstein 1972). When present in the CPA, the symptoms of the tumor are
produced by mass effect of tumor on adjacent structures in the CPA (Brackmann and
Bartels 1980). The rapid development of audiovestibular symptoms in patients with
symptoms of brain stem dysfunction and normal petrous pyramid x-rays should lead one
to suspect an axial brain stem neoplasm (Brackmann and Bartels 1980; House and Burt
1985).
After a review of the literature, there appears to be no studies of saccade tests and
pursuit tests in patients with CPA medulloblastoma.
c) Hemangioblastomas
Hemangioblastoma (HAB) is widely regarded as being vascular in origin (Rubinstein
1972), a cytologically benign vascular neoplasm of the CNS (Resche et al. 1993).
Although grossly well defined, HABs have no capsule; the neoplasm is always found to
reach the pia, and it often sprouts in a somewhat irregular fashion to the adjacent
brain (Rubinstein 1972). Incomplete removal, therefore, leads to recurrence
(Rubinstein 1972).
HABs have their own anatomical, pathological, clinical and epidemiological
characteristics that separate them from other vascular tumors of the neuraxis (Resche
et al. 1993). They usually present as cystic cerebellar tumors (Rubinstein 1972;
House and Burt 1985). HABs are relatively uncommon, and their incidence ranges
from 2 to 3% of all CNS tumors (Resche et al. 1993). HABs occur most often in
posterior fossa, almost always in the cerebellum (Rubinstein 1972; Resche et al.
1993), occasionally in the spinal cord and rarely in supratentorial locations
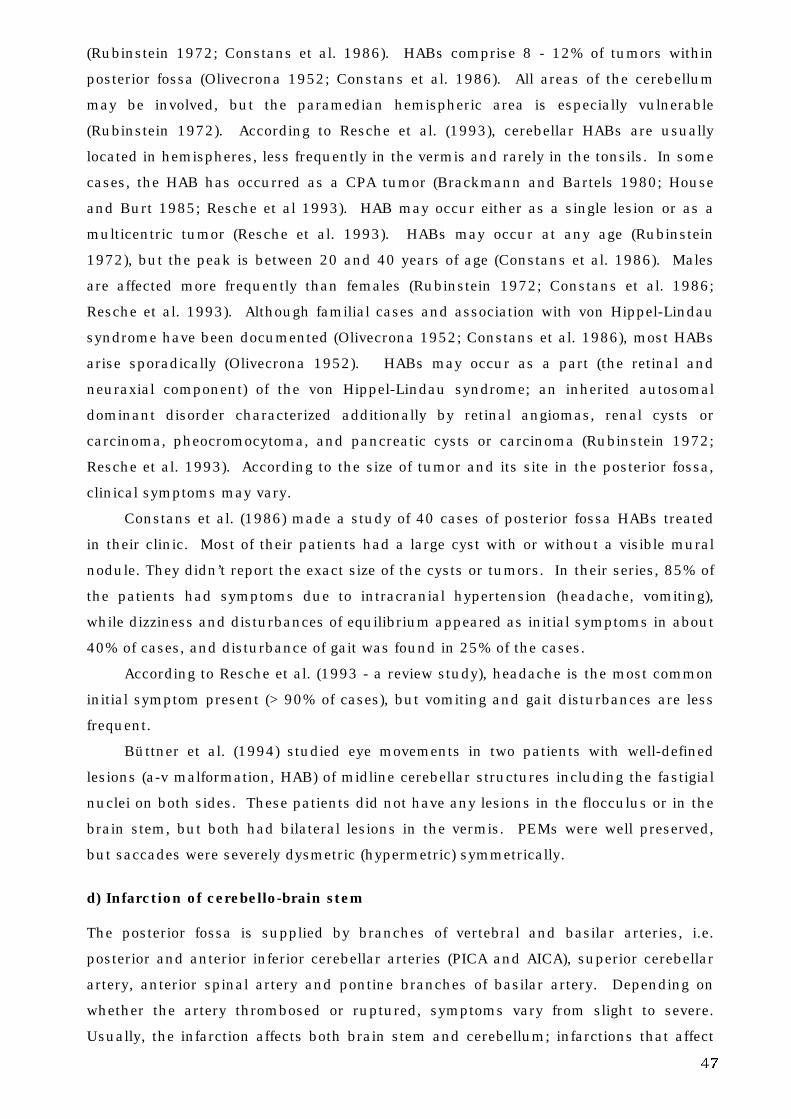
47
(Rubinstein 1972; Constans et al. 1986). HABs comprise 8 - 12% of tumors within
posterior fossa (Olivecrona 1952; Constans et al. 1986). All areas of the cerebellum
may be involved, but the paramedian hemispheric area is especially vulnerable
(Rubinstein 1972). According to Resche et al. (1993), cerebellar HABs are usually
located in hemispheres, less frequently in the vermis and rarely in the tonsils. In some
cases, the HAB has occurred as a CPA tumor (Brackmann and Bartels 1980; House
and Burt 1985; Resche et al 1993). HAB may occur either as a single lesion or as a
multicentric tumor (Resche et al. 1993). HABs may occur at any age (Rubinstein
1972), but the peak is between 20 and 40 years of age (Constans et al. 1986). Males
are affected more frequently than females (Rubinstein 1972; Constans et al. 1986;
Resche et al. 1993). Although familial cases and association with von Hippel-Lindau
syndrome have been documented (Olivecrona 1952; Constans et al. 1986), most HABs
arise sporadically (Olivecrona 1952). HABs may occur as a part (the retinal and
neuraxial component) of the von Hippel-Lindau syndrome; an inherited autosomal
dominant disorder characterized additionally by retinal angiomas, renal cysts or
carcinoma, pheocromocytoma, and pancreatic cysts or carcinoma (Rubinstein 1972;
Resche et al. 1993). According to the size of tumor and its site in the posterior fossa,
clinical symptoms may vary.
Constans et al. (1986) made a study of 40 cases of posterior fossa HABs treated
in their clinic. Most of their patients had a large cyst with or without a visible mural
nodule. They didn’t report the exact size of the cysts or tumors. In their series, 85% of
the patients had symptoms due to intracranial hypertension (headache, vomiting),
while dizziness and disturbances of equilibrium appeared as initial symptoms in about
40% of cases, and disturbance of gait was found in 25% of the cases.
According to Resche et al. (1993 - a review study), headache is the most common
initial symptom present (> 90% of cases), but vomiting and gait disturbances are less
frequent.
Büttner et al. (1994) studied eye movements in two patients with well-defined
lesions (a-v malformation, HAB) of midline cerebellar structures including the fastigial
nuclei on both sides. These patients did not have any lesions in the flocculus or in the
brain stem, but both had bilateral lesions in the vermis. PEMs were well preserved,
but saccades were severely dysmetric (hypermetric) symmetrically.
d) Infarction of cerebello-brain stem
The posterior fossa is supplied by branches of vertebral and basilar arteries, i.e.
posterior and anterior inferior cerebellar arteries (PICA and AICA), superior cerebellar
artery, anterior spinal artery and pontine branches of basilar artery. Depending on
whether the artery thrombosed or ruptured, symptoms vary from slight to severe.
Usually, the infarction affects both brain stem and cerebellum; infarctions that affect

48
only the cerebellum are comparatively rare (Büttner et al. 1981; Keller 1988;
Magnusson and Norrving 1993).
Ischemia in the AICA distribution damages the central and peripheral vestibular
system. It presents with isolated vertigo, vertigo associated with cochlear symptoms,
or vertigo associated with dysfunction of the dorsal lateral pons and cerebellum (Oas
and Baloh 1992). Diseases of posterior circulation (vertebrobasilar distribution, AICA
and PICA distributions) may present with vertigo that is associated with central
symptoms, with isolated vertigo, with vertigo and cochlear symptoms, or with a
combination of central and peripheral abnormalities (Lewis 1996). Vertigo in these
cases is usually monophasic (i.e. in stroke), but vascular disease affecting the
vertebrobasilar circulation (transient ischemic attacks) present with recurrent episodes
of vertigo (Lewis 1996). However, according to Amarenco et al. (1990), Pierrot-
Deseilligny et al. (1990), and Magnusson and Norrving (1993), in cerebellar infarctions
vertigo is the first and the most prominent, if not the sole, symptom. Infarction in the
distribution area of distal PICA causes acute vertigo and nystagmus, which can
simulate acute peripheral vestibular disorders (Rubenstein et al. 1980). The AICA and
branches of PICA supply the flocculo-nodular lobe (Carpenter and Sutin 1983).
Infarction in the territory of superior cerebellar artery, including the posterior inferior
vermis, the oculomotor vermis (Noda and Fujikado 1987a; Noda and Fujikado 1987b;
Noda et al. 1988), dentate and fastigial nucleus (Carpenter and Sutin 1983), causes
ataxia of gait and seldom any vertigo (Kase et al. 1985).
Kato et al. (1986) studied positional nystagmus, optokinetic nystagmus, fixation
suppression of caloric nystagmus and PEM tests in cerebellar lesions. They observed
a patient with a large low-density area in the left cerebellum (indicating a cerebellar
infarction), and the patient had no cerebellar signs and symptoms nor abnormal
findings in the oculomotor tests. In bilateral cerebellar infarctions and hemorrhages,
PEMs were always pathologic (saccadic) and in unilateral cases PEMs were mostly
pathologic (in 12 to 14 cases) (Kato et al. 1986).
Yee (1989) made a study of findings in clinical examinations and results of eye
movement recordings in 91 consecutive patients with downbeat nystagmus. PEMs,
saccades, VOR and visual-vestibular interactions and optokinetic nystagmus were
tested in addition to different nystagmus tests. Of these patients, 22 patients had a
cerebellar or cerebello-brain stem infarction. Diagnosis of the cause of downbeat
nystagmus was obtained by neurologic examinations; CT scans were made, but could
not be used in obtaining the diagnosis (e.g., in most patients with infarctions CT scans
were not sensitive enough to demonstrate the lesions). The majority of downbeat
nystagmus patients (72 out of 91) were tested with eye movement tests, and almost all
(99%) had abnormal horizontal eye movements of cerebellar pattern (including
impaired PEMs, impaired OKN, inability to suppress VOR) (Yee 1989). When their
49
results were compared to control subjects (19) and cerebellar atrophy patients (11),
control subjects differed from both patient groups, but the patient groups didn’t differ
from each other. In 87% of the patients with downbeat nystagmus, the localizations of
lesions made by eye movement recordings were restricted to the cerebellum alone.
According to Yee (1989), it seems that downbeat nystagmus is usually produced by
lesions in the cerebellum which also damage pathways that control the horizontal PEM
system and the visual-vestibulo-ocular interactions.
In a study of Magnusson and Norrving (1993), 24 consecutive patients with
sudden onset of vertigo but without cochlear or neurological symptoms, were
examined with neuro-imaging techniques and with saccades, PEMs, caloric
nystagmus, spontaneous nystagmus, gaze nystagmus and optokinetic nystagmus.
MRIs or CTs were imaged on all patients, and Doppler sonography of the vertebral and
carotid arteries were investigated. Six of these 24 patients diagnosed as having a
vestibular neuritis had a verified cerebellar infarction in MRI or CT. Vertebral artery
occlusion without a demonstrated infarction was found in two subjects. All of the
subjects with cerebellar infarctions had severely reduced PEM. In other subjects, PEM
was not considered pathological.
Allum et al. (1991) studied normal subjects, patients with peripheral vestibular
disorders, vestibular schwannoma, central vestibular disorder (pontine infarction) and
tested them with optokinetic nystagmus, PEM test, VOR and caloric responses. Of
these tests, contralateral slow-phase velocity to the 15°/s stimulus in the PEM test
and gain asymmetry to a 30°/s optokinetic stimulus were the best measures to
differentiate patients with central vestibular disorder from those with peripheral
vestibular disorder and from normal subjects. However, PEM measures could not
significantly differentiate patients with central vestibular disorder from patients with
vestibular schwannoma. This may be due to the frequent correcting saccades
demonstrated by patients with vestibular schwannoma in the eye tracking test (Allum
et al. 1991).
Pierrot-Deseilligny et al. (1990) observed an infarction in the region of the left
PICA (mainly its medial branch) in a patient that was 80 years old. The patient had
experienced sudden vertigo with unsteadiness, vomiting, and posterior headache, but
she had no auditory symptoms. Her ipsilateral upper limb was ataxic, she had ipsilat-
eral conjugate gaze deviation, and concomitantly the head deviated towards the lesion.
Otherwise, she did not have any neurologic deficits. Her MRI showed damages in the
inferior part of the vermis (from VI to X lobules), and the lesions extended to the
inferior part of the ipsilateral cerebellar hemisphere. The flocculus, cerebellar
peduncles and brain stem were spared. Horizontal saccades were totally normal;
foveal PEM tested with a sinusoidally moving small target was saccadic bilaterally.
The velocity gain of PEM was bilaterally low. The case study of Pierrot-Deseilligny et
50
al. (1990) is in line with the findings of Suzuki and Keller (1983), Keller (1988) and
Keller and Heinen (1991), showing that the posterior vermis is involved in PEMs.
2. F. Diagnostic aspects
Audiometry and auditory brain stem response
Pure tone audiometry and speech discrimination are used to evaluate the hearing of
the subject. The discrimination between cochlear and retrocochlear hearing loss can
be assessed with pure tone audiometry and speech discrimination to some extent.
Auditory brain stem response (ABR) is used to detect the site of lesion in the auditory
pathways.
Previously, ABR was used to detect a vestibular schwannoma or other CPA
tumors. In early ABR studies, the detection rate was about 70 to 80% (Dauman et al.
1988; Hashimoto et al. 1991; Ruckenstein et al. 1996) and the most profound
problems have been found to concern detection of intracanalicular schwannomas
(Wilson et al. 1992; Godey et al. 1998). The detection rate of ABR, however, has been
above 95% according to 36 studies reviewed by Brackmann and Kwartler (1990). In a
study by Selesnick et al. (1993) of 126 vestibular schwannoma patients, the ABR was
entirely normal in 6% of those patients for whom ABR was studied before the referral.
These patients had tumors that measured less than 10 mm in diameter. In the same
study, 4% of the cases had a totally normal audiologic screening profile (speech
reception threshold < 20 dB, speech discrimination score > 80%, high frequency
hearing, i.e. in 4 kHz, < 20 dB). Unfortunately, ABR misses a significant number of
CPA tumors (8%), especially those of nonvestibular schwannomas (one-third are false-
negatives) (Welling et al. 1990).
According to Brackmann and Forquer (1983), 25% of posterior fossa lesions have
normal ABR.
Hearing thresholds may be normal in pure tone audiometry in patients with
vestibular schwannoma. In the study of Shaan et al. (1993), 6 % of 100 consecutive
patients with vestibular schwannoma had normal pure tone audiometry and a normal
speech discrimination score. In the study of Selesnick et al. (1993), 26% of the
patients with vestibular schwannoma experienced a sudden hearing loss. In addition,
some of the vestibular schwannoma patients manifested a cochlear type of hearing
loss rather than a retrocochlear type (Flood and Brightwell 1984).
Saccade tests and pursuit eye movement tests
In the study of Bergenius et al. (1983), there were three false-negative results with
caloric, eye tracking and gaze nystagmus tests in 21 vestibular schwannoma patients
51
(tumor size ranged from 6-40 mm). In patients with tumors larger than 15-20 mm,
tests for eye movement, ABRs and stapedius reflex were pathologic.
Hulshof et al. (1989) observed that in most of the vestibular schwannoma
patients studied, the peripheral part of the vestibular system was severely disturbed.
This could cause abnormal saccades (in 19% of cases), pathologic PEMs (42%) and
pathologic caloric tests (73%).
Patients with large CPA-tumors (>30 mm) frequently elicit pathologies in saccadic
eye movements (47% pre- and postoperatively) and PEMs (66% preoperatively, 53%
postoperatively) (Nedzelski 1983). According to Nedzelski (1983), the oculomotor
system is seldom affected by small or medium sized tumors (<30 mm). For large
tumors, the PEM defects are most commonly bilateral; in saccadic eye movements, the
saccadic accuracy is impaired (saccades are hypermetric), but saccadic peak velocity
is normal (Nedzelski 1983).
Patients with peripheral labyrinthine lesions can have initial deficits (in less than
25% of patients) in PEM, but they are rapidly compensated for after the acute lesion
(Baloh et al. 1977). Patients with chronic peripheral vestibular disorders usually have
normal PEM and optokinetic nystagmus (Baloh et al. 1977).
Saccadic eye movements are usually unaffected by CPA tumors, although
sometimes ipsilateral saccadic dysmetria (in less than 25% of patients) is found (Baloh
et al. 1977). According to Baloh et al. (1977), patients with large CPA tumors
(producing brain stem compression) often have deficits in PEM (reduced velocity gain
in more than 75% of patients) and optokinetic nystagmus, whereas patients with small
CPA tumors (without brain stem compression) have normal PEM and optokinetic
nystagmus.
Patients with cerebellar atrophy have bilateral and consistent saccade dysmetria,
as well as impaired PEMs (in more than 75% of cases) (Baloh et al. 1975a; Baloh et al.
1977). Because of anatomical proximity of oculomotor trajectories and gaze centers in
the brain stem, brain stem disease usually cause impairment of saccades and PEMs
(Baloh et al. 1977).
In fronto-parietal cortical lesions (tumors), the SRT is bilaterally increased in
more than 75% of the patients; PEM is ipsilaterally pathological, and as well, the
saccades are hypometric contralaterally in 25-75% of patients. Saccadic peak velocity
is bilaterally slowed in less than 25% of patients (Baloh et al. 1977).
Imaging
First generation CT scanners detected vestibular schwannoma tumors larger than 20
mm (Welling et al. 1990). High resolution CT with air contrast then followed, and with
them tumors from 10 mm could be imaged (Welling et al. 1990). The MRI has
replaced the CT in screening work-ups for vestibular schwannoma. MRI is the most
52
effective with gadolinium enhancement, permitting tumors as small as 3 mm, or
possibly smaller to be diagnosed (Welling et al. 1990; Telischi et al. 1993).
According to Zbar et al. (1997), intralabyrinthine vestibular schwannomas can
sometimes be missed even with gadolinium-enhanced MRI. They reported that a small
population of patients diagnosed with Menière’s disease might actually have an
isolated intralabyrinthine vestibular schwannoma as a cause of their symptoms.
According to Constans et al. (1986), small HABs can escape detection with CT
scanning. According to Resche et al. (1993), in infratentorial HABs the CT
demonstrates hydrocephalus (if it exists) and the neoplasm, but the sensitivity and
accuracy of CTs are limited by beam-hardening artifacts induced by the petrous bone.
They believe that MRIs are the best imaging modality for most intracranial tumors,
particularly in the evaluation of brain stem tumors. They draw the conclusion that the
MRI, especially the Gd-DTPA enhanced MRI, appears more sensitive than the CT in
detecting lesions and delineating their exact nature.
2. G. Knowledge-based systems, decision tree analysis and oculomotor
deficits
Knowledge-based systems have recently been applied in medicine to assess laboratory
tests, to improve diagnostic work-ups and to enhance resolution in imaging
examinations. Knowledge-based systems can store, retrieve and analyze vast amounts
of knowledge and data (Hedberg 1993). Knowledge-based systems can be combined
with other technologies, such as neural networks (adaptive, where it learns and trains
itself), case-based reasoning (the ability to store, analyze and process previous
experiences) and genetic algorithms (search an entire domain for a solution, breeding
on successive success paths) (Hedberg 1993). In the vestibular field, three expert
programs have been developed (Gavillan et al. 1990; Mira et al. 1990; Kentala et al.
1996a; Kentala et al. 1996b). So far, in only one of these programs have the voluntary
eye movements been included (Kentala et al. 1996a; Kentala et al. 1996b).
There are various knowledge-based systems that are capable of inferring and
providing solutions from the data that is available. These knowledge-based systems
are adaptive, and most can operate with incomplete data. One of these systems is
called the decision tree induction (Quinlan 1990). It employs a top-down, divide-and-
conquer strategy that partitions off the given set of objects into smaller and smaller
subsets in step with the growth of the tree (Quinlan 1990). The analysis starts with a
sample of objects that belong to one of the possible classes. The properties of objects
are known only through the values of attributes. Two objects can be distinguished
only if they have different values for some attribute or attributes. Attributes can be
nominal or continuous variables. The decision tree data set is trained with learning.
53
A training set (a collection of objects whose classes are known) is always used. The
training set must be a representative sample of the population studied (Quinlan 1990).
The assumption underlying all inductive learning is that if patterns can be
identified that account for the class membership of known objects, these patterns
(rules) can be used to predict classes of new unseen objects. A training classification
task provides the classification rule that works well on the objects in a given training
set (Quinlan 1990). A decision tree is a recursive structure for expressing the
classification rules, and it comprises of nodes and leaves. The tree may consist of a
test that has a set of different possible outcomes. There will be a subsidiary decision
tree for each outcome. The nodes represent tests based on features of example cases,
and leaves represent classes (i.e. decisions). In classification, the algorithm starts at
the root of the tree. If it is a leaf at the root of the tree, the object is assigned to the
class associated with that leaf. If the root of the decision tree is a test, the outcome of
this test for a given object is determined and the process continues using the
subsidiary decision tree associated with that outcome. An object is thus classified by
tracing out a path from the root of the decision tree to one of its leaves. The root
attribute is thought to be the most important one in the classification (Quinlan 1990).
The decision tree analysis can be used to evaluate the correct classification of
objects or to predict a possible class of a new object. The validity of this analysis
increases with increase in the number of cases (objects) in the analysis (Quinlan
1990, Kentala et al., in press).

54
3. P U R P O S E O F T H E S T U D Y
1. To study the effect of age and gender on
voluntary eye movements.
2. To study the laterality of voluntary
saccades and the repeatability of voluntary
eye movements with special reference to
PRPEM.
3. To compare the EOG and MOG technique
in recording the voluntary eye movements.
4. To study the effect of certain peripheral or
central lesions on voluntary eye
movements.
5. To evaluate with the decision tree
algorithm, the validity of voluntary eye
movements in discriminating the site of
lesion.
6. To study the relationship between the
signs, symptoms and findings, and
voluntary eye movements in patients with
peripheral or central lesions.

55
4. S U B J E C T S A N D M E T H O D S
4. A. Subjects
4. A. 1. Control subjects
a. Normative data
Normative data of voluntary eye movements was collected from 45 healthy subjects.
In the constant and pseudo-random saccades, mean age of control subjects was 48
years (18-88 years); 30 were females and 15 were males. In the PRPEMs, the mean
age of control subjects was 45 years (18-86 years); 30 were females and 15 were
males.
b. Aging
For studying the effect of aging on voluntary eye movements, 119 normal subjects
were tested. Included among the 119 subjects, 45 subjects were from the above
normative data group. The mean age of the subjects was 37 years (range 6.5 to 88
years). There were 40 children under 16 years (22 girls, 18 boys), 38 adults from 18
to 49 years (24 females, 14 males) and 41 elderly from 50 to 88 years (26 females, 15
males).
c. Gender
Differences between the genders were studied in age-matched female and male
subjects selected from the subject pool. In all, 25 females and 25 males were studied.
The mean age of the subjects was 50 years (range 15.5 to 87 years).
d. Side difference
The laterality of saccades was studied on the 45 subjects of the normative data group.
e. Repeatability
The PRPEM tests were done in two different days to 17 normal subjects who were
tested for analyzing the repeatability of PRPEM. Their mean age was 34 years (18 to
48 years); 10 were females and 7 were males. The interval between these two
measurement times averaged 6 days (range from 1 to 14 days).
56
f. EOG and MOG measurement
Ten normal subjects were tested to the study differences of voluntary eye movements
recorded by EOG and MOG methods. The mean age of the subjects was 38 years (29
to 51 years); 2 were females and 8 were males. Constant and pseudo-random
saccades were recorded in 9 subjects; PRPEMs were recorded in 10 subjects.
All the normal subjects were healthy without any neurotologic or ophthalmologic
disorders. The refraction disorders in control subjects and patients were corrected
with eyeglasses or contact lenses. The visual acuity was least 0.8 to 1.0. Some of the
subjects had (latent) squint (under 7º) but those did not call for any action.
All tested subjects participating in the studies (normal subjects and patients)
were volunteers and informed consents according to the Helsinki Declaration were
provided. The study protocol was reviewed and approved by a local ethical committee
at the Helsinki University Central Hospital (HUCH).
4. A. 2. Patients
a) Menière’s disease
Sixty-two patients with moderately severe to severe Menière’s disease were examined.
Eye movements were tested before (49 patients) and after (13 patients) the
intratympanic gentamicin treatment. Mean age was 49.5 years (range 19.5 to 73.5
years). Forty-two were females and 20 were males. Diagnosis of Menière’s disease
was made on the basis of neuro-otological exams. A CT scan of the inner ear and
posterior fossa, as well as MRIs were done as needed. Of the 13 patients who were
examined after the gentamicin treatment, 11 had few, if any, symptoms of Menière’s
disease. Two patients had difficult symptoms; one required a retreatment with
gentamicin later, the other developed symptoms in the other, previously healthy ear.
Menière’s disease was bilateral in 13 out of 62 patients.
Data of symptoms, signs and findings at the time of eye movement testing was
collected. The pure-tone average (PTA) of hearing thresholds of 0.5, 1, 2, 3 (= mean of
2 and 4 kHz) kHz (according to Committee on Hearing and Equilibrium of the
American Academy of Otolaryngology-Head and Neck Surgery, AAO-HNSF, 1995) was
evaluated from the affected and treated ear. The mean of the PTA was 58 dB, ranging
from 8 to 120 dB. The working capacity was assessed according to Total Handicap
Score of AAO-HNSF in 1985 (AAO-HNS 1985; Pearson and Brackmann 1985), in
which the working capacity is expressed on a four-point scale. Working capacity
ranged from 2 to 4 and the mean was 3.8. Other signs and symptoms were also
classified on a four point scale (1=none, 2=slight, 3=moderate, 4=severe). Mean
tinnitus was 3.0; the mean severity of the Tumarkin drop attacks was 2.1; the mean
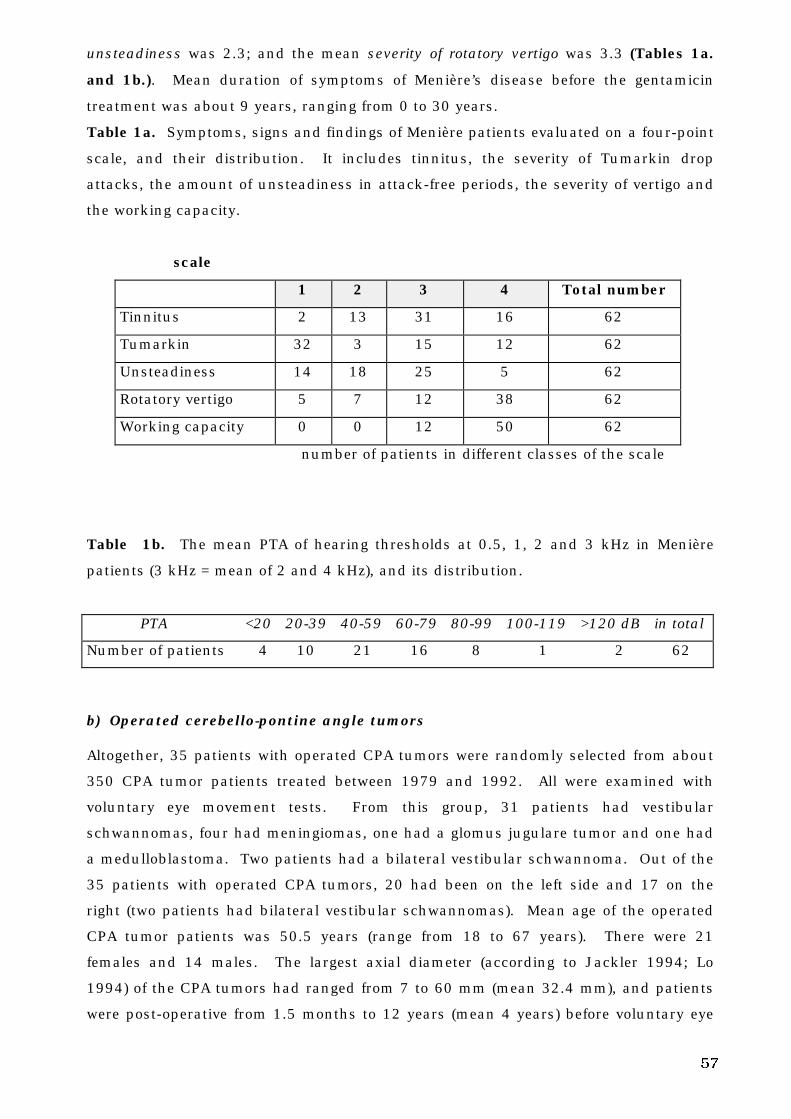
57
unsteadiness was 2.3; and the mean severity of rotatory vertigo was 3.3 (Tables 1a.
and 1b.). Mean duration of symptoms of Menière’s disease before the gentamicin
treatment was about 9 years, ranging from 0 to 30 years.
Table 1a. Symptoms, signs and findings of Menière patients evaluated on a four-point
scale, and their distribution. It includes tinnitus, the severity of Tumarkin drop
attacks, the amount of unsteadiness in attack-free periods, the severity of vertigo and
the working capacity.
scale
1 2 3 4 Total number
Tinnitus 2 13 31 16 62
Tumarkin 32 3 15 12 62
Unsteadiness 14 18 25 5 62
Rotatory vertigo 5 7 12 38 62
Working capacity 0 0 12 50 62
number of patients in different classes of the scale
Table 1b. The mean PTA of hearing thresholds at 0.5, 1, 2 and 3 kHz in Menière
patients (3 kHz = mean of 2 and 4 kHz), and its distribution.
PTA <20 20-39 40-59 60-79 80-99 100-119 >120 dB in total
Number of patients 4 10 21 16 8 1 2 62
b) Operated cerebello-pontine angle tumors
Altogether, 35 patients with operated CPA tumors were randomly selected from about
350 CPA tumor patients treated between 1979 and 1992. All were examined with
voluntary eye movement tests. From this group, 31 patients had vestibular
schwannomas, four had meningiomas, one had a glomus jugulare tumor and one had
a medulloblastoma. Two patients had a bilateral vestibular schwannoma. Out of the
35 patients with operated CPA tumors, 20 had been on the left side and 17 on the
right (two patients had bilateral vestibular schwannomas). Mean age of the operated
CPA tumor patients was 50.5 years (range from 18 to 67 years). There were 21
females and 14 males. The largest axial diameter (according to Jackler 1994; Lo
1994) of the CPA tumors had ranged from 7 to 60 mm (mean 32.4 mm), and patients
were post-operative from 1.5 months to 12 years (mean 4 years) before voluntary eye
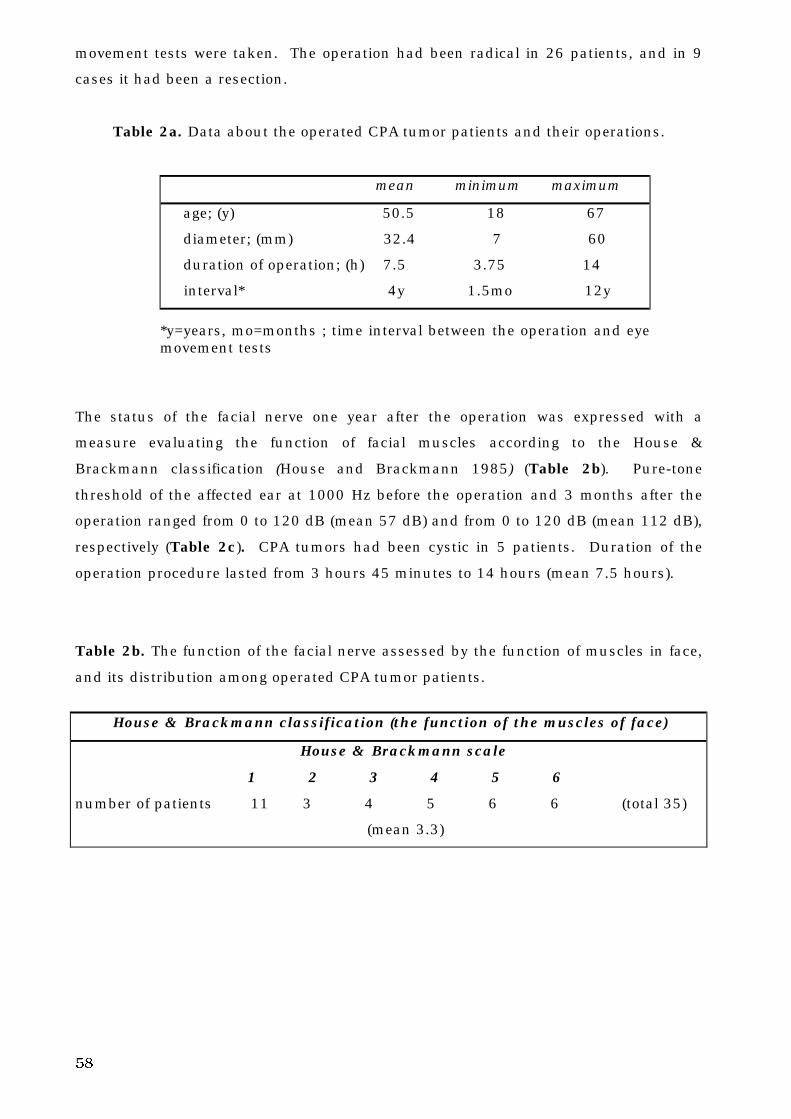
58
movement tests were taken. The operation had been radical in 26 patients, and in 9
cases it had been a resection.
Table 2a. Data about the operated CPA tumor patients and their operations.
mean minimum maximum
age; (y) 50.5 18 67
diameter; (mm) 32.4 7 60
duration of operation; (h) 7.5 3.75 14
interval* 4y 1.5mo 12y
*y=years, mo=months ; time interval between the operation and eyemovement tests
The status of the facial nerve one year after the operation was expressed with a
measure evaluating the function of facial muscles according to the House &
Brackmann classification (House and Brackmann 1985) (Table 2b). Pure-tone
threshold of the affected ear at 1000 Hz before the operation and 3 months after the
operation ranged from 0 to 120 dB (mean 57 dB) and from 0 to 120 dB (mean 112 dB),
respectively (Table 2c). CPA tumors had been cystic in 5 patients. Duration of the
operation procedure lasted from 3 hours 45 minutes to 14 hours (mean 7.5 hours).
Table 2b. The function of the facial nerve assessed by the function of muscles in face,
and its distribution among operated CPA tumor patients.
House & Brackmann classification (the function of the muscles of face)
House & Brackmann scale
1 2 3 4 5 6
number of patients 11 3 4 5 6 6 (total 35)
(mean 3.3)
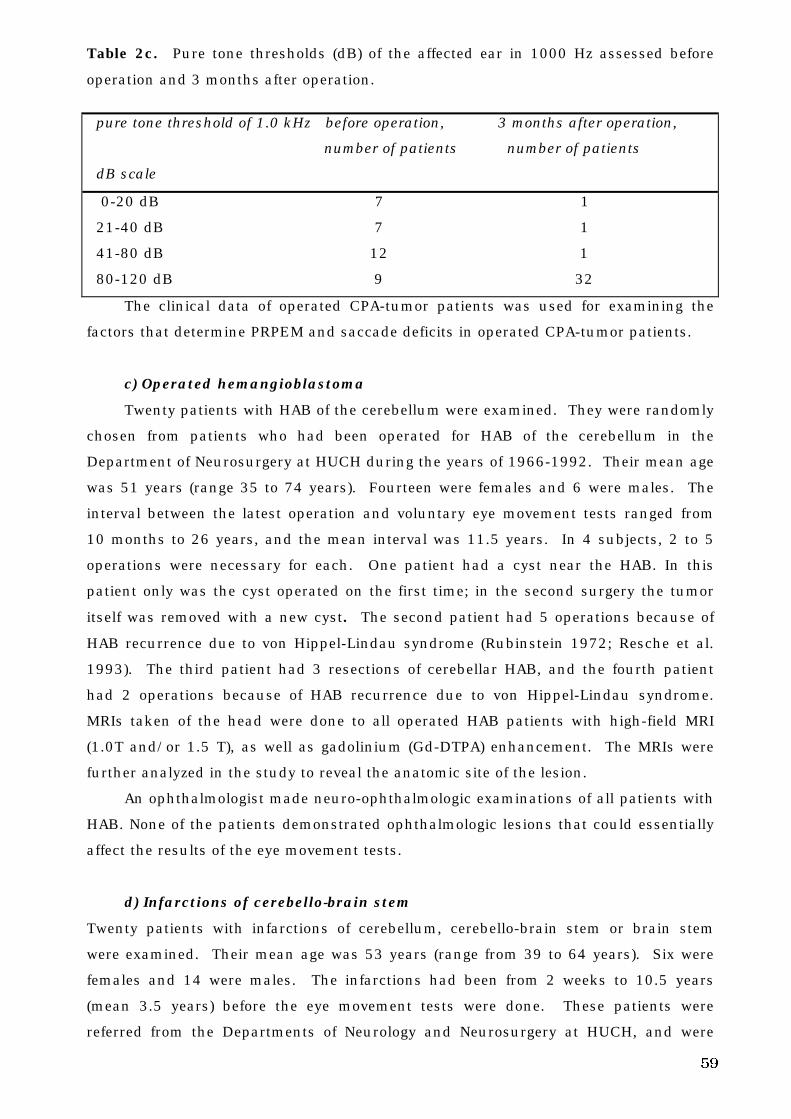
59
Table 2c. Pure tone thresholds (dB) of the affected ear in 1000 Hz assessed before
operation and 3 months after operation.
pure tone threshold of 1.0 kHz before operation, 3 months after operation,
number of patients number of patients
dB scale
0-20 dB 7 1
21-40 dB 7 1
41-80 dB 12 1
80-120 dB 9 32
The clinical data of operated CPA-tumor patients was used for examining the
factors that determine PRPEM and saccade deficits in operated CPA-tumor patients.
c) Operated hemangioblastoma
Twenty patients with HAB of the cerebellum were examined. They were randomly
chosen from patients who had been operated for HAB of the cerebellum in the
Department of Neurosurgery at HUCH during the years of 1966-1992. Their mean age
was 51 years (range 35 to 74 years). Fourteen were females and 6 were males. The
interval between the latest operation and voluntary eye movement tests ranged from
10 months to 26 years, and the mean interval was 11.5 years. In 4 subjects, 2 to 5
operations were necessary for each. One patient had a cyst near the HAB. In this
patient only was the cyst operated on the first time; in the second surgery the tumor
itself was removed with a new cyst. The second patient had 5 operations because of
HAB recurrence due to von Hippel-Lindau syndrome (Rubinstein 1972; Resche et al.
1993). The third patient had 3 resections of cerebellar HAB, and the fourth patient
had 2 operations because of HAB recurrence due to von Hippel-Lindau syndrome.
MRIs taken of the head were done to all operated HAB patients with high-field MRI
(1.0T and/or 1.5 T), as well as gadolinium (Gd-DTPA) enhancement. The MRIs were
further analyzed in the study to reveal the anatomic site of the lesion.
An ophthalmologist made neuro-ophthalmologic examinations of all patients with
HAB. None of the patients demonstrated ophthalmologic lesions that could essentially
affect the results of the eye movement tests.
d) Infarctions of cerebello-brain stem
Twenty patients with infarctions of cerebellum, cerebello-brain stem or brain stem
were examined. Their mean age was 53 years (range from 39 to 64 years). Six were
females and 14 were males. The infarctions had been from 2 weeks to 10.5 years
(mean 3.5 years) before the eye movement tests were done. These patients were
referred from the Departments of Neurology and Neurosurgery at HUCH, and were
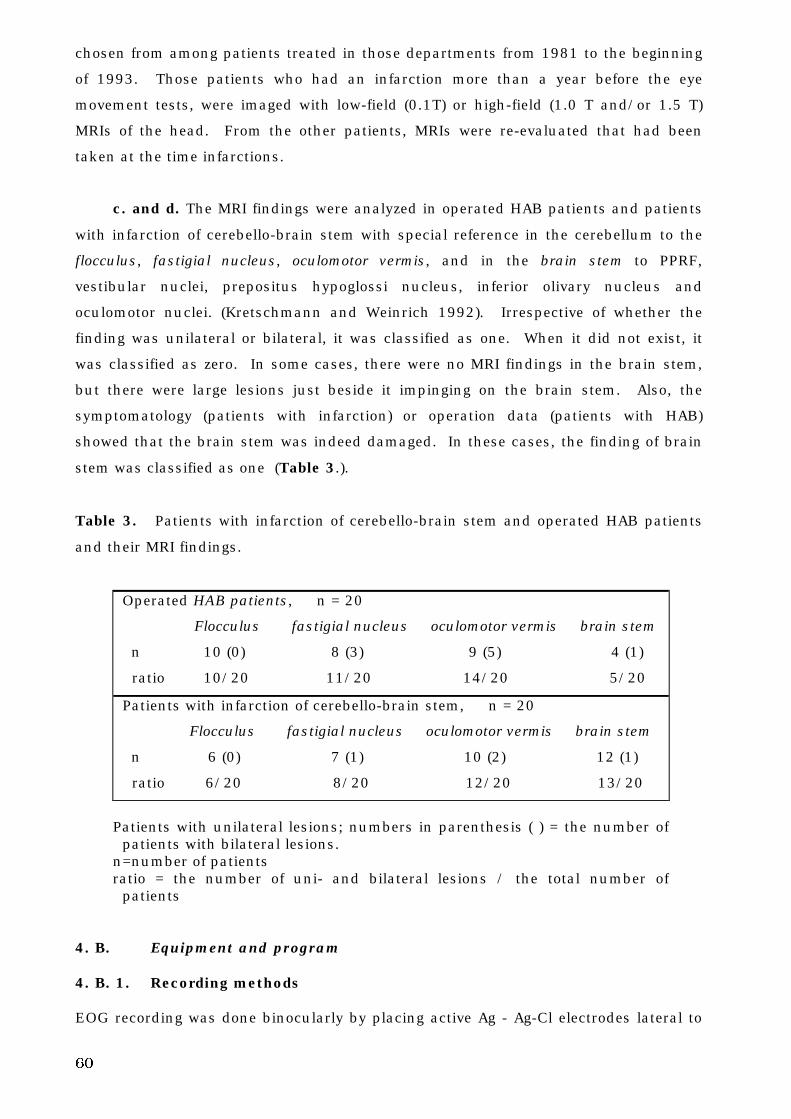
60
chosen from among patients treated in those departments from 1981 to the beginning
of 1993. Those patients who had an infarction more than a year before the eye
movement tests, were imaged with low-field (0.1T) or high-field (1.0 T and/or 1.5 T)
MRIs of the head. From the other patients, MRIs were re-evaluated that had been
taken at the time infarctions.
c. and d. The MRI findings were analyzed in operated HAB patients and patients
with infarction of cerebello-brain stem with special reference in the cerebellum to the
flocculus, fastigial nucleus, oculomotor vermis, and in the brain stem to PPRF,
vestibular nuclei, prepositus hypoglossi nucleus, inferior olivary nucleus and
oculomotor nuclei. (Kretschmann and Weinrich 1992). Irrespective of whether the
finding was unilateral or bilateral, it was classified as one. When it did not exist, it
was classified as zero. In some cases, there were no MRI findings in the brain stem,
but there were large lesions just beside it impinging on the brain stem. Also, the
symptomatology (patients with infarction) or operation data (patients with HAB)
showed that the brain stem was indeed damaged. In these cases, the finding of brain
stem was classified as one (Table 3.).
Table 3. Patients with infarction of cerebello-brain stem and operated HAB patients
and their MRI findings.
Operated HAB patients, n = 20
Flocculus fastigial nucleus oculomotor vermis brain stem
n 10 (0) 8 (3) 9 (5) 4 (1)
ratio 10/20 11/20 14/20 5/20
Patients with infarction of cerebello-brain stem, n = 20
Flocculus fastigial nucleus oculomotor vermis brain stem
n 6 (0) 7 (1) 10 (2) 12 (1)
ratio 6/20 8/20 12/20 13/20
Patients with unilateral lesions; numbers in parenthesis ( ) = the number ofpatients with bilateral lesions.
n=number of patientsratio = the number of uni- and bilateral lesions / the total number of
patients
4. B. Equipment and program
4. B. 1. Recording methods
EOG recording was done binocularly by placing active Ag - Ag-Cl electrodes lateral to
61
the outer canthi of the eyes and the reference electrode on the forehead. Careful test
preparations were done. Horizontal eye movements were measured. The resolution of
the EOG recording system was about 1º (Juhola 1991a).
The device for recording MOG consisted of 2 vertical and 2 horizontal induction
coils 0.73 and 1.10 m in diameter respectively, the verticals were at a distance of
0.38m from each other and the horizontals were at a distance of 0.57m from each
other. The system was custom-made. The resolution of the MOG method was about
0.1º. The subject was seated on a chair at the center of the induction coils. The
search coil (Skalar Medical, The Netherlands) was placed on the right eye in all
subjects. Before application of the search coil, the eye was anesthetized with a topical
anesthetic, (0.4% oxybuprocaine HCl, Oftan Obucain®). The wearing time of the
scleral annulus on the eye was restricted to about 30 minutes.
An ophthalmologist examined the status of the cornea after the study of recording
methods. Some subjects had significant endothelial edema caused by hypoxia under
the thick scleral annulus; corneal epithelial erosions were also noticed in some
subjects.
4. B. 2. Stimulus
A visual stimulator with a laser spot was used to guide saccades and PRPEM. The
stimulator reflected a laser beam to the black wall in a darkened room in front of the
subject who was told to follow with the gaze a dot caused by the beam. A head
support was used to restrict movement. The stimulator was controlled by an HP71B
microcomputer (Juhola et al. 1989). The main microcomputer (HP9000 series 300)
controlled the HP71B by giving commands at the onset and end of the stimulator
function. (Juhola et al. 1989).
To stimulate saccades at a constant amplitude of 60°, the stimulator was
programmed to move the laser beam between two fixed locations (+ 30° <=> - 30°) on a
time basis. The constant saccades were predictable with reference to the magnitude of
target steps, but unpredictable with reference to the time interval of target steps,
ranging from 0.9 to 1.7s.
In the pseudo-random stimulation of saccades, the laser beam jumped 20°, 40°
and 60° to the right and the left pseudo-randomly (+ 10° <=> - 10°; + 20° <=> - 20°; +
30° <=> - 30°). The time interval of target steps was unpredictable, ranging from 0.9
to 1.7s (Aalto et al. 1989).
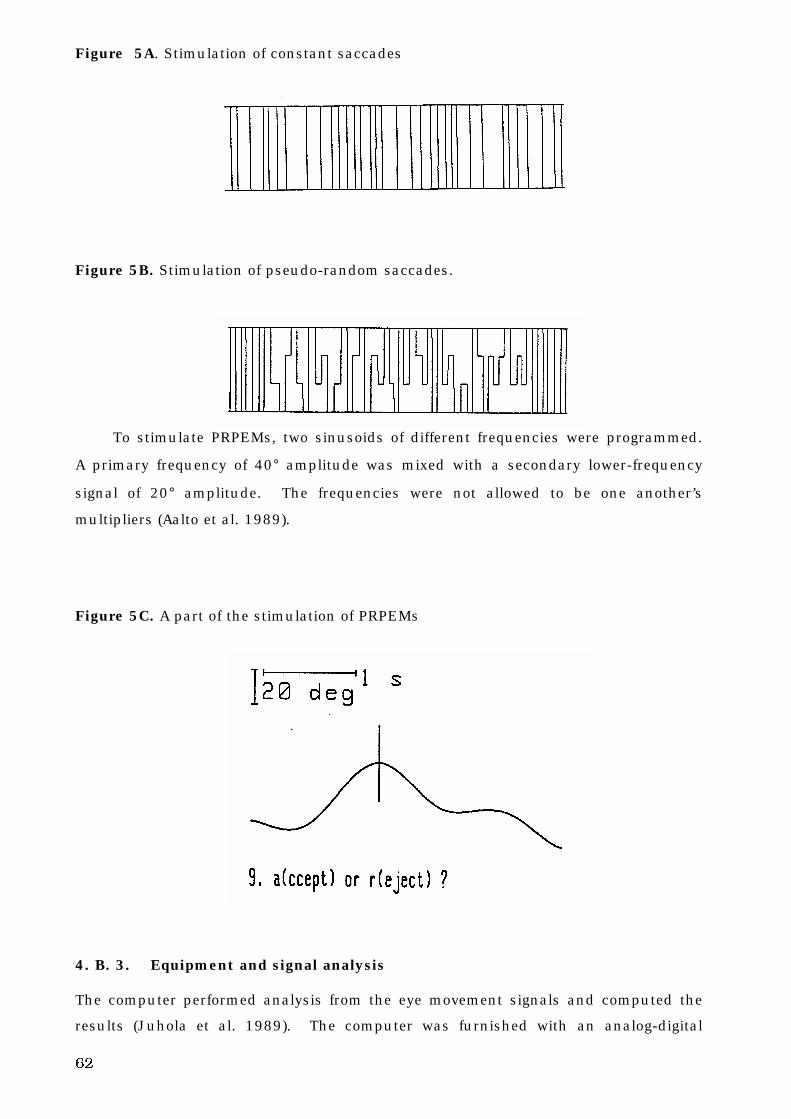
62
Figure 5A. Stimulation of constant saccades
Figure 5B. Stimulation of pseudo-random saccades.
To stimulate PRPEMs, two sinusoids of different frequencies were programmed.
A primary frequency of 40° amplitude was mixed with a secondary lower-frequency
signal of 20° amplitude. The frequencies were not allowed to be one another’s
multipliers (Aalto et al. 1989).
Figure 5C. A part of the stimulation of PRPEMs
4. B. 3. Equipment and signal analysis
The computer performed analysis from the eye movement signals and computed the
results (Juhola et al. 1989). The computer was furnished with an analog-digital
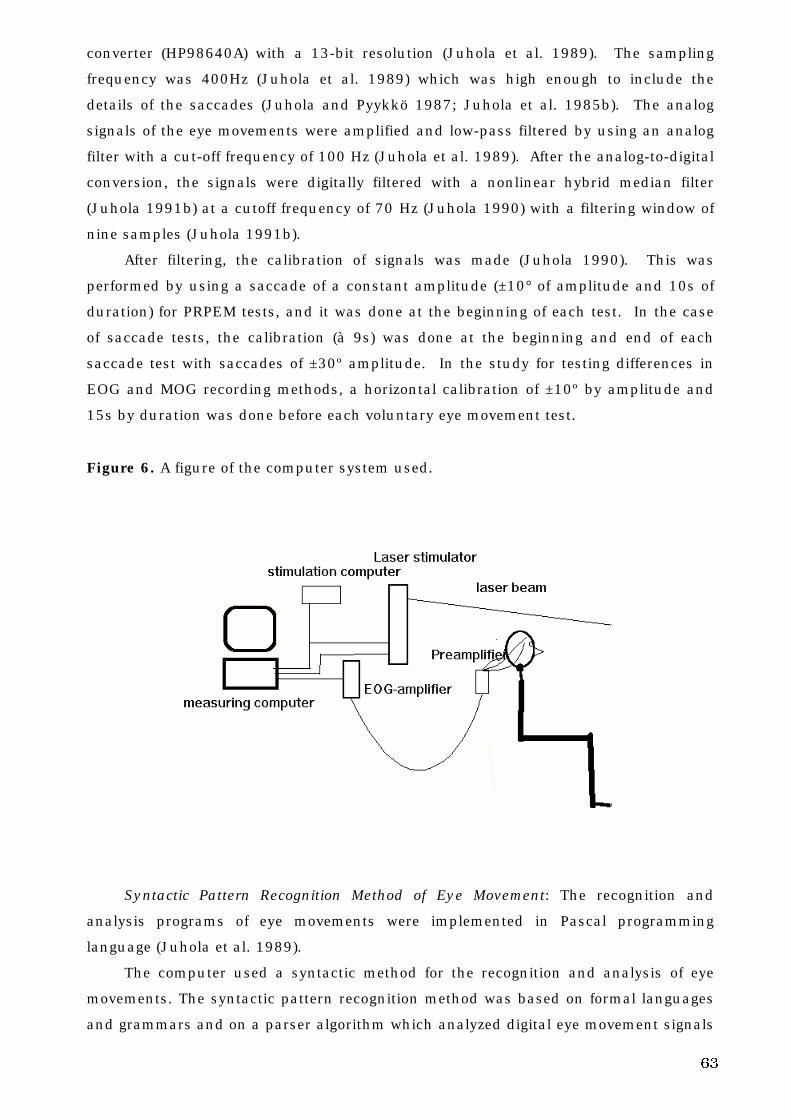
63
converter (HP98640A) with a 13-bit resolution (Juhola et al. 1989). The sampling
frequency was 400Hz (Juhola et al. 1989) which was high enough to include the
details of the saccades (Juhola and Pyykkö 1987; Juhola et al. 1985b). The analog
signals of the eye movements were amplified and low-pass filtered by using an analog
filter with a cut-off frequency of 100 Hz (Juhola et al. 1989). After the analog-to-digital
conversion, the signals were digitally filtered with a nonlinear hybrid median filter
(Juhola 1991b) at a cutoff frequency of 70 Hz (Juhola 1990) with a filtering window of
nine samples (Juhola 1991b).
After filtering, the calibration of signals was made (Juhola 1990). This was
performed by using a saccade of a constant amplitude (±10° of amplitude and 10s of
duration) for PRPEM tests, and it was done at the beginning of each test. In the case
of saccade tests, the calibration (à 9s) was done at the beginning and end of each
saccade test with saccades of ±30º amplitude. In the study for testing differences in
EOG and MOG recording methods, a horizontal calibration of ±10º by amplitude and
15s by duration was done before each voluntary eye movement test.
Figure 6. A figure of the computer system used.
Syntactic Pattern Recognition Method of Eye Movement: The recognition and
analysis programs of eye movements were implemented in Pascal programming
language (Juhola et al. 1989).
The computer used a syntactic method for the recognition and analysis of eye
movements. The syntactic pattern recognition method was based on formal languages
and grammars and on a parser algorithm which analyzed digital eye movement signals

64
as strings (sequences of grammatical symbols) of the formal languages (Juhola 1990).
Both the stimulus signal and the response signal were processed and analyzed.
a. Saccades
In saccades, the angular velocity during a 20 ms segment of signal was computed by
linear regression that gave a mean velocity value for the segment (Juhola 1988a;
Juhola 1990). Thereafter, the velocity value of every segment was assessed by
comparing the velocity value of the segment to given limits (Juhola 1990). When the
magnitude of the angular velocity exceeded a certain threshold found experimentally,
the beginning of a saccade was found (Juhola 1986). The end of a saccade was found
when the magnitude of velocity fell back below the threshold (Juhola 1986). The value
of ±40°/s was used as the limit of the velocity for saccades (Juhola 1986; Juhola
1988a). If the absolute velocity of a segment was larger than +40°/s or below -40°/s,
that segment could be assumed to be within a saccade. The eye movement segments
were expressed in terminals of the formal language according to how they were
situated in, above or below the limits (Juhola 1986; Juhola 1988a).
The advantage of the syntactic pattern recognition method is that it reveals the
structure of the saccade (syntactic elements) as terminals of the formal language
(Juhola 1988b). It can distinguish small artifacts and deviations in signals from eye
movements (Juhola 1988b).
b. Pseudo-random pursuit eye movement
The signal was smoothed with a nonlinear median filter in order to dampen noise
generated from various biological and physical sources (Juhola 1991c). The angular
velocity was calculated segment-wise from the positional signals of the stimulus and
its response, as in saccades (Juhola 1991c). Both signals were divided into
consecutive segments. The length of the segment was chosen to be 0.040s (Juhola
1991c). Using linear regression, a slope for each segment was computed that was
equal to the mean velocity with regard to that segment (Juhola 1991c). Using four
different symbol types, exceptionally fast parts in otherwise slow pursuit eye
movement signals, were marked to correspond possible saccades, artifacts and noise
peaks in them (Juhola 1991c). The idea was to determine those segments of the
response that were slow and close to stimulus velocity, and those segments that
significantly differed from the stimulus velocity having considerably larger values
(Juhola 1991c). The threshold of ± 15°/s above or below the stimulus velocity was
applied in the classification of segments (Juhola 1991c). This threshold was found
experimentally. Its purpose was to separate saccades as well as other rapid eye
movements, e.g., blinks from the slow PEMs (Juhola 1991c).
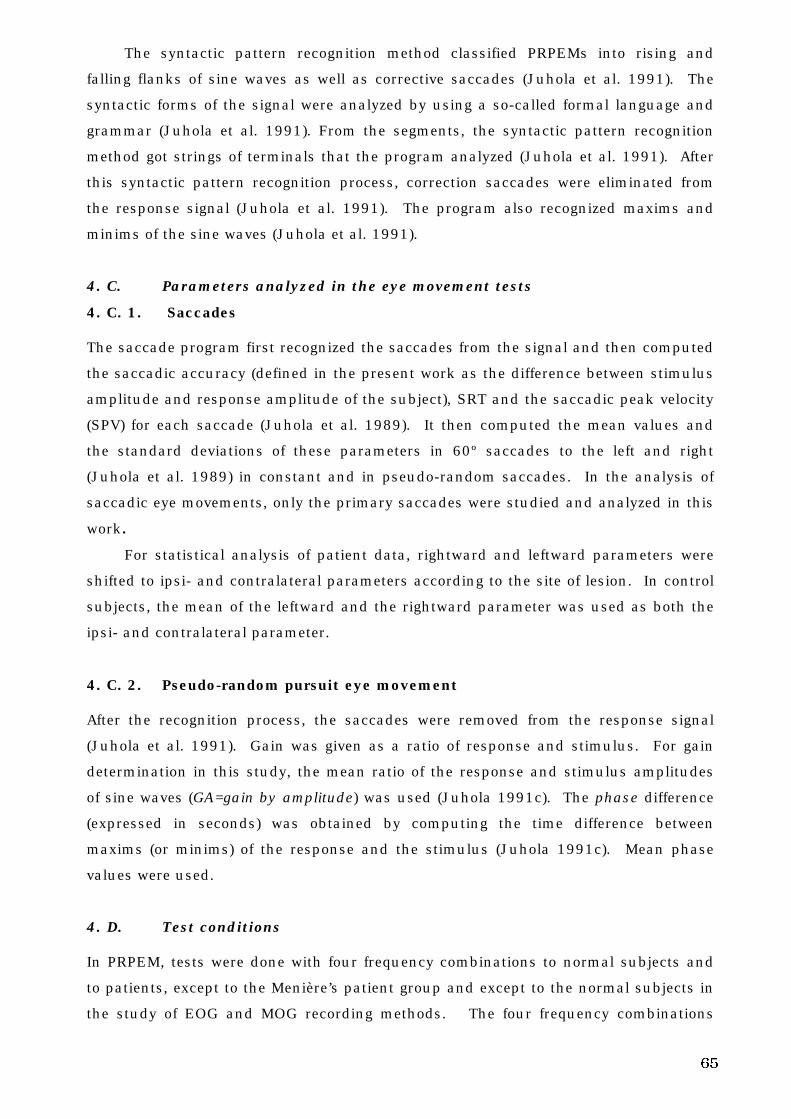
65
The syntactic pattern recognition method classified PRPEMs into rising and
falling flanks of sine waves as well as corrective saccades (Juhola et al. 1991). The
syntactic forms of the signal were analyzed by using a so-called formal language and
grammar (Juhola et al. 1991). From the segments, the syntactic pattern recognition
method got strings of terminals that the program analyzed (Juhola et al. 1991). After
this syntactic pattern recognition process, correction saccades were eliminated from
the response signal (Juhola et al. 1991). The program also recognized maxims and
minims of the sine waves (Juhola et al. 1991).
4. C. Parameters analyzed in the eye movement tests
4. C. 1. Saccades
The saccade program first recognized the saccades from the signal and then computed
the saccadic accuracy (defined in the present work as the difference between stimulus
amplitude and response amplitude of the subject), SRT and the saccadic peak velocity
(SPV) for each saccade (Juhola et al. 1989). It then computed the mean values and
the standard deviations of these parameters in 60º saccades to the left and right
(Juhola et al. 1989) in constant and in pseudo-random saccades. In the analysis of
saccadic eye movements, only the primary saccades were studied and analyzed in this
work.
For statistical analysis of patient data, rightward and leftward parameters were
shifted to ipsi- and contralateral parameters according to the site of lesion. In control
subjects, the mean of the leftward and the rightward parameter was used as both the
ipsi- and contralateral parameter.
4. C. 2. Pseudo-random pursuit eye movement
After the recognition process, the saccades were removed from the response signal
(Juhola et al. 1991). Gain was given as a ratio of response and stimulus. For gain
determination in this study, the mean ratio of the response and stimulus amplitudes
of sine waves (GA=gain by amplitude) was used (Juhola 1991c). The phase difference
(expressed in seconds) was obtained by computing the time difference between
maxims (or minims) of the response and the stimulus (Juhola 1991c). Mean phase
values were used.
4. D. Test conditions
In PRPEM, tests were done with four frequency combinations to normal subjects and
to patients, except to the Menière’s patient group and except to the normal subjects in
the study of EOG and MOG recording methods. The four frequency combinations
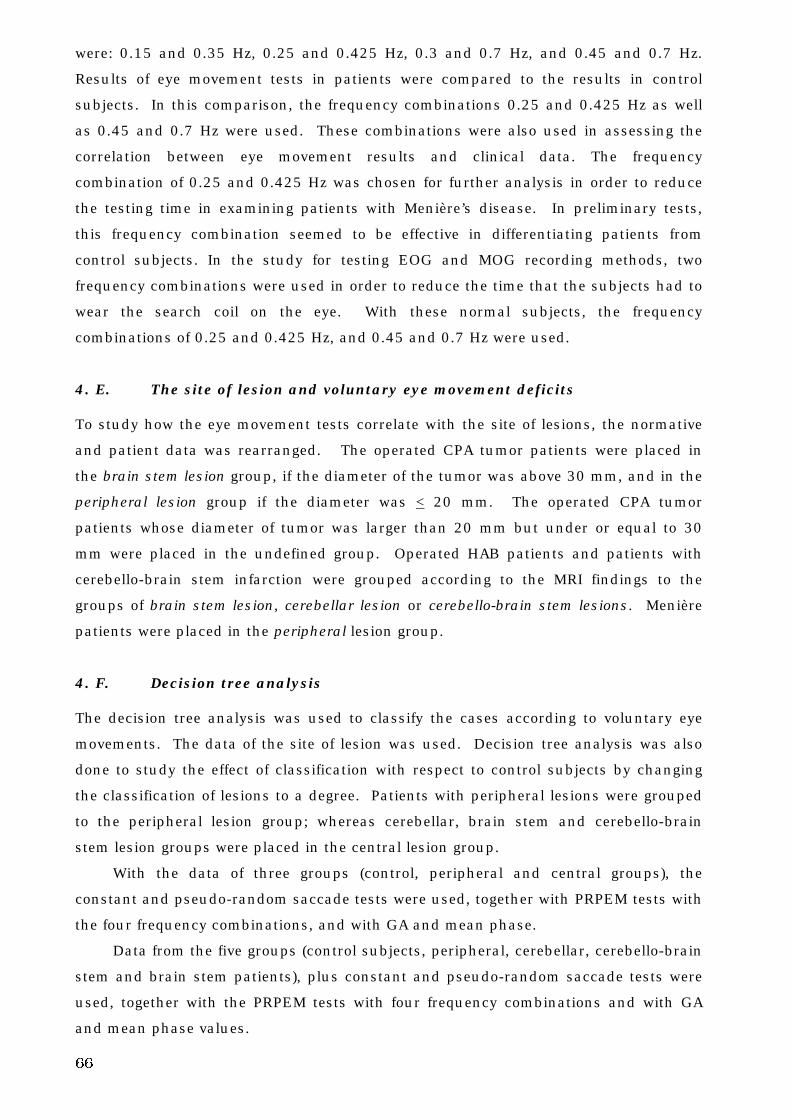
66
were: 0.15 and 0.35 Hz, 0.25 and 0.425 Hz, 0.3 and 0.7 Hz, and 0.45 and 0.7 Hz.
Results of eye movement tests in patients were compared to the results in control
subjects. In this comparison, the frequency combinations 0.25 and 0.425 Hz as well
as 0.45 and 0.7 Hz were used. These combinations were also used in assessing the
correlation between eye movement results and clinical data. The frequency
combination of 0.25 and 0.425 Hz was chosen for further analysis in order to reduce
the testing time in examining patients with Menière’s disease. In preliminary tests,
this frequency combination seemed to be effective in differentiating patients from
control subjects. In the study for testing EOG and MOG recording methods, two
frequency combinations were used in order to reduce the time that the subjects had to
wear the search coil on the eye. With these normal subjects, the frequency
combinations of 0.25 and 0.425 Hz, and 0.45 and 0.7 Hz were used.
4. E. The site of lesion and voluntary eye movement deficits
To study how the eye movement tests correlate with the site of lesions, the normative
and patient data was rearranged. The operated CPA tumor patients were placed in
the brain stem lesion group, if the diameter of the tumor was above 30 mm, and in the
peripheral lesion group if the diameter was < 20 mm. The operated CPA tumor
patients whose diameter of tumor was larger than 20 mm but under or equal to 30
mm were placed in the undefined group. Operated HAB patients and patients with
cerebello-brain stem infarction were grouped according to the MRI findings to the
groups of brain stem lesion, cerebellar lesion or cerebello-brain stem lesions. Menière
patients were placed in the peripheral lesion group.
4. F. Decision tree analysis
The decision tree analysis was used to classify the cases according to voluntary eye
movements. The data of the site of lesion was used. Decision tree analysis was also
done to study the effect of classification with respect to control subjects by changing
the classification of lesions to a degree. Patients with peripheral lesions were grouped
to the peripheral lesion group; whereas cerebellar, brain stem and cerebello-brain
stem lesion groups were placed in the central lesion group.
With the data of three groups (control, peripheral and central groups), the
constant and pseudo-random saccade tests were used, together with PRPEM tests with
the four frequency combinations, and with GA and mean phase.
Data from the five groups (control subjects, peripheral, cerebellar, cerebello-brain
stem and brain stem patients), plus constant and pseudo-random saccade tests were
used, together with the PRPEM tests with four frequency combinations and with GA
and mean phase values.
67
4G. Statistical analysis
In studies of control subjects and patients, the order of frequency combinations of
PRPEM throughout these studies were randomized according to the Latin square
method. Transformations of the parameters were made when needed to normalize the
distribution of the parameters (Norusis 1993).
To evaluate the effect of aging on voluntary eye movements, a regression analysis
with curve estimation procedure (Norusis 1993) was used. In the curve estimation
procedure, the linear, quadratic and cubic functions were applied. One-way analysis
of variance (ANOVA; Scheffe’s test) (Norusis 1993) was used to study the possible
differences in voluntary eye movements between different age groups. The subjects
were divided into three groups: young (n = 40 subjects from 6 to 16 years old), middle-
age (n = 38 subjects from 18 to 49 years old) and elderly (n = 41 subjects from 50 to
above 80 years old). In these studies, the means of rightward and leftward saccade
parameters were studied.
In studying the gender differences in voluntary eye movements, the statistical
analysis was done with Student’s t-test in two independent samples (Norusis 1993).
The means of rightward and leftward saccades were used in the analysis. Saccades
test and PRPEMs were studied.
To identify individual differences in: 1) the laterality of saccades, 2) between EOG
and MOG recording methods 3) between constant and pseudo-random saccade tests,
and 4) between 20º and 60º saccades in pseudo-random saccades, the paired samples
t-test was used (Norusis 1993).
Repeated measures ANOVA was used to reflect the differences at the level of
individual in evaluating the differences between the different frequency combinations
in PRPEM (Norusis 1994a). One-way ANOVA (Scheffe test) was used to study the
differences at the level of the whole group (Norusis 1993).
In studying the repeatability of the PRPEM results, the repeated measures
ANOVA (Norusis 1994a) was used for statistical analysis. The two variables analyzed
for possible differences and possible interactions were stimulus = different frequency
combinations (with four factor levels) and measurement time (with two factor levels).
Student’s t-test in two independent samples was used to evaluate whether the
differences between the group of control subjects and a certain patient group were
statistically significant (Norusis 1993).
The general linear model (GLM) (SAS Institute Inc. 1989) was used to: 1) evaluate
the correlation of clinical findings and voluntary eye movement deficits in patients with
Menière’s disease, 2) evaluate the importance of clinical and operative factors on
voluntary eye movement deficits in operated CPA-tumor patients, 3) correlate MRI
findings, age and the voluntary eye movement deficits in operated hemangioblastoma
68
patients, and 4) correlate MRI findings, age and the voluntary eye movement deficits in
patients with infarction of cerebello brain stem. Before the GLM procedures, R-Square
tests (SAS Institute Inc. 1989) were analyzed.
The discriminant analysis (Norusis 1994b) was made to: 1) classify patients (with
moderately severe to severe Menière’s disease as peripheral patients; operated CPA
tumor patients, operated HAB patients and patients with infarction of cerebello-brain
stem as central patients) and control subjects into correct groups by means of the
voluntary eye movement performance, and 2) classify the subjects into correct groups
with reference to the localization of lesion by means of the voluntary eye movement
performance. With localization data, the frequency combination 0.25 and 0.425 Hz
was only used in PRPEM.
In the decision tree analysis, artificial intelligence was used, and the analysis was
done using Quinlan See5 (Quinlan 1998) classifier generator, a descendant of C4.5
(Quinlan 1993).
When p was < 0.01, it was considered a statistically significant difference. When
p was <0.05, it was considered as a tendency of difference.
In statistical analysis, the SPSS 6.1 for Windows, SPSS 7.5 for Windows and SAS
for Windows were used.
69
5. RESULTS
5. A. Control subjects
5.A.1. Normative data
Means and SDs of SA, SRT and SPV in constant saccades, are seen in Table 8; 4.5%
of the saccades were hypometric.
Means and SDs in pseudo-random saccades of SA20° and SA60°, SRT20º and
SRT60º, SPV20º and SPV60º , are seen in Tables 9a and 9b. In 20º saccades, 11%
were hypometric, and in 60º saccades, 6.8% were hypometric.
In PRPEM, GA and mean phase varied with different frequency combinations
(Figures 12a and 12b, mean + SD). The GA value for the 0.15 and 0.35Hz frequency
combination was 0.86, and at the 0.45 and 0.7Hz frequency combination GA was
0.68. The range of individual results was about the same (i.e. 0.36) in different
frequency combinations. Mean phase steadily shortened by the following increasing
frequency combinations: 0.129s at 0.15 and 0.35Hz, 0.107s at 0.25 and 0.425Hz,
0.93s at 0.3 and 0.7Hz, and 0.82s at 0.45 and 0.7Hz. The range of individual mean
phase values with different frequency combinations diminished with the shortening of
the mean normative value.
5. A. 2. Aging and voluntary eye movements
When testing differences between age groups in constant saccades, SA was larger
(p<0.01) in the young group than in the middle-aged group (Table 4a). None of the
tested curve estimations adequately described the connection between age and SA,
SRT or SPV.
In pseudo-random saccades, SA20° and SA60° were larger (p<0.01) in the elderly
group than in the middle-aged group. In SRTs and SPVs of 20° and 60° saccades,
there were no significant differences between the age groups. (Table 4b). The
quadratic function could be used to describe the connection between age and SA20°
(p<0.001, r=0.412), between age and SA60° (p<0.001, r=0.368), and SRT20° (p<0.001,
r=0.367). The middle-aged had the lowest SA20° and SA60°, and the shortest SRT20°.
None of the tested functions described the connection between age and SRT60º,
SPV20°, or SPV60°.
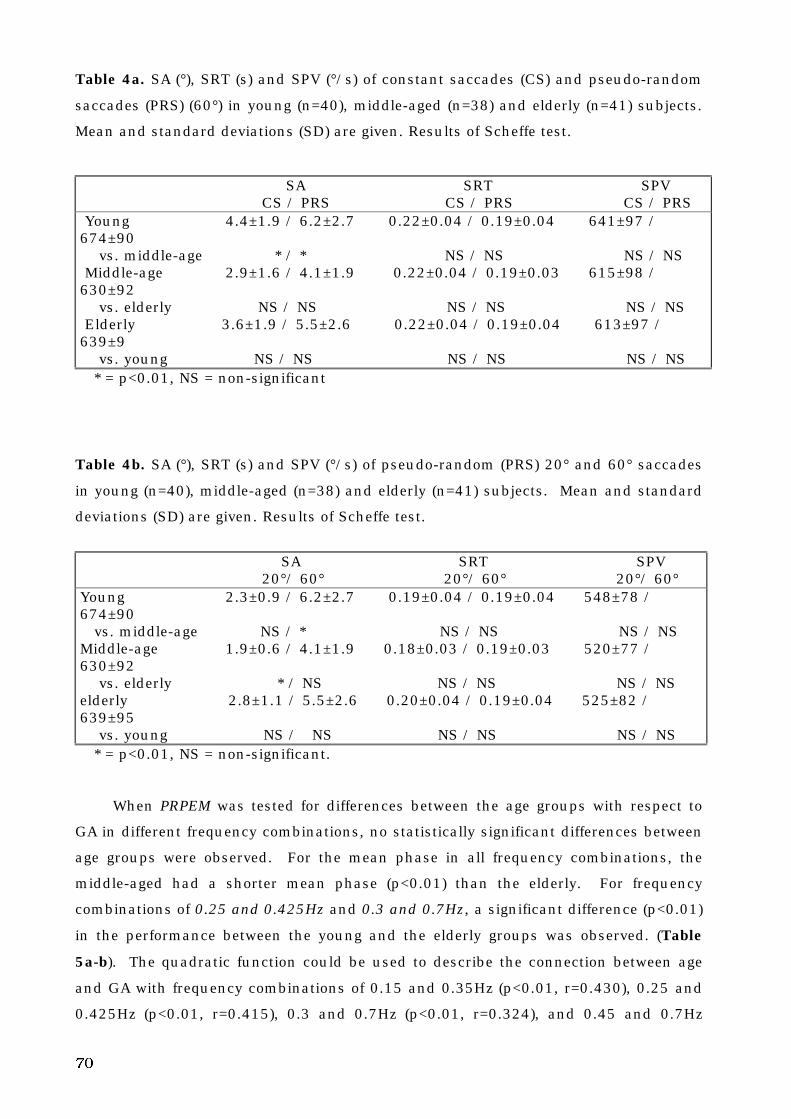
70
Table 4a. SA (°), SRT (s) and SPV (°/s) of constant saccades (CS) and pseudo-random
saccades (PRS) (60°) in young (n=40), middle-aged (n=38) and elderly (n=41) subjects.
Mean and standard deviations (SD) are given. Results of Scheffe test.
SA SRT SPV CS / PRS CS / PRS CS / PRSYoung 4.4±1.9 / 6.2±2.7 0.22±0.04 / 0.19±0.04 641±97 /
674±90 vs. middle-age * / * NS / NS NS / NSMiddle-age 2.9±1.6 / 4.1±1.9 0.22±0.04 / 0.19±0.03 615±98 /
630±92 vs. elderly NS / NS NS / NS NS / NSElderly 3.6±1.9 / 5.5±2.6 0.22±0.04 / 0.19±0.04 613±97 /
639±9 vs. young NS / NS NS / NS NS / NS* = p<0.01, NS = non-significant
Table 4b. SA (°), SRT (s) and SPV (°/s) of pseudo-random (PRS) 20° and 60° saccades
in young (n=40), middle-aged (n=38) and elderly (n=41) subjects. Mean and standard
deviations (SD) are given. Results of Scheffe test.
SA SRT SPV 20°/ 60° 20°/ 60° 20°/ 60°Young 2.3±0.9 / 6.2±2.7 0.19±0.04 / 0.19±0.04 548±78 /674±90 vs. middle-age NS / * NS / NS NS / NSMiddle-age 1.9±0.6 / 4.1±1.9 0.18±0.03 / 0.19±0.03 520±77 /630±92 vs. elderly * / NS NS / NS NS / NSelderly 2.8±1.1 / 5.5±2.6 0.20±0.04 / 0.19±0.04 525±82 /639±95 vs. young NS / NS NS / NS NS / NS
* = p<0.01, NS = non-significant.
When PRPEM was tested for differences between the age groups with respect to
GA in different frequency combinations, no statistically significant differences between
age groups were observed. For the mean phase in all frequency combinations, the
middle-aged had a shorter mean phase (p<0.01) than the elderly. For frequency
combinations of 0.25 and 0.425Hz and 0.3 and 0.7Hz, a significant difference (p<0.01)
in the performance between the young and the elderly groups was observed. (Table
5a-b). The quadratic function could be used to describe the connection between age
and GA with frequency combinations of 0.15 and 0.35Hz (p<0.01, r=0.430), 0.25 and
0.425Hz (p<0.01, r=0.415), 0.3 and 0.7Hz (p<0.01, r=0.324), and 0.45 and 0.7Hz
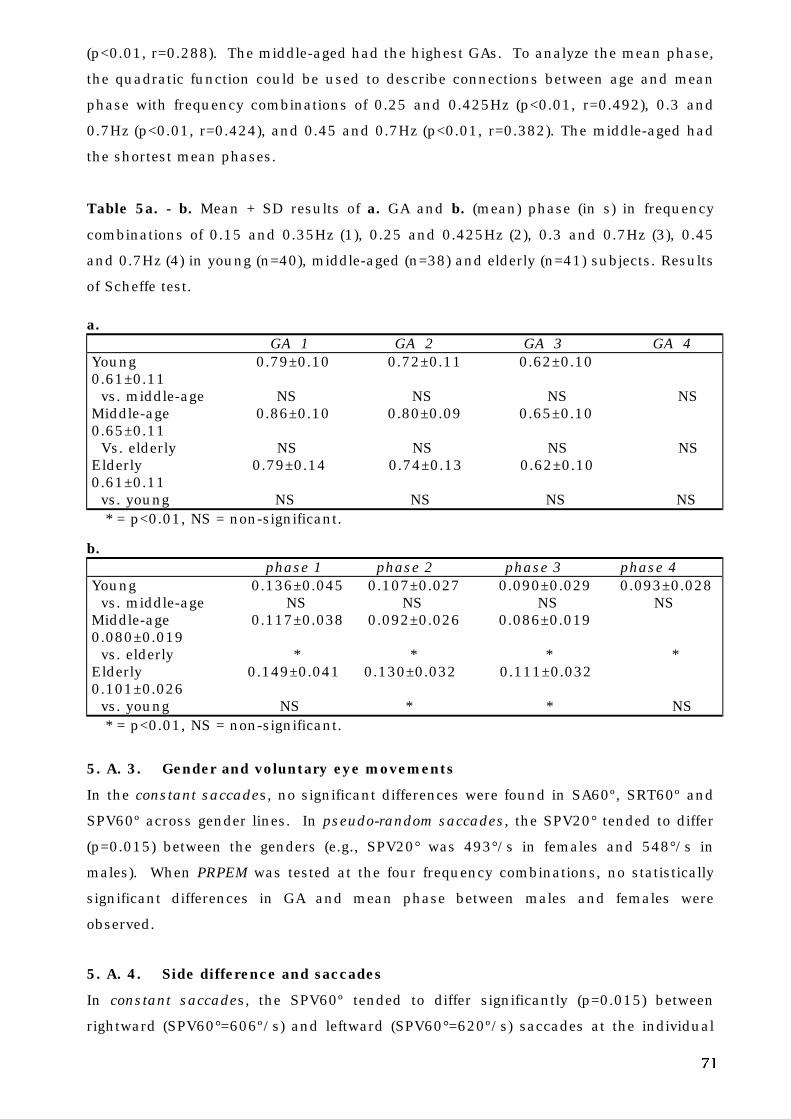
71
(p<0.01, r=0.288). The middle-aged had the highest GAs. To analyze the mean phase,
the quadratic function could be used to describe connections between age and mean
phase with frequency combinations of 0.25 and 0.425Hz (p<0.01, r=0.492), 0.3 and
0.7Hz (p<0.01, r=0.424), and 0.45 and 0.7Hz (p<0.01, r=0.382). The middle-aged had
the shortest mean phases.
Table 5a. - b. Mean + SD results of a. GA and b. (mean) phase (in s) in frequency
combinations of 0.15 and 0.35Hz (1), 0.25 and 0.425Hz (2), 0.3 and 0.7Hz (3), 0.45
and 0.7Hz (4) in young (n=40), middle-aged (n=38) and elderly (n=41) subjects. Results
of Scheffe test.
a. GA 1 GA 2 GA 3 GA 4Young 0.79±0.10 0.72±0.11 0.62±0.100.61±0.11 vs. middle-age NS NS NS NSMiddle-age 0.86±0.10 0.80±0.09 0.65±0.100.65±0.11 Vs. elderly NS NS NS NSElderly 0.79±0.14 0.74±0.13 0.62±0.100.61±0.11 vs. young NS NS NS NS
* = p<0.01, NS = non-significant.
b. phase 1 phase 2 phase 3 phase 4Young 0.136±0.045 0.107±0.027 0.090±0.029 0.093±0.028 vs. middle-age NS NS NS NSMiddle-age 0.117±0.038 0.092±0.026 0.086±0.0190.080±0.019 vs. elderly * * * *Elderly 0.149±0.041 0.130±0.032 0.111±0.0320.101±0.026 vs. young NS * * NS
* = p<0.01, NS = non-significant.
5. A. 3. Gender and voluntary eye movements
In the constant saccades, no significant differences were found in SA60º, SRT60º and
SPV60º across gender lines. In pseudo-random saccades, the SPV20° tended to differ
(p=0.015) between the genders (e.g., SPV20° was 493°/s in females and 548°/s in
males). When PRPEM was tested at the four frequency combinations, no statistically
significant differences in GA and mean phase between males and females were
observed.
5. A. 4. Side difference and saccades
In constant saccades, the SPV60º tended to differ significantly (p=0.015) between
rightward (SPV60°=606º/s) and leftward (SPV60°=620º/s) saccades at the individual
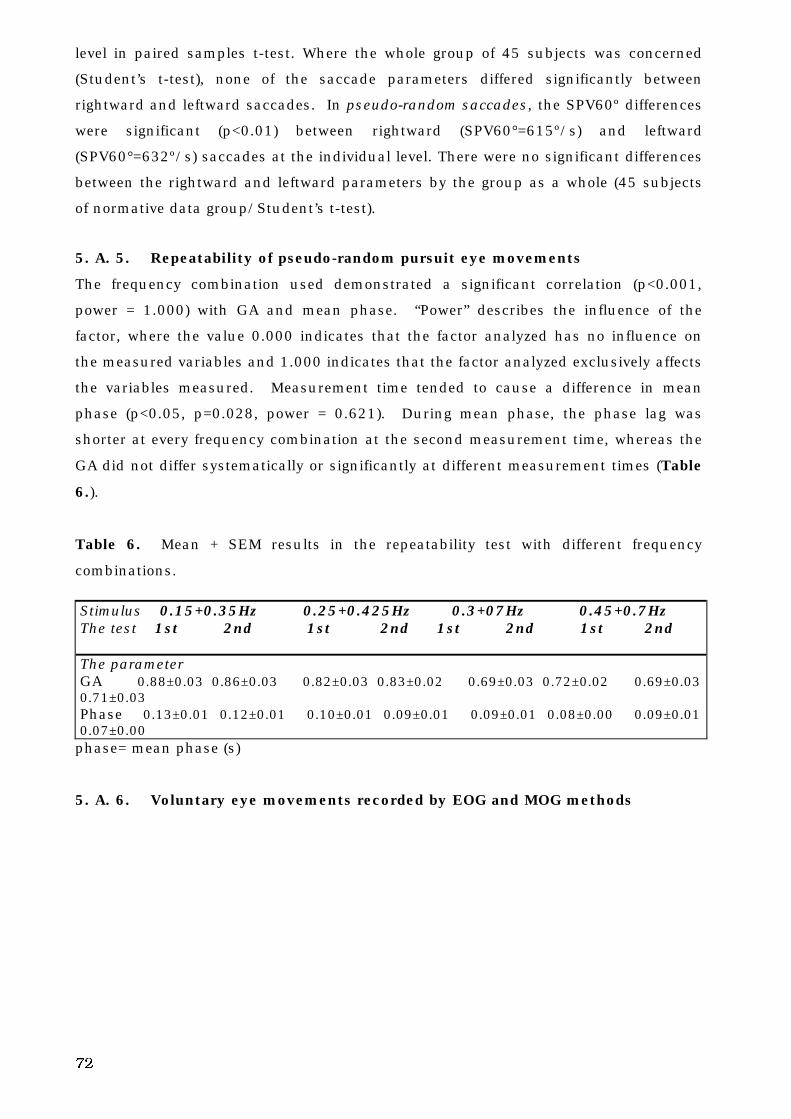
72
level in paired samples t-test. Where the whole group of 45 subjects was concerned
(Student’s t-test), none of the saccade parameters differed significantly between
rightward and leftward saccades. In pseudo-random saccades, the SPV60º differences
were significant (p<0.01) between rightward (SPV60°=615º/s) and leftward
(SPV60°=632º/s) saccades at the individual level. There were no significant differences
between the rightward and leftward parameters by the group as a whole (45 subjects
of normative data group/Student’s t-test).
5. A. 5. Repeatability of pseudo-random pursuit eye movements
The frequency combination used demonstrated a significant correlation (p<0.001,
power = 1.000) with GA and mean phase. “Power” describes the influence of the
factor, where the value 0.000 indicates that the factor analyzed has no influence on
the measured variables and 1.000 indicates that the factor analyzed exclusively affects
the variables measured. Measurement time tended to cause a difference in mean
phase (p<0.05, p=0.028, power = 0.621). During mean phase, the phase lag was
shorter at every frequency combination at the second measurement time, whereas the
GA did not differ systematically or significantly at different measurement times (Table
6.).
Table 6. Mean + SEM results in the repeatability test with different frequency
combinations.
Stimulus 0.15+0.35Hz 0.25+0.425Hz 0.3+07Hz 0.45+0.7HzThe test 1st 2nd 1st 2nd 1st 2nd 1st 2nd
The parameterGA 0.88±0.03 0.86±0.03 0.82±0.03 0.83±0.02 0.69±0.03 0.72±0.02 0.69±0.030.71±0.03Phase 0.13±0.01 0.12±0.01 0.10±0.01 0.09±0.01 0.09±0.01 0.08±0.00 0.09±0.010.07±0.00
phase= mean phase (s)
5. A. 6. Voluntary eye movements recorded by EOG and MOG methods
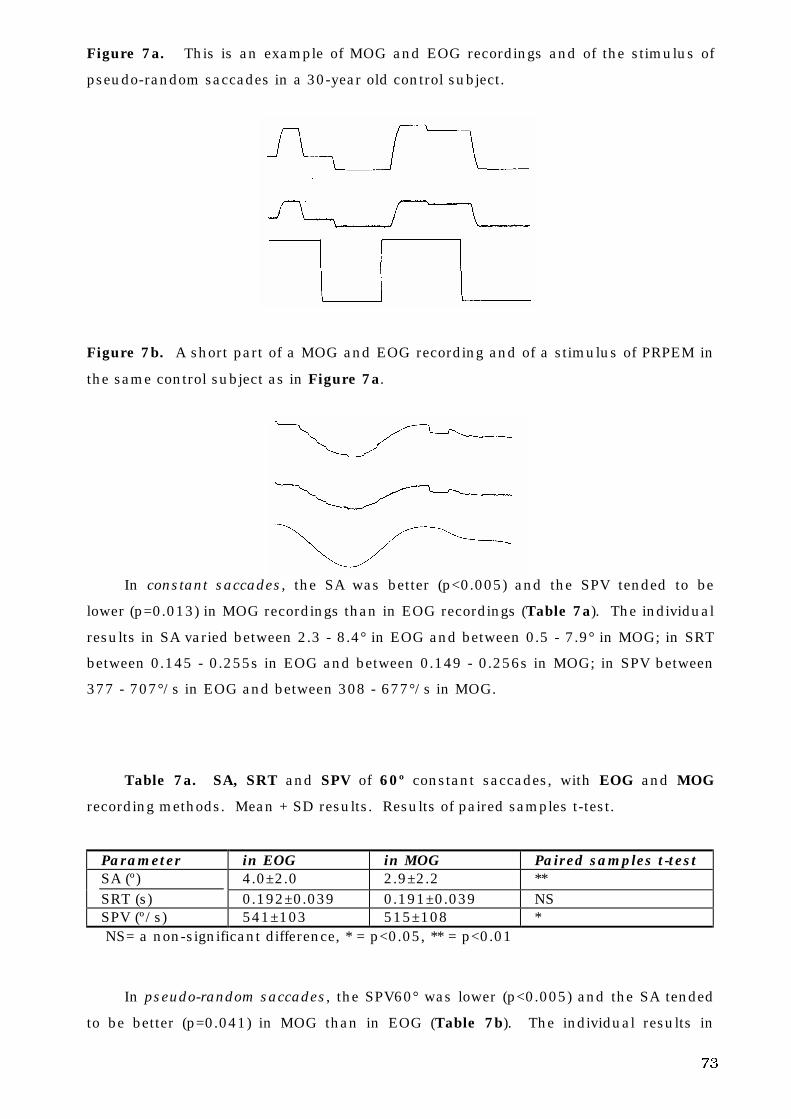
73
Figure 7a. This is an example of MOG and EOG recordings and of the stimulus of
pseudo-random saccades in a 30-year old control subject.
Figure 7b. A short part of a MOG and EOG recording and of a stimulus of PRPEM in
the same control subject as in Figure 7a.
In constant saccades, the SA was better (p<0.005) and the SPV tended to be
lower (p=0.013) in MOG recordings than in EOG recordings (Table 7a). The individual
results in SA varied between 2.3 - 8.4° in EOG and between 0.5 - 7.9° in MOG; in SRT
between 0.145 - 0.255s in EOG and between 0.149 - 0.256s in MOG; in SPV between
377 - 707°/s in EOG and between 308 - 677°/s in MOG.
Table 7a. SA, SRT and SPV of 60º constant saccades, with EOG and MOG
recording methods. Mean + SD results. Results of paired samples t-test.
Parameter in EOG in MOG Paired samples t-testSA (º) 4.0±2.0 2.9±2.2 **SRT (s) 0.192±0.039 0.191±0.039 NSSPV (º/s) 541±103 515±108 *NS= a non-significant difference, * = p<0.05, ** = p<0.01
In pseudo-random saccades, the SPV60° was lower (p<0.005) and the SA tended
to be better (p=0.041) in MOG than in EOG (Table 7b). The individual results in
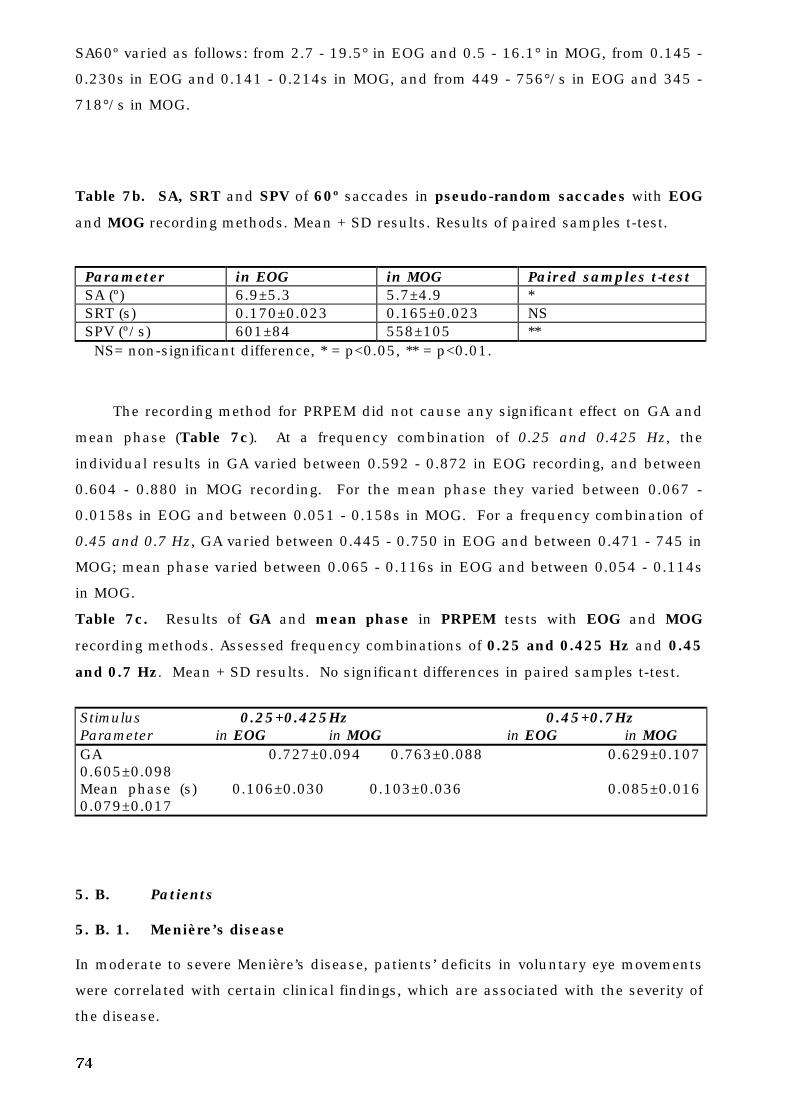
74
SA60º varied as follows: from 2.7 - 19.5° in EOG and 0.5 - 16.1° in MOG, from 0.145 -
0.230s in EOG and 0.141 - 0.214s in MOG, and from 449 - 756°/s in EOG and 345 -
718°/s in MOG.
Table 7b. SA, SRT and SPV of 60º saccades in pseudo-random saccades with EOG
and MOG recording methods. Mean + SD results. Results of paired samples t-test.
Parameter in EOG in MOG Paired samples t-testSA (º) 6.9±5.3 5.7±4.9 *SRT (s) 0.170±0.023 0.165±0.023 NSSPV (º/s) 601±84 558±105 **NS= non-significant difference, * = p<0.05, ** = p<0.01.
The recording method for PRPEM did not cause any significant effect on GA and
mean phase (Table 7c). At a frequency combination of 0.25 and 0.425 Hz, the
individual results in GA varied between 0.592 - 0.872 in EOG recording, and between
0.604 - 0.880 in MOG recording. For the mean phase they varied between 0.067 -
0.0158s in EOG and between 0.051 - 0.158s in MOG. For a frequency combination of
0.45 and 0.7 Hz, GA varied between 0.445 - 0.750 in EOG and between 0.471 - 745 in
MOG; mean phase varied between 0.065 - 0.116s in EOG and between 0.054 - 0.114s
in MOG.
Table 7c. Results of GA and mean phase in PRPEM tests with EOG and MOG
recording methods. Assessed frequency combinations of 0.25 and 0.425 Hz and 0.45
and 0.7 Hz. Mean + SD results. No significant differences in paired samples t-test.
Stimulus 0.25+0.425Hz 0.45+0.7HzParameter in EOG in MOG in EOG in MOGGA 0.727±0.094 0.763±0.088 0.629±0.1070.605±0.098Mean phase (s) 0.106±0.030 0.103±0.036 0.085±0.0160.079±0.017
5. B. Patients
5. B. 1. Menière’s disease
In moderate to severe Menière’s disease, patients’ deficits in voluntary eye movements
were correlated with certain clinical findings, which are associated with the severity of
the disease.
75
With regard to constant saccades, the ipsilateral SRT was significantly
lengthened (p<0.01, r²=0.364) in patients with high PTA. There was an interaction of
PTA and Tumarkin attacks, indicating that patients with hearing loss and severe
Tumarkin attacks had a prolonged ipsilateral SRT (Ipsilateral SRT = 0.02 x PTA + 2.86
x PTA & Tumarkin attacks). A lengthened contralateral SRT (p=0.027, r²=0.290) was
observed in patients with high PTA and with those demonstrating an interaction of
poor hearing and severe Tumarkin attacks (Contralateral SRT = 0.50 x PTA + 1.70 x
PTA & Tumarkin attacks). Contralateral SPV (p=0.042, r²=0.174) tended to be lower in
patients with high PTA than those with a low PTA. There was a correlation between
PTA and advanced age, indicating that patients who had a high PTA and advanced age
had a lower ipsilateral SPV (Contralateral SPV = -0.41 x PTA - 0.74 x PTA & age).
With regard to pseudo-random saccades (at 20° and 60°), the contralateral
SRT20º was significantly lengthened (p<0.01, r²=0.673) in patients with severe
tinnitus. There was also a correlation between rotatory vertigo attack and working
capacity, indicating that these patients had a lengthened contralateral SRT20º
(Contralateral SRT20º = 0.91 x tinnitus + 0.42 x rotatory vertigo & working capacity).
Contralateral SRT60º tended to be lengthened (p=0.011, r²=0.517) in patients with
severe tinnitus. There was a correlation between tinnitus and working capacity,
indicating that they had a lengthened contralateral SRT60º (contralateral SRT60º =
0.06 x tinnitus + 1.65 x tinnitus & working capacity). Ipsilateral SPV20º tended to be
lower (p=0.037, r²=0.539) in patients with advanced age or severe Tumarkin drop
attacks. There was a correlation between advanced age and rotatory vertigo attack,
indicating a lower ipsilateral SPV20º than in other patients (Ipsilateral SPV20º = -2.96
x age - 1.21 x Tumarkin attacks -1.96 x age & rotatory vertigo).
In evaluating PRPEM at the frequency combination of 0.25 and 0.425Hz, GA was
significantly lower (p<0.005, r²=0.642) in patients with severe tinnitus and
unsteadiness during attack-free periods, than in other patients. There was a
correlation between unsteadiness during attack-free periods and advanced age,
indicating that patients with severe unsteadiness during attack-free periods and
advanced age had a lower GA. There was also a correlation between severe tinnitus
and advanced age, indicating that this combination produced a lower GA than the
other patients (GA = - 0.30 x tinnitus - 0.34 x unsteadiness - 0.23 x unsteadiness &
age - 0.34 x tinnitus & age).
5. B. 2. Operated cerebello-pontine angle tumor
Deficits in voluntary eye movements were related to the tumor size, the radical nature
of the operation, adherence of tumor, and age of the patient.
76
In regard to constant saccades, the contralateral SRT was significantly
lengthened (p<0.005, r²=0.666) in patients with poor facial nerve function after
surgery. Patients with advanced age and with a cystic tumor had a lengthened
contralateral SRT (contralateral SRT = 1.94 x facial nerve function after surgery + 1.35
x age & cysticity). Ipsilateral SPV tended to be lower (p=0.030, r²=0.274) if the tumor
had been cystic than in other cases. Patients observed with a large tumor and
advanced age had a lower ipsilateral SPV than the others (ipsilateral SPV = - 2.24 x
cysticity - 2.27 x size of tumor & age).
In regard to pseudo-random saccades (20° and 60° saccades), the ipsilateral
SRT20º tended to be lengthened (p=0.036, r²=0.472) in patients with poor facial nerve
function after surgery and in post-operative cystic tumor patients. Patients who
previously had a radical operation and a long operation time were observed to have a
lengthened ipsilateral SRT20º (ipsilateral SRT20º = 2.20 x facial nerve function after
surgery +1.38 x cysticity + 0.62 x radicality of operation & operation time). Ipsilateral
SPV60º tended to be lower (p=0.040, r²=0.253) in patients of radical operations.
Patients with advanced age, cystic tumor and a long operation time were observed to
have a lower ipsilateral SPV60º than the other patients (ipsilateral SPV60º = - 0.53 x
radicality of operation - 1.26 x age & cysticity & operation time).
Regarding PRPEM at a frequency combination of 0.25-0.425Hz, the GA tended to
be lower (p=0.031, r²=0.291) in patients who previously had a large diameter tumor.
Patients with radical operations and a cystic tumor had a lower GA than the others
(GA = - 1.79 x size of tumor - 1.60 x radicality of operation & cysticity of tumor).
In the PRPEM with the frequency combination of 0.45-0.7Hz, the mean phase
was significantly lengthened (p<0.01, r²=0.311) in patients with radical operations of
cystic tumors, or a large diameter tumor (Mean phase = 1.98 x size of tumor + 2.39 x
radicality of operation + 1.40 x cysticity of tumor).
5. B. 3. Operated hemangioblastoma
Deficits in voluntary eye movements of operated HAB patients correlated with certain
MRI findings.
In regard to constant saccades, the ipsilateral SRT was significantly lengthened
(p<0.005, r²=0.543) in patients with an oculomotor vermis lesion. Patients with a
brain stem lesion and advanced age were observed to have a lengthened ipsilateral
SRT (ipsilateral SRT = 0.25 x oculomotor vermis lesion + 1.25 x brain stem lesion &
age). Ipsilateral SPV tended to be lower (p=0.026, r²=0.430) in patients with a fastigial
nucleus lesion. It was also observed that patients with fastigial nucleus lesions and
77
advanced age had a lower ipsilateral SPV (ipsilateral SPV = - 0.20 x fastigial nucleus
lesion - 0.68x fastigial nucleus lesion & age).
For pseudo-random saccades (at 20° and 60°), ipsilateral SRT20º was
significantly lengthened (p<0.01, r²=0.509) in patients with brain stem lesions.
Patients with oculomotor vermis lesion and advanced age had a lengthened ipsilateral
SRT20º (Ipsilateral SRT20º = 2.65 x brain stem lesion + 0.91 x oculomotor vermis
lesion & age). Contralateral SA20º tended to be poor (p=0.016, r²=0.466) in patients
with brain stem lesions. Patients with oculomotor vermis lesion together with
advanced age were shown to have an inaccurate contralateral SA20º (contralateral
SA20º = 2.55 x brain stem lesion + 1.66 x oculomotor vermis lesion & age). Ipsilateral
SPV60º tended to be lower (p=0.031, r²=0.418) in patients with fastigial nucleus
lesions. Patients with brain stem lesions and advanced age had a lower SPV60º than
those without these findings (ipsilateral SPV60º = - 2.12 x fastigial nucleus lesion -
1.25 x brain stem lesion & age).
In PRPEM at a frequency combination of 0.25 and 0.425Hz, the GA tended to be
lower (p=0.015, r²=0.472) in patients with flocculus lesions; patients with brain stem
lesions and advanced age had a lower GA (GA = - 0.68 x flocculus lesion - 3.02 x brain
stem lesion & age of the patient).
In PRPEM at a frequency combination of 0.45 and 0.7Hz, brain stem lesions
tended to correlate (p=0.010, r²=0.416) with a lengthened mean phase and a reduced
GA (Brain stem lesion = -2.88 x GA + 0.05 x mean phase.).
5. B. 4. Infarction of cerebello-brain stem:
Figure 8a-c demonstrates the MRI findings from a 48 year-old female patient (subject
1) with a right-sided cerebello-brain stem infarction due to thrombosis of arteria
cerebelli superior, which occurred at the age of 36. She demonstrated a reduced SPV
and lengthened SRT of the saccades, and SA was normal. She had normal PRPEMs.
Figure 9a-b shows her recordings of pseudo-random saccade tests and a part of one
PRPEM recording.
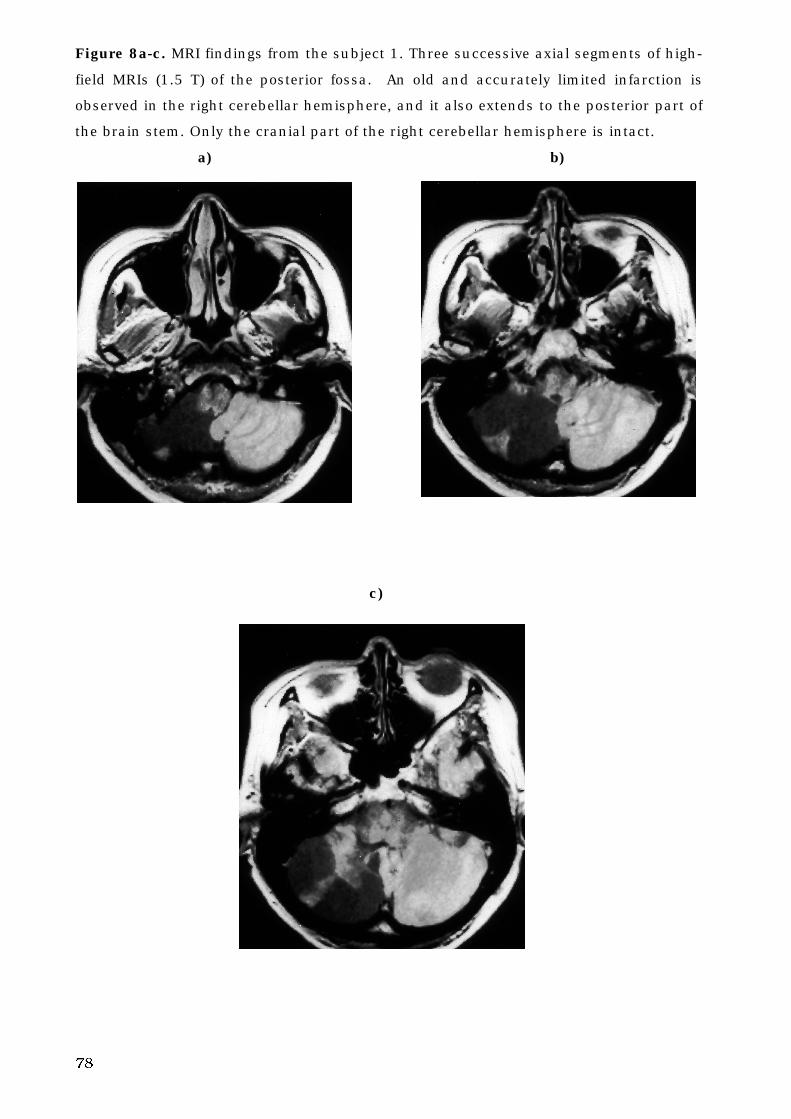
78
Figure 8a-c. MRI findings from the subject 1. Three successive axial segments of high-
field MRIs (1.5 T) of the posterior fossa. An old and accurately limited infarction is
observed in the right cerebellar hemisphere, and it also extends to the posterior part of
the brain stem. Only the cranial part of the right cerebellar hemisphere is intact.
a) b)
c)
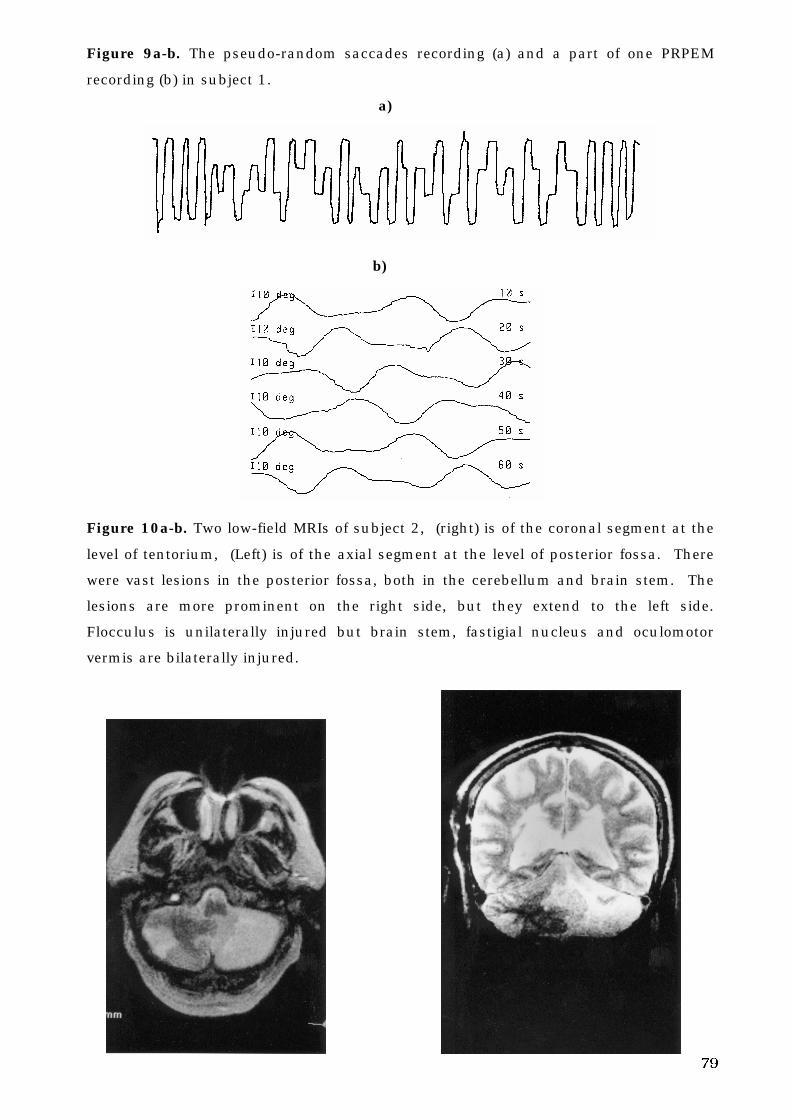
79
Figure 9a-b. The pseudo-random saccades recording (a) and a part of one PRPEM
recording (b) in subject 1.
a)
b)
Figure 10a-b. Two low-field MRIs of subject 2, (right) is of the coronal segment at the
level of tentorium, (Left) is of the axial segment at the level of posterior fossa. There
were vast lesions in the posterior fossa, both in the cerebellum and brain stem. The
lesions are more prominent on the right side, but they extend to the left side.
Flocculus is unilaterally injured but brain stem, fastigial nucleus and oculomotor
vermis are bilaterally injured.
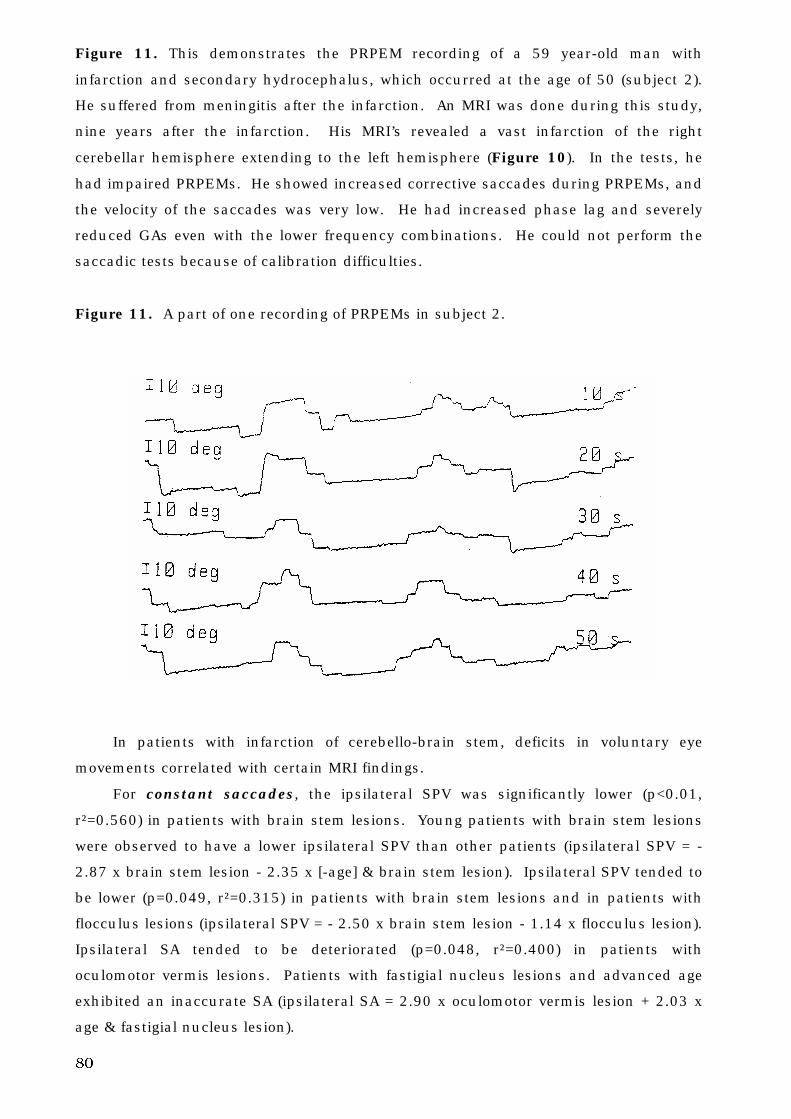
80
Figure 11. This demonstrates the PRPEM recording of a 59 year-old man with
infarction and secondary hydrocephalus, which occurred at the age of 50 (subject 2).
He suffered from meningitis after the infarction. An MRI was done during this study,
nine years after the infarction. His MRI’s revealed a vast infarction of the right
cerebellar hemisphere extending to the left hemisphere (Figure 10). In the tests, he
had impaired PRPEMs. He showed increased corrective saccades during PRPEMs, and
the velocity of the saccades was very low. He had increased phase lag and severely
reduced GAs even with the lower frequency combinations. He could not perform the
saccadic tests because of calibration difficulties.
Figure 11. A part of one recording of PRPEMs in subject 2.
In patients with infarction of cerebello-brain stem, deficits in voluntary eye
movements correlated with certain MRI findings.
For constant saccades, the ipsilateral SPV was significantly lower (p<0.01,
r²=0.560) in patients with brain stem lesions. Young patients with brain stem lesions
were observed to have a lower ipsilateral SPV than other patients (ipsilateral SPV = -
2.87 x brain stem lesion - 2.35 x [-age] & brain stem lesion). Ipsilateral SPV tended to
be lower (p=0.049, r²=0.315) in patients with brain stem lesions and in patients with
flocculus lesions (ipsilateral SPV = - 2.50 x brain stem lesion - 1.14 x flocculus lesion).
Ipsilateral SA tended to be deteriorated (p=0.048, r²=0.400) in patients with
oculomotor vermis lesions. Patients with fastigial nucleus lesions and advanced age
exhibited an inaccurate SA (ipsilateral SA = 2.90 x oculomotor vermis lesion + 2.03 x
age & fastigial nucleus lesion).
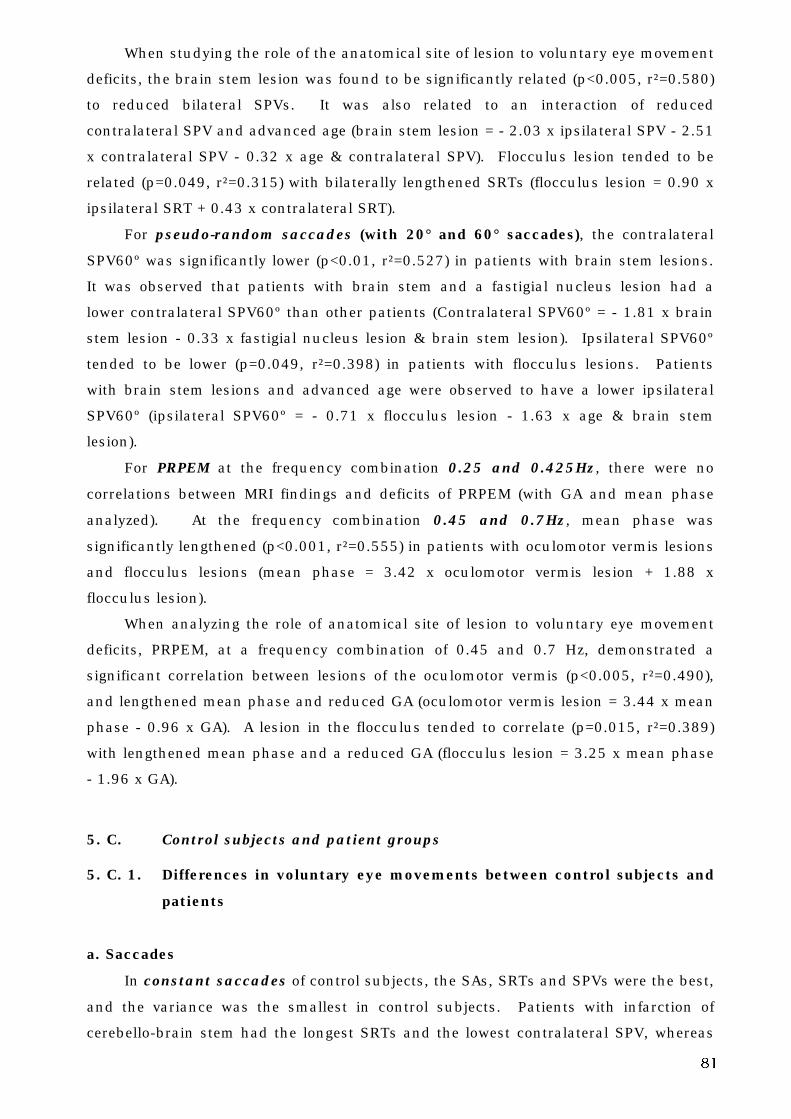
81
When studying the role of the anatomical site of lesion to voluntary eye movement
deficits, the brain stem lesion was found to be significantly related (p<0.005, r²=0.580)
to reduced bilateral SPVs. It was also related to an interaction of reduced
contralateral SPV and advanced age (brain stem lesion = - 2.03 x ipsilateral SPV - 2.51
x contralateral SPV - 0.32 x age & contralateral SPV). Flocculus lesion tended to be
related (p=0.049, r²=0.315) with bilaterally lengthened SRTs (flocculus lesion = 0.90 x
ipsilateral SRT + 0.43 x contralateral SRT).
For pseudo-random saccades (with 20° and 60° saccades), the contralateral
SPV60º was significantly lower (p<0.01, r²=0.527) in patients with brain stem lesions.
It was observed that patients with brain stem and a fastigial nucleus lesion had a
lower contralateral SPV60º than other patients (Contralateral SPV60º = - 1.81 x brain
stem lesion - 0.33 x fastigial nucleus lesion & brain stem lesion). Ipsilateral SPV60º
tended to be lower (p=0.049, r²=0.398) in patients with flocculus lesions. Patients
with brain stem lesions and advanced age were observed to have a lower ipsilateral
SPV60º (ipsilateral SPV60º = - 0.71 x flocculus lesion - 1.63 x age & brain stem
lesion).
For PRPEM at the frequency combination 0.25 and 0.425Hz, there were no
correlations between MRI findings and deficits of PRPEM (with GA and mean phase
analyzed). At the frequency combination 0.45 and 0.7Hz, mean phase was
significantly lengthened (p<0.001, r²=0.555) in patients with oculomotor vermis lesions
and flocculus lesions (mean phase = 3.42 x oculomotor vermis lesion + 1.88 x
flocculus lesion).
When analyzing the role of anatomical site of lesion to voluntary eye movement
deficits, PRPEM, at a frequency combination of 0.45 and 0.7 Hz, demonstrated a
significant correlation between lesions of the oculomotor vermis (p<0.005, r²=0.490),
and lengthened mean phase and reduced GA (oculomotor vermis lesion = 3.44 x mean
phase - 0.96 x GA). A lesion in the flocculus tended to correlate (p=0.015, r²=0.389)
with lengthened mean phase and a reduced GA (flocculus lesion = 3.25 x mean phase
- 1.96 x GA).
5. C. Control subjects and patient groups
5. C. 1. Differences in voluntary eye movements between control subjects and
patients
a. Saccades
In constant saccades of control subjects, the SAs, SRTs and SPVs were the best,
and the variance was the smallest in control subjects. Patients with infarction of
cerebello-brain stem had the longest SRTs and the lowest contralateral SPV, whereas
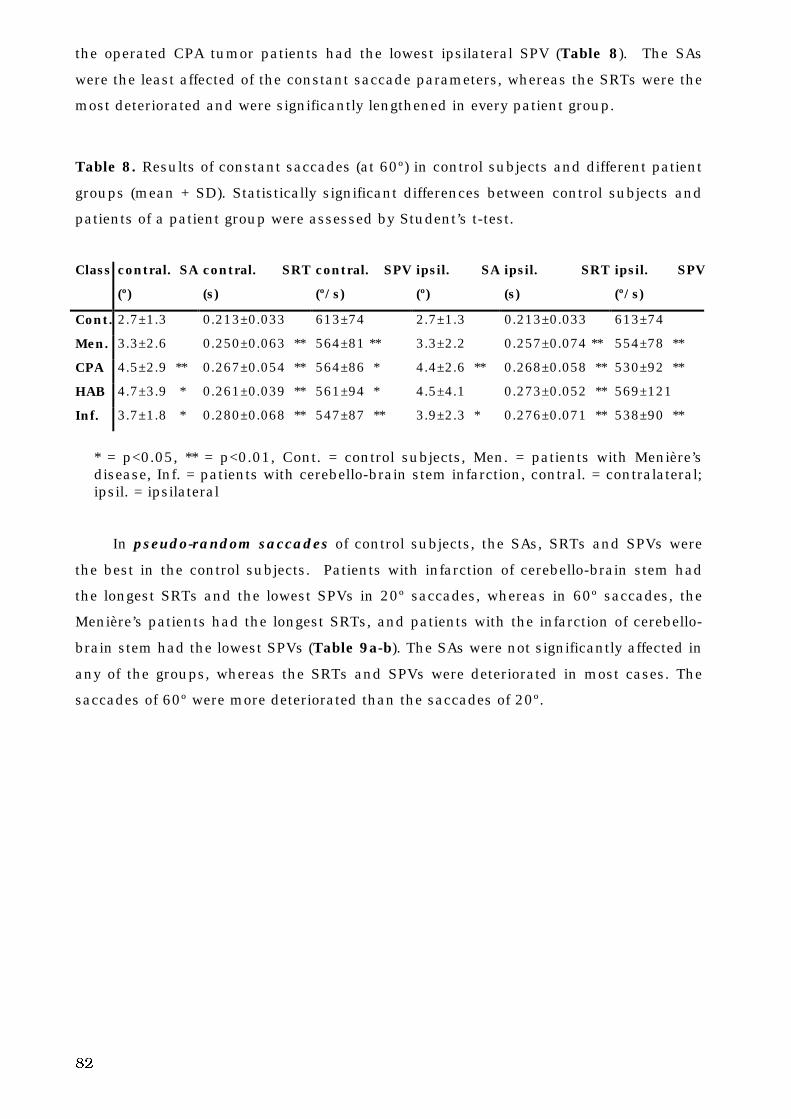
82
the operated CPA tumor patients had the lowest ipsilateral SPV (Table 8). The SAs
were the least affected of the constant saccade parameters, whereas the SRTs were the
most deteriorated and were significantly lengthened in every patient group.
Table 8. Results of constant saccades (at 60º) in control subjects and different patient
groups (mean + SD). Statistically significant differences between control subjects and
patients of a patient group were assessed by Student’s t-test.
Class contral. SA
(º)
contral. SRT
(s)
contral. SPV
(º/s)
ipsil. SA
(º)
ipsil. SRT
(s)
ipsil. SPV
(º/s)
Cont. 2.7±1.3 0.213±0.033 613±74 2.7±1.3 0.213±0.033 613±74
Men. 3.3±2.6 0.250±0.063 ** 564±81 ** 3.3±2.2 0.257±0.074 ** 554±78 **
CPA 4.5±2.9 ** 0.267±0.054 ** 564±86 * 4.4±2.6 ** 0.268±0.058 ** 530±92 **
HAB 4.7±3.9 * 0.261±0.039 ** 561±94 * 4.5±4.1 0.273±0.052 ** 569±121
Inf. 3.7±1.8 * 0.280±0.068 ** 547±87 ** 3.9±2.3 * 0.276±0.071 ** 538±90 **
* = p<0.05, ** = p<0.01, Cont. = control subjects, Men. = patients with Menière’sdisease, Inf. = patients with cerebello-brain stem infarction, contral. = contralateral;ipsil. = ipsilateral
In pseudo-random saccades of control subjects, the SAs, SRTs and SPVs were
the best in the control subjects. Patients with infarction of cerebello-brain stem had
the longest SRTs and the lowest SPVs in 20º saccades, whereas in 60º saccades, the
Menière’s patients had the longest SRTs, and patients with the infarction of cerebello-
brain stem had the lowest SPVs (Table 9a-b). The SAs were not significantly affected in
any of the groups, whereas the SRTs and SPVs were deteriorated in most cases. The
saccades of 60º were more deteriorated than the saccades of 20º.
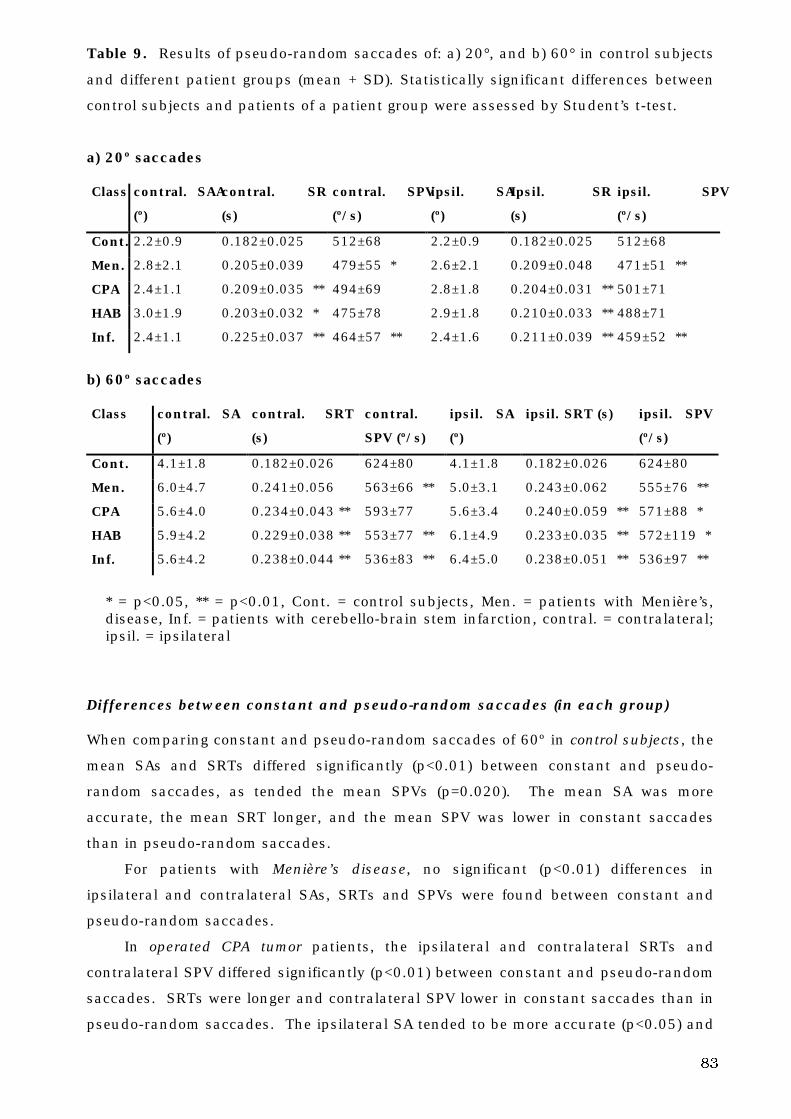
83
Table 9. Results of pseudo-random saccades of: a) 20°, and b) 60° in control subjects
and different patient groups (mean + SD). Statistically significant differences between
control subjects and patients of a patient group were assessed by Student’s t-test.
a) 20º saccades
Class contral. SAA
(º)
contral. SRT
(s)
contral. SPV
(º/s)
ipsil. SA
(º)
Ipsil. SRT
(s)
ipsil. SPV
(º/s)
Cont. 2.2±0.9 0.182±0.025 512±68 2.2±0.9 0.182±0.025 512±68
Men. 2.8±2.1 0.205±0.039 479±55 * 2.6±2.1 0.209±0.048 471±51 **
CPA 2.4±1.1 0.209±0.035 ** 494±69 2.8±1.8 0.204±0.031 ** 501±71
HAB 3.0±1.9 0.203±0.032 * 475±78 2.9±1.8 0.210±0.033 ** 488±71
Inf. 2.4±1.1 0.225±0.037 ** 464±57 ** 2.4±1.6 0.211±0.039 ** 459±52 **
b) 60º saccades
Class contral. SA
(º)
contral. SRT
(s)
contral.
SPV (º/s)
ipsil. SA
(º)
ipsil. SRT (s) ipsil. SPV
(º/s)
Cont. 4.1±1.8 0.182±0.026 624±80 4.1±1.8 0.182±0.026 624±80
Men. 6.0±4.7 0.241±0.056 563±66 ** 5.0±3.1 0.243±0.062 555±76 **
CPA 5.6±4.0 0.234±0.043 ** 593±77 5.6±3.4 0.240±0.059 ** 571±88 *
HAB 5.9±4.2 0.229±0.038 ** 553±77 ** 6.1±4.9 0.233±0.035 ** 572±119 *
Inf. 5.6±4.2 0.238±0.044 ** 536±83 ** 6.4±5.0 0.238±0.051 ** 536±97 **
* = p<0.05, ** = p<0.01, Cont. = control subjects, Men. = patients with Menière’s,disease, Inf. = patients with cerebello-brain stem infarction, contral. = contralateral;ipsil. = ipsilateral
Differences between constant and pseudo-random saccades (in each group)
When comparing constant and pseudo-random saccades of 60º in control subjects, the
mean SAs and SRTs differed significantly (p<0.01) between constant and pseudo-
random saccades, as tended the mean SPVs (p=0.020). The mean SA was more
accurate, the mean SRT longer, and the mean SPV was lower in constant saccades
than in pseudo-random saccades.
For patients with Menière’s disease, no significant (p<0.01) differences in
ipsilateral and contralateral SAs, SRTs and SPVs were found between constant and
pseudo-random saccades.
In operated CPA tumor patients, the ipsilateral and contralateral SRTs and
contralateral SPV differed significantly (p<0.01) between constant and pseudo-random
saccades. SRTs were longer and contralateral SPV lower in constant saccades than in
pseudo-random saccades. The ipsilateral SA tended to be more accurate (p<0.05) and
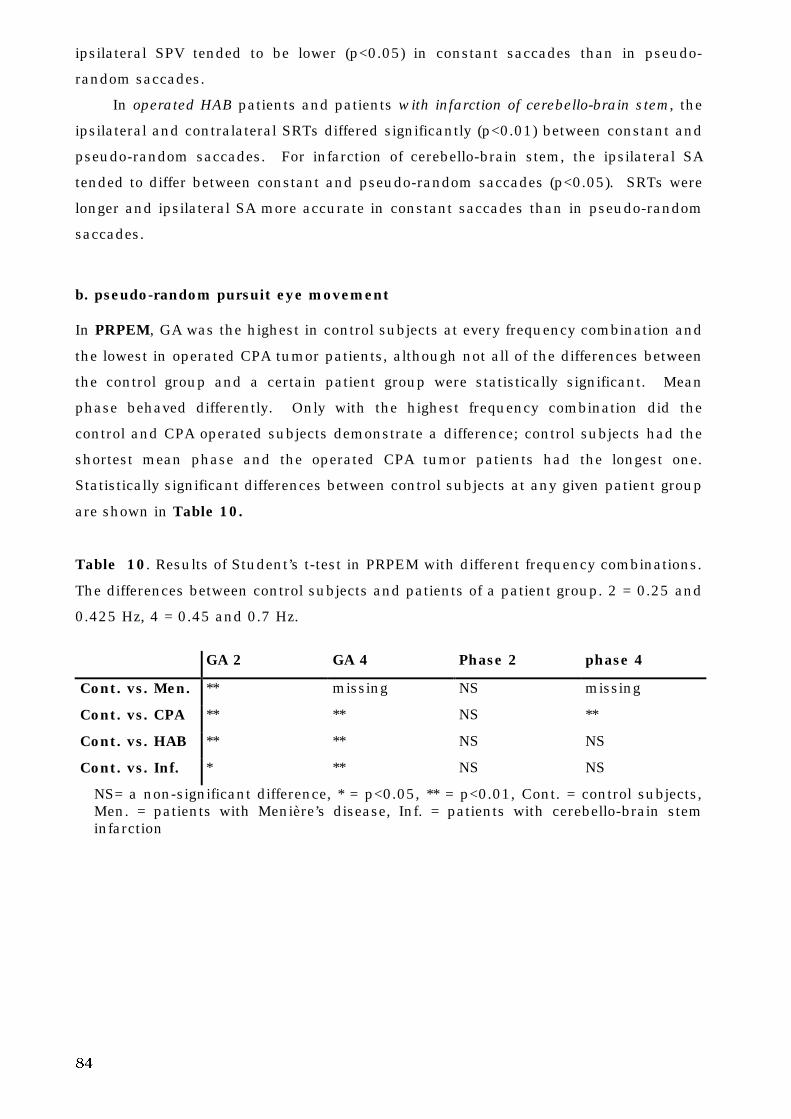
84
ipsilateral SPV tended to be lower (p<0.05) in constant saccades than in pseudo-
random saccades.
In operated HAB patients and patients with infarction of cerebello-brain stem, the
ipsilateral and contralateral SRTs differed significantly (p<0.01) between constant and
pseudo-random saccades. For infarction of cerebello-brain stem, the ipsilateral SA
tended to differ between constant and pseudo-random saccades (p<0.05). SRTs were
longer and ipsilateral SA more accurate in constant saccades than in pseudo-random
saccades.
b. pseudo-random pursuit eye movement
In PRPEM, GA was the highest in control subjects at every frequency combination and
the lowest in operated CPA tumor patients, although not all of the differences between
the control group and a certain patient group were statistically significant. Mean
phase behaved differently. Only with the highest frequency combination did the
control and CPA operated subjects demonstrate a difference; control subjects had the
shortest mean phase and the operated CPA tumor patients had the longest one.
Statistically significant differences between control subjects at any given patient group
are shown in Table 10.
Table 10. Results of Student’s t-test in PRPEM with different frequency combinations.
The differences between control subjects and patients of a patient group. 2 = 0.25 and
0.425 Hz, 4 = 0.45 and 0.7 Hz.
GA 2 GA 4 Phase 2 phase 4
Cont. vs. Men. ** missing NS missing
Cont. vs. CPA ** ** NS **
Cont. vs. HAB ** ** NS NS
Cont. vs. Inf. * ** NS NS
NS= a non-significant difference, * = p<0.05, ** = p<0.01, Cont. = control subjects,Men. = patients with Menière’s disease, Inf. = patients with cerebello-brain steminfarction
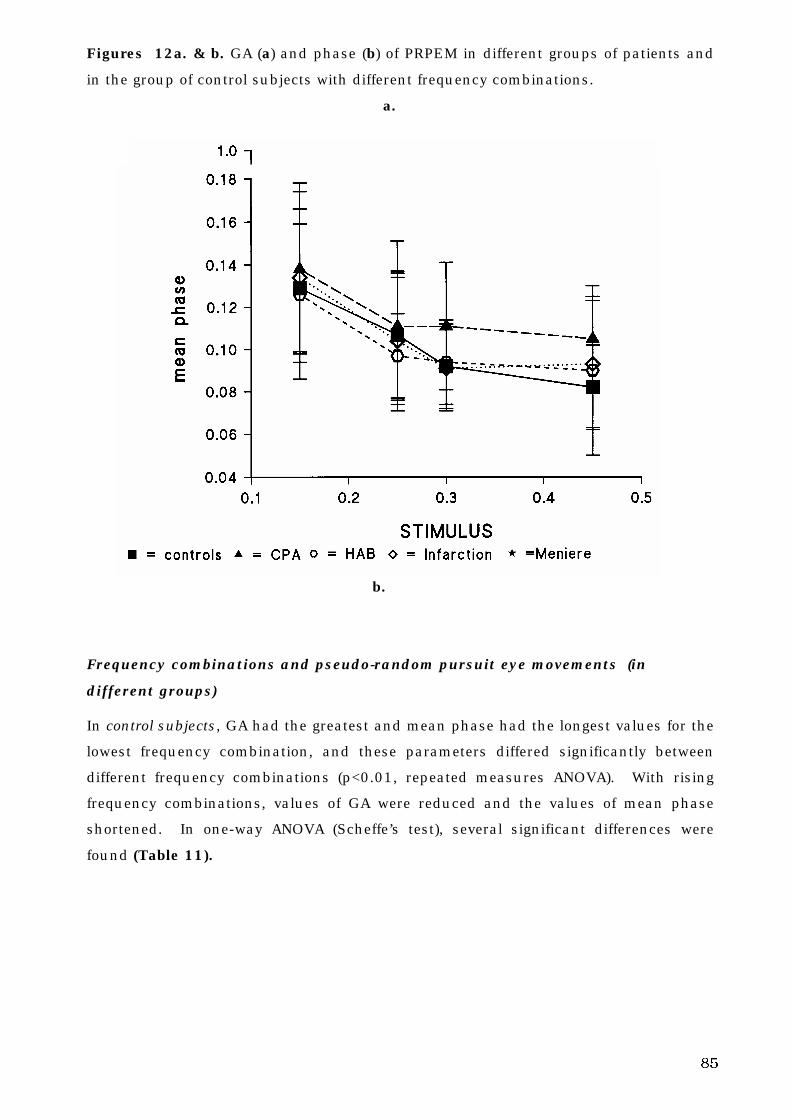
85
Figures 12a. & b. GA (a) and phase (b) of PRPEM in different groups of patients and
in the group of control subjects with different frequency combinations.
a.
b.
Frequency combinations and pseudo-random pursuit eye movements (in
different groups)
In control subjects, GA had the greatest and mean phase had the longest values for the
lowest frequency combination, and these parameters differed significantly between
different frequency combinations (p<0.01, repeated measures ANOVA). With rising
frequency combinations, values of GA were reduced and the values of mean phase
shortened. In one-way ANOVA (Scheffe’s test), several significant differences were
found (Table 11).
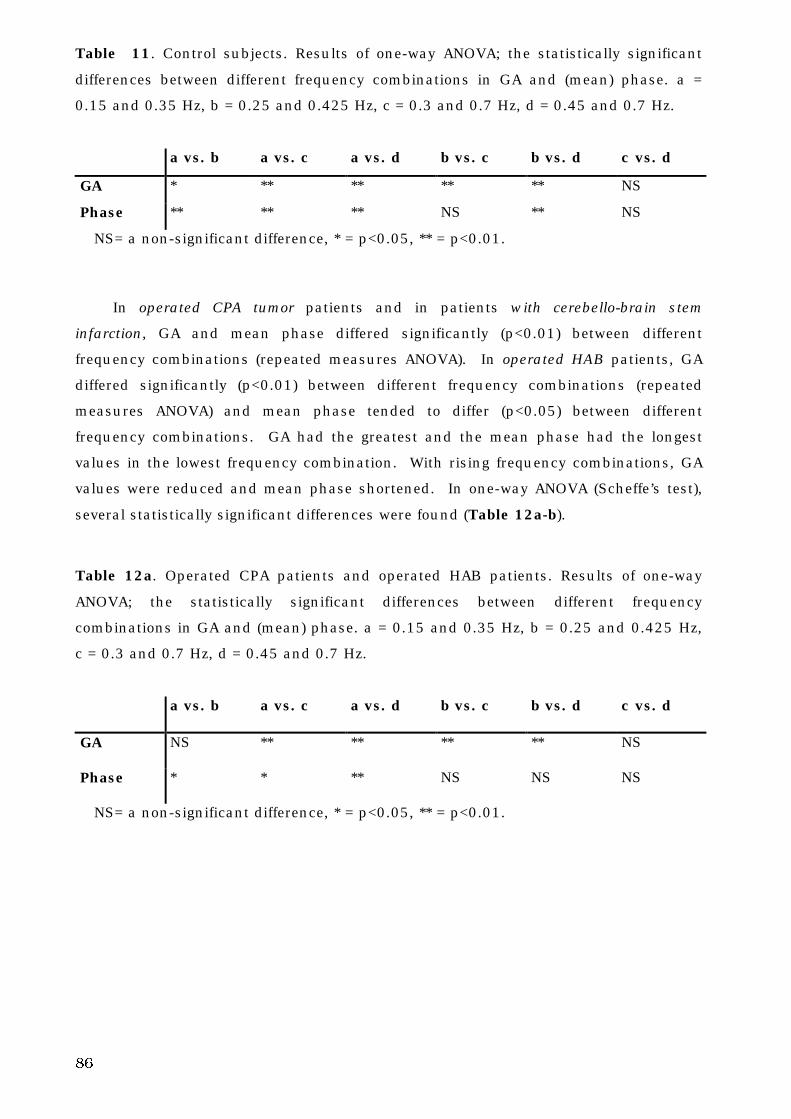
86
Table 11. Control subjects. Results of one-way ANOVA; the statistically significant
differences between different frequency combinations in GA and (mean) phase. a =
0.15 and 0.35 Hz, b = 0.25 and 0.425 Hz, c = 0.3 and 0.7 Hz, d = 0.45 and 0.7 Hz.
a vs. b a vs. c a vs. d b vs. c b vs. d c vs. d
GA * ** ** ** ** NS
Phase ** ** ** NS ** NS
NS= a non-significant difference, * = p<0.05, ** = p<0.01.
In operated CPA tumor patients and in patients with cerebello-brain stem
infarction, GA and mean phase differed significantly (p<0.01) between different
frequency combinations (repeated measures ANOVA). In operated HAB patients, GA
differed significantly (p<0.01) between different frequency combinations (repeated
measures ANOVA) and mean phase tended to differ (p<0.05) between different
frequency combinations. GA had the greatest and the mean phase had the longest
values in the lowest frequency combination. With rising frequency combinations, GA
values were reduced and mean phase shortened. In one-way ANOVA (Scheffe’s test),
several statistically significant differences were found (Table 12a-b).
Table 12a. Operated CPA patients and operated HAB patients. Results of one-way
ANOVA; the statistically significant differences between different frequency
combinations in GA and (mean) phase. a = 0.15 and 0.35 Hz, b = 0.25 and 0.425 Hz,
c = 0.3 and 0.7 Hz, d = 0.45 and 0.7 Hz.
a vs. b a vs. c a vs. d b vs. c b vs. d c vs. d
GA NS ** ** ** ** NS
Phase * * ** NS NS NS
NS= a non-significant difference, * = p<0.05, ** = p<0.01.
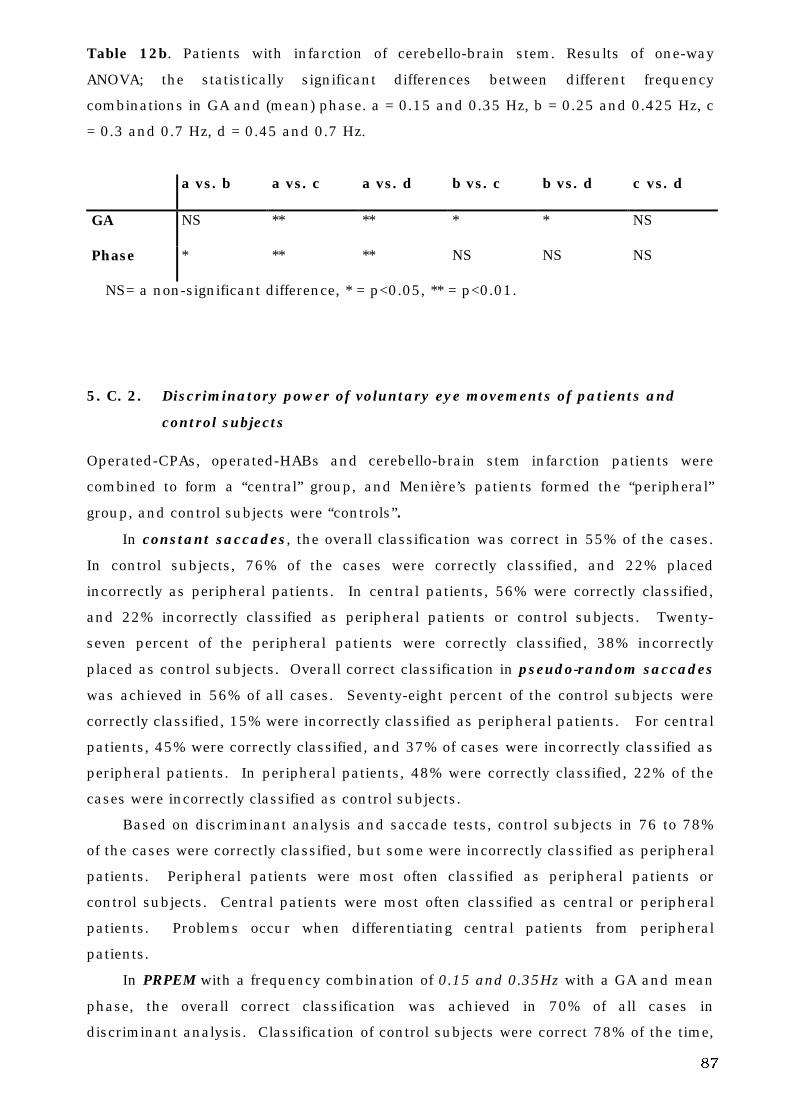
87
Table 12b. Patients with infarction of cerebello-brain stem. Results of one-way
ANOVA; the statistically significant differences between different frequency
combinations in GA and (mean) phase. a = 0.15 and 0.35 Hz, b = 0.25 and 0.425 Hz, c
= 0.3 and 0.7 Hz, d = 0.45 and 0.7 Hz.
a vs. b a vs. c a vs. d b vs. c b vs. d c vs. d
GA NS ** ** * * NS
Phase * ** ** NS NS NS
NS= a non-significant difference, * = p<0.05, ** = p<0.01.
5. C. 2. Discriminatory power of voluntary eye movements of patients and
control subjects
Operated-CPAs, operated-HABs and cerebello-brain stem infarction patients were
combined to form a “central” group, and Menière’s patients formed the “peripheral”
group, and control subjects were “controls”.
In constant saccades, the overall classification was correct in 55% of the cases.
In control subjects, 76% of the cases were correctly classified, and 22% placed
incorrectly as peripheral patients. In central patients, 56% were correctly classified,
and 22% incorrectly classified as peripheral patients or control subjects. Twenty-
seven percent of the peripheral patients were correctly classified, 38% incorrectly
placed as control subjects. Overall correct classification in pseudo-random saccades
was achieved in 56% of all cases. Seventy-eight percent of the control subjects were
correctly classified, 15% were incorrectly classified as peripheral patients. For central
patients, 45% were correctly classified, and 37% of cases were incorrectly classified as
peripheral patients. In peripheral patients, 48% were correctly classified, 22% of the
cases were incorrectly classified as control subjects.
Based on discriminant analysis and saccade tests, control subjects in 76 to 78%
of the cases were correctly classified, but some were incorrectly classified as peripheral
patients. Peripheral patients were most often classified as peripheral patients or
control subjects. Central patients were most often classified as central or peripheral
patients. Problems occur when differentiating central patients from peripheral
patients.
In PRPEM with a frequency combination of 0.15 and 0.35Hz with a GA and mean
phase, the overall correct classification was achieved in 70% of all cases in
discriminant analysis. Classification of control subjects were correct 78% of the time,
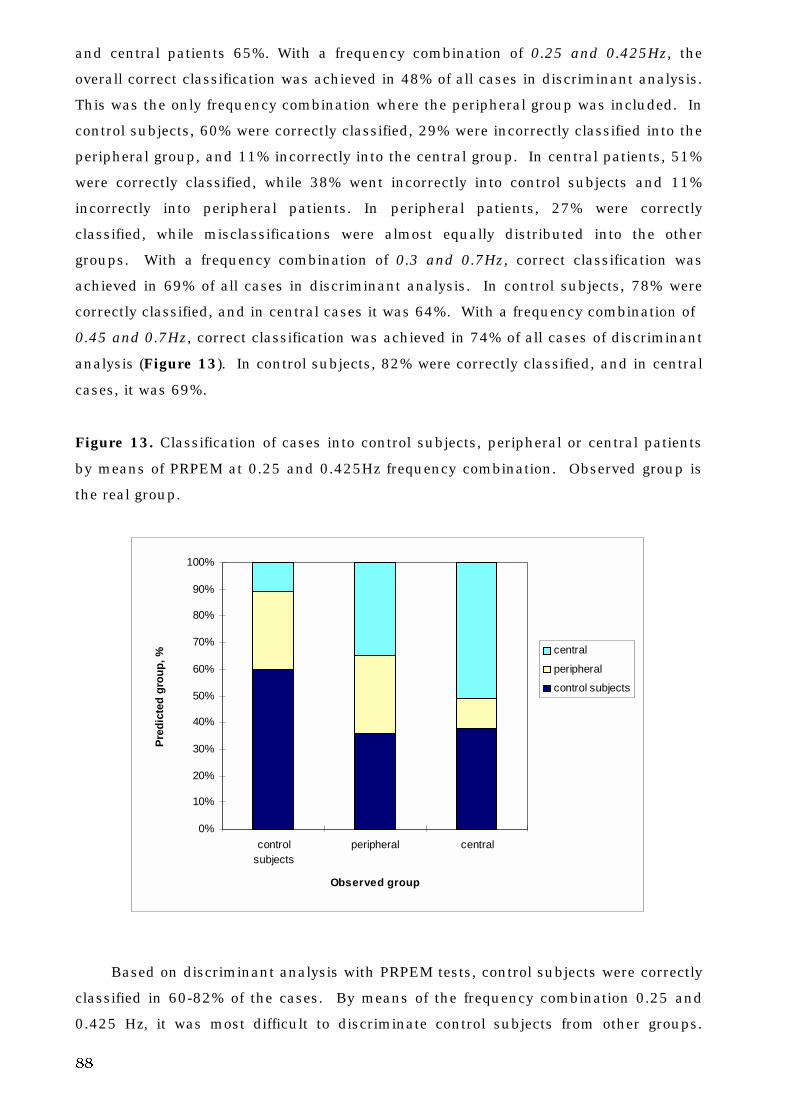
88
and central patients 65%. With a frequency combination of 0.25 and 0.425Hz, the
overall correct classification was achieved in 48% of all cases in discriminant analysis.
This was the only frequency combination where the peripheral group was included. In
control subjects, 60% were correctly classified, 29% were incorrectly classified into the
peripheral group, and 11% incorrectly into the central group. In central patients, 51%
were correctly classified, while 38% went incorrectly into control subjects and 11%
incorrectly into peripheral patients. In peripheral patients, 27% were correctly
classified, while misclassifications were almost equally distributed into the other
groups. With a frequency combination of 0.3 and 0.7Hz, correct classification was
achieved in 69% of all cases in discriminant analysis. In control subjects, 78% were
correctly classified, and in central cases it was 64%. With a frequency combination of
0.45 and 0.7Hz, correct classification was achieved in 74% of all cases of discriminant
analysis (Figure 13). In control subjects, 82% were correctly classified, and in central
cases, it was 69%.
Figure 13. Classification of cases into control subjects, peripheral or central patients
by means of PRPEM at 0.25 and 0.425Hz frequency combination. Observed group is
the real group.
0%
10%
20%
30%
40%
50%
60%
70%
80%
90%
100%
controlsubjects
peripheral central
Observed group
Pre
dic
ted
gro
up
, %
central
peripheral
control subjects
Based on discriminant analysis with PRPEM tests, control subjects were correctly
classified in 60-82% of the cases. By means of the frequency combination 0.25 and
0.425 Hz, it was most difficult to discriminate control subjects from other groups.
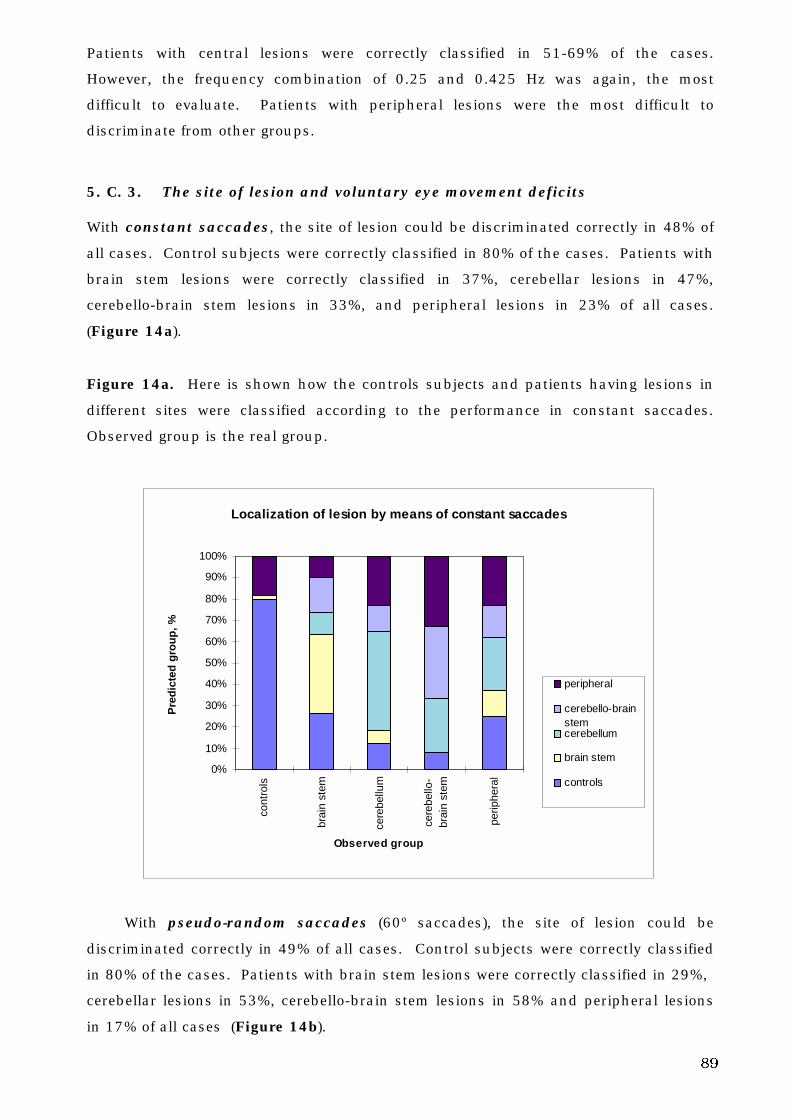
89
Patients with central lesions were correctly classified in 51-69% of the cases.
However, the frequency combination of 0.25 and 0.425 Hz was again, the most
difficult to evaluate. Patients with peripheral lesions were the most difficult to
discriminate from other groups.
5. C. 3. The site of lesion and voluntary eye movement deficits
With constant saccades, the site of lesion could be discriminated correctly in 48% of
all cases. Control subjects were correctly classified in 80% of the cases. Patients with
brain stem lesions were correctly classified in 37%, cerebellar lesions in 47%,
cerebello-brain stem lesions in 33%, and peripheral lesions in 23% of all cases.
(Figure 14a).
Figure 14a. Here is shown how the controls subjects and patients having lesions in
different sites were classified according to the performance in constant saccades.
Observed group is the real group.
Localization of lesion by means of constant saccades
0%
10%
20%
30%
40%
50%
60%
70%
80%
90%
100%
cont
rols
brai
n st
em
cere
bellu
m
cere
bello
-br
ain
stem
perip
hera
l
Observed group
Pre
dic
ted
gro
up
, %
peripheral
cerebello-brainstemcerebellum
brain stem
controls
With pseudo-random saccades (60º saccades), the site of lesion could be
discriminated correctly in 49% of all cases. Control subjects were correctly classified
in 80% of the cases. Patients with brain stem lesions were correctly classified in 29%,
cerebellar lesions in 53%, cerebello-brain stem lesions in 58% and peripheral lesions
in 17% of all cases (Figure 14b).
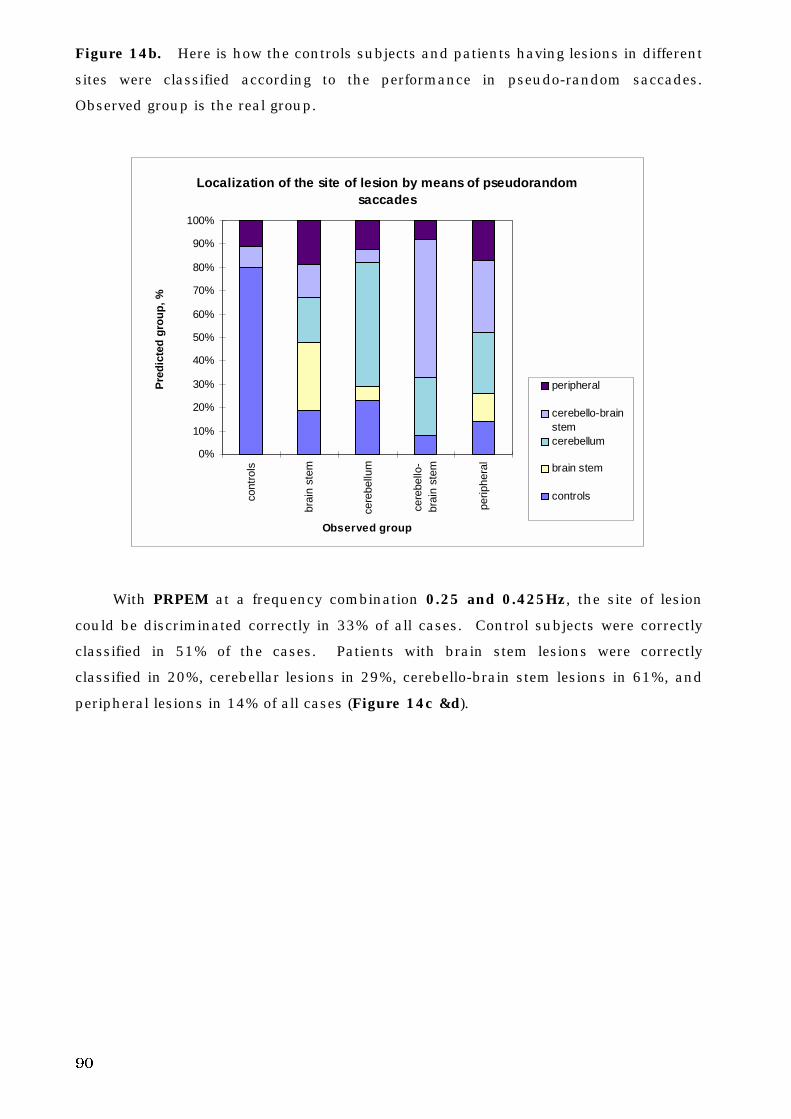
90
Figure 14b. Here is how the controls subjects and patients having lesions in different
sites were classified according to the performance in pseudo-random saccades.
Observed group is the real group.
Localization of the site of lesion by means of pseudorandom
saccades
0%
10%
20%
30%
40%
50%
60%
70%
80%
90%
100%
cont
rols
brai
n st
em
cere
bellu
m
cere
bello
-br
ain
stem
perip
hera
l
Observed group
Pre
dic
ted
gro
up
, %
peripheral
cerebello-brainstemcerebellum
brain stem
controls
With PRPEM at a frequency combination 0.25 and 0.425Hz, the site of lesion
could be discriminated correctly in 33% of all cases. Control subjects were correctly
classified in 51% of the cases. Patients with brain stem lesions were correctly
classified in 20%, cerebellar lesions in 29%, cerebello-brain stem lesions in 61%, and
peripheral lesions in 14% of all cases (Figure 14c &d).
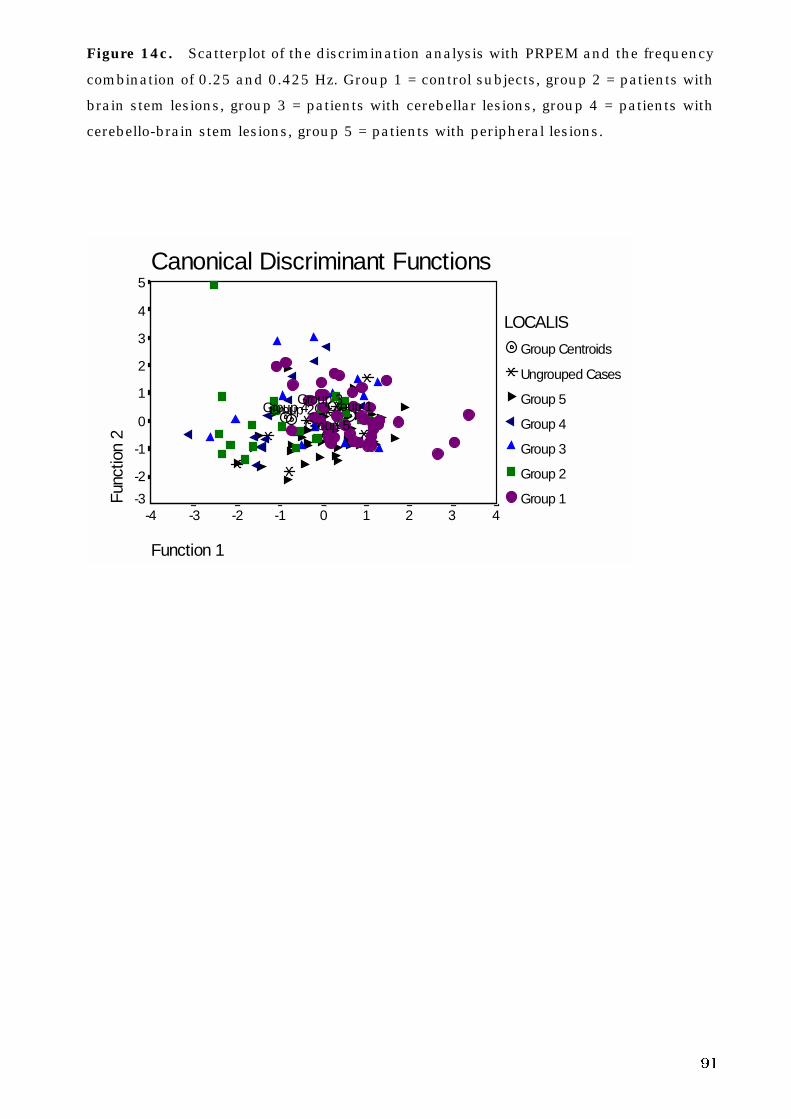
91
Figure 14c. Scatterplot of the discrimination analysis with PRPEM and the frequency
combination of 0.25 and 0.425 Hz. Group 1 = control subjects, group 2 = patients with
brain stem lesions, group 3 = patients with cerebellar lesions, group 4 = patients with
cerebello-brain stem lesions, group 5 = patients with peripheral lesions.
Canonical Discriminant Functions
Function 1
43210-1-2-3-4
Func
tion
2
5
4
3
2
1
0
-1
-2
-3
LOCALIS
Group Centroids
Ungrouped Cases
Group 5
Group 4
Group 3
Group 2
Group 1
Group 5Group 4
Group 3Group 2 Group 1
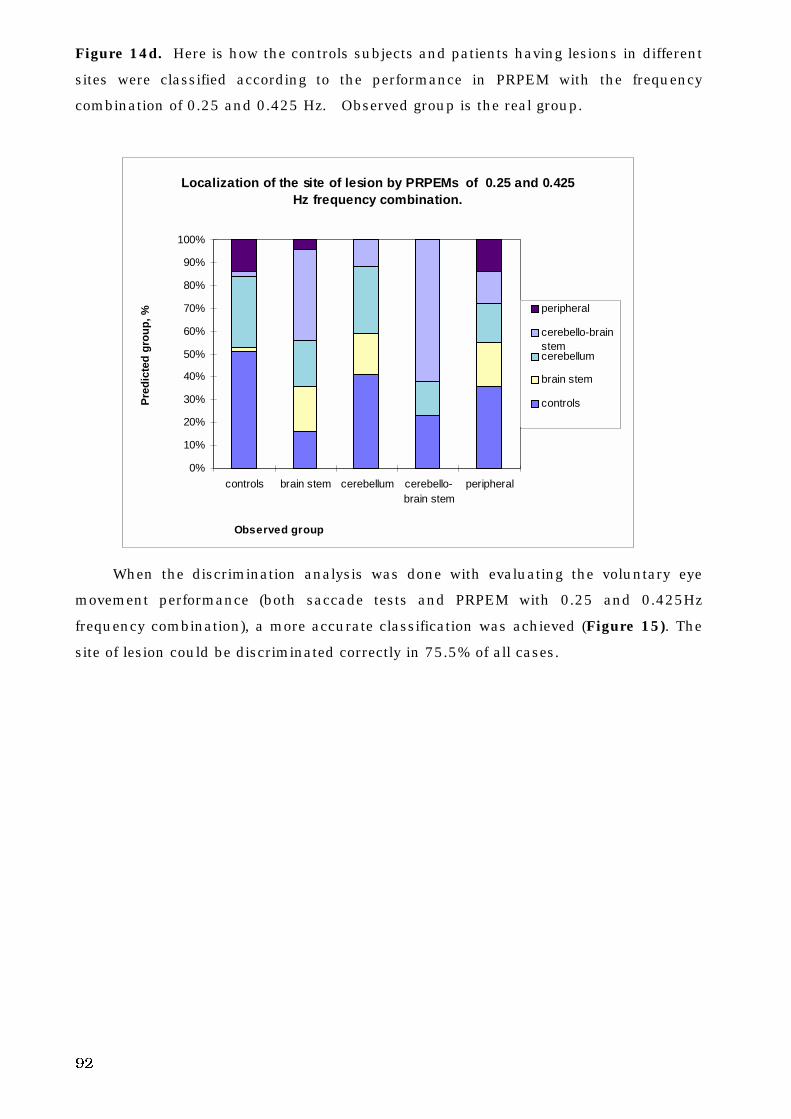
92
Figure 14d. Here is how the controls subjects and patients having lesions in different
sites were classified according to the performance in PRPEM with the frequency
combination of 0.25 and 0.425 Hz. Observed group is the real group.
Localization of the site of lesion by PRPEMs of 0.25 and 0.425
Hz frequency combination.
0%
10%
20%
30%
40%
50%
60%
70%
80%
90%
100%
controls brain stem cerebellum cerebello-brain stem
peripheral
Observed group
Pre
dic
ted
gro
up
, %
peripheral
cerebello-brainstemcerebellum
brain stem
controls
When the discrimination analysis was done with evaluating the voluntary eye
movement performance (both saccade tests and PRPEM with 0.25 and 0.425Hz
frequency combination), a more accurate classification was achieved (Figure 15). The
site of lesion could be discriminated correctly in 75.5% of all cases.
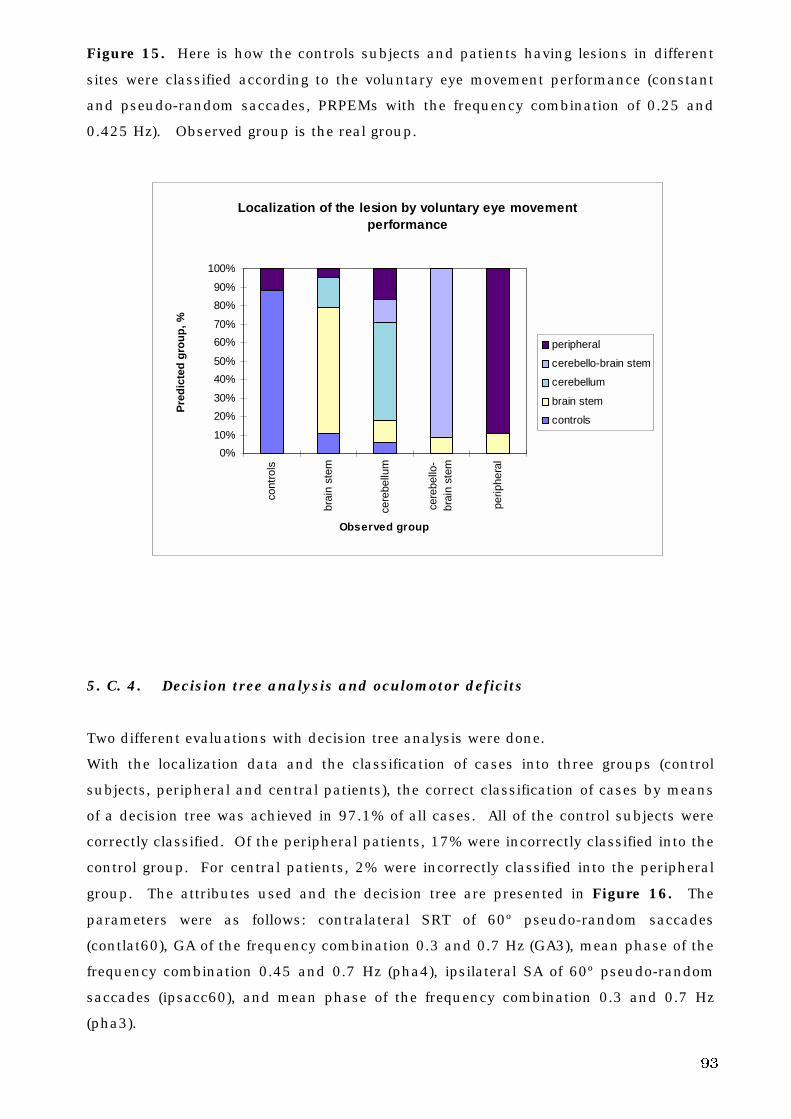
93
Figure 15. Here is how the controls subjects and patients having lesions in different
sites were classified according to the voluntary eye movement performance (constant
and pseudo-random saccades, PRPEMs with the frequency combination of 0.25 and
0.425 Hz). Observed group is the real group.
Localization of the lesion by voluntary eye movement performance
0%
10%
20%
30%
40%
50%
60%
70%
80%
90%
100%co
ntro
ls
brai
n st
em
cere
bellu
m
cere
bello
-br
ain
stem
perip
hera
l
Observed group
Pre
dic
ted
gro
up
, %
peripheral
cerebello-brain stem
cerebellum
brain stem
controls
5. C. 4. Decision tree analysis and oculomotor deficits
Two different evaluations with decision tree analysis were done.
With the localization data and the classification of cases into three groups (control
subjects, peripheral and central patients), the correct classification of cases by means
of a decision tree was achieved in 97.1% of all cases. All of the control subjects were
correctly classified. Of the peripheral patients, 17% were incorrectly classified into the
control group. For central patients, 2% were incorrectly classified into the peripheral
group. The attributes used and the decision tree are presented in Figure 16. The
parameters were as follows: contralateral SRT of 60º pseudo-random saccades
(contlat60), GA of the frequency combination 0.3 and 0.7 Hz (GA3), mean phase of the
frequency combination 0.45 and 0.7 Hz (pha4), ipsilateral SA of 60º pseudo-random
saccades (ipsacc60), and mean phase of the frequency combination 0.3 and 0.7 Hz
(pha3).
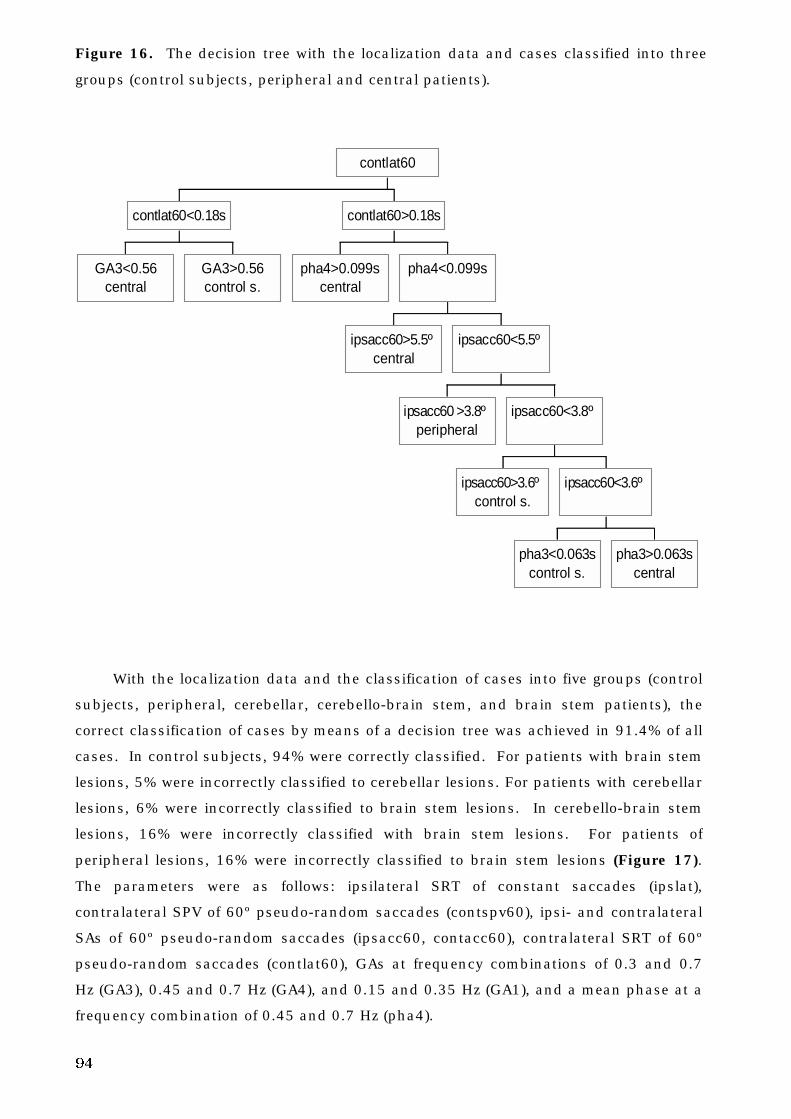
94
Figure 16. The decision tree with the localization data and cases classified into three
groups (control subjects, peripheral and central patients).
GA3<0.56central
GA3>0.56control s.
contlat60<0.18s
pha4>0.099scentral
ipsacc60>5.5ºcentral
ipsacc60 >3.8ºperipheral
ipsacc60>3.6ºcontrol s.
pha3<0.063scontrol s.
pha3>0.063scentral
ipsacc60<3.6º
ipsacc60<3.8º
ipsacc60<5.5º
pha4<0.099s
contlat60>0.18s
contlat60
With the localization data and the classification of cases into five groups (control
subjects, peripheral, cerebellar, cerebello-brain stem, and brain stem patients), the
correct classification of cases by means of a decision tree was achieved in 91.4% of all
cases. In control subjects, 94% were correctly classified. For patients with brain stem
lesions, 5% were incorrectly classified to cerebellar lesions. For patients with cerebellar
lesions, 6% were incorrectly classified to brain stem lesions. In cerebello-brain stem
lesions, 16% were incorrectly classified with brain stem lesions. For patients of
peripheral lesions, 16% were incorrectly classified to brain stem lesions (Figure 17).
The parameters were as follows: ipsilateral SRT of constant saccades (ipslat),
contralateral SPV of 60º pseudo-random saccades (contspv60), ipsi- and contralateral
SAs of 60º pseudo-random saccades (ipsacc60, contacc60), contralateral SRT of 60º
pseudo-random saccades (contlat60), GAs at frequency combinations of 0.3 and 0.7
Hz (GA3), 0.45 and 0.7 Hz (GA4), and 0.15 and 0.35 Hz (GA1), and a mean phase at a
frequency combination of 0.45 and 0.7 Hz (pha4).
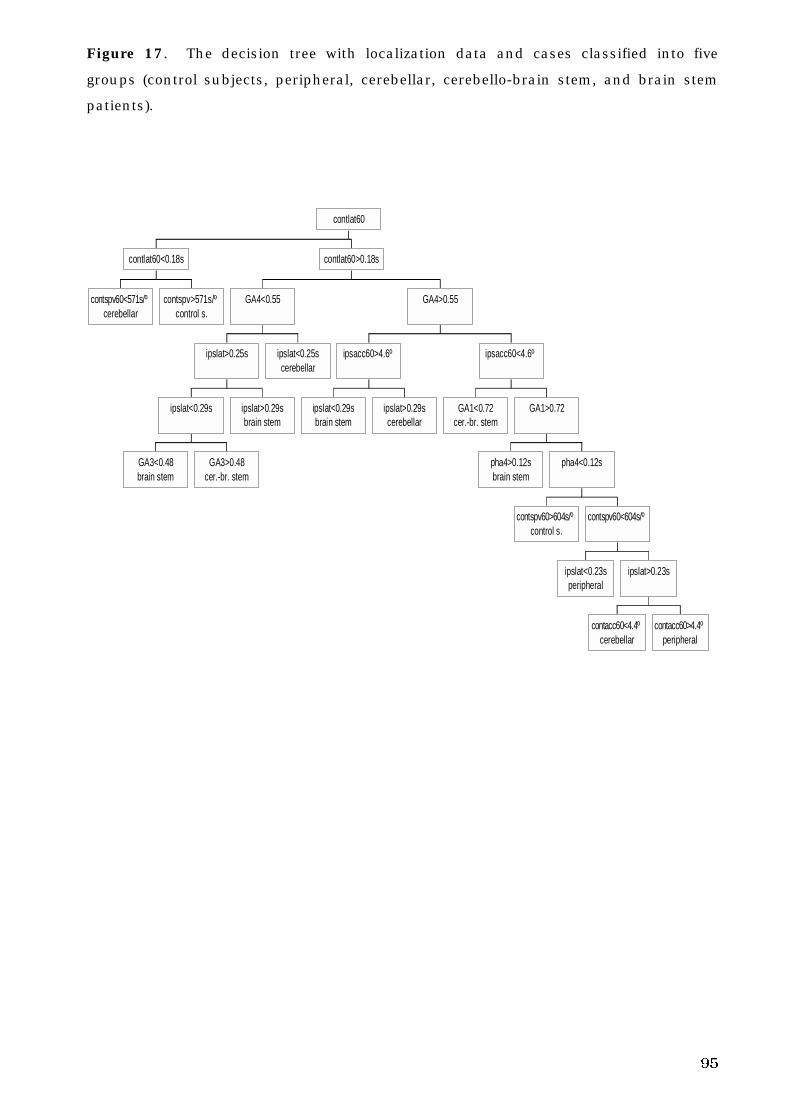
95
Figure 17. The decision tree with localization data and cases classified into five
groups (control subjects, peripheral, cerebellar, cerebello-brain stem, and brain stem
patients).
contspv60<571s/ºcerebellar
contspv>571s/ºcontrol s.
contlat60<0.18s
GA3<0.48brain stem
GA3>0.48cer.-br. stem
ipslat<0.29s ipslat>0.29sbrain stem
ipslat>0.25s ipslat<0.25scerebellar
GA4<0.55
ipslat<0.29sbrain stem
ipslat>0.29scerebellar
ipsacc60>4.6º
GA1<0.72cer.-br. stem
pha4>0.12sbrain stem
contspv60>604s/ºcontrol s.
ipslat<0.23speripheral
contacc60<4.4ºcerebellar
contacc60>4.4ºperipheral
ipslat>0.23s
contspv60<604s/º
pha4<0.12s
GA1>0.72
ipsacc60<4.6º
GA4>0.55
contlat60>0.18s
contlat60
96
6. D I S C U S S I O N
6. 1. General comments
In line with other researchers, the present study demonstrates that maturation
followed by degeneration of voluntary eye movements appears to be a continuous
process, taking place throughout life. Gender has only a small effect on voluntary eye
movement performance. In patients with Menière’s disease, the lesion is peripheral,
but in severe Menière’s disease the CNS (Löchen 1977; Sörensen et al. 1977) and
central vestibular control systems may be compromised, so the voluntary eye
movement system might also be impaired.
The literature indicates that single voluntary eye movement tests have been
demonstrated to be effective in diagnosing the disease causing vertigo and in
evaluating the site of lesion causing vertigo (Allum et al. 1991; Wennmo 1983; Schalén
et al. 1982; Henriksson et al: 1981). In the present study, voluntary eye movement
performance was effective in diagnosing lesion site if used in conjunction with a
decision tree analysis. However, there is a contributing factor to the difference
between the findings of this study and previous studies regarding the utility of single
voluntary eye movement tests. Patients in the present study had chronic and large
lesions, rather than acute and restricted lesions (Wennmo 1983; Schalén et al. 1982;
Henriksson et al 1981).
The oculomotor dysfunction in the present study can best be interpreted as a
timing error of the voluntary eye movements found in patients with different diseases
and different lesions. This timing error correlated with the severity of disease, as has
been documented previously in faulty nystagmus among patients with central lesions
(Dahlen 1983)
6. 2. Voluntary eye movements in normal subjects
The amount of hypometry in saccades in this study was similar to findings of Becker
and Fuchs (1969) and Weber and Daroff (1971). The SRTs of this study are consistent
with the previous findings of Stark et al. (1962), and Robinson (1981).
The values of SPV with constant saccades of 60º amplitude and pseudo-random
saccades of 20º and 60º amplitude were somewhat higher than the SPV values of
Wennmo et al. (1981) and Schalén (1981). These differences reflect the algorithms
used to calculate SPV, and thus confirm the findings of Bahill et al. (1981).
In the present work, SA and the SPV were significantly affected by the amplitude
of the saccade, confirming the results of Zuber et al. (1965), Weber and Daroff (1971),
Schmidt et al. (1979), Warabi et al. (1984) and Lemij and Collewijn (1989).
97
In control subjects and some patient groups, the PRPEMs with different
frequency combinations demonstrated a similar pattern. The GA and the mean phase
reduced with rising frequency combinations.
When the target motion consists of a small number of sinusoids (4 or less), the
spectrum of tracking eye movements contains only those frequencies present in the
stimulus (St-Cyr and Fender 1969). But as the spectral content of the target motion
increases (e.g., 7 or 13 frequencies), the response of the pursuit system demonstrates
greater errors, including reduced gain and increased phase lag (St-Cyr and Fender
1969). St-Cyr and Fender (1969) also found that when target motion consists of a
small number of sinusoids, the pursuit system responds preferentially to the highest
frequency present. Therefore, if a subject attempts to follow a target whose motion
may be described as a sum of two components which are close in frequency, the
subjects respond preferentially to the higher one, at the expense of the lower one (St-
Cyr and Fender 1969). These findings are in line with the results of Barnes et al.
(1987) and Isotalo et al. (1992). The findings of the present study confirm previous
works. In this work, there were no significant differences in GA and mean phase
between the frequency combinations of 0.3 and 0.7 Hz and 0.45 and 0.7 Hz. The
higher frequency combination seemed to be preferentially affected.
The amount of phase lead and phase lag in PEMs varies according to the extent
of predictability of the stimulus (Stark et al 1962; Young and Stark 1963; Michael and
Melvill Jones 1966). However, according to the study by Kowler and Steinman (1981),
even when target motion cannot be predicted at all, human subjects will produce some
anticipatory PEMs. Predictable stimuli usually cause phase leads. The amount of
phase lead diminishes, and the size of phase lag increases with increasing
unpredictability (Fuchs 1967b; Stark et al 1962; Michael and Melvill Jones 1966). In
addition, the increasing stimulus frequency increases the size of phase lag (º) (Michael
and Melvill Jones 1966). In this work, mean phase (s) was shortened significantly
with increasing frequency combination.
The gain of the oculomotor tracking system decreases with increasing frequency
(St-Cyr and Fender 1969). There is a general trend towards diminishing gain as the
complexity of target motion increases from simple sinusoidal movements via sums of
sinusoids (Stark et al. 1962) to band-limited white/Gaussian noise (Dallos and Jones
1963; Michael and Melvill Jones 1966). The more predictable the target motion is, the
more accurately it can be traced (Michael and Melvill Jones 1966; Larsby et al. 1988).
The ability of the visual tracking system to maintain fixation is a function of the
predictability of the stimulus, as well as a function of its frequency and amplitude
(Michael and Melvill Jones 1966). The GA was significantly affected by frequency
combination, reducing with increasing frequency combination, which coincides with
previous studies (Michael and Melvill Jones 1966; St-Cyr and Fender 1969).
98
6. 3. Age and the oculomotor system
The accuracy of saccadic function continually improves through maturity to middle
age. In the present work, it was observed that SA60°s in constant and pseudo-random
saccades and SA20° in pseudo-random saccades were the best in the middle-age
group. These findings are in line with those of Sharpe and Zackon (1987) and
Tedeschi et al. (1989), but contradictory to those of Moschner and Baloh (1994).
However, Moschner and Baloh (1994) found a tendency towards hypometric saccades
in some older subjects when compared to younger subjects, and the older subjects
had greater intrasubject variability in accuracy measurements than the younger
subjects. Age distribution was different in their study when compared to the present
study.
SRTs have also been found to be the shortest in middle-aged subjects when
compared with elderly or younger subjects (Miller 1969; Spooner et al. 1980; Carter et
al. 1983; Abel et al. 1983; Warabi et al. 1984; Whitaker et al. 1986; Hutton and Pallet
1986; Sharpe and Zackon 1987; Tedeschi et al. 1989; Moschner and Baloh 1994). In
this work, none of the SRTs in constant or pseudo-random saccades showed any
statistically significant differences between the various age groups. However, in
pseudo-random saccades with SRT20°, the best performance was found in the middle-
age group, which warrants further study. In the studies of Whitaker et al. (1986),
Carter et al. (1983), Spooner et al. (1980) and Abel et al. (1983), there were few older
subjects tested. In a study by Miller (1969), there was a small amount of children and
teenagers tested, and Warabi et al. (1984) had only a small amount of young adults
(19-26 years) participating in their study. In the study by Moschner and Baloh (1994),
only a small amount of middle-aged adults were tested. The total amount of tested
subjects was small in studies by Hutton and Palet (1986) and Sharpe and Zackon
(1987). Most of the above mentioned studies regarding age-related changes in
saccadic performance center on middle-aged and elderly subjects, or children,
teenagers and middle-aged subjects.
Age factors can explain the difference between results of this work and previous
studies. However, conclusions are hampered in these studies because of a narrow
sample of subjects. As in the study of Tedeschi et al. (1989), where the age range was
15-75 years, children were not included. In their study, the number of subjects tested
was large, but the target displacements in saccades were different between this and
previous studies mentioned above. Additionally, in none of these studies was saccadic
amplitude of 60º included, and in some studies the largest amplitudes were 40º
(Tedeschi et al. 1989; Sharpe and Zackon 1987; Warabi et al. 1984). That may affect
the results of these works in SRTs.
The SPV has been found to be lower in elderly subjects than in middle-aged
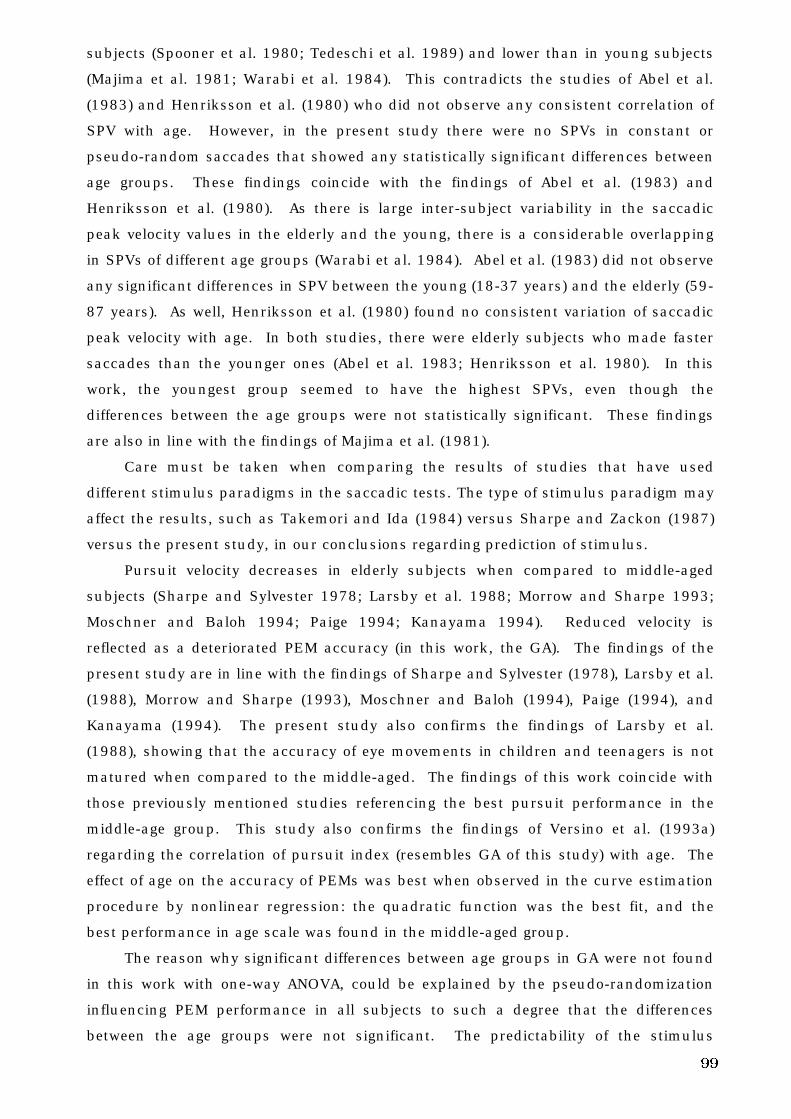
99
subjects (Spooner et al. 1980; Tedeschi et al. 1989) and lower than in young subjects
(Majima et al. 1981; Warabi et al. 1984). This contradicts the studies of Abel et al.
(1983) and Henriksson et al. (1980) who did not observe any consistent correlation of
SPV with age. However, in the present study there were no SPVs in constant or
pseudo-random saccades that showed any statistically significant differences between
age groups. These findings coincide with the findings of Abel et al. (1983) and
Henriksson et al. (1980). As there is large inter-subject variability in the saccadic
peak velocity values in the elderly and the young, there is a considerable overlapping
in SPVs of different age groups (Warabi et al. 1984). Abel et al. (1983) did not observe
any significant differences in SPV between the young (18-37 years) and the elderly (59-
87 years). As well, Henriksson et al. (1980) found no consistent variation of saccadic
peak velocity with age. In both studies, there were elderly subjects who made faster
saccades than the younger ones (Abel et al. 1983; Henriksson et al. 1980). In this
work, the youngest group seemed to have the highest SPVs, even though the
differences between the age groups were not statistically significant. These findings
are also in line with the findings of Majima et al. (1981).
Care must be taken when comparing the results of studies that have used
different stimulus paradigms in the saccadic tests. The type of stimulus paradigm may
affect the results, such as Takemori and Ida (1984) versus Sharpe and Zackon (1987)
versus the present study, in our conclusions regarding prediction of stimulus.
Pursuit velocity decreases in elderly subjects when compared to middle-aged
subjects (Sharpe and Sylvester 1978; Larsby et al. 1988; Morrow and Sharpe 1993;
Moschner and Baloh 1994; Paige 1994; Kanayama 1994). Reduced velocity is
reflected as a deteriorated PEM accuracy (in this work, the GA). The findings of the
present study are in line with the findings of Sharpe and Sylvester (1978), Larsby et al.
(1988), Morrow and Sharpe (1993), Moschner and Baloh (1994), Paige (1994), and
Kanayama (1994). The present study also confirms the findings of Larsby et al.
(1988), showing that the accuracy of eye movements in children and teenagers is not
matured when compared to the middle-aged. The findings of this work coincide with
those previously mentioned studies referencing the best pursuit performance in the
middle-age group. This study also confirms the findings of Versino et al. (1993a)
regarding the correlation of pursuit index (resembles GA of this study) with age. The
effect of age on the accuracy of PEMs was best when observed in the curve estimation
procedure by nonlinear regression: the quadratic function was the best fit, and the
best performance in age scale was found in the middle-aged group.
The reason why significant differences between age groups in GA were not found
in this work with one-way ANOVA, could be explained by the pseudo-randomization
influencing PEM performance in all subjects to such a degree that the differences
between the age groups were not significant. The predictability of the stimulus
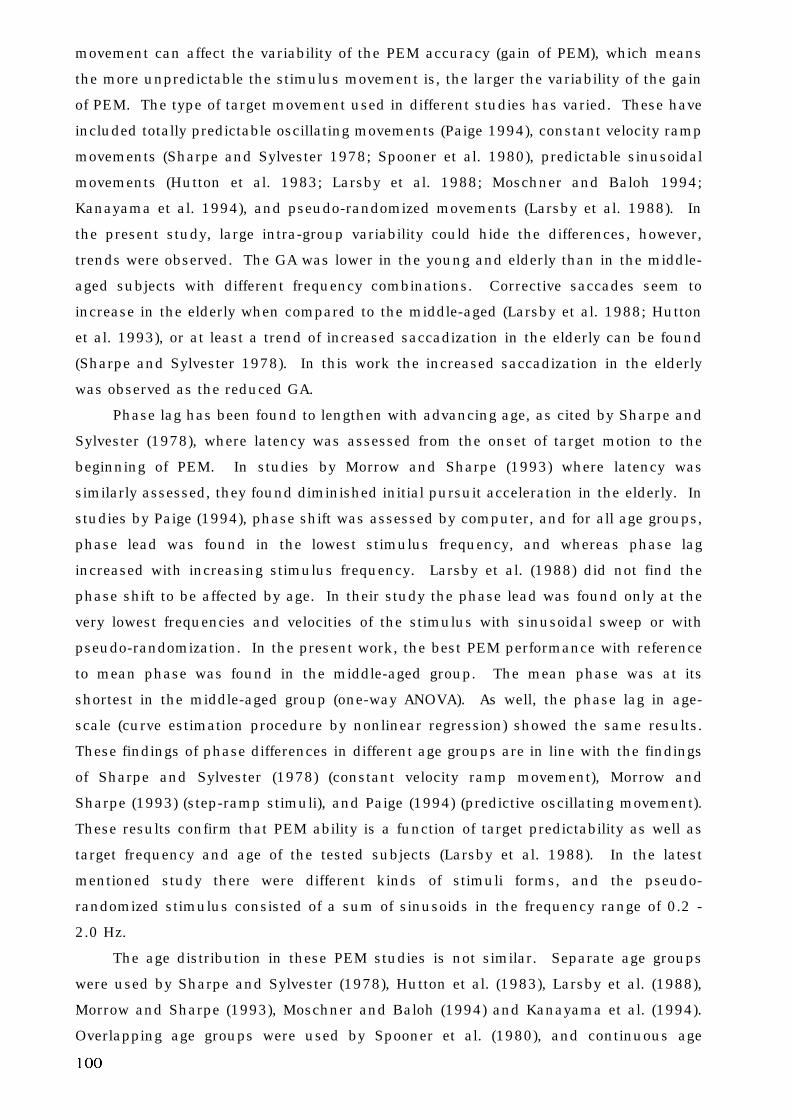
100
movement can affect the variability of the PEM accuracy (gain of PEM), which means
the more unpredictable the stimulus movement is, the larger the variability of the gain
of PEM. The type of target movement used in different studies has varied. These have
included totally predictable oscillating movements (Paige 1994), constant velocity ramp
movements (Sharpe and Sylvester 1978; Spooner et al. 1980), predictable sinusoidal
movements (Hutton et al. 1983; Larsby et al. 1988; Moschner and Baloh 1994;
Kanayama et al. 1994), and pseudo-randomized movements (Larsby et al. 1988). In
the present study, large intra-group variability could hide the differences, however,
trends were observed. The GA was lower in the young and elderly than in the middle-
aged subjects with different frequency combinations. Corrective saccades seem to
increase in the elderly when compared to the middle-aged (Larsby et al. 1988; Hutton
et al. 1993), or at least a trend of increased saccadization in the elderly can be found
(Sharpe and Sylvester 1978). In this work the increased saccadization in the elderly
was observed as the reduced GA.
Phase lag has been found to lengthen with advancing age, as cited by Sharpe and
Sylvester (1978), where latency was assessed from the onset of target motion to the
beginning of PEM. In studies by Morrow and Sharpe (1993) where latency was
similarly assessed, they found diminished initial pursuit acceleration in the elderly. In
studies by Paige (1994), phase shift was assessed by computer, and for all age groups,
phase lead was found in the lowest stimulus frequency, and whereas phase lag
increased with increasing stimulus frequency. Larsby et al. (1988) did not find the
phase shift to be affected by age. In their study the phase lead was found only at the
very lowest frequencies and velocities of the stimulus with sinusoidal sweep or with
pseudo-randomization. In the present work, the best PEM performance with reference
to mean phase was found in the middle-aged group. The mean phase was at its
shortest in the middle-aged group (one-way ANOVA). As well, the phase lag in age-
scale (curve estimation procedure by nonlinear regression) showed the same results.
These findings of phase differences in different age groups are in line with the findings
of Sharpe and Sylvester (1978) (constant velocity ramp movement), Morrow and
Sharpe (1993) (step-ramp stimuli), and Paige (1994) (predictive oscillating movement).
These results confirm that PEM ability is a function of target predictability as well as
target frequency and age of the tested subjects (Larsby et al. 1988). In the latest
mentioned study there were different kinds of stimuli forms, and the pseudo-
randomized stimulus consisted of a sum of sinusoids in the frequency range of 0.2 -
2.0 Hz.
The age distribution in these PEM studies is not similar. Separate age groups
were used by Sharpe and Sylvester (1978), Hutton et al. (1983), Larsby et al. (1988),
Morrow and Sharpe (1993), Moschner and Baloh (1994) and Kanayama et al. (1994).
Overlapping age groups were used by Spooner et al. (1980), and continuous age
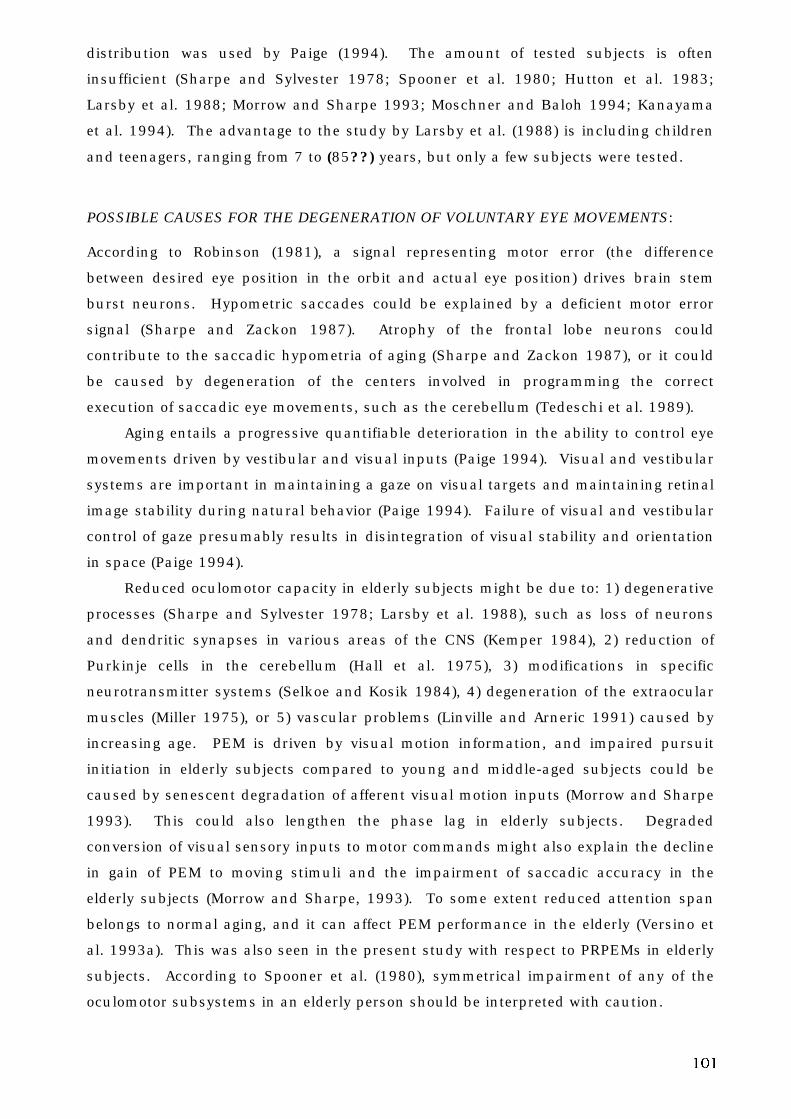
101
distribution was used by Paige (1994). The amount of tested subjects is often
insufficient (Sharpe and Sylvester 1978; Spooner et al. 1980; Hutton et al. 1983;
Larsby et al. 1988; Morrow and Sharpe 1993; Moschner and Baloh 1994; Kanayama
et al. 1994). The advantage to the study by Larsby et al. (1988) is including children
and teenagers, ranging from 7 to (85??) years, but only a few subjects were tested.
POSSIBLE CAUSES FOR THE DEGENERATION OF VOLUNTARY EYE MOVEMENTS:
According to Robinson (1981), a signal representing motor error (the difference
between desired eye position in the orbit and actual eye position) drives brain stem
burst neurons. Hypometric saccades could be explained by a deficient motor error
signal (Sharpe and Zackon 1987). Atrophy of the frontal lobe neurons could
contribute to the saccadic hypometria of aging (Sharpe and Zackon 1987), or it could
be caused by degeneration of the centers involved in programming the correct
execution of saccadic eye movements, such as the cerebellum (Tedeschi et al. 1989).
Aging entails a progressive quantifiable deterioration in the ability to control eye
movements driven by vestibular and visual inputs (Paige 1994). Visual and vestibular
systems are important in maintaining a gaze on visual targets and maintaining retinal
image stability during natural behavior (Paige 1994). Failure of visual and vestibular
control of gaze presumably results in disintegration of visual stability and orientation
in space (Paige 1994).
Reduced oculomotor capacity in elderly subjects might be due to: 1) degenerative
processes (Sharpe and Sylvester 1978; Larsby et al. 1988), such as loss of neurons
and dendritic synapses in various areas of the CNS (Kemper 1984), 2) reduction of
Purkinje cells in the cerebellum (Hall et al. 1975), 3) modifications in specific
neurotransmitter systems (Selkoe and Kosik 1984), 4) degeneration of the extraocular
muscles (Miller 1975), or 5) vascular problems (Linville and Arneric 1991) caused by
increasing age. PEM is driven by visual motion information, and impaired pursuit
initiation in elderly subjects compared to young and middle-aged subjects could be
caused by senescent degradation of afferent visual motion inputs (Morrow and Sharpe
1993). This could also lengthen the phase lag in elderly subjects. Degraded
conversion of visual sensory inputs to motor commands might also explain the decline
in gain of PEM to moving stimuli and the impairment of saccadic accuracy in the
elderly subjects (Morrow and Sharpe, 1993). To some extent reduced attention span
belongs to normal aging, and it can affect PEM performance in the elderly (Versino et
al. 1993a). This was also seen in the present study with respect to PRPEMs in elderly
subjects. According to Spooner et al. (1980), symmetrical impairment of any of the
oculomotor subsystems in an elderly person should be interpreted with caution.
102
6. 4. Gender and voluntary eye movements
Gender differences in voluntary eye movements has been studied by Becker and Fuchs
(1969), Sharpe and Sylvester (1978), Hutton et al. (1983), and Whitaker et al. (1986).
No important differences between genders could be found in any of the eye
movement tests in the present study. These results coincide with the results by
Sharpe and Sylvester (1978) and Whitaker et al. (1986). There seems to be no
difference in voluntary eye movements across genders.
There were some tendencies found in pseudo-random saccades; SPV20º tended
to be lower in females than in males (p<0.05). In SPVs of 60º saccades in pseudo-
random and constant saccades, females had lower values than males. In these cases,
the differences were not statistically or mildly significant. These findings could be the
result of early emphasis on childhood males to exercise tasks requiring rapidity and
fast reaction times. On the other hand, physical facts might play a role. These results
also coincide with the results of Hutton et al. (1983) who did not find any gender effect
in tracking eye movements. They did observe that tracking in elderly women was
somewhat poorer than in elderly men. They studied the PEMs, but it is reasonable
that these findings can also be observed in saccades.
According to Becker and Fuchs (1969), saccades in female subjects appear to be
faster than in males, which contradicts the findings of the present study. One needs
to take into account the possible inadequacy of their study design when explaining
these differences.
6. 5. Laterality and saccades
Differences between rightward and leftward saccades or PEMs have been analyzed by
Baloh et al. (1976), Carter et al. (1983), Meyer et al. (1985), Hutton and Pallet (1986),
van den Berg and Collewijn (1986), Versino and Cosi (1990), and Versino et al.
(1993a). In studying the diagnostic and localization value of voluntary eye
movements, the means of rightward and leftward SA, SRT and SPV were used as the
ipsilateral and contralateral parameters for control subjects.
Some studies have found differences between eye movements (right and left) in
saccades (Hutton and Pallet 1986) and in PEMs (Meyer et al. 1985); whereas many
others have not found any differences, either in saccades (Carter et al. 1983), or in
PEMs (Baloh et al. 1976; van den Berg and Collewijn 1986; Versino and Cosi 1990;
Versino et al. 1993a).
Hutton and Pallet (1986) found an asymmetry in SRTs for unpredictable
horizontal saccades in right-handers. Right-handers had shorter SRTs for rightward
than for leftward saccades, the directional differences for SRTs relating to motor or
central integrative processes. However, Carter et al. (1983) found no differences
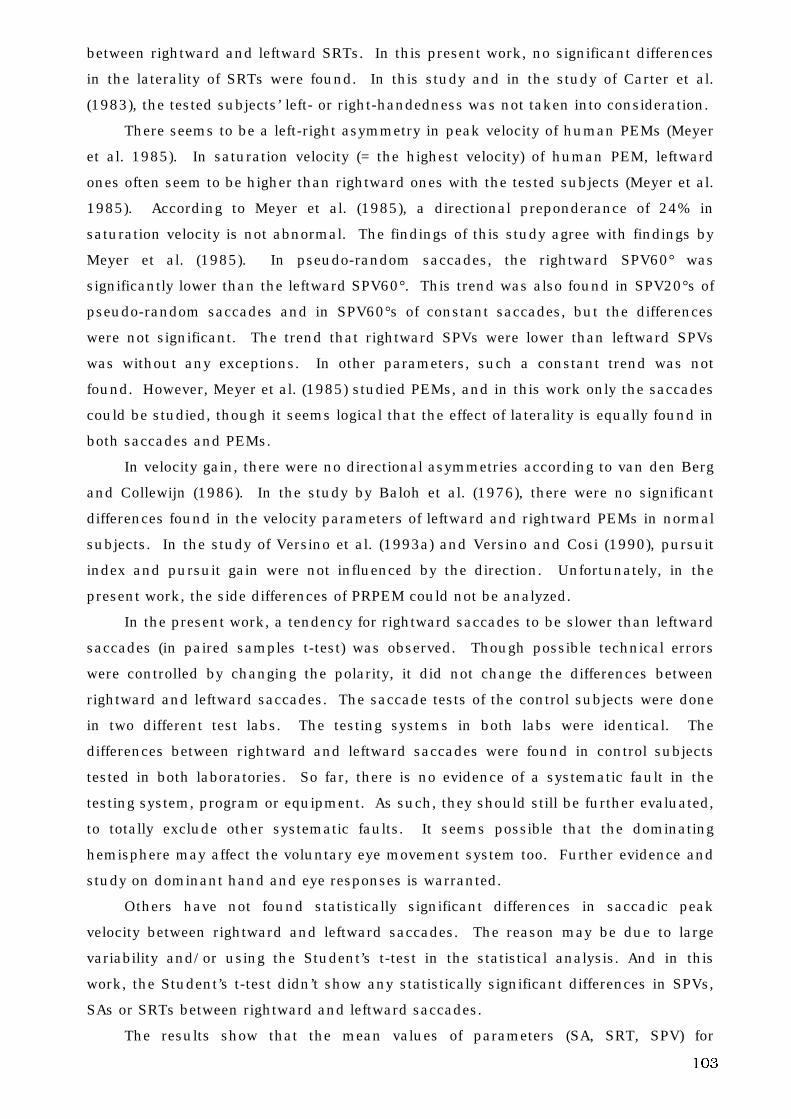
103
between rightward and leftward SRTs. In this present work, no significant differences
in the laterality of SRTs were found. In this study and in the study of Carter et al.
(1983), the tested subjects’ left- or right-handedness was not taken into consideration.
There seems to be a left-right asymmetry in peak velocity of human PEMs (Meyer
et al. 1985). In saturation velocity (= the highest velocity) of human PEM, leftward
ones often seem to be higher than rightward ones with the tested subjects (Meyer et al.
1985). According to Meyer et al. (1985), a directional preponderance of 24% in
saturation velocity is not abnormal. The findings of this study agree with findings by
Meyer et al. (1985). In pseudo-random saccades, the rightward SPV60° was
significantly lower than the leftward SPV60°. This trend was also found in SPV20°s of
pseudo-random saccades and in SPV60°s of constant saccades, but the differences
were not significant. The trend that rightward SPVs were lower than leftward SPVs
was without any exceptions. In other parameters, such a constant trend was not
found. However, Meyer et al. (1985) studied PEMs, and in this work only the saccades
could be studied, though it seems logical that the effect of laterality is equally found in
both saccades and PEMs.
In velocity gain, there were no directional asymmetries according to van den Berg
and Collewijn (1986). In the study by Baloh et al. (1976), there were no significant
differences found in the velocity parameters of leftward and rightward PEMs in normal
subjects. In the study of Versino et al. (1993a) and Versino and Cosi (1990), pursuit
index and pursuit gain were not influenced by the direction. Unfortunately, in the
present work, the side differences of PRPEM could not be analyzed.
In the present work, a tendency for rightward saccades to be slower than leftward
saccades (in paired samples t-test) was observed. Though possible technical errors
were controlled by changing the polarity, it did not change the differences between
rightward and leftward saccades. The saccade tests of the control subjects were done
in two different test labs. The testing systems in both labs were identical. The
differences between rightward and leftward saccades were found in control subjects
tested in both laboratories. So far, there is no evidence of a systematic fault in the
testing system, program or equipment. As such, they should still be further evaluated,
to totally exclude other systematic faults. It seems possible that the dominating
hemisphere may affect the voluntary eye movement system too. Further evidence and
study on dominant hand and eye responses is warranted.
Others have not found statistically significant differences in saccadic peak
velocity between rightward and leftward saccades. The reason may be due to large
variability and/or using the Student’s t-test in the statistical analysis. And in this
work, the Student’s t-test didn’t show any statistically significant differences in SPVs,
SAs or SRTs between rightward and leftward saccades.
The results show that the mean values of parameters (SA, SRT, SPV) for
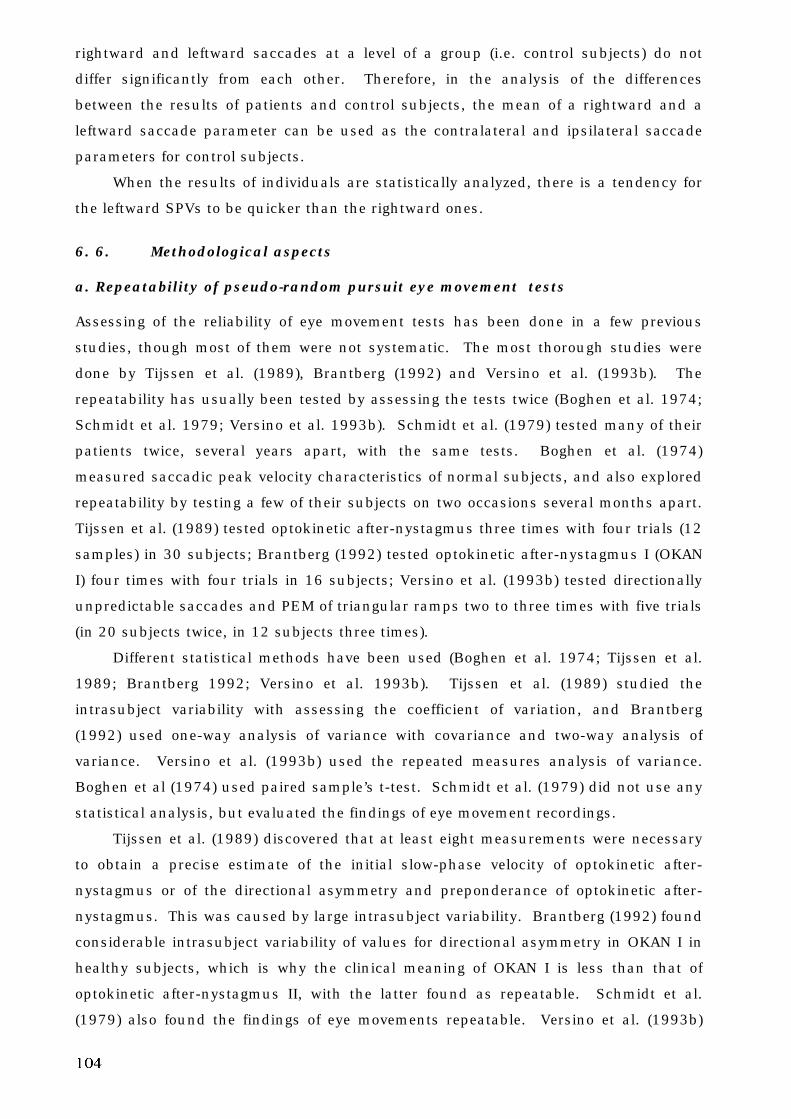
104
rightward and leftward saccades at a level of a group (i.e. control subjects) do not
differ significantly from each other. Therefore, in the analysis of the differences
between the results of patients and control subjects, the mean of a rightward and a
leftward saccade parameter can be used as the contralateral and ipsilateral saccade
parameters for control subjects.
When the results of individuals are statistically analyzed, there is a tendency for
the leftward SPVs to be quicker than the rightward ones.
6. 6. Methodological aspects
a. Repeatability of pseudo-random pursuit eye movement tests
Assessing of the reliability of eye movement tests has been done in a few previous
studies, though most of them were not systematic. The most thorough studies were
done by Tijssen et al. (1989), Brantberg (1992) and Versino et al. (1993b). The
repeatability has usually been tested by assessing the tests twice (Boghen et al. 1974;
Schmidt et al. 1979; Versino et al. 1993b). Schmidt et al. (1979) tested many of their
patients twice, several years apart, with the same tests. Boghen et al. (1974)
measured saccadic peak velocity characteristics of normal subjects, and also explored
repeatability by testing a few of their subjects on two occasions several months apart.
Tijssen et al. (1989) tested optokinetic after-nystagmus three times with four trials (12
samples) in 30 subjects; Brantberg (1992) tested optokinetic after-nystagmus I (OKAN
I) four times with four trials in 16 subjects; Versino et al. (1993b) tested directionally
unpredictable saccades and PEM of triangular ramps two to three times with five trials
(in 20 subjects twice, in 12 subjects three times).
Different statistical methods have been used (Boghen et al. 1974; Tijssen et al.
1989; Brantberg 1992; Versino et al. 1993b). Tijssen et al. (1989) studied the
intrasubject variability with assessing the coefficient of variation, and Brantberg
(1992) used one-way analysis of variance with covariance and two-way analysis of
variance. Versino et al. (1993b) used the repeated measures analysis of variance.
Boghen et al (1974) used paired sample’s t-test. Schmidt et al. (1979) did not use any
statistical analysis, but evaluated the findings of eye movement recordings.
Tijssen et al. (1989) discovered that at least eight measurements were necessary
to obtain a precise estimate of the initial slow-phase velocity of optokinetic after-
nystagmus or of the directional asymmetry and preponderance of optokinetic after-
nystagmus. This was caused by large intrasubject variability. Brantberg (1992) found
considerable intrasubject variability of values for directional asymmetry in OKAN I in
healthy subjects, which is why the clinical meaning of OKAN I is less than that of
optokinetic after-nystagmus II, with the latter found as repeatable. Schmidt et al.
(1979) also found the findings of eye movements repeatable. Versino et al. (1993b)
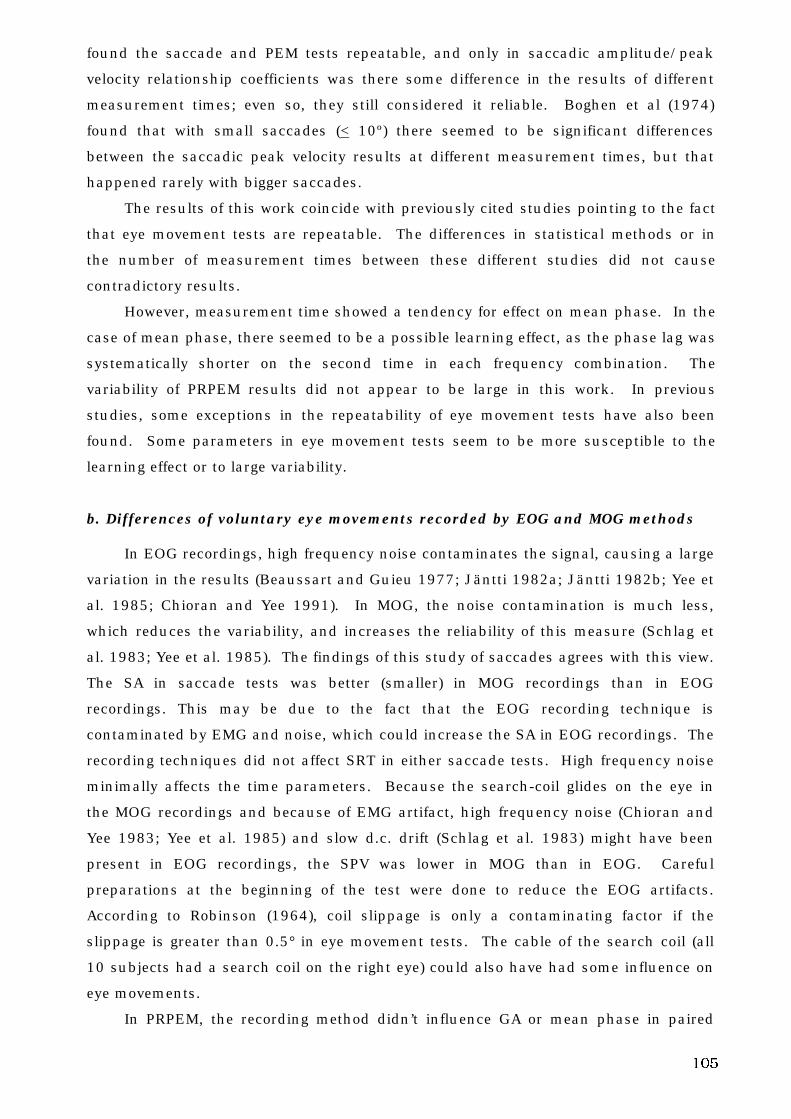
105
found the saccade and PEM tests repeatable, and only in saccadic amplitude/peak
velocity relationship coefficients was there some difference in the results of different
measurement times; even so, they still considered it reliable. Boghen et al (1974)
found that with small saccades (< 10º) there seemed to be significant differences
between the saccadic peak velocity results at different measurement times, but that
happened rarely with bigger saccades.
The results of this work coincide with previously cited studies pointing to the fact
that eye movement tests are repeatable. The differences in statistical methods or in
the number of measurement times between these different studies did not cause
contradictory results.
However, measurement time showed a tendency for effect on mean phase. In the
case of mean phase, there seemed to be a possible learning effect, as the phase lag was
systematically shorter on the second time in each frequency combination. The
variability of PRPEM results did not appear to be large in this work. In previous
studies, some exceptions in the repeatability of eye movement tests have also been
found. Some parameters in eye movement tests seem to be more susceptible to the
learning effect or to large variability.
b. Differences of voluntary eye movements recorded by EOG and MOG methods
In EOG recordings, high frequency noise contaminates the signal, causing a large
variation in the results (Beaussart and Guieu 1977; Jäntti 1982a; Jäntti 1982b; Yee et
al. 1985; Chioran and Yee 1991). In MOG, the noise contamination is much less,
which reduces the variability, and increases the reliability of this measure (Schlag et
al. 1983; Yee et al. 1985). The findings of this study of saccades agrees with this view.
The SA in saccade tests was better (smaller) in MOG recordings than in EOG
recordings. This may be due to the fact that the EOG recording technique is
contaminated by EMG and noise, which could increase the SA in EOG recordings. The
recording techniques did not affect SRT in either saccade tests. High frequency noise
minimally affects the time parameters. Because the search-coil glides on the eye in
the MOG recordings and because of EMG artifact, high frequency noise (Chioran and
Yee 1983; Yee et al. 1985) and slow d.c. drift (Schlag et al. 1983) might have been
present in EOG recordings, the SPV was lower in MOG than in EOG. Careful
preparations at the beginning of the test were done to reduce the EOG artifacts.
According to Robinson (1964), coil slippage is only a contaminating factor if the
slippage is greater than 0.5° in eye movement tests. The cable of the search coil (all
10 subjects had a search coil on the right eye) could also have had some influence on
eye movements.
In PRPEM, the recording method didn’t influence GA or mean phase in paired
106
samples t-test.
In PEMs, the recording method doesn’t have a significant effect on parameters
(GA, mean phase), but in saccades the effect on the parameters (SA and SPV) is
significant. It seems that PEMs are not as susceptible to high frequency noise as
saccades.
In the study of Schlag et al. (1983) the EOG recording method seemed to be less
accurate than the MOG method. However, they decided that with careful test
preparations, the EOG method could still be used in audiovestibular testing, especially
when testing horizontal eye movements.
The findings of the present study coincide with the findings of Schlag et al. (1983)
regarding horizontal saccades. Interestingly, it was discovered that PEMs are resistant
to the effect of the recording method.
The disadvantage of the MOG method (i.e., the inconvenience it causes to the
subject) restricts its use in routine tests. Some subjects had significant endothelial
edema caused by hypoxia under the thick scleral annulus, and some corneal epithelial
erosion was also noticed. No long standing changes could be seen. The MOG
recordings are not totally free from artifacts (Schlag et al. 1983). Scleral coils can
often obstruct the visual field of tested subjects (Schlag et al. 1983), and using scleral
coils in recording eye movements requires more cooperation from the tested subjects
than does the EOG method (Yee et al., 1985).
The EOG method in recording voluntary eye movements is more convenient than
the MOG method, and the EOG method is accurate enough in assessing eye
movements on a horizontal plane in clinical practice (Schlag et al. 1983). The
advantages of EOG over the MOG method are its simplicity, convenience and lower
costs. The EOG recording method is also preferable in assessing voluntary eye
movements in clinical work.
6. 7. Physiological aspects
a. Prediction of stimulus and saccadic eye movements
Takemori and Ida (1984) found that the ability to predict movement of the target has
minor effects on saccade parameters. Still, the saccadic peak velocity tended to be
faster and the SRT longer in predictive saccades than in non-predictive saccades. In
the study of Takemori and Ida (1984), the saccadic amplitudes and stimulus
frequency were much smaller than in the present study. That could explain why they
didn’t find any differences between the predictive and non-predictive saccades.
In the study by Miller (1969), the ability to predict target movement had a slight
tendency to affect the SRT. In his study, only saccades with small amplitudes were
studied.
107
In the study by Whitaker et al. (1986), the ability to predict target movement
(predictable vs. non-predictable saccades) did not affect SRTs. But in their study, the
stimulus movements were only ± 2.8º, and in non-predictable saccades only the side
of stimulus movement was non-predictable. In predictable saccades, prior knowledge
of the target’s side was also given. These facts could have affected their results so that
the predictability vs. nonpredictability of stimulus did not affect the SRTs in their
study.
Sharpe and Zackon (1987) have studied the differences between non-predictable
and predictable saccades, and their findings were confirmed by the findings of the
present work concerning its healthy subjects. In the study by Sharpe and Zackon
(1987), SRTs were affected to some degree; the non-predictable saccades had shorter
SRTs than the totally predictable saccades. In this work, the SRT was shorter in
pseudo-random saccades when compared to the constant saccades. Neither in this
work nor the work of Sharpe and Zackon (1987) were the SPVs significantly affected
by the predictability. Still, in both studies, the saccadic peak velocity was higher in
non-predictable than predictable saccades. According to Sharpe and Zackon (1987),
saccadic accuracy was affected by predictability, the accuracy being worse in non-
predictable saccades. In this work, the SA was more inaccurate in pseudo-random
saccades when compared to constant saccades.
These studies show that one must be careful when comparing the results of
different studies with different kinds of saccade stimuli. In general, the prediction of
saccadic stimulus seems to have some effect on saccadic parameters.
With the present study, in other patient groups except those with Menière’s
disease, the ability to predict saccades was about the same as in control subjects. The
reason for a shortage of prediction of voluntary eye movements may be linked to
enhanced visual motion perception in Menière patients (Pyykkö et al 1994a).
The eye movement defects that are caused by several diseases and disorders can
best be seen in movements of larger amplitudes (Pyykkö and Schalén 1982). For this
reason as constant and pseudo-random saccades of 60° amplitudes were used in the
current investigation. It is not clear whether it is necessary to assess saccades of 20º
or 60º. The overall performance of saccades is more important for providing useful
information.
b. Effect of different frequency combinations on pseudo-random pursuit eye
movements
In this work, the GA decreased and the mean phase shortened with the increasing
frequency combination of PRPEM. This is in line with the findings of Michael and
Melvill Jones (1966) and St-Cyr and Fender (1969).
108
Control subjects and patients of the operated CPA and HAB tumors, and those
with infarction of cerebello-brain stem, had the same profile where the effect of
increasing frequency combinations on GA and mean phase (i.e., the accuracy and
timing of the PRPEM) was concerned. This profile is therefore, preserved in many
diseases causing vertigo.
The different frequency combinations can best be evaluated with profile analysis
of frequency combinations.
6. 8. Voluntary eye movements and the severity of the disease in patients
with:
a. Menière’s disease
According to Schalén et al. (1982), the saccadic system is normal in patients with
peripheral vestibular disorders despite the presence of spontaneous nystagmus. In
PEMs, the frequency and amplitude of superimposed saccades show a small but
distinct increase in the direction of fast phase of nystagmus (Schalén et al. 1982;
Pyykkö and Schalén 1984). In this study, patients with moderately severe or severe
Menière’s disease had distinctly increased SRTs of constant and pseudo-random
saccades, decreased SPVs of constant and pseudo-random saccades, and reduced GA
of PRPEM, when compared to control subjects.
Differences may be due to the severity of disease. Since oculomotor activities
may vary due to the stage and activity of Menière’s disease, patients with advanced
severity were chosen to participate in the study. Results of this work reflect findings
typical of patients with severe Menière’s disease, including: deficits of voluntary eye
movements, correlation of clinical symptoms and oculomotor pathology, and the
discrimination analysis among the different groups.
According to this work, a pure vestibular lesion (with advanced severity) can
cause disorders of voluntary eye movements. This work shows that the vestibular
system can affect the voluntary eye movement system, at least in some cases, and
naturally, central lesions cause more advanced disorders of voluntary eye movements.
In this study, both PEMs and saccades were affected. The inadequacy of the PEM
and saccadic systems reflected an error in the time process (= timing) for patients with
severe Menière’s disease. This was reflected in the lengthened SRT and the decreased
SPV of constant and pseudo-random saccades. In PRPEM, this error in timing was
reflected in reduced GA. The error in timing caused an increased saccadization of
PRPEM, and that caused the reduction of GA, confirming previous observations by
Pyykkö and Schalén (1984). It seems that corrective saccades are increased greatly in
patients with severe and active disease, and that increased saccadization is reflected
in the GA results. All neural processes are controlled by time.
109
In this work, the error of timing with reference to mean phase was not observed
in patients with Menière’s disease. Saccades compensated the total eye tracking. As
this saccadic compensation of PEM operated in a proper timeframe, no lengthening of
phase lag was observed. Still, there might be lengthening in the pre-motor processing
of information required for the programming of eye movements. The misleading
information derived from the lesioned vestibular system would cause the lengthening
in the premotor processing, and that could also affect the oculomotor system. The
lengthening in the premotor processing of information would cause saccadization of
PEMs.
Visual information, although good for recalibrating the faulty vestibular system,
may be misleading if the vestibular loss is fluctuant and causes repeatable attacks
(Pyykkö et al. 1994a). According to Pyykkö et al. (1994a), the dominance of the visual
system may lead to dysfunctions where movements of the visual frame can cause
postural illusions. Clinically, patients with Menière’s disease have complaints in their
ability to watch TV, drive a car, etc. This visual “overruling” in moving visual
surrounding causes “postural vection” and indicates a distrust of the central postural
system on vestibular detectors of the inner ear (Pyykkö et al. 1994a). If there is a
mismatch between the visual information and the information coming from the
affected vestibular system as in Menière’s disease, it could result in the timing error
found in this work.
As far as the author can ascertain, there are no previous studies about voluntary
eye movements and clinical symptoms in Menière’s disease.
In this work, lengthened SRTs and lowered SPV as well as reduced GA of PRPEM
were associated with symptoms and findings reflecting the severity and intractability of
Menière’s disease (poor hearing level, severe Tumarkin attacks, severe tinnitus, poor
working capacity, severe rotatory vertigo attacks or severe unsteadiness during attack-
free periods), and with aging.
b. Operated cerebello-pontine angle tumor
In large vestibular schwannomas, saccadic dysmetria (Nedzelski 1983; Mrazek 1989;
Hulshof et al. 1989) can be found. But according to Selesnick and Jackler (1992),
large vestibular schwannoma tumors don’t always manifest any oculomotor
abnormalities. Saccadic eye movements are usually unaffected by CPA tumors (Baloh
et al. 1977). Saccadic peak velocity has been found to be normal, according to Baloh
et al. (1977) and Nedzelski (1983). In this work, operated CPA tumor patients had
poorer performance in saccades than control subjects, especially in SRTs and often in
SPVs. Sometimes, the SA was also disturbed in operated CPA tumor patients.
In large vestibular schwannomas, saccadization of PEM (Nedzelski 1983; Hulshof
110
et al. 1989; Selesnick and Jackler 1992) and deficits in PEM (Baloh et al. 1977) can be
found. Patients with brain stem compression by CPA tumors have significant slowing
of eye velocity of PEM (Baloh et al. 1976). Patients with peripheral vestibular lesions
and patients with small vestibular schwannomas have normal velocity parameters of
PEM (Baloh et al. 1976). In this work, the operated CPA tumor patients had poorer
performance in GA and mean phase than control subjects.
The results of this work confirm the results of previous studies about saccade
and PEM deficits. In this study, however, the deficits in saccades were not restricted
to dysmetria; the oculomotor pathology in operated CPA tumor patients was the most
profound in SRTs and could be found in some SPV results. The timing of saccades in
operated CPA tumor patients is deteriorated. And the pathology found in some SPV
results may refer to cases where the compression of brain stem by a large tumor has
affected the SPV performance. This is in line with the findings of Baloh et al. (1976).
The error in timing also deteriorates the SPV. The saccadization of PEMs found in
previous studies is reflected in the reduced GAs of PRPEM in this work. Slowing of eye
velocity of PEMs in large CPA tumors found by Baloh et al. (1976) is reflected via the
saccadization of PEMs to the reduced GAs. The disorders of timing are also found in
PRPEM phase performance; the mean phase is lengthened in operated CPA tumor
patients.
Both the saccades and PEMs have errors of timing in operated CPA tumor
patients. The error of timing is more profound in operated CPA tumor patients than of
patients with Menière’s disease. In this work, the diameter of CPA tumors had ranged
from 7 to 60 mm (mean 32.4 mm), so tumors had been relatively large and
compression of brain stem had occurred in many cases. Therefore, the compression
by the CPA tumor itself, not just the tumor surgery, has resulted in lesions to the
oculomotor system in the brain stem of many of these patients. Further studies are
needed to confirm which of these two factors is more important; the compression
caused by the CPA tumor or the tumor surgery.
Based on saccade tests, no side differences of pathological process could be
made. An injury in the brain stem during surgery of CPA tumors may lead to a
deteriorated ipsilateral saccadic performance. According to Rosenberg et al. (1993)
and Selesnick et al. (1993), the compression of brain stem and cerebellum begins if
the diameter of CPA tumor exceeds 20 mm. In large CPA tumors, the flocculus and
the nodulus can be compressed by the tumor (Selesnick and Jackler 1992).
Compression of these structures can cause oculomotor pathology. According to
Selesnick and Jackler (1992), CPA tumors compressing the brain stem cause
ipsilateral lesions first, but when the tumor is very large, lesions in the contralateral
side can be found, too (Selesnick and Jackler 1992). This could explain why the
oculomotor pathology was not restricted only to the ipsilateral parameters. In
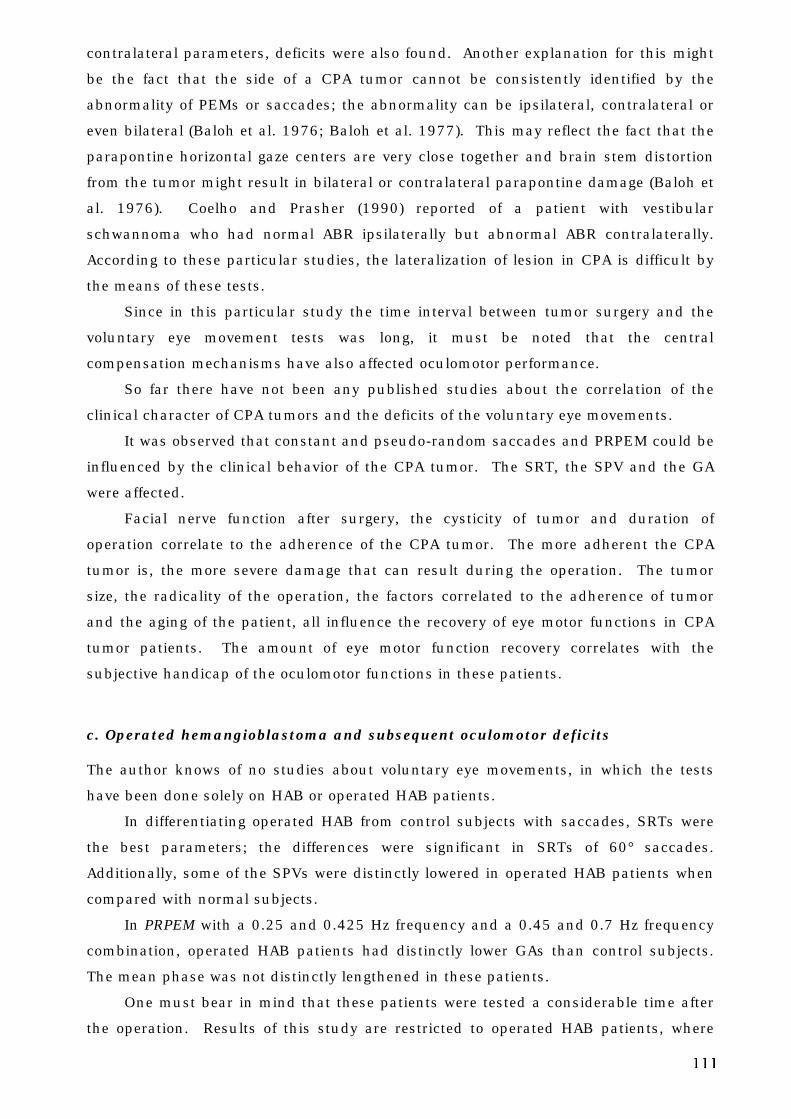
111
contralateral parameters, deficits were also found. Another explanation for this might
be the fact that the side of a CPA tumor cannot be consistently identified by the
abnormality of PEMs or saccades; the abnormality can be ipsilateral, contralateral or
even bilateral (Baloh et al. 1976; Baloh et al. 1977). This may reflect the fact that the
parapontine horizontal gaze centers are very close together and brain stem distortion
from the tumor might result in bilateral or contralateral parapontine damage (Baloh et
al. 1976). Coelho and Prasher (1990) reported of a patient with vestibular
schwannoma who had normal ABR ipsilaterally but abnormal ABR contralaterally.
According to these particular studies, the lateralization of lesion in CPA is difficult by
the means of these tests.
Since in this particular study the time interval between tumor surgery and the
voluntary eye movement tests was long, it must be noted that the central
compensation mechanisms have also affected oculomotor performance.
So far there have not been any published studies about the correlation of the
clinical character of CPA tumors and the deficits of the voluntary eye movements.
It was observed that constant and pseudo-random saccades and PRPEM could be
influenced by the clinical behavior of the CPA tumor. The SRT, the SPV and the GA
were affected.
Facial nerve function after surgery, the cysticity of tumor and duration of
operation correlate to the adherence of the CPA tumor. The more adherent the CPA
tumor is, the more severe damage that can result during the operation. The tumor
size, the radicality of the operation, the factors correlated to the adherence of tumor
and the aging of the patient, all influence the recovery of eye motor functions in CPA
tumor patients. The amount of eye motor function recovery correlates with the
subjective handicap of the oculomotor functions in these patients.
c. Operated hemangioblastoma and subsequent oculomotor deficits
The author knows of no studies about voluntary eye movements, in which the tests
have been done solely on HAB or operated HAB patients.
In differentiating operated HAB from control subjects with saccades, SRTs were
the best parameters; the differences were significant in SRTs of 60° saccades.
Additionally, some of the SPVs were distinctly lowered in operated HAB patients when
compared with normal subjects.
In PRPEM with a 0.25 and 0.425 Hz frequency and a 0.45 and 0.7 Hz frequency
combination, operated HAB patients had distinctly lower GAs than control subjects.
The mean phase was not distinctly lengthened in these patients.
One must bear in mind that these patients were tested a considerable time after
the operation. Results of this study are restricted to operated HAB patients, where
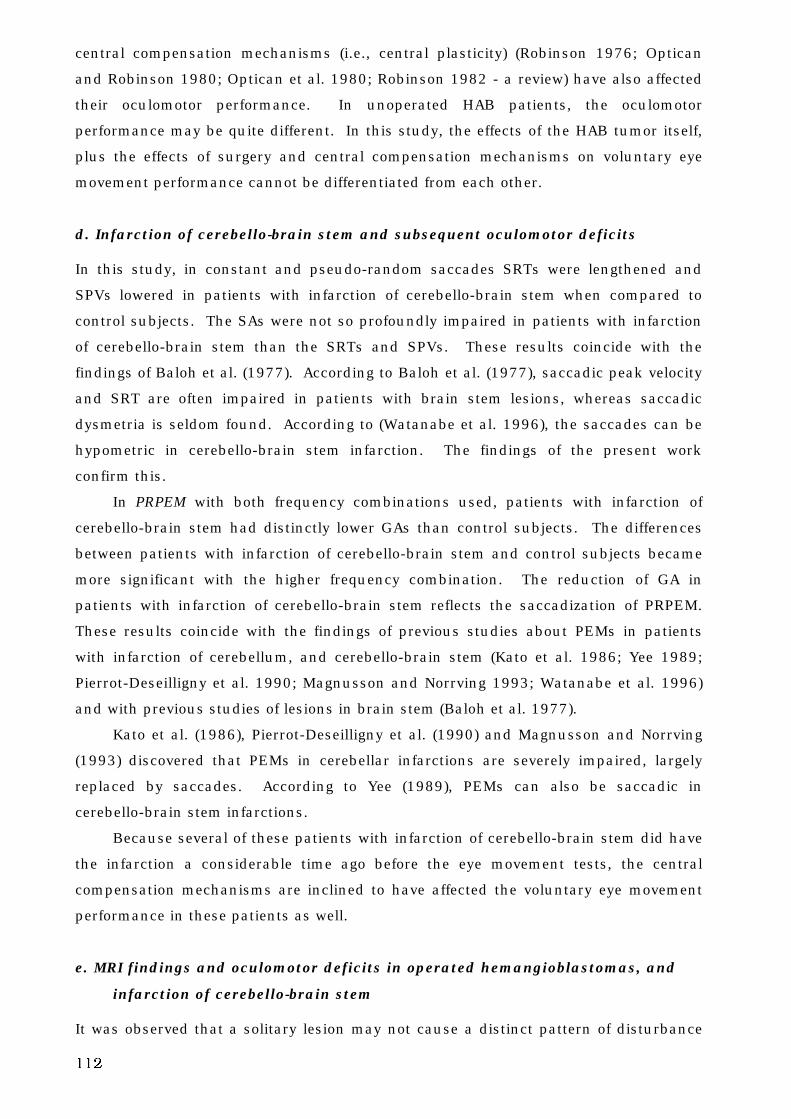
112
central compensation mechanisms (i.e., central plasticity) (Robinson 1976; Optican
and Robinson 1980; Optican et al. 1980; Robinson 1982 - a review) have also affected
their oculomotor performance. In unoperated HAB patients, the oculomotor
performance may be quite different. In this study, the effects of the HAB tumor itself,
plus the effects of surgery and central compensation mechanisms on voluntary eye
movement performance cannot be differentiated from each other.
d. Infarction of cerebello-brain stem and subsequent oculomotor deficits
In this study, in constant and pseudo-random saccades SRTs were lengthened and
SPVs lowered in patients with infarction of cerebello-brain stem when compared to
control subjects. The SAs were not so profoundly impaired in patients with infarction
of cerebello-brain stem than the SRTs and SPVs. These results coincide with the
findings of Baloh et al. (1977). According to Baloh et al. (1977), saccadic peak velocity
and SRT are often impaired in patients with brain stem lesions, whereas saccadic
dysmetria is seldom found. According to (Watanabe et al. 1996), the saccades can be
hypometric in cerebello-brain stem infarction. The findings of the present work
confirm this.
In PRPEM with both frequency combinations used, patients with infarction of
cerebello-brain stem had distinctly lower GAs than control subjects. The differences
between patients with infarction of cerebello-brain stem and control subjects became
more significant with the higher frequency combination. The reduction of GA in
patients with infarction of cerebello-brain stem reflects the saccadization of PRPEM.
These results coincide with the findings of previous studies about PEMs in patients
with infarction of cerebellum, and cerebello-brain stem (Kato et al. 1986; Yee 1989;
Pierrot-Deseilligny et al. 1990; Magnusson and Norrving 1993; Watanabe et al. 1996)
and with previous studies of lesions in brain stem (Baloh et al. 1977).
Kato et al. (1986), Pierrot-Deseilligny et al. (1990) and Magnusson and Norrving
(1993) discovered that PEMs in cerebellar infarctions are severely impaired, largely
replaced by saccades. According to Yee (1989), PEMs can also be saccadic in
cerebello-brain stem infarctions.
Because several of these patients with infarction of cerebello-brain stem did have
the infarction a considerable time ago before the eye movement tests, the central
compensation mechanisms are inclined to have affected the voluntary eye movement
performance in these patients as well.
e. MRI findings and oculomotor deficits in operated hemangioblastomas, and
infarction of cerebello-brain stem
It was observed that a solitary lesion may not cause a distinct pattern of disturbance
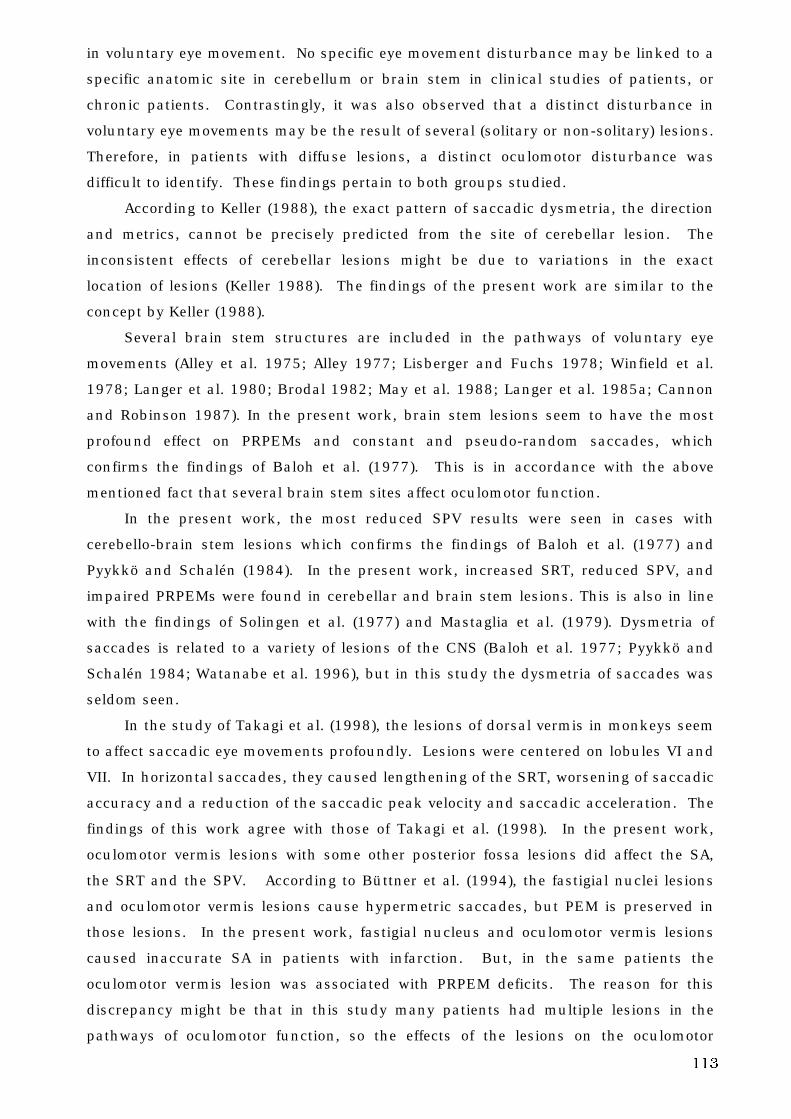
113
in voluntary eye movement. No specific eye movement disturbance may be linked to a
specific anatomic site in cerebellum or brain stem in clinical studies of patients, or
chronic patients. Contrastingly, it was also observed that a distinct disturbance in
voluntary eye movements may be the result of several (solitary or non-solitary) lesions.
Therefore, in patients with diffuse lesions, a distinct oculomotor disturbance was
difficult to identify. These findings pertain to both groups studied.
According to Keller (1988), the exact pattern of saccadic dysmetria, the direction
and metrics, cannot be precisely predicted from the site of cerebellar lesion. The
inconsistent effects of cerebellar lesions might be due to variations in the exact
location of lesions (Keller 1988). The findings of the present work are similar to the
concept by Keller (1988).
Several brain stem structures are included in the pathways of voluntary eye
movements (Alley et al. 1975; Alley 1977; Lisberger and Fuchs 1978; Winfield et al.
1978; Langer et al. 1980; Brodal 1982; May et al. 1988; Langer et al. 1985a; Cannon
and Robinson 1987). In the present work, brain stem lesions seem to have the most
profound effect on PRPEMs and constant and pseudo-random saccades, which
confirms the findings of Baloh et al. (1977). This is in accordance with the above
mentioned fact that several brain stem sites affect oculomotor function.
In the present work, the most reduced SPV results were seen in cases with
cerebello-brain stem lesions which confirms the findings of Baloh et al. (1977) and
Pyykkö and Schalén (1984). In the present work, increased SRT, reduced SPV, and
impaired PRPEMs were found in cerebellar and brain stem lesions. This is also in line
with the findings of Solingen et al. (1977) and Mastaglia et al. (1979). Dysmetria of
saccades is related to a variety of lesions of the CNS (Baloh et al. 1977; Pyykkö and
Schalén 1984; Watanabe et al. 1996), but in this study the dysmetria of saccades was
seldom seen.
In the study of Takagi et al. (1998), the lesions of dorsal vermis in monkeys seem
to affect saccadic eye movements profoundly. Lesions were centered on lobules VI and
VII. In horizontal saccades, they caused lengthening of the SRT, worsening of saccadic
accuracy and a reduction of the saccadic peak velocity and saccadic acceleration. The
findings of this work agree with those of Takagi et al. (1998). In the present work,
oculomotor vermis lesions with some other posterior fossa lesions did affect the SA,
the SRT and the SPV. According to Büttner et al. (1994), the fastigial nuclei lesions
and oculomotor vermis lesions cause hypermetric saccades, but PEM is preserved in
those lesions. In the present work, fastigial nucleus and oculomotor vermis lesions
caused inaccurate SA in patients with infarction. But, in the same patients the
oculomotor vermis lesion was associated with PRPEM deficits. The reason for this
discrepancy might be that in this study many patients had multiple lesions in the
pathways of oculomotor function, so the effects of the lesions on the oculomotor
114
function were compromised. In clinical work, natural lesions in patients are most
often not distinct. The study of Büttner et al. (1994) was restricted to the oculomotor
findings of two patients with distinct lesions of both oculomotor vermis and fastigial
nuclei.
In the present study, brain stem lesions correlated with reduced SPV in infarction
patients. In operated HAB patients, fastigial nucleus and brain stem lesions were
associated with reduced SPV; the fastigial nucleus lesions and brain stem lesions were
often seen in the same patients. This might be explained by the fact that fastigial
nucleus and brain stem are anatomically adjacent structures (Noda and Fujikado
1987b), and so both can be injured at the same time.
The PEM system is vulnerable to external processes, environmental factors and
various disease processes (Versino and Cosi 1990). Therefore, a variety of CNS
diseases may affect PEMs, and PEM disturbance can be an early indicator of a
pathological process (Zee et al. 1976a; Troost and Daroff 1977). In this study, brain
stem, oculomotor vermis and flocculus lesions seem to impair PRPEMs. Both the GA
and mean phase were deteriorated.
In this study, flocculus lesions impaired the PRPEM but did not affect the SA of
saccades. The finding that impaired PRPEMs and flocculus lesions correlate with each
other coincide with other studies (Zee et al. 1976b; Zee et al. 1981; Waespe et al.
1983). A new finding was made in that the flocculus lesions were associated with
lengthened SRTs in patients with infarction of cerebello-brain stem.
As the vestibular and visual system affect the actions of each other at the level of
flocculus, it might be concluded that lengthening of the eye movement responses might
be due to the lengthened procession of mismatched vestibular and eye movement
signals at the level of the flocculus. However, as the neural pathways of voluntary eye
movements are complicated, this needs further study.
The findings by Suzuki and Keller (1983) which suggest that oculomotor vermis
might also take part in generating PEM, were confirmed by the present study. PRPEM
deficits were found in patients with infarction of cerebello-brain stem having
oculomotor vermis and flocculus lesions.
The saccade-related eye movement system and the PEM system both have
plasticity (Robinson 1976; Optican and Robinson 1980; Optican et al. 1980; Robinson
1982 - a review) for different kinds of lesions. The cerebellum plays a vital role in the
control of long-term, plastic and adaptive oculomotor changes that allow the nervous
system to adjust its performance (Robinson 1976; Optican and Robinson 1980;
Optican et al. 1980). This may raise a problem for interpreting clinical material, as
the onset of a selectively cerebellar lesion can unmask a previously occurred brain
stem lesion compensated by that part of the cerebellum (Keller 1988). Then, an
oculomotor deficit may be produced which would not have been present with either
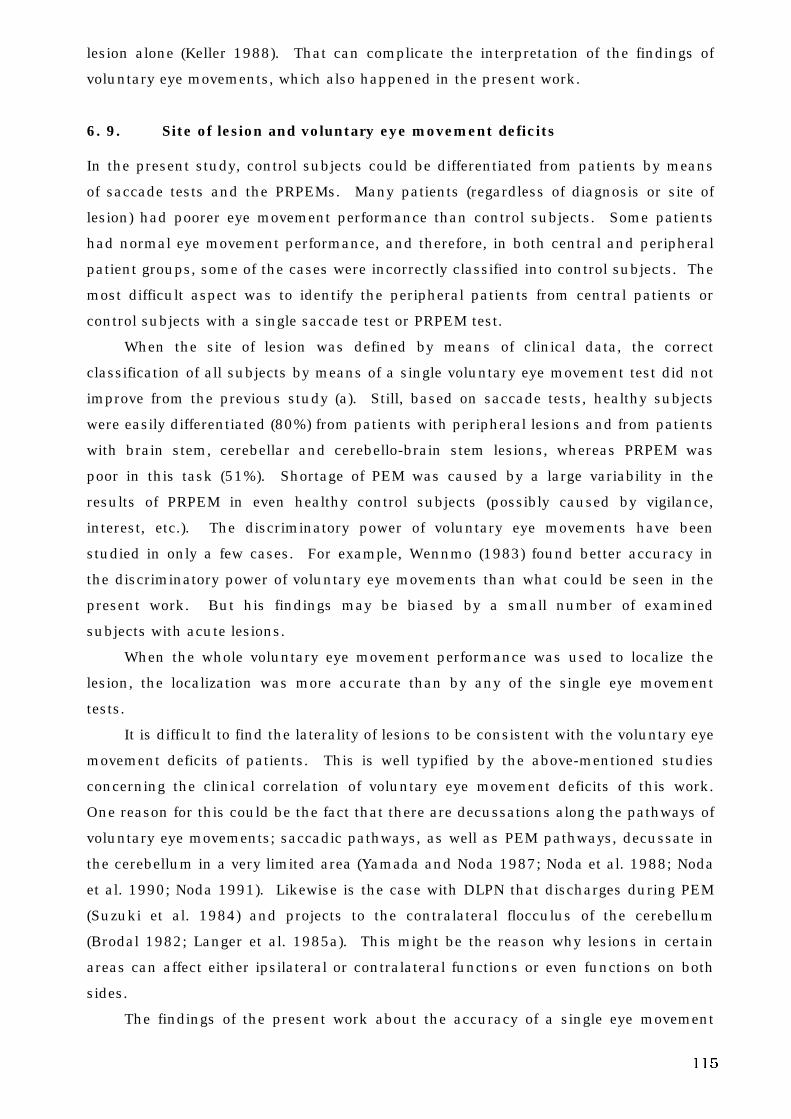
115
lesion alone (Keller 1988). That can complicate the interpretation of the findings of
voluntary eye movements, which also happened in the present work.
6. 9. Site of lesion and voluntary eye movement deficits
In the present study, control subjects could be differentiated from patients by means
of saccade tests and the PRPEMs. Many patients (regardless of diagnosis or site of
lesion) had poorer eye movement performance than control subjects. Some patients
had normal eye movement performance, and therefore, in both central and peripheral
patient groups, some of the cases were incorrectly classified into control subjects. The
most difficult aspect was to identify the peripheral patients from central patients or
control subjects with a single saccade test or PRPEM test.
When the site of lesion was defined by means of clinical data, the correct
classification of all subjects by means of a single voluntary eye movement test did not
improve from the previous study (a). Still, based on saccade tests, healthy subjects
were easily differentiated (80%) from patients with peripheral lesions and from patients
with brain stem, cerebellar and cerebello-brain stem lesions, whereas PRPEM was
poor in this task (51%). Shortage of PEM was caused by a large variability in the
results of PRPEM in even healthy control subjects (possibly caused by vigilance,
interest, etc.). The discriminatory power of voluntary eye movements have been
studied in only a few cases. For example, Wennmo (1983) found better accuracy in
the discriminatory power of voluntary eye movements than what could be seen in the
present work. But his findings may be biased by a small number of examined
subjects with acute lesions.
When the whole voluntary eye movement performance was used to localize the
lesion, the localization was more accurate than by any of the single eye movement
tests.
It is difficult to find the laterality of lesions to be consistent with the voluntary eye
movement deficits of patients. This is well typified by the above-mentioned studies
concerning the clinical correlation of voluntary eye movement deficits of this work.
One reason for this could be the fact that there are decussations along the pathways of
voluntary eye movements; saccadic pathways, as well as PEM pathways, decussate in
the cerebellum in a very limited area (Yamada and Noda 1987; Noda et al. 1988; Noda
et al. 1990; Noda 1991). Likewise is the case with DLPN that discharges during PEM
(Suzuki et al. 1984) and projects to the contralateral flocculus of the cerebellum
(Brodal 1982; Langer et al. 1985a). This might be the reason why lesions in certain
areas can affect either ipsilateral or contralateral functions or even functions on both
sides.
The findings of the present work about the accuracy of a single eye movement
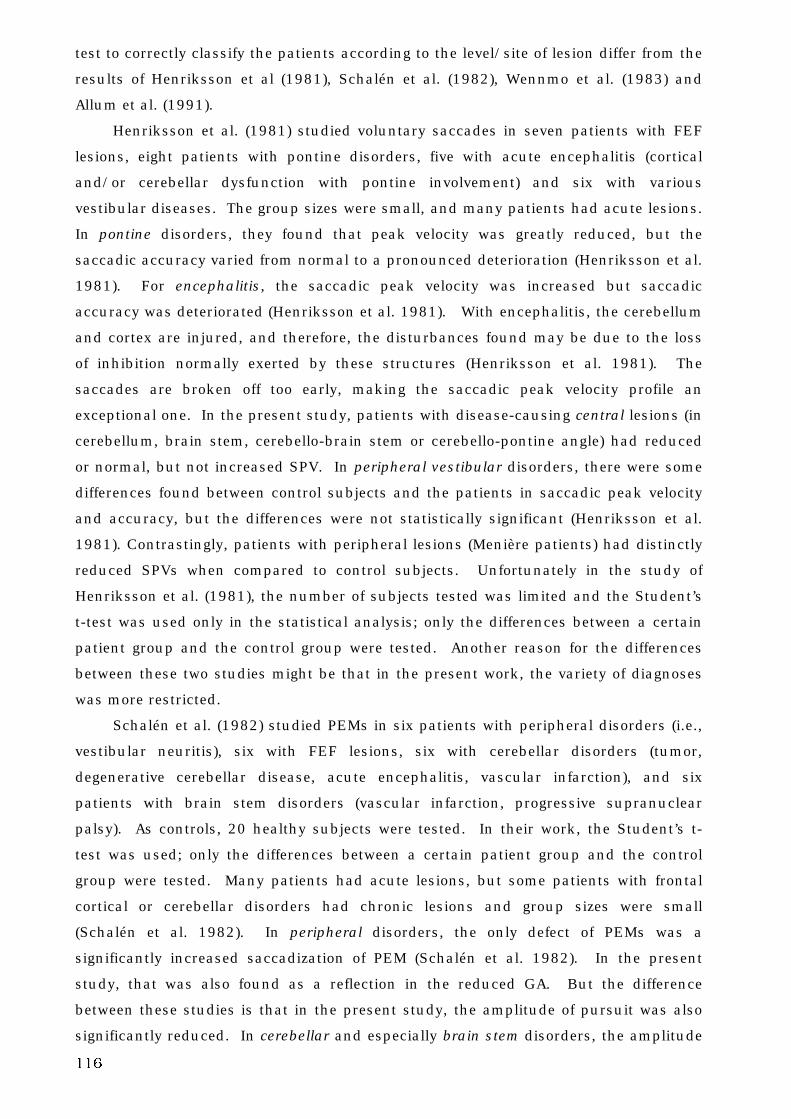
116
test to correctly classify the patients according to the level/site of lesion differ from the
results of Henriksson et al (1981), Schalén et al. (1982), Wennmo et al. (1983) and
Allum et al. (1991).
Henriksson et al. (1981) studied voluntary saccades in seven patients with FEF
lesions, eight patients with pontine disorders, five with acute encephalitis (cortical
and/or cerebellar dysfunction with pontine involvement) and six with various
vestibular diseases. The group sizes were small, and many patients had acute lesions.
In pontine disorders, they found that peak velocity was greatly reduced, but the
saccadic accuracy varied from normal to a pronounced deterioration (Henriksson et al.
1981). For encephalitis, the saccadic peak velocity was increased but saccadic
accuracy was deteriorated (Henriksson et al. 1981). With encephalitis, the cerebellum
and cortex are injured, and therefore, the disturbances found may be due to the loss
of inhibition normally exerted by these structures (Henriksson et al. 1981). The
saccades are broken off too early, making the saccadic peak velocity profile an
exceptional one. In the present study, patients with disease-causing central lesions (in
cerebellum, brain stem, cerebello-brain stem or cerebello-pontine angle) had reduced
or normal, but not increased SPV. In peripheral vestibular disorders, there were some
differences found between control subjects and the patients in saccadic peak velocity
and accuracy, but the differences were not statistically significant (Henriksson et al.
1981). Contrastingly, patients with peripheral lesions (Menière patients) had distinctly
reduced SPVs when compared to control subjects. Unfortunately in the study of
Henriksson et al. (1981), the number of subjects tested was limited and the Student’s
t-test was used only in the statistical analysis; only the differences between a certain
patient group and the control group were tested. Another reason for the differences
between these two studies might be that in the present work, the variety of diagnoses
was more restricted.
Schalén et al. (1982) studied PEMs in six patients with peripheral disorders (i.e.,
vestibular neuritis), six with FEF lesions, six with cerebellar disorders (tumor,
degenerative cerebellar disease, acute encephalitis, vascular infarction), and six
patients with brain stem disorders (vascular infarction, progressive supranuclear
palsy). As controls, 20 healthy subjects were tested. In their work, the Student’s t-
test was used; only the differences between a certain patient group and the control
group were tested. Many patients had acute lesions, but some patients with frontal
cortical or cerebellar disorders had chronic lesions and group sizes were small
(Schalén et al. 1982). In peripheral disorders, the only defect of PEMs was a
significantly increased saccadization of PEM (Schalén et al. 1982). In the present
study, that was also found as a reflection in the reduced GA. But the difference
between these studies is that in the present study, the amplitude of pursuit was also
significantly reduced. In cerebellar and especially brain stem disorders, the amplitude
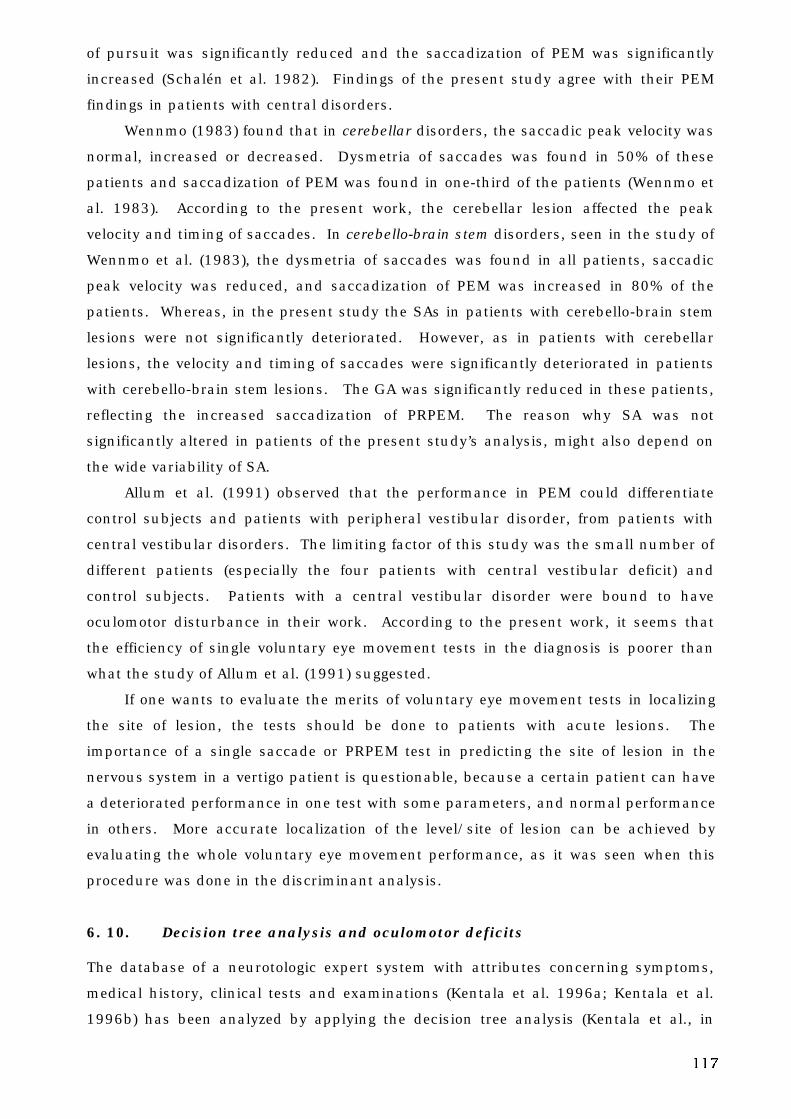
117
of pursuit was significantly reduced and the saccadization of PEM was significantly
increased (Schalén et al. 1982). Findings of the present study agree with their PEM
findings in patients with central disorders.
Wennmo (1983) found that in cerebellar disorders, the saccadic peak velocity was
normal, increased or decreased. Dysmetria of saccades was found in 50% of these
patients and saccadization of PEM was found in one-third of the patients (Wennmo et
al. 1983). According to the present work, the cerebellar lesion affected the peak
velocity and timing of saccades. In cerebello-brain stem disorders, seen in the study of
Wennmo et al. (1983), the dysmetria of saccades was found in all patients, saccadic
peak velocity was reduced, and saccadization of PEM was increased in 80% of the
patients. Whereas, in the present study the SAs in patients with cerebello-brain stem
lesions were not significantly deteriorated. However, as in patients with cerebellar
lesions, the velocity and timing of saccades were significantly deteriorated in patients
with cerebello-brain stem lesions. The GA was significantly reduced in these patients,
reflecting the increased saccadization of PRPEM. The reason why SA was not
significantly altered in patients of the present study’s analysis, might also depend on
the wide variability of SA.
Allum et al. (1991) observed that the performance in PEM could differentiate
control subjects and patients with peripheral vestibular disorder, from patients with
central vestibular disorders. The limiting factor of this study was the small number of
different patients (especially the four patients with central vestibular deficit) and
control subjects. Patients with a central vestibular disorder were bound to have
oculomotor disturbance in their work. According to the present work, it seems that
the efficiency of single voluntary eye movement tests in the diagnosis is poorer than
what the study of Allum et al. (1991) suggested.
If one wants to evaluate the merits of voluntary eye movement tests in localizing
the site of lesion, the tests should be done to patients with acute lesions. The
importance of a single saccade or PRPEM test in predicting the site of lesion in the
nervous system in a vertigo patient is questionable, because a certain patient can have
a deteriorated performance in one test with some parameters, and normal performance
in others. More accurate localization of the level/site of lesion can be achieved by
evaluating the whole voluntary eye movement performance, as it was seen when this
procedure was done in the discriminant analysis.
6. 10. Decision tree analysis and oculomotor deficits
The database of a neurotologic expert system with attributes concerning symptoms,
medical history, clinical tests and examinations (Kentala et al. 1996a; Kentala et al.
1996b) has been analyzed by applying the decision tree analysis (Kentala et al., in
118
press). Relevant parameters for classification of patient cases were extracted from the
database. Their findings suggest that oculomotor tests and other neurotologic tests
are of minor value in the classification of patients with benign positional vertigo,
Menière’s disease, sudden deafness, traumatic vertigo, vestibular neuritis, and
vestibular schwannoma (Kentala et al. 1996b; Kentala et al., in press).
To my knowledge, there are no studies as yet, concerning where the site of lesion
has been assayed by applying artificial intelligence in voluntary eye movements. In
this work, analysis was assayed by making the decision tree analysis. In this assay,
the overall performance of the saccadic and PRPEM system proved to be the most
effective. The performance ability in different voluntary eye movements (constant and
pseudo-random saccades, PRPEM with different frequency combinations) could
accurately classify control subjects and patients with lesions at different sites of the
neural system into correct groups. It almost always correctly classified those subjects
that had divergent results from the mean performance of their group in some of the
voluntary eye movement tests, or in some parameters of these tests. By combining the
parameters of saccades and of PRPEM in the decision tree analysis, the model of
voluntary eye movement lesion was linked to the site of lesion. The most important
attributes (i.e., parameters) in the classification task were the SRT, GA, and mean
phase. This confirms the findings of earlier parts of this work regarding the meaning
of oculomotor tests in diagnosis and localization of lesions. Timing errors are the most
relevant in differentiating patients from control subjects.
In chronic lesions, if the lesion affects the oculomotor centers, the site of lesion
can be verified by means of voluntary eye movement performance. In other cases,
improvement with time is often outstanding. However, if the lesions are at important
sites in the oculomotor pathways, the improvement is not so remarkable. Another
oculomotor center cannot totally compensate for the function of the affected center. In
such cases, the defects in voluntary eye movement are more or less permanent.
The use of a single voluntary eye movement test is not effective in evaluating the
site of the lesion, or the diagnosis. This was formerly seen in both the analysis of the
discriminatory power of voluntary eye movements in patients and control subjects,
and in the analysis of localizing the site of lesion in the nervous system.
119
7. C O N C L U S I O N S
1. Age affects the saccadic and PRPEM performance to a degree. The middle-aged
had the best overall performance in voluntary eye movements. For children and
teenagers, the voluntary eye movements were maturing, and in the elderly the
performance seemed to degenerate with age. There were no significant
differences between genders in eye movement performance, even though males
showed a tendency for more rapid saccadic eye movements than females.
2. The SPV showed a tendency to be higher in leftward saccades than in rightward
saccades within the individual level in healthy subjects. This might be affected
by the hemispheric dominance. Within the level of a group, the direction of a
saccade does not affect the saccadic parameters in healthy subjects. A single
PRPEM test result was found to be repeatable and reliable enough, with the
exception of mean phase shift that tended to be systematically shorter in
repeated measurements.
3. In PRPEMs, the recording method did not have a significant affect on
parameters, but in saccades, accuracy was better and velocity was lower in
MOG than in EOG. The EOG recording method is still preferable in assessing
voluntary eye movements in clinical praxis.
4. Voluntary eye movement tests bring new information to the diagnostics of
vertigo patients, but the meaning of a single voluntary eye movement test as the
only test in making the diagnosis, is inadequate. Each of the voluntary eye
movement tests should be used with other diagnostic procedures and the
results of different procedures should be given equal consideration. The timing
of saccades (reaction time) is the most susceptible to disturbances in patients
with lesions at different sites of the neural system. In PRPEM, the timing
disorder of these patients is reflected on saccadization of PRPEM that reduces
the GA.
The plasticity of the brain, even though abundant, is not completely effective.
The disorders of voluntary eye movements in patients with chronic lesions at
different sites of the neural system have reduced with reference to patients of
acute lesions. But years after a lesion, there are still disorders to be found in
the voluntary eye movements.
120
5. The whole performance ability of the voluntary eye movement system was
crucial in evaluating the site of lesion in these kind of chronic vertigo patients.
The performance ability can be evaluated accurately with artificial intelligence.
6. Voluntary eye movements tested with this system provide necessary information
about the function of the brain that is reflected by functional symptoms and
disorders.
This work indicates that in patients with peripheral or central lesions along the
pathways for voluntary eye movements, there were timing errors (lengthened SRT,
lengthened phase lag or saccadization of PEM) in voluntary eye movements. This
could have been caused by disturbance in the premotor processing of voluntary eye
movements. Depending on the site of lesion, different indices of neural processing
time were disturbed.
It is recommended that in the future, testing the whole voluntary eye movement
performance in patients with vertigo and evaluating the correlation of voluntary eye
movement performance to the subjective symptoms of the patient, be included in the
diagnostic procedures. The use of artificial intelligence is recommended in this
analysis, since it can “learn” from previous analysis and so improve the accuracy of
localizing the lesions.
121
8. S U M M A R Y
Purpose: The aim of the present work was to evaluate physiological,
methodological and clinical aspects of voluntary eye movement tests.
Subjects and Methods: Constant and pseudo-random saccades and PRPEMs were
assessed in control subjects and patients with computer based equipment. In control
subjects, the effect of age and gender on voluntary eye movements, as well as the
laterality of saccades and repeatability of PRPEM tests were tested. Also, the effect of
the EOG and MOG recording methods on voluntary eye movement results was tested
in healthy subjects. Different kind of patients, most of whom had chronic lesions
(moderately severe or severe Menière’s disease, operated CPA tumor, operated HAB of
cerebellum, infarction of cerebello-brain stem), were tested and their voluntary eye
movement performance was compared to that of healthy subjects. The correlation of
voluntary eye movement deficits to subjective symptoms and clinical data of patients
was also analyzed. The accuracy of a single voluntary eye movement test, the whole
voluntary eye movement performance to localize the level/site of lesion was analyzed
with discrimination analysis. The accuracy of the whole voluntary eye movement
performance to localize the site of lesion was also analyzed with a decision tree
analysis.
Results: SA and pursuit gain (GA) and phase (mean phase) were deteriorated with
advancing age in elderly subjects. In children and teenagers, the oculomotor system
was maturing. In middle-aged subjects, voluntary eye movement performance was at
its best. No significant differences between the genders in voluntary eye movement
performance were observed. The direction of saccades did not affect the saccadic
parameters in healthy subjects. The PRPEM test was found to be repeatable with the
exception of mean phase, where a tendency of learning effect seemed to affect to some
degree. When compared to the MOG recording method, the EOG recording method
was found to be reliable enough in the assessment of horizontal voluntary eye
movements. In each patient group, the subjective symptoms and clinical findings
correlated with the voluntary eye movement deficits. A single voluntary eye movement
test was not effective in localizing the level/site of lesion (with a single saccade test a
correct localization was achieved in 48-56% of all cases, and with a single PRPEM test
a correct localization was achieved in 33-48% of all cases). When using the whole
voluntary eye movement performance, however, the accuracy improved and the correct
localization was achieved in 75.5% of all cases with discrimination analysis. When
artificial intelligence that “learns from previous experience” was used with the whole
voluntary eye movement performance data in the localization task, the accuracy was
further improved (correct localization in 91.4 - 97.1% of all cases).

122
Discussion and Conclusions: In clinical praxis, the age of the subject tested has to
be taken into account when evaluating the results of voluntary eye movement tests. In
clinical praxis, the gender of the subjects tested or the laterality of, at least saccades,
do not have to be taken into account. According to the methodological studies (the
repeatability of PRPEM tests, the effect of EOG and MOG recording method), this
system for assessing voluntary eye movements can be used in clinical and research
work. Voluntary eye movements provide necessary information about the function of
the brain that is reflected by functional symptoms and disorders. With reference to
testing patients, especially with chronic lesions, the whole voluntary eye movement
performance should be evaluated and analyzed with artificial intelligence in order to
localize the level/site of lesion.
In the future, the correlation of subjective symptoms of a patient with vertigo and
their whole voluntary eye movement performance should be evaluated in order to aid
diagnosing.

123
9. A C K N O W L E D G M E N T S
This study was carried out in the Department of Otorhinolaryngology at Helsinki
University Central Hospital between 1992 and 1998. I wish to thank Professor Jukka
Ylikoski, for providing me with the opportunity to work there.
It is my pleasure to thank Professor Ilmari Pyykkö, my supervisor, for his encouraging
support and creating a favorable atmosphere for scientific work. I am very grateful for
his constant enthusiasm, selfless support and patience throughout the course of this
work. His guidance and advice have been valuable in this study, and his
encouragement has been invaluable when continuing the research work abroad.
I also want to thank Professor Martti Juhola, my supervisor, for his profound
knowledge of computer science, his skillful solutions of problems concerning eye
movement assessment and recording and for his guidance and support.
I appreciate the constructive criticism and valuable comments of docents Kirsi Setälä
and Ville Jäntti in their review of the manuscript.
I wish to expess my sincere thanks to Pekka Honkavaara, M.D., for the kind
assistance in performing the lay out of this thesis during the endless nights at the final
stage.
PhD Heikki Aalto has provided invaluable technical and computer assistance in
performing the experiments. His help is highly appreciated.
I am indebted to doctors Oili Salonen and Liisa Ertama from the Department of
Radiology of Helsinki University Central Hospital for their invaluable assistance and
advice in problems of neuroradiology.
I am grateful for the assistance offered by docents Markus Färkkilä and Juha Jääske-
läinen, and doctor Mika Niemelä from the Department of Neurology – Neurosurgery, in
acquiring patients with posterior fossa lesions.

124
My decision tree would be without leaves unless MA Kati Viikki had not been there.
Her help has been invaluable.
I am grateful for the assistance offered by librarians Aino Nikupaavo, M.A., for proof
reading the references and Marja-Leena Ylivakkuri, M.A., for assisting in the numerous
literature searches, both from the Helsinki University Central Hospital.
I wish to express my sincere thanks to Mr. Teo Hämäläinen from Helsinki University
Hospital for the assistance and advice concerning imaging programs.
I am greatly indebted to Taina Haavisto, the head nurse of teaching department, for
the support, stimulation and assistance in practical problems.
Grammatical revisions of this manuscript by Cheryl Miller, is greatly appreciated.
This work has been financially supported by the Academy of Finland, the Paulo
Foundation, the Otorhinolaryngologic Foundation, the Audiologic Foundation and the
Duodecim Foundation. Helsinki University Central Hospital provided me the
opportunity to work as a salaried, full-time researcher for a number of months.
Paris, November 1999
Elina Isotalo
125
10. R E F E R E N C E S
Aalto H, Juhola M, Pyykkö I. Visual stimulator using laser beam for eye-movement studies.Med & Biol Eng & Comput 1989; 27: 332-335.
AAO-HNS criteria. Menière’s disease: criteria for diagnosis and evaluation of therapy forreporting. AAO-HNS Bulletin, July, 1985.
Abel LA, Dell’Osso LF, Daroff RB, Parker L. Saccades in extremes of lateral gaze. InvestOphthalmol Vis Sci 1979; 18: 324-327.
Abel LA, Schmidt D, Dell’Osso LF, Daroff RB. Saccadic system plasticity in humans. AnnNeurol 1978; 4: 313-318.
Abel LA, Troost BT, Dell’Osso LF. The effects of age on normal saccadic characteristics andtheir variability. Vision Res 1983; 23: 33-37.
Alley K. Anatomical basis for interaction between cerebellar flocculus and brainstem. In: BakerB, Berthoz A, eds. Control of gaze by brainstem neurons. Amsterdam, New York:Elsevier/North-Holland Biomedical Press 1977: 109-117.
Alley K, Baker R, Simpson JI. Afferents to the vestibulo-cerebellum and the origin of the visualclimbing fibers in the rabbit. Brain Res 1975; 98: 582-589.
Allum JHJ, Ura M, Honegger F, Pfaltz CR. Classification of peripheral and central (pontineinfarction) vestibular deficits. Selection of a Neuro-otological test battery usingdiscriminant analysis. Acta Otolaryngol (Stockh) 1991; 111: 16-26.
Amarenco P, Roullet E, Hommel M, Chaine P, Marteau A. Infarction in the territory of themedial branch of the posterior inferior cerebellar artery. J Neurol Neurosurg Psychiatry1990; 53: 731-735.
Andersen RA, Essick GK, Siegel RM. Neurons of area 7 activated by both visual stimuli andoculomotor behavior. Exp Brain Res 1987; 67: 316-322.
Aschoff JC. Veränderungen rascher Blickbewgungen (Saccaden) beim Menschen unterDiazepam (Valium®). Arch Psychiat Nervenkr 1968; 211: 325-332.
Astola J, Heinonen P, Neuvo Y. On root structures of median and median-type filters. IEEETrans Acoust Speech Signal Process 1987; 35: 1199-1201.
Astruc J. Corticofugal connections of area 8 (frontal eye field) in Macaca mulatta. Brain Res1971; 33: 241-256.
Bahill AT, Brockenbrough A, Troost BT. Variability and development of a normative data basefor saccadic eye movements. Invest Ophthalmol 1981; 21: 116-124.
Bahill AT, Clark MR, Stark L. Computer simulation of overshoot in saccadic eye movements.Computer Programs Biomed 1975(a); 4: 230-236.
Bahill AT, Clark MR, Stark L. Dynamic overshoot in saccadic eye movements in caused byneurological control signal reversals. Exp Neurol 1975(b); 48: 107-122.
Bahill AT, Iandolo MJ, Troost BT. Smooth pursuit eye movements in response to unpredictabletarget waveforms. Vision Res 1980; 20: 923-931.
Bahill AT, Stark L. Overlapping saccades and glissades are produced by fatigue in the saccadiceye movement system. Exp Neurol 1975; 48: 95-106.
Baloh RW. Drop attacks with Menière’s syndrome. Ann Neurol 1990; 28: 384-387.
Baloh RW, Honrubia V. Clinical neurophysiology of the vestibular system. Philadelphia: F.A.Davis Company 1979. 230 pp.
Baloh RW, Honrubia V, Sills A. Eye tracking and optokinetic nystagmus. Results ofquantitative testing in patients with well-defined nervous system lesions. Ann Otol RhinolLaryngol 1977; 86: 108-114.
Baloh RW, Konrad HR, Honrubia V. Vestibulo-ocular function in patients with cerebellaratrophy. Neurology 1975(a); 25: 160-168.
126
Baloh RW, Kumley WE, Sills AW, Honrubia V, Konrad HR. Quantitative measurement ofsmooth pursuit eye movements. Ann Otol Rhinol Laryngol 1976; 85: 111-119.
Baloh RW, Sills AW, Kumley WE, Honrubia V. Quantitative measurement of saccadeamplitude, duration and velocity. Neurology 1975(b); 25: 1065-1070.
Baloh RW, Yee RD, Honrubia V. Optokinetic nystagmus and parietal lobe lesions. Ann Neurol1980; 7: 269-276.
Baker R, Berthoz A, Delgado-Carcía J. Monosynaptic excitation of trochlear motoneuronsfollowing electrical stimulation of the prepositus hypoglossi nucleus. Brain Res 1977; 121:157-161.
Barnes GR, Donnelly SF, Eason RD. Predictive velocity estimation in the pursuit reflexresponse to pseudo-random and step displacement stimuli in man. J Physiol 1987; 389:111-136.
Beaussart M, Guieu JD. Artefacts. In: Rémond A, ed. Handbook of electroencephalography andclinical neurophysiology. Amsterdam: Elsevier 1977: 11A-80 - 11A-96.
Beck C, Schmidt C. Ten-year experience with intratympanically applied streptomycin(gentamicin) in the therapy of morbus Menière. Arch Otorhinolaryngol 1978; 221: 149-152.
Becker W, Fuchs AF. Further properties of the human saccadic eye system: Eye movementsand correction saccades with and without visual fixation points. Vision Res 1969; 9: 1247-1258.
Becker W, Fuchs AF. Prediction in the oculomotor system: smooth pursuit during transientdisappearance of a visual target. Exp Brain Res 1985; 57: 562-575.
Becker W, Jürgens R. An analysis of the saccadic system by means of double step stimuli.Vision Res 1979; 9: 967-983.
Behrens F. An improved calibration procedure for eye movement recordings in animals usingRobinson’s electromagnetic scleral search-coil technique. J Neurosci Methods 1989; 29:195-199.
Belal A Jr., Sanna M. Pathology as it relates to ear surgery. I Surgery of glomus tumors. JLaryngol Otol 1982; 96: 1079-1097.
Belknap DB, Noda H. Eye movements evoked by microstimulation in the flocculus of the alertmacaque. Exp Brain Res 1987; 67: 352-362.
Belknap D, Noda H, Ohno M. Eye movements evoked by microstimulation in the flocculus ofthe macaque. Soc Neurosci Abstr 1982; 8: 830.
Bergenius J, Borg E, Hirsch A. Stapedius reflex test, brainstem audiometry and opto-vestibular tests in diagnosis of acoustic neurinomas. Scand Audiol 1983; 12: 3-9.
Bergenius J. Vestibular findings in sensorineural hearing disorders. Results of caloric,oculomotor and hearing tests in 205 patients with unilateral hearing dysfunction. ActaOtolaryngol (Stockh) 1985; 99: 83-94.
Berlinger NT, Koutroupas S, Adams G, Maisel R. Patterns of involvement of the temporal bonein mestastatic and systemic malignancy. Laryngoscope 1980; 90: 619-627.
Black FO, Effron MZ, Burns DS. Diagnosis and management of drop attacks of vestibularorigin : Tumarkin otolithic crisis. Otolaryngol Head Neck Surg 1982; 90: 256-262.
Blakley BW. Electronystagmography: The standardization process. AAO-HNSF Bulletin 1998;17 (3): 10-13.
Boghen D, Troost BT, Daroff RB, Dell’Osso LF, Birkett JE. Velocity characteristics of normalhuman saccades. Invest Ophthalmol 1974; 13: 619-623.
Brackmann DE, Bartels LJ. Rare tumors of the cerebellopontine angle. Otolaryngol Head NeckSurg 1980; 88: 555-559.
Brackmann DE, Kwartler JA. A review of acoustic tumors: 1983-1988. Am J Otol 1990; 11:216-232.
Brantberg K. Human optokinetic after-nystagmus; variability in serial test results. ActaOtolaryngol (Stockh) 1992; 112: 7-13.
127
Brodal P. The pontocerebellar projection in the rhesus monkey: an experimental study withretrograde axonal transport of horseradish peroxidase. Neuroscience 1979; 4: 193-208.
Brodal P. The projection from the nucleus reticularis tegmenti pontis to the cerebellum in therhesus monkey. Exp Brain Res 1980; 38: 29-36.
Brodal P. Further observations in the cerebellar projections from the pontine nuclei and thenucleus reticularis tegmenti pontis in the rhesus monkey. J Comp Neurol 1982; 204: 44-55.
Bruce CJ, Goldberg ME. Primate frontal eye fields. I. Single neurons discharging beforesaccades. J Neurophysiol 1985; 53: 603-635.
Bruce CJ, Goldberg ME, Bushnell MC, Stanton GB. Primate frontal eye fields. II. Physiologicaland anatomical correlates of electrically evoked eye movements. J Neurophysiol 1985; 54:714-734.
Bruce CJ, Goldman-Rakic PS. Columnar organization of callosal connectivity in the macaquefrontal eye fields and its relation to elicited eye movements. Soc Neurosci Abstr 1984; 10:59.
Buizza A, Schmid R. Velocity characteristics of smooth pursuit eye movements to differentpatterns of target motion. Exp Brain Res 1986; 63: 395-401.
Büttner-Ennever JA, Henn V. An autoradigraphic study of the pathways from the pontinereticular formation involved in horizontal eye movements. Brain Res 1976; 108: 155-164.
Büttner U, Straube A, Spuler A. Saccadic dysmetria and ”intact” smooth pursuit eyemovements after deep cerebellar nuclei lesions. J Neurol Neurosurg Psychiatry 1994; 57:832-834.
Büttner U, Waespe W, Henn V. The role of cerebellum and the vestibular system in thegeneration of slow conjugate eye movements. In: Huber A, Klein D, eds. Neurogenetics andNeuro-ophthalmology. Amsterdam: Elsevier 1981: 89-102.
Cambell FW, Wurtz RH. Saccadic omission: Why we do not see a gray-out during a saccadiceye movement. Vision Res 1978; 18: 1297-1303.
Cannon SC, Robinson DA. Loss of the neural integrator of the oculomotor system from brainstem lesions in monkey. J Neurophysiol 1987; 57: 1383-1409.
Carpenter MB, McMasters RE. Disturbances of conjugate horizontal eye movements in themonkey. II Physiological effects and anatomical degeneration resulting from lesions in themedial longitudinal fasciculus. Arch Neurol 1963; 8: 347-368.
Carpenter MB, Strominger NL. The medial longitudinal fasciculus and disturbances ofconjugate horizontal eye movements in the monkey. J Comp Neurol 1965; 125: 41-66.
Carpenter MB, Sutin J. In: Carpenter MB, Sutin J, eds. Human Neuroanatomy, 8th ed.Baltimore: Williams & Wilkins, 1983: 707-775.
Carpenter RHS. Towards a synthesis. In: Carpenter RHS, ed. Movements of the Eyes, 2nd ed.London: Pion Ltd., 1988: 343-373.
Carter JE, Obler L, Woodward S, Albert ML. The effect of increasing age on the latency forsaccadic eye movements. J Gerontol 1983; 38 318-320.
Chan-Palay V, Sweikhart M, Van Itallie C, Brown JT. Cerebellofugal projections from thedentate nucleus: a new look at their functional topography. Neurosci Abstr 1976; 2: 139.
Chioran GM, Yee RD. Analysis of electro-oculographic artifact during vertical saccadic eyemovements. Graefe’s Arch Clin Exp Ophthalmol 1991; 229: 237-241.
Clarke AH, Teiwes W, Scherer H. Videooculography - an alternative method for measurementof three-dimensional eye movements. In: Schmid R, Zambarbieri D, eds. Oculomotor Controland Cognitive Processes. Amsterdam: Elsevier 1991: 431-443.
Clemis JD, Ballad WJ, Baggot PJ, Lyon ST. Relative frequency of inferior vestibularschwannoma. Arch Otolaryngol Head Neck Surg 1986; 112: 190-194.
Coelho A. Prasher D. Brainstem potentials in the diagnosis of an acoustic neuroma: Anunusual case of normal ipsilateral and abnormal contralateral responses. Scand Audiol1990; 19 : 257-262.
128
Cohen B, Henn V. Unit activity in the pontine reticular formation associated with the eyemovements. Brain Res 1972; 46 :403-410.
Cohen B, Komatsuzaki A, Bender MB. Electrooculographic syndrome in monkeys after pontinereticular formation lesions. Arch Neurol 1968; 18: 78-92.
Cohen B, Komatsuzaki A. Eye movements induced by stimulation of the pontine reticularformation. Evidence for integration in oculomotor pathways. Exp Neurol 1972; 36: 101-117.
Collewijn H. Eye and head movements in freely moving rabbits. J Physiol (Lond) 1977; 266:471-498.
Collewijn H, Van der Mark F, Jansen TC. Precise recording of human eye movements. VisionRes 1975; 15: 447-450.
Collewijn H, Van der Steen L, Ferman L, Jansen TC. Human ocular countercontrol:Assessment of static and dynamic properties from electromagnetic scleral coil recordings.Exp Brain Res 1985; 59: 185-196.
Committee on hearing and equilibrium of AAO-HNSF: Committee on hearing and equilibriumguidelines for the evaluation of results of treatment of conductive hearing loss. OtolaryngolHead Neck Surg 1995; 113: 186-187.
Constans JP, Meder F, Maiuri F, Donzelli R, Spaziante R, de Divitiis E. Posterior fossahemangioblastomas. Surg Neurol 1986; 25: 269-275.
Dahlen AI. 1983. Quantification of rhythm and time pattern in reflexive and voluntary eye-movements. Ph.D. diss., University of Lund.
Dallos PJ, Jones RW. Learning behavior of the eye fixation control system. IEEE TransAutomatic Control 1963; AC-8: 218-227.
Dauman R, Aran JM, Portman M. Limits of ABR and contribution of transtympanicelectrocochleography in the assessment of cerebellopontine angle tumors. Clin Otolaryngol1988; 13 : 107-114.
DeJong JD, Melvill Jones G. Akinesia, hypokinesia and bradykinesia in the oculomotor systemof patients with Parkinson’s disease. Exp Neurol 1971; 32: 58-68.
Deng SY, Segraves MA, Ungerleider LG, Mishkin M, Goldberg ME. Unilateral frontal eye fieldlesions degrade saccadic performance in the rhesus monkey. Soc Neurosci Abstr 1984; 10:59.
Dick GL. Computer analysis of rapid eye movements. Comput Programs Biomed 1978; 8: 29-34.
Duhamel JR, Goldberg ME, Fitzgibbon EJ, Sirigu A, Grafman J. Saccadic dysmetria in apatient with a right frontoparietal lesion. Brain 1992; 115: 1387-1402.
Dürsteler MR, Wurtz RH. Pursuit and optokinetic deficits following chemical lesions of corticalareas MT and MST. J Neurophysiol 1988; 60: 940-965.
Dürsteler MR, Wurtz RH, Newsome WT. Directional pursuit deficits following lesions of thefoveal representation within the superior temporal sulcus of the macaque monkey. JNeurophysiol 1987; 57: 1262-1287.
Eckmiller R, Mackeben M. Pursuit eye movements and their neural control in the monkey.Pflugers Arch 1978; 337: 15-23.
Eldridge R, Parry D. Summary: Vestibular schwannoma (acoustic neuroma) ConsensusDevelopment Conference. Neurosurgery 1992; 30: 962-964.
Findlay JM. Spatial and temporal factors in the predictive generation of saccadic eyemovements. Vision Res 1981; 21: 347-354.
Fischer B, Boch R. Saccadic eye movements after extremely short reaction times in themonkey. Brain Res 1983; 260: 21-26.
Fischer B, Ramsperger E. Human express saccades: Extremely short reaction times of goaldirected eye movements. Exp Brain Res 1984; 57: 191-195.

129
Fischer B, Weber H, Biscaldi M, Aiple F, Otto P, Stuhr V. Separate populations of visuallyguided saccades in humans : Reaction times and amplitudes. Exp Brain Res 1993; 92:528-541.
Fisher CM. Vertigo in cerebrovascular disease. Arch Otolaryngol 1967; 85: 529.
Flom MC, Brown B, Adams J, Jones TR. Alcohol and marijuana effects on ocular tracking. AmJ Optom Physiol Opt 1976; 53: 764-773.
Flood LM, Brightwell AP. Cochlear deafness in the presentation of a large acoustic neuroma. JLaryngol Otol 1984; 98: 87-92.
Franck MC, Kuhlo W. Die Wirkung des Alkohols auf die raschen Blickziehlbewegungen(Saccaden) beim Menschen. Arch Psychiat Nervenkr 1979; 213: 238-245.
Fricker SJ, Sanders JJ. Velocity and acceleration statistics of pseudo-randomly timedsaccades in humans. Vision Res 1975; 15: 225-229.
Fuchs AF. Saccadic and smooth pursuit eye movements in the monkey. J Physiol 1967(a);191: 609-631.
Fuchs AF. Periodic eye tracking in the monkey. J Physiol 1967(b); 193: 161-171.
Fuchs AF, Binder MD. Fatigue resistance of human extraocular muscles. J Neurophysiol1983; 49: 28-34.
Fuchs AF, Luschei ES. Firing patterns of abducens neurons of alert monkeys in relationshipto horizontal eye movement. J Neurophysiol 1970; 33: 382-392.
Fuchs AF, Kaneko CRS, Scudder CS. Brainstem control of saccadic eye movements. Ann RevNeurosci 1985; 8: 307-337.
Fujikado T, Noda H. Saccadic eye movements evoked by microstimulation of lobule VII of thecerebellar vermis in macaque monkeys. J Physiol 1987; 394: 573-594.
Fukuda S, Highstein S, Ito M. Cerebellar inhibitory control of the vestibulo-ocular reflexinvestigated in rabbit IIIrd nucleus. Exp Brain Res 1972; 14: 511-526.
Gavillan C, Gallego J, Gavillan J. ‘Carrusel’: An expert system for vestibular diagnosis. ActaOtolaryngol (Stockh) 1990; 110: 161-167.
Gentles W, Thomas EL. Commentary: Effect of benzodiazepines upon saccadic eye movementsin man. Clin Pharmacol Ther 1971; 12: 563-574.
Gilman S, Bloedel JR, Lechtenberg R. Disorders of the Cerebellum. Philadelphia: FA DavisCompany 1981. 405 pp.
van Gisbergen JAM, van Opstal AJ, Roebroek JGH. Stimulus induced midflight modification ofsaccadic trajectories. In: O’Regan JK, Levy-Schoen A, eds. Eye Movements: FromPhysiology to Cognition. Amsterdam: Elsevier 1987: 27-36.
Glickstein M, Cohen JL, Dixon B, Gibson A, Hollins M, LaBossiere E, Robinson F.Corticopontine visual projections in macaque monkeys. J Comp Neurol 1980; 190: 209-229.
Godey B, Morandi X, Beust L, Brassier G, Bourdinière J. Sensitivity of auditory brainstemresponse in acoustic neuroma screening. Acta Otolaryngol (Stockh) 1998; 118 : 501-504.
Goldberg ME, Bruce CJ, Ungerleider L, Mishkin M. Role of the striate cortex in generation ofsmooth pursuit eye movements. Ann Neurol 1982; 12: 113.
Goldberg ME, Robinson DL. Visual mechanisms underlying gaze: Function of the cerebralcortex. In: Baker B, Berthoz A, eds. Control of Gaze by Brainstem Neurons, Developmentsin Neuroscience. Amsterdam, New York: Elsevier/North-Holland Biomedical Press 1977:469-476.
Goodhill V, Harris I. Surgical treatment of otosclerosis. In: English GM, ed. Otolaryngology.Philadelphia: J. B. Lippincott Company 1993(1);48: 1-35.
Graybiel AM, Hartwieg E. Some afferent connections of the oculomotor complex in the cat: Anexperimental study with tracer techniques. Brain Res 1974; 81: 543-551.
Guillemant P, Ulmer E, Freyss G. 3-d eye movement measurements on four Comex’s diversusing video CCD cameras, during high pressure diving. Acta Otolaryngol (Stockh) Suppl1995; 520: 288-292.
130
Haines DE. Cerebellar corticonuclear and corticovestibular fibers of the flocculonodular lobein a prosimian primate (Galago senegalensis). J Comp Neurol 1977; 174: 607-630.
Hall TC, Miller AKH, Corsellis JAN. Variations in the human Purkinje cell populationaccording to age and sex. Neuropathol Appl Neurobiol 1975; 1: 267-292.
Harting JK. Descending pathways from the superior colliculus: An autoradiographic analysisin the rhesus monkey (Macaca mulatta). J Comp Neurol 1977; 173: 583-612.
Hashimoto S, Kawase T, Furukawa K, Takasaka T. Strategy for the diagnosis of small acousticneuromas. Acta Otolaryngol (Stockh) Suppl 1991; 481 : 567-569.
Hedberg S. “New Knowledge Tools,” Byte, July 1993, 106-109.
Heinonen P, Neuvo Y. FIR-median hybrid filters. IEEE Trans Acoust Speech Signal Process1987; 35: 832-838.
Henriksson NG. 1956. Electrical analysis of the eye-movements in nystagmus. Ph.D. diss.,University of Lund.
Henriksson NG, Hindfelt B, Pyykkö I, Schalén L. Rapid eye movements reflecting neurologicaldisorders. Clin Otolaryngol 1981; 6: 111-119.
Henriksson NG, Pyykkö I, Schalén L, Wennmo C. Velocity patterns of rapid eye movements.Acta Otolaryngol (Stockh) 1980; 89: 504-512.
Henn V, Cohen B. Coding of information about rapid eye movements in the pontine reticularformation of alert monkeys. Brain Res 1976; 108: 307-325.
Hepp K, Henn V. Spatio-temporal recording of rapid eye movement signals in the monkeyparamedian pontine reticular formation (PPRF). Exp Brain Res 1983; 52: 105-120.
Heywood S, Ratcliff G. Long-term oculomotor consequences of unilateral colliculectomy inman. In : Lennerstrand G, Bach-y-Rita P, eds. Basic Mechanisms of Ocular Motility andTheir Clinical Implications. Oxford: Pergamon Press 1975: 561-564.
Highstein SM, Cohen B, Matsunami K. Monosynaptic projections from the pontine reticularformation to the IIIrd nucleus in cat. Brain Res 1974; 75: 340-344.
House JL, Burt MR. Primary CNS tumors presenting as cerebellopontine angle tumors. Am JOtol Suppl, November 1985; 6: 147-153.
House JW, Brackmann DE. Facial nerve grading system. Otolaryngol Head Neck Surg 1985;93: 146-147.
Hoyt WF, Daroff RB. Supranuclear disorders of ocular control system in man. In: Bach-y-RitaP, Collins CC, Hyde JE, eds. The Control of Eye Movements. New York: Academic Press1971: 175-235.
Hoyt WF, Frisen L. Supranuclear oculomotor control: Some clinical considerations. In:Lennerstrand G, Bach-y-Rita P, eds. Basic Mechanisms of Ocular Motility and TheirClinical Implications. New York: Pergamon Press 1975: 379-392.
Hubel DH, Wiesel TN. Receptive fields and functional architecture in the cat’s visual cortex. JPhysiol 1962; 160: 106-154.
Hubel DH, Wiesel TN. Receptive fields and functional architecture in two nonstriate visualareas (18 and 19) of the cat. J Neurophysiol 1965; 28: 229-289.
Hulshof JH, Hilders CG, Baarsma EA. Vestibular investigations in acoustic neuroma. ActaOtolaryngol (Stockh) 1989; 108: 38-44.
Hutton JT, Nagel JA, Loewenson RB. Variables affecting eye tracking performance.Electroencephal Clin Neurophysiol 1983; 56: 414-419.
Hutton JT, Palet J. Lateral saccadic latencies and handedness. Neuropsychologia 1986; 24:449-451.
Ito M. Saccade and Smooth Pursuit Eye Movements. In: Ito M. The Cerebellum and NeuralControl. New York: Raven Press 1984: 389-405.
Jackler RK. Acoustic neuroma (vestibular schwannoma). In: Jackler RK, Brackmann DE, eds.Neurotology. St. Louis: Mosby 1994: 729-785.

131
Jackson CG, Nissen AJ. Medical management of vertigo. In: English GM, ed. Otolaryngology.Philadelphia: J. B. Lippincott Company 1993(1); 32: 1-17.
Jäntti V. Spike artifact associated with fast eye movements in electronystagmography and itsimportance in the automatic analysis of saccades. ORL 1982(a); 44: 216-225.
Jäntti V. 1982(b). Designing of a quantitative automatic analysis system for horizontalsaccadic eye movements: an electro-oculographic study with special reference to the effectsof alcohol on saccades. Ph.D. diss., University of Turku.
Juhola M. A syntactic method for analysis of saccadic eye movements. Pattern Recognit 1986;19: 353-359.
Juhola M. 1987. On computer analysis of digital signals applied to eye movements. Ph.D.diss., University of Turku.
Juhola M. On the computer classification of abnormal saccadic eye movements. Innov TechnolBiol Med 1988(a); 9: 259-268.
Juhola M. On automatic diagnosis of pathological saccadic eye movements. Int J BiomedComput 1988(b); 22: 239-250.
Juhola M. On syntactic pattern recognition methods in computer analysis of eye movements.Trends Biol Cybern 1990; 1: 33-44.
Juhola M. Computer procedures for verification of nystagmus eye movements in patternrecognition of nystagmus signals. Innov Technol Biol Med 1991(a); 12: 364-374.
Juhola M. Median filtering is appropriate to signals of saccadic eye movements. Comput BiolMed 1991(b); 21: 43-49.
Juhola M. A syntactic analysis method for sinusoidal tracking eye movements. ComputBiomed Res 1991(c); 24: 222-233.
Juhola M, Jäntti V, Pyykkö I. Effect of sampling frequencies on computation of the maximumvelocity of saccadic eye movements. Biol Cybern 1985(b); 53: 67-72.
Juhola M, Jäntti V, Pyykkö I, Magnusson M, Schalén, Åkesson M. Detection of saccadic eyemovements using a non-recursive adaptive digital filter. Comput Methods ProgramsBiomed 1985(a); 21: 81-88.
Juhola M, Pyykkö I. Effect of sampling frequencies on the velocity of slow and fast phases ofnystagmus. Int J Biomed Comput 1987; 20: 253-263.
Juhola M, Pyykkö I, Aalto H. A microcomputer system for clinical signal analysis of vestibularlaboratory. J Med Syst 1989; 13: 205-213.
Juhola M, Pyykkö I, Aalto H. Computer analysis of sinusoidal eye movements using patternrecognition. Acta Otolaryngol Suppl (Stockh) 1991; 481: 466-467.
Juhola M, Pyykkö I, Aalto H, Setälä K. Using magnetic coil signals with EOG signals incomputer analysis of vestibulo-ocular reflex. Acta Otolaryngol (Stockh) 1995; Suppl 520:279-281.
Jürgens R, Becker W, Kornhuber HH. Natural and drug-induced variations of velocity andduration of human saccadic eye movements: Evidence for a control the neural pulsegenerator by local feedback. Biol Cybern 1981; 39: 87-96.
Kalesnykas RP, Hallet PE. The differentiation of visually guided and anticipatory saccades ingap and overlap paradigms. Exp Brain Res 1987; 68: 115-121.
Kanayama R, Nakamura T, Sano R, Ohki M, Okuyama T, Kimura Y, Koike Y. Effect of aging onsmooth pursuit eye movement. Acta Otolaryngol (Stockh) Suppl 1994; 511: 131-134.
Kapoula ZA, Robinson DA, Hain TC. Motion of the eye immediately after a saccade. Exp BrainRes 1986; 61: 386-394.
Kase CS, White JL, Joslyn JM, Williams JP, Mohr JP. Cerebellar infarction in the superiorartery distribution. Neurology 1985; 35: 705-711.
Kato I, Watanabe J, Nakamura T, Harada K, Hasegawa R, Kanyama R, Ikarashi T, Koike Y.Electronystagmographic assessment of cerebellar lesions. Auris Nasus Larynx Suppl 1986;13(II): 171-180.
132
Keating EG. Frontal eye field lesions impair predictive and visual-guided pursuit movements.Exp Brain Res 1991; 86: 311-323.
Keating EG, Goolev SG, Kenney DV. Impaired tracking and loss of predictive eye movementsafter removal of the frontal eye fields. Soc Neurosci Abstr 1985; 11: 472.
Keller EL. Participation of the medial pontine reticular formation in eye movement generationin monkey. J Neurophysiol 1974; 37: 316-332.
Keller EL. Cerebellar involvement in smooth pursuit eye movement generation. In: CliffordRose F, Kennard C, eds. Physiological Aspects of Clinical Neuro-Ophthalmology. London:Chapman and Hall 1988: 341-355.
Keller EL, Crandall W. Neuronal activity in the nucleus reticularis tegmenti pontis in alertmonkey. Soc Neurosci Abstr 1980; 6: 477.
Keller EL, Heinen SJ. Generation of smooth-pursuit eye movements: neuronal mechanismsand pathways. Neurosci Res 1991; 11: 79-107.
Kemper T. Neuroanatomical and neuropathological changes in normal aging and in dementia.In: Albert ML, ed. Clinical Neurology of Aging. New York: Oxford University Press 1984; 9-52.
Kentala E, Pyykkö I, Auramo Y, Juhola M. Otoneurological expert system. Ann Otol RhinolLaryngol 1996(a); 105: 654-658.
Kentala E, Pyykkö I, Auramo Y, Juhola M. Characteristics of six otologic diseases involvingvertigo. Am J Otol 1996(b), 17: 883-892.
Kentala E, Viikki K, Pyykkö I, Juhola M. Production of diagnostic rules from a neurotologicdatabase with decision trees. Ann Otol Rhinol Laryngol (in press).
Kiang N. An auditory physiologist’s view of Menière’s disease. In: Nadol HB, ed. SecondInternational Symposium on Menière’s Disease. Amsterdam: Kugler and Ghedini 1989: 13-24.
Kowler E. Cognitive expectations, not habits, control anticipatory smooth oculomotor pursuit.Vision Res 1989; 9: 1049-1057.
Kowler E, Steinman RM. The effect of slow oculomotor control - III. Guessing unpredictabletarget displacements. Vision Res 1981; 21: 191-203.
Kretschmann HJ, Weinrich W. Cranial neuroimaging and clinical neuroanatomy: Magneticresonance imaging and computed tomography. New York: Thieme Medical Publishers Inc.1992.
Kumar A, Mahmood M, Vassalli L, Appelbaum EL. Intracranial and intratemporalmeningiomas with primary otologic symptoms. Otolaryngol Head Neck Surg 1988; 99: 444-454.
Künzle H, Akert K. Efferent connections of cortical area 8 (frontal eye field) in Macacafascicularis. A reinvestigation using the autoradiographic technique. J Comp Neurol 1977;173: 147-164.
Kuypers HG, Lawrence DG. Cortical projections to the red nucleus and the brain stem in therhesus monkey. Brain Res 1967; 4: 151-188.
Lalwani AK. Meningiomas, epidermoids and other nonacoustic tumors of the cerebellopontineangle. Otolaryngol Clin N Am 1992; 25: 707-728.
Lange G. Die intratympanale Behandlung des Morbus Menière mit ototoxischen Antibiotika.Laryng Rhinol 1977; 56: 409-414.
Langer TP, Fuchs AF, Chubb MC, Scudder C. Afferent projections to the monkey flocculus. SocNeurosci Abstr 1980; 6: 477.
Langer TP, Fuchs AF, Chubb MC, Scudder C. Afferents to the flocculus of the cerebellum inthe Rhesus macaque as revealed by retrograde transportation of horseradish peroxidase. JComp Neurol 1985(a); 235: 1-25.
Langer T, Fuchs AF, Chubb MC, Scudder CA, Lisberger SG. Floccular efferents in the rhesusmacaque as revealed by autoradiography and horseradish peroxidase. J Comp Neurol1985(b); 235: 26-37.

133
Lanser MJ, Sussman SA, Frazer K. Epidemiology, pathogenesis and genetics of acoustictumors. Otolaryngol Clin N Am 1992; 25: 499-520.
Larsby B, Thell J, Möller C, Ödkvist L. The effect of stimulus predictability and age on humantracking eye movements. Acta Otolaryngol (Stockh) 1988; 105: 21-30.
Lehtinen I, Lang AH, Jäntti V, Keskinen E. Acute effects of alcohol on saccadic eye movements.Psychopharmacol 1979; 63: 17-23.
Leichnetz GR. Connections between the frontal eye field and pretectum in the monkey: Ananterograde/retrograde study using HRP gel and TMB neurohistochemistry. J CompNeurol 1982; 207: 394-402.
Leigh RJ, Zee DS. The saccadic system.. In: Leigh RJ, Zee DS. The Neurology of EyeMovements. Philadelphia: FA Davis Co 1983(a): 39-68.
Leigh RJ, Zee DS. Smooth pursuit and ocular stabilization. In : Leigh RJ, Zee DS. TheNeurology of Eye Movements. Philadelphia: FA Davis Co 1983(b): 69-88.
Leigh RJ, Tusa RJ. Disturbance of smooth pursuit caused by infarction of occipitoparietalcortex. Ann Neurol 1985; 17: 185-187.
Lemij HG, Collewijn H. Differences in accuracy of human saccades between stationary andjumping targets. Vision Res 1989; 29: 1737-1748.
Lewis RF. Vertigo: Some uncommon causes of a common problem. Semin Neurol 1996; 16: 55-62.
Lewis RF, Zee DS, Gaymard BM, Guthrie BL. Extraocular muscle proprioception functions inthe control of ocular alignment and eye movement conjugacy. J Neurophysiol 1994; 72:1028-1031.
Linville DG, Arneric SP. Cortical cerebral blood flow governed by the basal forebrain: Age-related impairments. Neurobiol Aging 1991; 12: 503-510.
Lisberger SG. The signal processing and function of the flocculus during smooth pursuit eyemovement in the monkey. Exp Brain Res Suppl 1982; 6: 501-514.
Lisberger SG, Evinger C, Johanson GW, Fuchs AF. Relationship between eye acceleration andretinal image velocity during foveal smooth pursuit in man and monkey. J Neurophysiol1981; 46: 229-249.
Lisberger SG, Fuchs AF. Role of primate flocculus during rapid behavioral modification ofvestibulo-ocular reflex. I. Purkinje cell activity during visually guided horizontal smoothpursuit eye movement and passive head rotation. J Neurophysiol 1978; 41: 733-763.
Lisberger SG, Westbrook LE. Properties of visual inputs that initiate horizontal smooth pursuiteye movements in monkeys. J Neurosci 1985; 5: 1662-1673.
Lo WWM. Imaging of the cerebellopontine angle. In: Jackler RK, Brackmann DE, eds.Neurotology. St. Louis: Mosby 1994: 361-398.
Luh KE, Butter CM, Buchtel HA. Effects of unilateral superior temporal sulcus lesions onvisual orientation in monkeys. Soc Neurosci Abstr 1984; 10: 59.
Luria AR, Karpov BA, Yarbuss AL. Disturbances of active visual perception with lesions of thefrontal lobes. Cortex 1966; 2: 202-212.
Luschei ES, Fuchs AF. Activity of brain stem neurons during eye movements of alert monkeys.J Neurophysiol 1972; 35: 445-461.
Lynch JC, Mountcastle VB, Talbot WH, Yin TCT. Parietal lobe mechanisms for directed visualattention. J Neurophysiol 1977; 40: 362-389.
Maciewicz RJ, Eagen K, Kaneko CRS, Highstein SM. Vestibular and medullary brain stemafferents to the abducens nucleus in cat. Brain Res 1977; 123: 229-240.
Mack A, Fendrich R, Wong E. Is perceived motion a stimulus for smooth pursuit. Vision Res1982; 22 77-88.
Maekawa K, Simpson J. Climbing fiber responses evoked in vestibulocerebellum of rabbit fromvisual system. J Neurophysiol 1973; 36: 649-666.
Magnusson M, Norrving B. Cerebellar infarctions and ‘vestibular neuritis’. Acta Otolaryngol(Stockh) Suppl. 1993; 503: 64-66.

134
Majima A, Miyake S, Awaya A. Studies of the velocity of saccadic eye movements with specialreference to aging changes. Acta Soc Ophthal Jap 1981; 85: 2103-2107.
Mastaglia FL, Black JL, Collins DWK. Quantitative studies of saccadic and pursuit eyemovements in multiple sclerosis. Brain 1979; 102: 817-834.
May JG, Andersen RA. Different patterns of corticopontine projections from separate corticalfields within the inferior parietal lobule and dorsal prelunate gyrus of the macaque. ExpBrain Res 1986; 63: 265-278.
May JG, Keller EL, Suzuki DA. Smooth-pursuit eye movement deficits with chemical lesions inthe dorsolateral pontine nucleus of the monkey. J Neurophysiol 1988; 59: 952-957.
Mayfrank L, Mobashery M, Kimmig H, Fischer B. The role of fixation and visual attention inthe occurrence of express saccades in man. Eur Arch Psychiatr Neurol Sci 1986; 235: 269-275.
McCabe BF. Autoimmune sensorineural hearing loss. Ann Otol Rhinol Laryngol 1979; 88: 585.
McKenna MJ, Ojemann RG, Nadol JB. Management of acoustic neuroma. In: English GM, ed.Otolaryngology. Philadelphia: J. B. Lippincott Company 1993(5); 5: 1-32.
McKenzie A, Lisberger SG. Properties of signals that determine the amplitude and direction ofsaccadic eye movements in monkeys. J Neurophysiol 1986; 56: 196-207.
McMasters RE, Weiss AH, Carpenter MB. Vestibular projections to the nuclei of theextraocular muscles. Degeneration resulting from discrete partial lesions of the vestibularnuclei in the monkey. Am J Anat 1966; 118: 163-194.
Meyer CH, Lasker AG, Robinson DA. The upper limit of human smooth pursuit velocity. VisionRes 1985; 25: 561-563.
Michael JA, Melvill Jones G 1966. Dependence of visual tracking capability upon stimuluspredictability. Vision Res 1966; 67: 707-716.
Miller JE. Aging changes in extraocular muscle. In: Lennerstrand G, Bach-y-Rita P, eds. BasicMechanisms of Ocular Motility and Their Clinical Implications. Oxford: Pergamon Press1975; 47-61.
Miller LK. Eye movement latency as a function of age, stimulus uncertainty and position in thevisual field. Percept Motor Skills 1969; 28: 631-636.
Mira E, Buizza A, Magenes G, Manfrin M, Schmid R. Expert system as a diagnostic aid inotoneurology. J Oto-Rhino-Lary 1990; 52: 96-103.
Mohindra I, Zwaan J, Held R, Brill S, Zwaan R. Development of acuity and stereopsis ininfants with esotropia. Ophthalmologica 1985; 92: 691-697.
Monsell E. New and revised reporting guidelines from the Committee on Hearing andEquilibrium. Otolaryngol Head Neck Surg 1995; 113: 176-178.
Morrow MJ, Sharpe JA. Smooth pursuit initiation in young and elderly subjects. Vision Res1993; 33: 203-210.
Moschner C, Baloh RW. Age-related changes in visual tracking. J Gerontol 1994; 49: M235-238.
Mrazek J. ENG findings in 47 acoustic neurinomas. Cesk Otolaryngol 1989; 38: 297-301.
Mustari MJ, Fuchs AF, Wallman J, Langer TP, Kaneko CRS. Visual and oculomotor responseproperties of single units in the lateral terminal nucleus (LTN) of the behaving rhesusmacaque. Soc Neurosci Abstr 1986; 12: 459.
Nager GT, Masica DN. Meningiomas of the cerebellopontine angle and their relation to thetemporal bone. Laryngoscope 1970; 80: 863-895.
Nager GT, Heroy J, Hoeplinger M. Meningiomas invading the temporal bone with extension tothe neck.. Am J Otolaryngol 1983; 4: 297-324.
Nedzelski JM. Cerebellopontine angle tumors: Bilateral flocculus compression as cause ofassociated oculomotor abnormalities. Laryngoscope 1983; 93: 1251-1260.
Nedzelski J, Tator C. Other cerebellopontine angle (non-acoustic neuroma) tumors. JOtolaryngol 1982; 11: 248-52.

135
Netter. 1991. Plate 109. In : Atlas of Human Anatomy. [computer file]. Basel, Switzerland:Ciba Ceigy Corporation Ltd.
Newsome WT, Wurtz RH, Dürsteler MR, Mikami A. Deficits in visual motion processingfollowing ibotenic acid lesions of the middle temporal visual area of the macaque monkey.J Neurosci 1985; 5: 825-840.
Noda H. Cerebellar control of saccadic eye movements: Its neural mechanisms and pathways.Jpn J Physiol 1991; 41: 351-368.
Noda H, Fujikado T. Involvement of Purkinje cells in evoking saccadic eye movements bymicrostimulation of the posterior cerebellar vermis of monkeys. J Neurophysiol 1987(a);57: 1247-1261.
Noda H, Fujikado T. Topography of the oculomotor area of the cerebellar vermis in macaquesas determined by microstimulation. J Neurophysiol 1987(b); 58: 359-378.
Noda H, Ikeda Y. Pathways of axons of oculomotor neurons in the fastigial nucleus of macaquemonkey. Soc Neurosci Abstr 1989; 8: 239.
Noda H, Murakami S, Warabi T. Effects of fastigial stimulation upon visually-directed saccadesin macaque monkeys. Neurosci Res 1991; 10: 188-199.
Noda H, Murakami S, Yamada J, Tamaki Y, Aso T. Saccadic eye movements evoked bymicrostimulation of the fastigial nucleus of the macaque monkeys. J Neurophysiol 1988;60: 1036-1052.
Noda H, Sugita S, Ikeda Y. Afferent and efferent connections of the oculomotor region of thefastigial nucleus in the macaque monkey. J Comp Neurol 1990; 302: 330-348.
Noda H, Suzuki DA. The role of flocculus of the monkey in saccadic eye movements. J Physiol1979; 294: 317-334.
Noda H, Warabi T. Eye position signals in the flocculus of the monkey during smooth pursuiteye movements. J Physiol 1982; 324: 187-202.
Nodes TA, Gallagher NC. Median filters: Some modifications and their properties. IEEE TransAcoust Speech Signal Process 1982; 30: 739-746.
Norris H. The action of sedatives on brain stem oculomotor system in man. Neuropharmacol1971; 10: 181-191.
Norusis MJ. SPSS for Windows, Base System User’s Guide, Release 6.0. Chicago: SPSS Inc.,1993. 828 pp.
Norusis MJ. SPSS Advanced Statistics 6.1. Chicago: SPSS Inc., 1994a. 606 pp.
Norusis MJ. SPSS Professional Statistics 6.1. Chicago: SPSS Inc., 1994b. 385 pp.
Nyby O, Jansen J. An experimental investigation of the corticopontine projection in Macacamulatta. Skr Utg Nor Vidensk-Akad 1951; 3: 1-47.
Oas JG, Baloh RW. Vertigo and anterior inferior cerebellar artery syndrome. Neurology 1992;42: 2274-2279.
Ödkvist LM. Otoneurological diagnostics in posterior fossa lesions. Acta Otolaryngol (Stockh)Suppl. 1988; 452: 12-15.
Ödkvist LM. Middle ear ototoxic treatment for inner ear disease. Acta Otolaryngol (Stockh)Suppl. 1988; 457: 83-86.
Ödkvist LM, Bergholtz LM, Lundgren A. Topical gentamycin treatment for disabling Menière’sdisease. Acta Otolaryngol Suppl. (Stockh) 1984; 412: 74-80.
Olivecrona H. The cerebellar angioreticulomas. J Neurosurg 1952; 9: 317-330.
Optican LM, Robinson DA. Cerebellar-dependent adaptive control of primate saccadic system.J Neurophysiol 1980; 44: 1058- 1076.
Optican LM, Zee DS, Miles FA. Floccular lesions abolish adaptive control of post-saccadicocular drift in primates. Exp Brain Res 1986; 64: 596-598.
Optican LM, Zee DS, Miles FA, Lisberger SG. Oculomotor deficits in monkeys with floccularlesions. Soc Neurosci Abstr 1980; 6: 474.
136
Ottes FP, van Gisbergen JAM, Eggermont JJ. Metrics of saccade responses to visual doublestep stimuli: Two different modes. Vision Res 1984; 24: 1169-1179.
Paige GD. Senescence of human visual-vestibular interactions: Smooth pursuit, optokineticand vestibular control of eye movements with aging. Exp Brain Res 1994; 98: 355-372.
Pappas DG, Banyas JB. A newly recognized etiology of Menière’s syndrome. A preliminaryreport. Acta Otolaryngol (Stockh) Suppl. 1991; 485: 104-107.
Pearson BW, Brackmann DE. Committee on hearing and equilibrium guidelines for reportingtreatment results in Menière’s disease. Otolaryngol Head Neck Surg 1985; 93: 579-581.
Petras JM. Connections of the parietal lobe. J Psychiat Res 1971; 8: 189-201.
Pierrot-Deseilligny C, Amarenco P, Roullet E, Marteau R. Vermal infarct with pursuit eyemovement disorders. J Neurol Neurosurg Psychiatry 1990; 53: 519-521.
Pola J, Wyatt HJ. Target position and velocity: The stimuli for smooth pursuit eye movements.Vision Res 1980; 20: 523-533.
Pyykkö I, Aalto H, Starck J. Visual control in Menière’s disease when studied on movingplatform. In: Taguchi K, Igarashi M, Mori S, eds. Vestibular and Neural Front. Amsterdam:Elsevier 1994(a): 505-508.
Pyykkö I, Dahlen AI, Schalén L, Hindfelt B. Eye movements in patients with speech dyspraxia.Acta Otolaryngol (Stockh) 1984 ;98: 481-489.
Pyykkö I, Ishizaki H, Aalto H, Kaasinen S. Postural compensation after gentamicin treatmentof Menière’s disease. In: Taguchi K, Igarashi M, Mori S, eds. Vestibular and Neural Front.Amsterdam: Elsevier 1994(b): 287-290.
Pyykkö I, Schalén L. Evaluation of tests for the detection of central vestibular lesions. In:Oosterveld, WJ, ed. Otoneurology. New York: John Wiley & Sons Inc., 1984: 157-194.
Quinlan JR. Decision trees and decisionmaking. IEEE Transactions on Systems, Man, andCybernetics 1990; 20: 339-346.
Quinlan JR. C4.5: Programs for Machine Learning. San Mateo: Morgan Kaufmann Publishers,1993. 302 pp.
Quinlan JR. 1998. See5, version 1.07a. http://www. rulequest.com/ . [computer program].
Raphan T, Cohen B. Brainstem mechanisms for rapid and slow eye movements. Ann RevPhysiol 1978; 40: 527-552.
Rashbass C. The relationship between saccadic and smooth tracking eye movements. JPhysiol 1961; 159: 326-338.
Rauch SD, Merchant SN, Thedinger BA. Menière’s syndrome and endolymphatic hydrops: Adouble-blind temporal bone study. Ann Otol Rhinol Laryngol 1989; 98: 873-883.
Rauch SD, San Martin JE, Moscicki RA, Bloch KJ. Serum antibodies against heat shockprotein 70 in Menière’s disease. Am J Otol 1995; 16: 648-652.
Resche F, Moisan JP, Mantoura J, de Kersaint-Gilly A, Andre MJ, Perrin-Resche I, Menegalli-Boggelli D, Lajat Y, Richard S. Hemangioblastoma, hemangioblastomatosis, and vonHippel-Lindau disease. In: Symon L, Calliauw L, Cohadon F, Lobo Antunes J, Loew F,Nornes H, Pásztor E, Pickard JD, Strong AJ, Yasargil MG, eds. Advances and TechnicalStandards in Neurosurgery. Wien: Springer-Verlag 1993: 197-304.
Riggs LA, Volkman FC, Moore RK, Ellicott AG. Perception of suprathreshold stimuli duringsaccadic eye movement. Vision Res 1982; 22: 423-428.
Robinson DA. A method of measuring eye movement using a scleral search coil in a magneticfield. IEEE Trans Biomed Electron 1963; BME-10: 137-145.
Robinson DA. The mechanics of human saccadic eye movements. J Physiol 1964; 174: 245-264.
Robinson DA. The mechanics of human smooth pursuit eye movements. J Physiol 1965; 180:569-591.
Robinson DA. Oculomotor unit behavior in the monkey. J Neurophysiol 1970; 33: 393-404.

137
Robinson DA. Eye movements evoked by collicular stimulation in the alert monkey. Vision Res1972; 12: 1795-1808.
Robinson DA. Oculomotor control signals. In: Lennerstrand X, Bach-y-Rita P, eds. BasicMechanisms of Ocular Motility and Their Clinical Implications. New York: Pergamon 1975:337-374.
Robinson DA. Adaptive gain control of vestibuloocular reflex by the cerebellum. JNeurophysiol 1976; 39: 954-969.
Robinson DA. The control of eye movements. In: Brooks VB, ed. Handbook of Physiology, Sect1, Vol 2, Part 2. Bethesda, Maryland: American Physiological Society 1981: 1275-1320.
Robinson DA. Plasticity in the oculomotor system. Fed Proc 1982; 4: 2153-2155.
Robinson DA, Fuchs AF. Eye movements evoked by stimulation of frontal eye fields. JNeurophysiol 1969; 32: 637-648.
Robinson DL, Goldberg ME, Stanton GB. Parietal association cortex in the primate: Sensorymechanisms and behavioral modulations. J Neurophysiol 1978; 41: 910-932.
Robinson DA, Kapoula Z, Goldstein HP. Holding the eye still after a saccade. In: Deecke L,Eccles JC, Mountcastle VB, eds. Berlin: Springer-Verlag 1990: 89-96.
Robinson DA, Keller EL. The behavior of eye movement motoneurons in the alert monkey. BiblOphthal 1972; 82: 7-16.
Rosenberg SI, Silverstein H, Gordon MA, Flanzer JM. A comparison of growth rates of acousticneuromas: Nonsurgical patients vs. subtotal resection. Otolaryngol Head Neck Surg 1993;109: 482-487.
Rosenwasser H. Glomus jugulare tumors. Monograph. Arch Otolaryngol 1968; 88: 3-40.
Rubenstein RL, Norman DM, Schindler RL, Kaseff L. Cerebellar infarction: Presentation ofvertigo. Laryngoscope 1980; 90: 505-514.
Rubin W, Busis SN, Brookler KH. Otoneurologic examination. In: English GM, ed.Otolaryngology. Philadelphia: J. B. Lippincott Company 1993; (1) 9: 1-47.
Rubinstein LJ.. Tumors of the Central Nervous System. Washington DC: Armed Forces Instituteof Pathology, 1972. 400 pp.
Ruckenstein MJ, Cueva RA, Morrison DH, Press G. A prospective study of ABR and MRIscreening for vestibular schwannomas. Am J Otol 1996; 17 : 317-320.
Russel DS, Rubenstein LJ. Pathology of Tumors of the Nervous System, 5th ed. Baltimore:
Williams & Wilkins, 1989. 1012 pp.
Saslow MG. Latency for saccadic eye movement. J Optic Soc Am 1967; 57: 1030-1033.
Schalén L. 1981. Saccades, fast phases of nystagmus and tracking eye movements in man. Anelectro-oculographic study. Ph.D. diss., University of Lund.
Schalén L, Henriksson NG, Pyykkö I. Quantification of tracking eye movements in patientswith neurological disorders. Acta Otolaryngol (Stockh) 1982; 93: 387-95.
Scherer H, Teiwes W, Clarke AH. Measuring three dimensions of eye movement in dynamicsituations by means of videooculography. Acta Otolaryngol (Stockh) 1991; 111: 182-187.
Schiller PH. The discharge characteristics of single units in the oculomotor and abducensnuclei of the unanesthetized monkey. Exp Brain Res 1970; 10: 347-362.
Schiller PH, Sandell JH, Maunsell JH. The effect of frontal eye field and superior colliculuslesions on saccadic latencies in the rhesus monkey. J Neurophysiol 1987; 57: 1033-1049.
Schiller PH, True SD, Conway JL. Deficits in eye movements following frontal eye field andsuperior colliculus ablations. J Neurophysiol 1980; 44: 1175-1189.
Schlag J, Merker B, Schlag-Rey M. Comparison of EOG and search coil techniques in long-term measurements of eye position in alter monkey and cat. Vision Res 1983; 23: 1025-1030.
Schmidt D, Abel LA, Dell’Osso LF, Daroff RB. Saccadic velocity characteristics: Intrinsicvariability and fatigue. Aviat Space Environ Med 1979; 50: 393-395.
138
Schuknecht H. Ablation therapy in the management of Menière’s disease. Acta OtolaryngolSuppl. (Stockh) 1957; 132: 1-42.
Scudder CA. A new local feedback model of the saccadic burst generator. J Neurophysiol 1988;59: 1455-1475.
Selesnick SH, Jackler RK. Clinical manifestations and audiologic diagnosis of acousticneuromas. Otolaryngol Clin N Am 1992; 25: 521-551.
Selesnick SH, Jackler RK, Pitts LW. The changing clinical presentation of acoustic tumors inthe MRI era.. Laryngoscope 1993; 103: 431-436.
Selhorst JB, Stark L, Ochs AL, Hoyt WF. Disorders in cerebellar ocular motor control. I.Saccadic overshoot dysmetria. An oculographic, control system and clinico-anatomicalanalysis. Brain 1976; 99: 497-508.
Selkoe D, Kosik K. Neurochemical changes with aging. In: Albert ML, ed. Clinical Neurology ofAging. New York: Oxford University Press 1984: 53-75.
Shaan M, Vassalli L, Landolfi M, Taibah A, Russo A, Sanna M. Atypical presentation ofacoustic neuroma. Otolaryngol Head Neck Surg 1993; 109: 865-870.
Shagass C, Roemer RA, Amadeo M. Eye-tracking performance and engagement of attention.Arch Gen Psychiatry 1976; 33: 121-125.
Sharpe JA, Sylvester TO. Effect of aging on horizontal smooth pursuit. Invest Ophthalmol VisSci 1978; 17: 465-468.
Sharpe JA, Zackon DH. Senescent saccades. Effects of aging on their accuracy, latency andvelocity. Acta Otolaryngol (Stockh) 1987; 104: 422-428.
Shinnar S, Maciewicz RJ, Shofer RJ. A raphe projection to cat cerebellar cortex. Brain Res1973; 97: 139-143.
Siever LJ, Coursey RD, Alterman IS, Zahn T, Brody L, Bernard B, Buchsbaum M, Lake CR,Murphy DL. Clinical, psychophysiological and neurological characteristics of volunteerswith impaired smooth pursuit eye movements. Biol Psychiatry 1989; 26: 36-51.
Simpson J, Alley K. Visual climbing fiber input to rabbit vestibulo-cerebellum: A source ofdirection-specific information. Brain Res 1974; 82: 302-308.
Smith WM, Warter PJ Jr. Eye movement and stimulus movement; new photoelectricelectromechanical system for recording and measuring tracking motions of the eye. J OptSoc Amer 1960; 50: 245-250.
Solingen LD, Baloh RW, Myers L, Ellison G. Subclinical movements disorders in patients withmultiple sclerosis. Neurology 1977; 27: 614-619.
Sörensen LK, Theilgaard A, Thomsen J, Zilsdorff K. Menière’s disease. A neuropsychologicalstudy. Acta Otolaryngol (Stockh) 1977; 83: 266-271.
Sparks DL, Mays LE. Signal transformations required for the generation of saccadic eyemovements. Annu Rev Neurosci 1990; 13: 309-336.
Sparks DL, Mays LE, Porter JD. Eye movements induced by pontine stimulation: Interactionwith visually triggered saccades. J Neurophysiol 1987; 58: 300-318.
Spooner JW, Sakala SM, Baloh RW. Effect of aging on eye tracking. Arch Neurol 1980; 37:575-576.
Stanton GB, Bruce C, Goldberg ME. Organization of subcortical projections from saccadic eyemovement sites in the macaque’s frontal eye fields. Soc Neurosci Abstr 1982; 8: 293.
Stark L, Vossius G, Young LR. Predictive Control of Eye Tracking Movements. IRE Trans HumFactors Electron 1962; 3: 52-56.
St-Cyr GJ, Fender DH. Nonlinearities of the human oculomotor system: Gain. Vision Res1969; 9: 1235-1246.
Suzuki DA, Keller EL. Sensory-oculomotor interactions in primate cerebellar vermis: A role insmooth pursuit control. Soc Neurosci Abstr 1983; 9: 606.
Suzuki DA, Keller EL. Visual signals in the dorsolateral pontine nucleus of the alert monkey:Their relationship to smooth pursuit eye movements. Exp Brain Res 1984; 53: 473-478.
139
Suzuki DA, May J, Keller EL. Smooth-pursuit eye movement deficits with pharmacologicallesions in monkey dorsolateral pontine nucleus. Soc Neurosci Abstr 1984; 10: 58.
Suzuki DA, Yee RD, Betelak K. Deficits in smooth-pursuit eye movements following lidocaineinjection in monkey nucleus reticularis tegmenti pontis (NRTP). Soc Neurosci Abstr 1990;16: 903.
Takagi M, Zee DS, Tamargo RJ. Effects of lesions of the oculomotor vermis on eye movementsin primates: Saccades. J Neurophysiol 1998; 80: 1911-1931.
Takemori S, Cohen B. Loss of visual suppression of vestibular nystagmus after flocculuslesions. Brain Res 1974; 72: 213-224.
Takemori S, Ida M. Saccades - Random or constant stimuli and predictive adaptability. ORL JOto-Rhino-Lary 1984; 46: 310-317.
Tedeschi G, di Constanzo A, Allocca S, Quattrone A, Casucci G, Russo L, Bonavita V. Age-dependent changes in visually guided saccadic eye movements. Funct Neurol 1989; 4:363-367.
Tedeschi G, Quattrone A, Bonavita V. Saccadic eye movement analysis as a measure of drugeffect on central nervous system function. Ital J Neurol Sci 1986; 7: 223-231.
Telischi FF, Lo WWM, Arriaga MA, De la Cruz A. Lateral extent of internal auditory canalinvolvement by acoustic neuromas: a surgical-radiologic correlation. Am J Otol 1993; 14:446-450.
Thomsen J. Cerebellopontine angle tumors, other than acoustic neuromas. Acta Otolaryngol(Stockh) 1976; 82: 106-111.
Tijssen MA, Straathof CS, Hain TC, Zee DS. Optokinetic afternystagmus in humans: normalvalues of amplitude, time constant, and asymmetry. Ann Otol Rhinol Laryngol 1989; 98:741-746.
Troost BT, Daroff RB. The ocular motor defects in progressive supranuclear palsy (PSP). AnnNeurol 1977; 2: 397-403.
Tychsen L, Lisberger SG. Maldevelopment of visual motion processing in humans who hadstrabismus with onset in infancy. J Neurosci 1986; 6: 2495-2508.
Ungerleider LG, Desimone R, Galkin TW, Mishkin M. Cortical projections of area MT in themacaque. J Comp Neurol 1984; 223: 368-386.
Van den Berg AV. Human smooth pursuit during transient perturbations of predictable andunpredictable target movement. Exp Brain Res 1988; 72: 95-108.
Van den Berg AV, Collewijn H. Human smooth pursuit: Effects of stimulus extent and ofspatial and temporal constraints of the pursuit trajectory. Vision Res 1986; 29: 1209-1222.
Van Opstal AJ, van Gisbergen JAM. Scatter in the metrics of saccades and properties of thecollicular motor map. Vision Res 1989; 29: 1183-1196.
Versino M, Cosi V. Quantitative evaluation of smooth pursuit eye movements by personalcomputer. 1) Normative data and effect of aging. Boll Soc It Biol Sper 1990; 66 : 701-708.
Versino M, Beltrami G, Zambarbieri D, Castelnovo G, Bergamaschi R, Romani A, Cosi V. Aclinically oriented approach to smooth pursuit eye movement quantitative evaluation. ActaNeurol Scand 1993a; 88: 273-278.
Versino M, Castelnovo G, Bergamaschi R, Romani A, Beltrami G, Zambarbieri D, Cosi V.Quantitative evaluation of saccadic and smooth pursuit eye movements: Is it reliable?Invest Ophthal Vis Sci 1993(b); 34: 1702-1709.
Waespe W, Cohen B, Raphan T. Role of the flocculus and paraflocculus in optokineticnystagmus and visual-vestibular interactions: effects of lesions. Exp Brain Res 1983; 50:9-33.
Warabi T, Kase M, Karo T. Effect of aging on the accuracy of visually guided saccadic eyemovement. Ann Neurol 1984; 16: 449-454.
Watanabe S, Kato I, Takahashi K. Alterations of eye movements induced by visual stimulationin a patient with acute cerebellar infarction. Acta Otolaryngol (Stockh) 1996; Suppl 522:47-52.
140
Weber RB, Daroff RB. Metrics of horizontal saccadic eye movements in normal humans. VisionRes 1971; 11: 921-928.
Weber RB, Daroff RB. Corrective movements following refixation saccades: Type and controlsystem analysis. Vision Res 1972; 12: 467-475.
Welling DB, Glasscock ME, Woods CI, Jackson CG. Acoustic neuroma: A cost-effectiveapproach. Otolaryngol Head Neck Surg 1990; 103: 364-370.
Wennmo C. 1982. Eye movement disorders in posterior fossa disorders. An electro-oculographic study. Ph.D. diss., University of Lund.
Wennmo C, Henriksson NG, Pyykkö I, Schalèn L. Eye-velocity programming in brain stemdisorders. Ann NY Acad Sci 1981; 374: 774-783.
Wennmo C, Hindfelt B, Pyykkö I. Eye movements in cerebellar and combined cerebello-brainstem diseases. Ann Otol Rhinol Laryngol 1983; 92: 165-171.
Werner J, Vossius G. Die Informationsverarbeitung der höheren Zentren des Systems derAugenbewegung. Kybernetik 1972; 10: 44-49.
Westheimer G. Mechanism of saccadic eye movements. Arch Ophthalmol 1954a; 52: 710-724.
Westheimer G. Eye movement responses to a horizontally moving visual stimulus. ArchOphthalmol 1954b; 52: 932-941.
Westheimer G, Blair S. Oculomotor defects in cerebellectomized monkeys. Invest Ophthalmol1973; 12: 619-621.
Westheimer G, Blair S. Functional organization of primate oculomotor system revealed bycerebellectomy. Exp Brain Res 1974; 21: 463-472.
Wheeless LL, Boynton RM, Cohen GH. Eye movement responses to step and pulse-stepstimuli. J Opt Soc Am. 1966; 56: 956-960.
Whitaker LA, Shoptaugh CF, Haywood KM. Effect of age on horizontal eye movement latency.Am J Optom & Physiol Optics 1986; 63: 152-155.
Wilkinson IMS, Kime R, Purnell M. Alcohol and human eye movement. Brain 1974; 97: 785-792.
Wilson DF, Hodgson RS, Gustafson MF, Hogue S, Mills L. The sensitivity of auditory brainstemresponse testing in small acoustic neuromas. Laryngoscope 1992; 102 : 961-964.
Wilson ME, Toyne MJ. Retino-tectal and corticotectal projections in Macaca mulatta. BrainRes 1970; 24: 395-406.
Wilson VJ. Physiological pathways through the vestibular nuclei. Rev Neurobiol 1972; 15: 27-81.
Winfield JA, Hendrickson A, Kimm J. Anatomical evidence that the medial terminal nucleus ofthe accessory optic tract in mammals provides a mossy fiber input to the flocculus. BrainRes 1978; 151: 175-182.
Yamada J, Noda H. Afferent and efferent connections of the oculomotor cerebellar vermis inthe macaque monkey. J Comp Neurol 1987; 265: 224-241.
Yasui S, Young LR. Perceived visual motion as effective stimulus to pursuit eye movementsystem. Science 1975; 190: 906.
Yee RD. Downbeat nystagmus: Characteristics and localization of lesions. Trans AmOphthalmol Soc 1989; 87: 984-1032.
Yee RD, Schiller VL, Lim V, Baloh FG, Baloh RW, Honrubia V. Velocities of vertical saccadeswith different eye movement recording methods. Invest Ophthalmol Vis Sci 1985; 26: 938-944.
Young LR, Stark L. Variable feedback experiments testing a sampled data model for eyetracking movements. IEEE Trans Hum Factors Electron 1963; HFE-4: 38-51.
Young LR. Pursuit eye movement - what is being pursued? In: Baker R, Berthoz A, eds. Controlof Gaze by Brain Stem Neurons. Amsterdam: Elsevier 1977: 29-36.
141
Zbar RIS, Megerian CA, Khan A, Rubinstein JT. Invisible culprit: Intralabyrinthineschwannomas that do not appear on enhanced magnetic resonance imaging. Ann OtolRhinol Laryngol 1997; 106: 739-742.
Zee DS, Friendlich AR, Robinson DA. The mechanism of downbeat nystagmus. Arch Neurol1974; 30: 227-237.
Zee DS, Optican LM, Cook JD, Robinson DA, Engel WK. Slow saccades in spinocerebellardegeneration. Arch Neurol 1976a; 33: 243-251.
Zee DS, Tusa RJ, Herdman SJ, Butler PH, Gücer G. Effects of occipital lobectomy upon eyemovements in primate. J Neurophysiol 1987; 58: 883-907.
Zee DS, Yamazaki A, Butler PH, Gücer G. Effects of ablation of flocculus and parafalocculuson eye movements in primate. J Neurophysiol 1981; 46: 878-899.
Zee DS, Yee RD, Cogan DG, Robinson DA, Engel WK. Ocular motor abnormalities in hereditarycerebellar ataxia. Brain 1976(b); 99: 207-234.
Zihl J, von Cramon J, Mai N. Selective disturbance of movement vision after bilateral braindamage. Brain 1983; 106: 313-340.
Zuber BL, Stark L, Cook G. Microsaccades and the velocity-amplitude relationship for saccadiceye movements. Science 1965; 150: 1459-1460.
Zülch KJ. Epidemiology of brain tumors - general statistical and biological data. In: Zülch KJ.ed. Brain Tumors. Their biology and Pathology, 3rd
ed. Berlin: Springer-Verlag, 1986. 704pp.