The housing pathways of income support recipients Presentation to 2nd Australasian Housing...
30
The housing pathways of income support recipients Presentation to 2nd Australasian Housing Researchers’ Conference: Reshaping Australasian Housing Research Dr Tim Seelig University of Queensland Social Research Centre 20 June 2007
-
Upload
arleen-terry -
Category
Documents
-
view
213 -
download
0
Transcript of The housing pathways of income support recipients Presentation to 2nd Australasian Housing...
The housing pathways of income support recipients
Presentation to 2nd Australasian Housing Researchers’ Conference:Reshaping Australasian Housing Research
Dr Tim SeeligUniversity of Queensland Social Research Centre
20 June 2007
2
Concepts of housing consumption patterns over time
• Historically, tenures seen as being rungs of a hierarchical housing ladder, and housing career patterns involving progression to home ownership are under challenge.
• Household mobility suggests less uniformity and certainty in the housing system - there is a growing separation or “disconnectedness” between housing careers and other life course events (Winter and Stone 1999)
• “Housing careers and tenure arrangements are becoming more complex at the same time as the life cycle sequence of household structure is less predictable” Maher (1997: 5)
• Concept of ‘housing pathways’ (Clapham 2002) more helpful in describing how people act upon their changing needs and circumstances over time through changes in housing options and tenure transitions (shaped by choices and constraints).
• The housing consumption patterns of income support recipients (ISRs) over time has received little research attention
3
Background to the study
• Study for AHURI based on analysis of Australian Govt ‘Longitudinal Data Set’, one percent Sample (1995-2003)
• Study has examined income support recipients over time in relation to:– tenures and tenure changes– relationships between tenure changes and changes in
income– tenure changes in and other changes in characteristics or
circumstances– How the relationships and arrangements between tenure
and other factors vary by discrete groups of income support recipients.
4
Methods and data
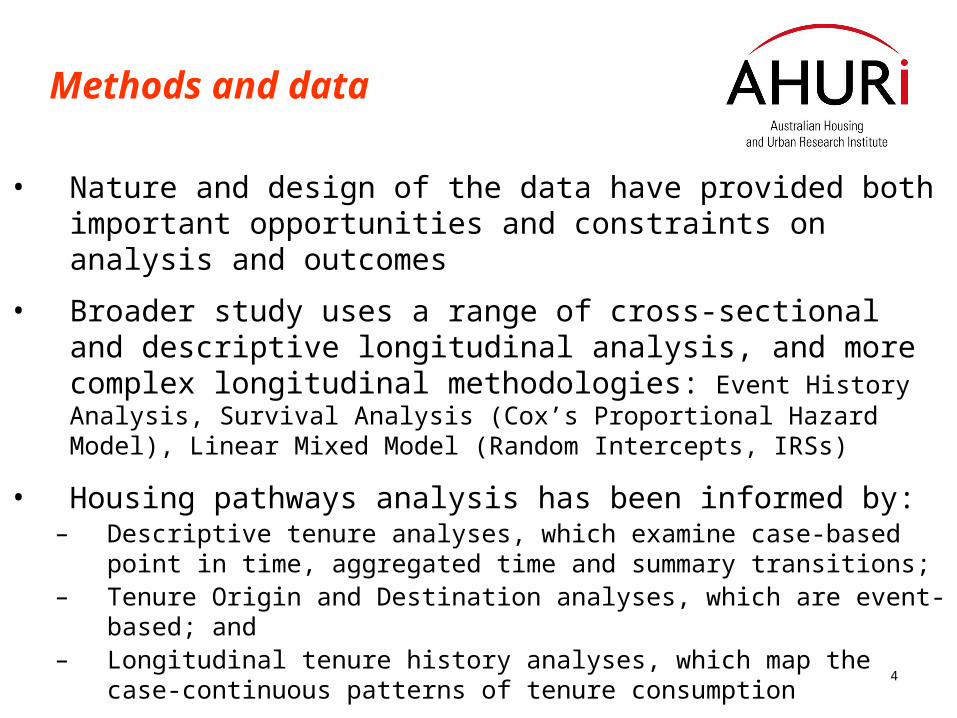
• Nature and design of the data have provided both important opportunities and constraints on analysis and outcomes
• Broader study uses a range of cross-sectional and descriptive longitudinal analysis, and more complex longitudinal methodologies: Event History Analysis, Survival Analysis (Cox’s Proportional Hazard Model), Linear Mixed Model (Random Intercepts, IRSs)
• Housing pathways analysis has been informed by:– Descriptive tenure analyses, which examine case-based point in time,
aggregated time and summary transitions;– Tenure Origin and Destination analyses, which are event-based; and– Longitudinal tenure history analyses, which map the case-continuous
patterns of tenure consumption
5
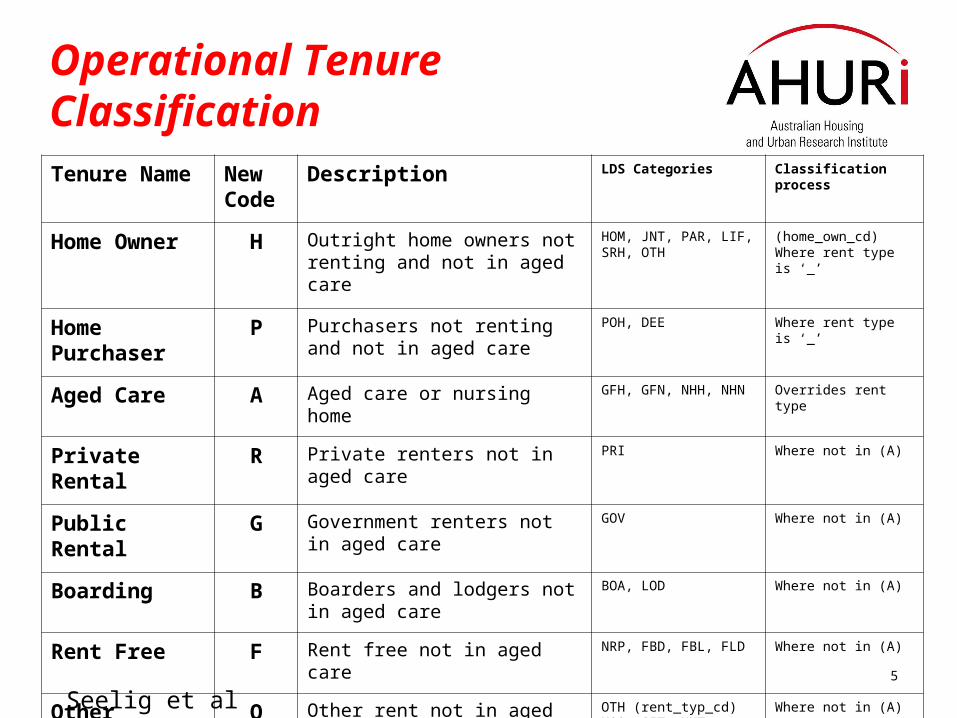
Operational Tenure Classification Tenure Name New
CodeDescription LDS Categories Classification
process
Home Owner H Outright home owners not renting and not in aged care
HOM, JNT, PAR, LIF, SRH, OTH
(home_own_cd) Where rent type is ‘_’
Home Purchaser
P Purchasers not renting and not in aged care
POH, DEE Where rent type is ‘_’
Aged Care A Aged care or nursing home GFH, GFN, NHH, NHN Overrides rent type
Private Rental R Private renters not in aged care PRI Where not in (A)
Public Rental G Government renters not in aged care
GOV Where not in (A)
Boarding B Boarders and lodgers not in aged care
BOA, LOD Where not in (A)
Rent Free F Rent free not in aged care NRP, FBD, FBL, FLD Where not in (A)
Other O Other rent not in aged care OTH (rent_typ_cd) MOO, SIT, MNT
Where not in (A)
Non homeowner
N Cases identifying as 'non-homeowners', but also not identifying rental type
NHO, SRN, PLT SRN or PLT or NHO in home_own_cd and ‘_’ in rent_typ_cd
Seelig et al (forthcoming)

6
Operational Income Support Classifications
New IS name New codes
Description LDS codes Notes
Aged A Age pension and related income support
AGE, MAA
Disability D Disability pension and related income support
DSP, REH, RHB, DWS, SWS
Unemployment U Newstart, youth allowance and other unemployment related income support
NSA, YAL, YTA YAL and YTA apply where activity type code is not ‘FTS’ or ‘ED’
Single parent P Sole parent and related income support
SPP, PPS, WID, PGA
Student S Austudy, youth allowance (students) and study related income support
AUS, YAL, YTA YAL and YTA coded S where activity type code is ‘FTS’ or ‘ED’
Partner allowance
W Income support for partners of others on income support
WFA, WFD, MPA, PGN, PGY, PTA, PA, PGL
Other O Not captured elsewhere All other IS types
Seelig et al (forthcoming)

7
Analysing housing consumption patterns among income support recipients
• The patterns of general housing consumption and transitions by tenure over time (including tenure moves and non-moves) have been tracked, analysed and mapped
• Almost 7,000 separate pathways could be identified; including 32 ‘typical’ housing pathways.
• Among income support recipients (ISRs) studied:– 57% did not change tenure at all while on IS– 22% underwent only one tenure change while on IS– 21% had been in multiple (often quite complex) tenure
transitions
• Longest housing pathways consist of 34 tenure transitions!
8
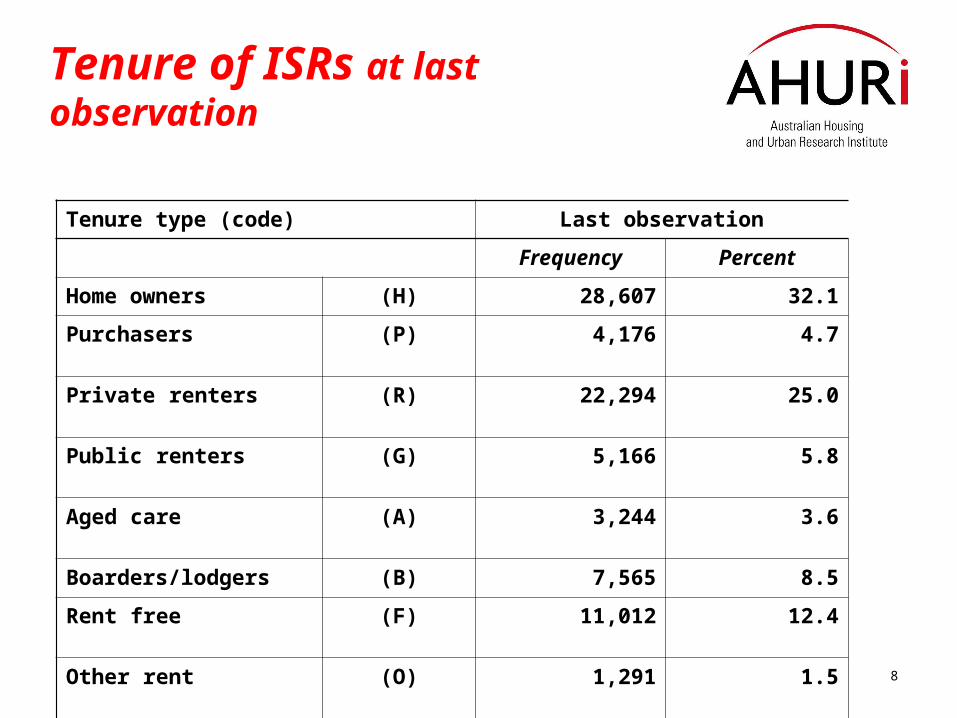
Tenure of ISRs at last observation
Tenure type (code) Last observation
Frequency Percent
Home owners (H) 28,607 32.1
Purchasers (P) 4,176 4.7
Private renters (R) 22,294 25.0
Public renters (G) 5,166 5.8
Aged care (A) 3,244 3.6
Boarders/lodgers (B) 7,565 8.5
Rent free (F) 11,012 12.4
Other rent (O) 1,291 1.5
Non-home owner (N) 5,826 6.5
Total 89,181 100

9
breakdown of IS types within discrete tenures
IS type / tenure Unem-ployment %
Age pension % Disability %
Partner %
Sole parent %
Student %
Other %
TOTAL %
Home owner 12.4 56.0 9.7 11.9 3.9 0.4 5.7 100
Purchasers 36.7 4.2 6.0 28.2 16.3 1.8 6.6 100
Private renters 47.8 8.6 8.0 9.7 13.7 7.5 4.7 100
Public renters 16.0 29.4 23.1 7.4 17.3 0.8 6.0 100
Aged care 0.0 96.2 3.3 0.1 0.1 0.0 0.3 100
Boarder/lodger 53.3 14.7 12.6 1.3 6.7 7.3 4.4 100
Rent free 48.1 13.9 7.3 3.2 5.2 18.9 3.4 100
Other rent 18.0 60.0 11.2 4.8 1.9 0.5 3.6 100
Non-Home Owner 41.2 8.4 3.7 2.1 1.8 41.1 1.8 100
Total 32.0 29.9 9.2 8.7 7.8 7.8 4.6 100
10
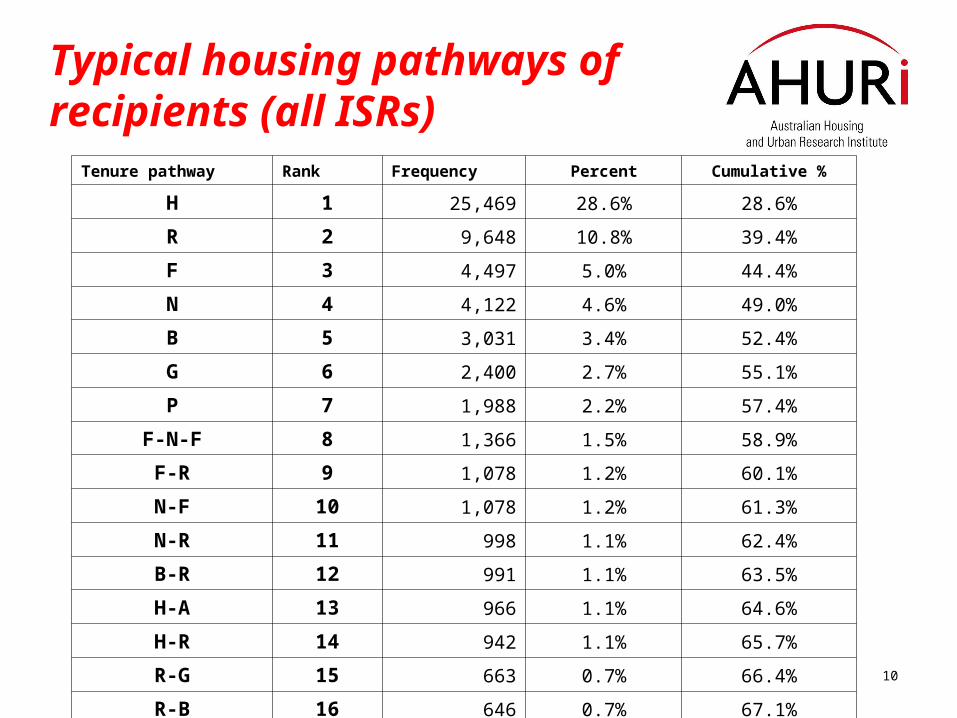
Typical housing pathways of recipients (all ISRs)
Tenure pathway Rank Frequency Percent Cumulative %
H 1 25,469 28.6% 28.6%
R 2 9,648 10.8% 39.4%
F 3 4,497 5.0% 44.4%
N 4 4,122 4.6% 49.0%
B 5 3,031 3.4% 52.4%
G 6 2,400 2.7% 55.1%
P 7 1,988 2.2% 57.4%
F-N-F 8 1,366 1.5% 58.9%
F-R 9 1,078 1.2% 60.1%
N-F 10 1,078 1.2% 61.3%
N-R 11 998 1.1% 62.4%
B-R 12 991 1.1% 63.5%
H-A 13 966 1.1% 64.6%
H-R 14 942 1.1% 65.7%
R-G 15 663 0.7% 66.4%
R-B 16 646 0.7% 67.1%

11
Typical housing pathways of recipients (all ISRs)
Tenure pathway Rank Frequency Percent Cumulative %
R-H 17 618 0.7% 67.8%
R-F 18 589 0.7% 68.5%
F-N 19 517 0.6% 69.1%
R-B-R 20 509 0.6% 69.6%
R-P 21 501 0.6% 70.2%
O 22 449 0.5% 70.7%
H-P 23 446 0.5% 71.2%
F-B 24 436 0.5% 71.7%
R-N-R 25 432 0.5% 72.2%
A 26 430 0.5% 72.7%
B-A 27 383 0.4% 73.1%
R-F-R 28 377 0.4% 73.5%
N-B 29 368 0.4% 73.9%
H-F 30 364 0.4% 74.3%
H-R-H 31 321 0.4% 74.7%
G-R 32 284 0.3% 75.0%

12
Top ten common housing pathways of recipients (Unemployed)
Tenure transitions Rank Frequency Percent
Category Cumulative Category Cumulative
R 1 4612 4612 16.32 16.32
H 2 3236 7848 11.45 27.77
F 3 2093 9941 7.41 35.18
B 4 1527 11468 5.40 40.58
N 5 879 12347 3.11 43.69
P 6 830 13177 2.94 46.63
FR 7 571 13748 2.02 48.65
BR 8 554 14302 1.96 50.61
NR 9 368 14670 1.30 51.91
RB 10 352 15022 1.25 53.16

13
Top ten common housing pathways of recipients (Disability)
Tenure transitions Rank Frequency Percent
Category Cumulative Category Cumulative
H 1 2557 2557 31.74 31.74
R 2 564 3121 7.00 38.74
G 3 474 3595 5.88 44.62
B 4 371 3966 4.60 49.22
FNF 5 237 4203 2.94 52.16
F 6 157 4360 1.95 54.11
RG 7 152 4512 1.89 56
N 8 100 4612 1.24 57.24
P 9 95 4707 1.18 58.42
BR 10 88 4795 1.09 59.51
14
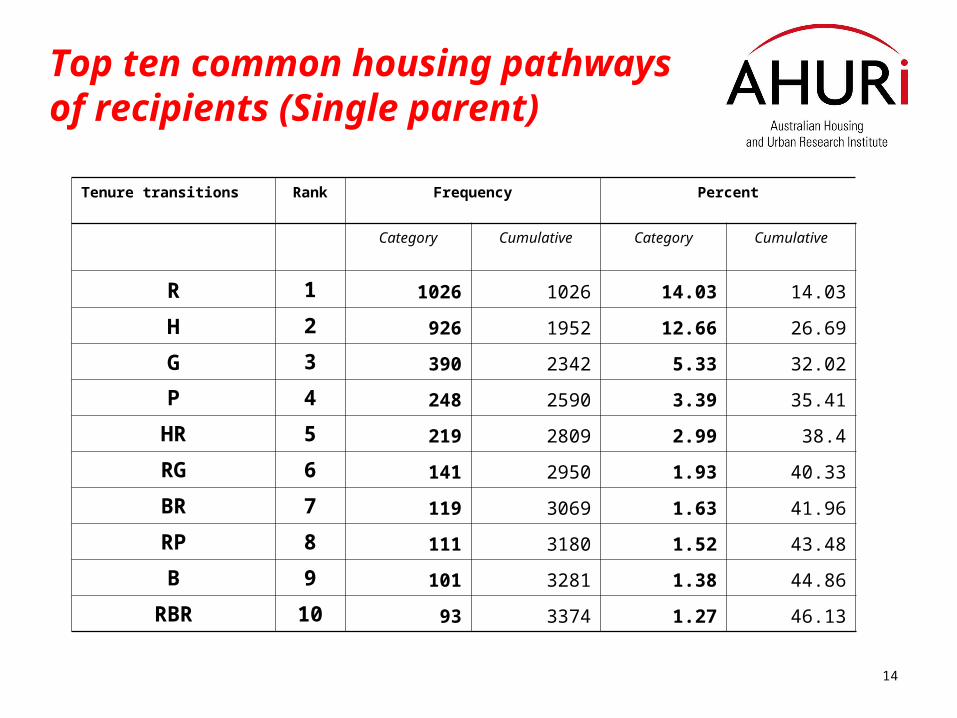
Top ten common housing pathways of recipients (Single parent)
Tenure transitions Rank Frequency Percent
Category Cumulative Category Cumulative
R 1 1026 1026 14.03 14.03
H 2 926 1952 12.66 26.69
G 3 390 2342 5.33 32.02
P 4 248 2590 3.39 35.41
HR 5 219 2809 2.99 38.4
RG 6 141 2950 1.93 40.33
BR 7 119 3069 1.63 41.96
RP 8 111 3180 1.52 43.48
B 9 101 3281 1.38 44.86
RBR 10 93 3374 1.27 46.13

15
Summary of single tenure change housing pathways for ISRs
HomeOwnership (H)
Boarding (B)
Rent-Free (F)
364
284
663
589
1078
436646
991
966
942
618
383
501446
Private Rental
(R)
Purchase (P)
PublicRent (G)
AgedCare (A)
Non-homeowner (N)
517 1078
998
16
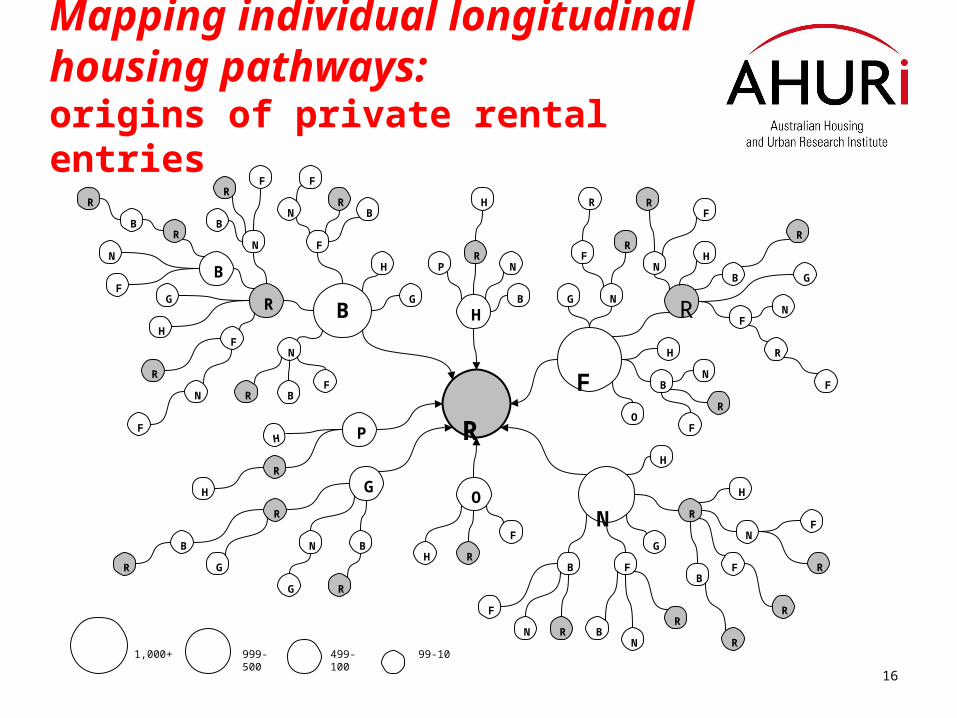
Mapping individual longitudinal housing pathways:origins of private rental entries
F
B
G
R
N
R
F
N
BN
R
B
99-10499-100
999-500
1,000+
O N
R
F
N
OF
R
N
R
G
R
F
R
F
N
G
RF
H
H
F
RH
H
H
RNP
B
P
H
R
H
GR
G
B
R
R
R
R
B
B
B
F
R
H
G
B
R
N
F
B
GF
N
R
FH
F
N
N
RF
B
F
R
R
H
G
F
R
NB
B
R
H
FN
RB
RN
F
17
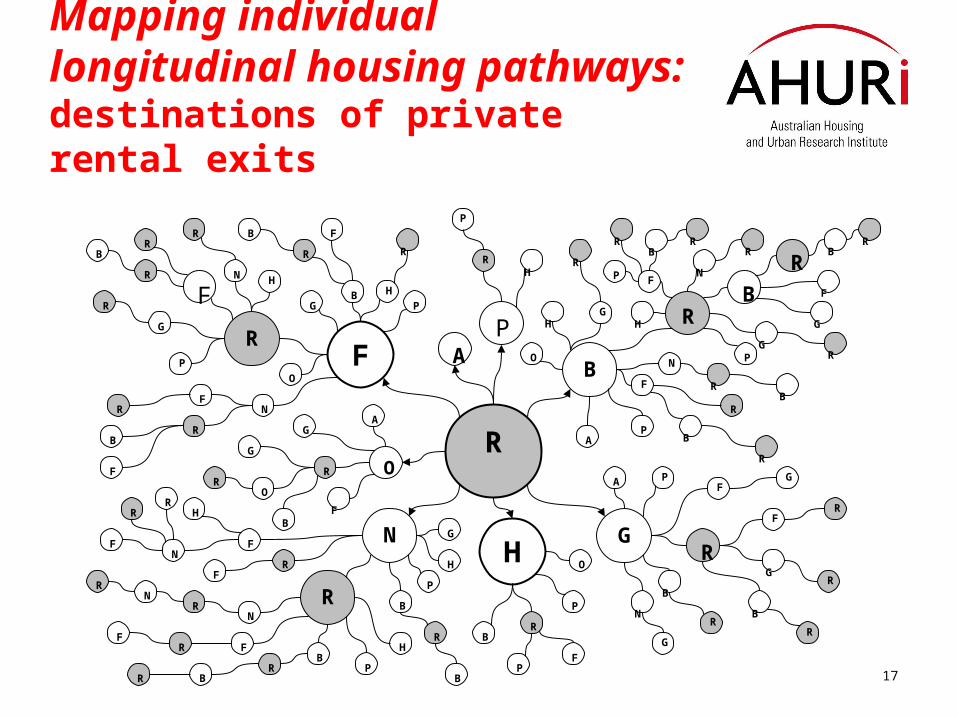
Mapping individual longitudinal housing pathways:destinations of private rental exits
G
R
H
B
B
R
O
PA R
F R
R
B
N
B
R B
R
G R
F
G
P
N
R B R
F
R
P
H
R
P
H
P
R
P
F
F
R
G
A
N
F
O
H
G
N
R
B
R
B
R
G
R F
R
G FA
P
B
O
P
R
R
G
GA
F
B
OR
R
F
R
NF
R BR
B
RN
RN
H
R
B
R
B F
N
R
H
B
R
G
P
P
O
G
RF
N
F
BR
B
R
B
G
H
P
P
FR F H
FR
RR
H
R

18
Public housing pathways
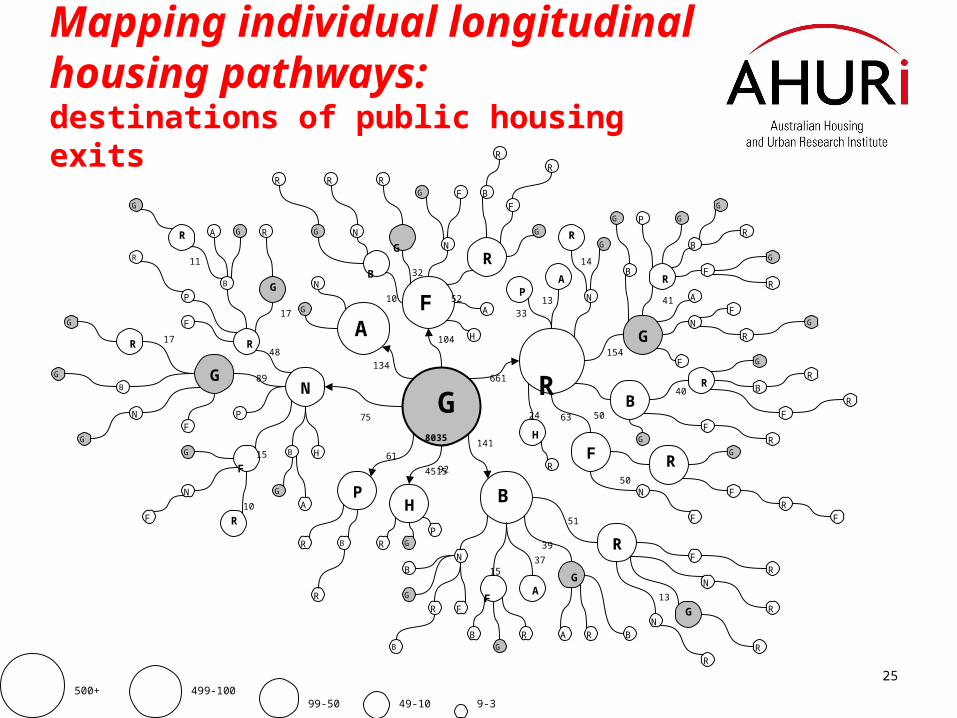
• Median duration in public housing among ISRs about 3.5 years. Over the full span of the data (8.7 years), 36% of public housing tenants (excluding left censored) remained in public housing.
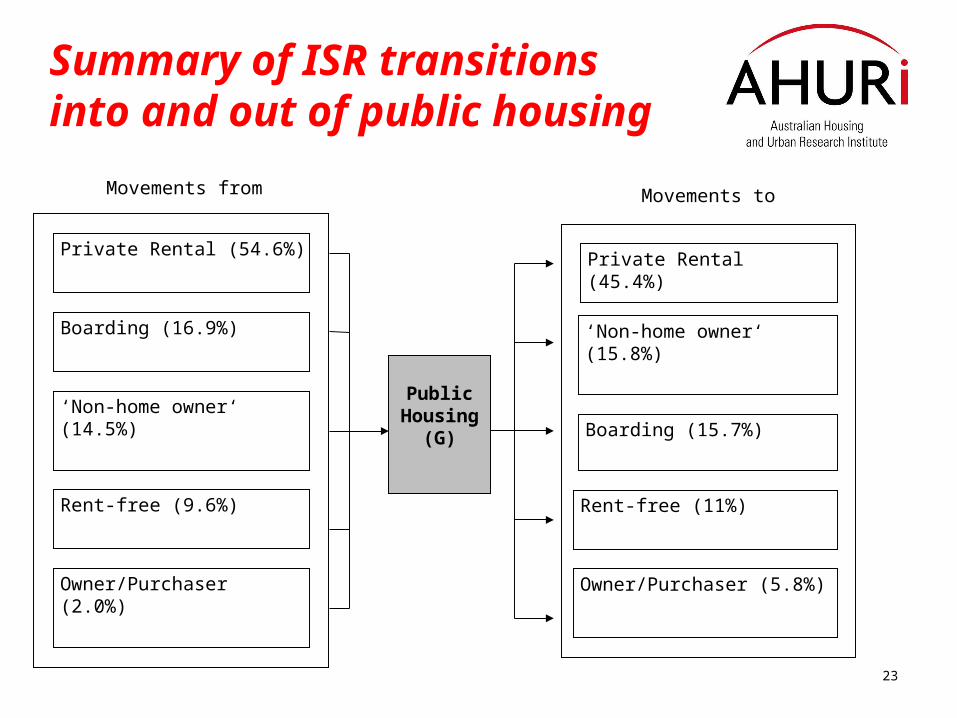
• Private rental sector plays significant role as an origin and destination tenure for ISRs in public housing. Other rental tenures also important
• Clear tendency for ISRs to return to their previous tenure type after exiting public housing, and this is apparent for every tenure type excepting aged care
• 30% of all cases who exited PH but remained on IS subsequently re-entered PH

19
Housing pathways based around public housing (all ISRs)
Tenure transitions Rank Frequency Percent
Category Cumulative Category Cumulative
G 1 2400 2400 29.87 29.87
RG 2 663 3063 8.25 38.12
GR 3 284 3347 3.53 41.66
RGR 4 127 3474 1.58 43.24
GA 5 110 3584 1.37 44.60
BG 6 104 3688 1.29 45.90
NG 7 84 3772 1.05 46.94
GRG 8 74 3846 0.92 47.87
GNG 9 66 3912 0.82 48.69
GH 10 65 3977 0.81 49.50
20
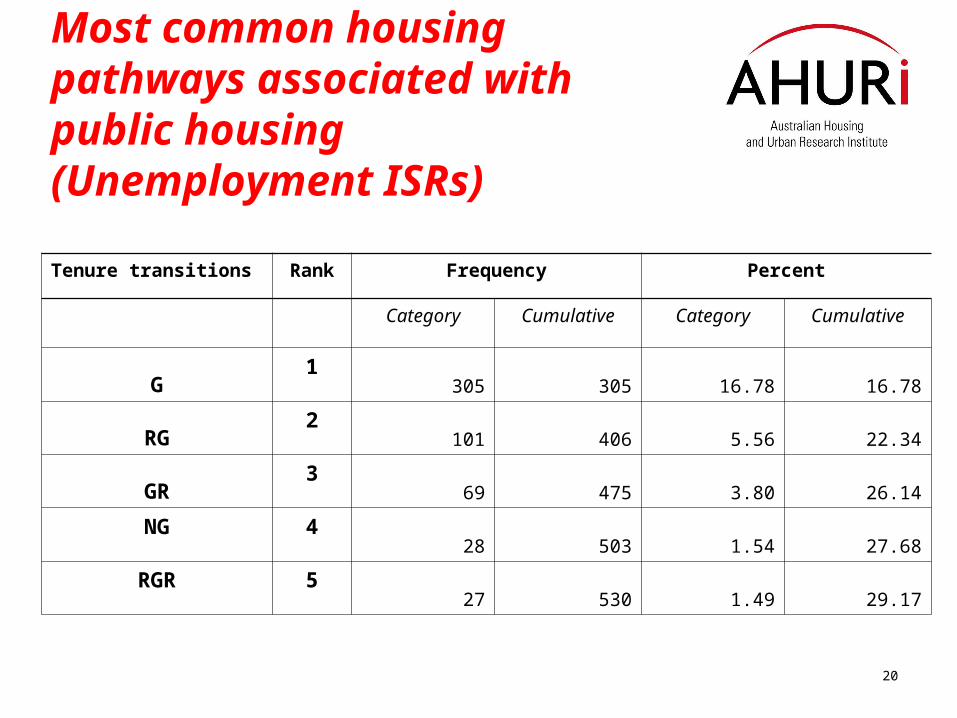
Most common housing pathways associated with public housing (Unemployment ISRs)
Tenure transitions Rank Frequency Percent
Category Cumulative Category Cumulative
G1
305 305 16.78 16.78
RG2
101 406 5.56 22.34
GR3
69 475 3.80 26.14
NG 428 503 1.54 27.68
RGR 527 530 1.49 29.17
21
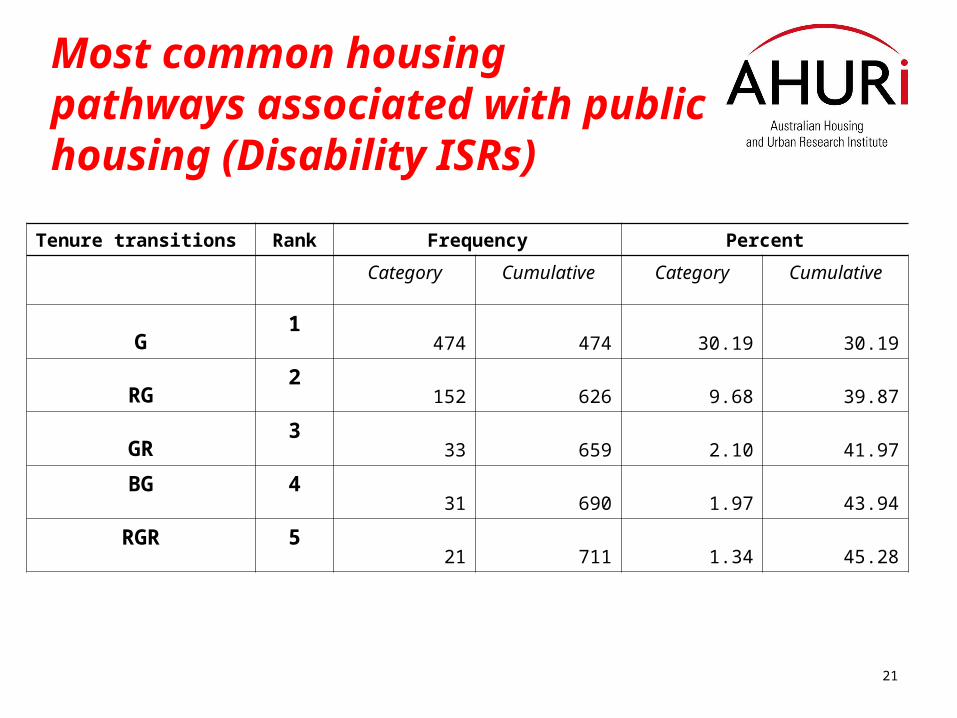
Most common housing pathways associated with public housing (Disability ISRs)
Tenure transitions Rank Frequency Percent
Category Cumulative Category Cumulative
G1
474 474 30.19 30.19
RG2
152 626 9.68 39.87
GR3
33 659 2.10 41.97
BG 431 690 1.97 43.94
RGR 521 711 1.34 45.28
22
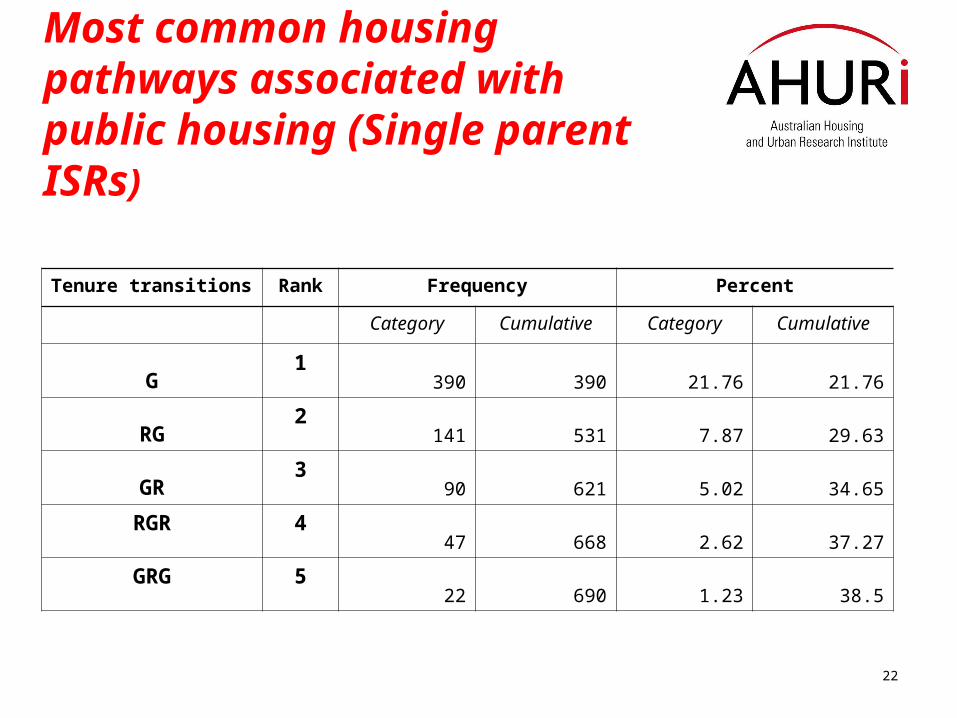
Most common housing pathways associated with public housing (Single parent ISRs)
Tenure transitions Rank Frequency Percent
Category Cumulative Category Cumulative
G1
390 390 21.76 21.76
RG2
141 531 7.87 29.63
GR3
90 621 5.02 34.65
RGR 447 668 2.62 37.27
GRG 522 690 1.23 38.5
23
Summary of ISR transitions into and out of public housing
Private Rental (54.6%)
Boarding (16.9%)
‘Non-home owner‘ (14.5%)
Rent-free (9.6%)
Owner/Purchaser (2.0%)
Private Rental (45.4%)
Owner/Purchaser (5.8%)
Rent-free (11%)
Boarding (15.7%)
‘Non-home owner‘ (15.8%)
Movements from Movements to
Public Housing
(G)

24
Mapping individual longitudinal housing pathways:
origins of public housing entries
RB
F
N
R
P
G
R
R
B
R
G
F
N
R
H
B
G
F
N
F
G
H
F
R
B
N
B
G
N
R
FR
F
R
B
R
RN
NB
N
N
N
N
N
N
R
R
R
R
R
R
R
R
R
R
R
R
R
R
B
B
B
B
B
B
B
F
B
B
B
B
B
B
H
H
H
H
H
F
F
F
F
F
FF
F G
G
G
G
G
G
G
G
G
G
P
N
N
N
F
FF
F
F
F
N
N
N
N
R
R
R
R
R
R
B
BB
B
B
B
B
N
N
N
N
N
N
N
N
R
R
R
R
R
H
H
F
F
RR
R
RR
RR
R
H
R
663
55
48104
8451
66 28
53
99-50199-100200+
26
14 10
1814
10
14
3718
24
37
23
30
12
F 10
74
31
49-10 2-9
15
10
25
Mapping individual longitudinal housing pathways:destinations of public housing exits
GF
R
99-50499-100500+
49-10 9-3
F
B
RG
R
G
G N
B
R
F
R
R
R
R R
R
R
R
B
B
B
N
N
N
G
G
G
G
B
B
P
P
B
R
B
P
F
F
FF
F
FN
N
N
N
R
G
G
G
G
G
G
G
G
G
G
G
G
R
G
R
R
H
P
F
B
A
A
A
A
A
N
R
R
F
RR
R
R
A
R
R
P
PB
H
F
F
G
RG
G
50
13
661
154
33
51
141
92
61
75
134
52
104
41
40 24
63
39
37
48
17
N
RR
G
32
10
F
R
R
B
14
8035 4515
G
B
A
F
F
G
R
R
BB
G
F
R
R
R
N
N 13
15
F
15
G
A
H
10
89
17
F
R
G
H
50
11
26
Drivers, influences, factors
• The housing pathways identified in the study raise questions about why tenure movements occur, and how they may be linked to influential factors:– How are tenure movements associated with changes in
incomes?– How are they linked to changes in other circumstances (social,
economic, personal)?– What are the drivers behind the housing pathways of income
support recipients?Are they about tenure ‘choices’, constraints or other decisions?
27
Commentary and conclusions
• Discourses about traditional ‘housing careers’ and related assumptions about linear tenure movements (up) giving way to more nuanced appreciation of the diversity of ‘housing pathways’
• Housing consumption patterns of Income Support Recipients illustrate diversity of housing pathways
• Income support recipients not a homogenous population in terms of housing pathways
28
Commentary and conclusions
• Static tenure breakdown of ISRs suggest some characteristics at last observation have similarities with those of broader population, while others differ significantly from broader population:– Private rental and home ownership rates among ISRs actually very
close to whole of population– Home purchase among ISRs much lower– Informal rental and other arrangements much higher
• More dynamic, time based analyses indicate high rates of stability on the one hand, to a complex history of multiple transitions on the other
• Most IRSs do not change tenures, or undergoing limited movements, whilst on income support
• Now, the more elaborate set of tenure changes that some ISRs undergo can also been seen
29
Commentary and conclusions
• Importance of home ownership among IRSs
• Importance of the private rental market in the broader housing system:
– As a tenure of significance for ISRs
– As a gateway tenure in the housing system, at least as far as ISRs are concerned
• Familiarity with previous housing option influence future tenure decisions?
• Revolving door into and out of public housing for some SHA clients
30
Commentary and conclusions
• Further research and analysis implications?
• Seelig T, Han JH, O’Flaherty M, Short P, Haynes M, Baum S, Western M, Jones A (2005) Housing consumption patterns & earnings behaviour of income support recipients over time, AHURI Positioning Paper
• Seelig T, Han JH, O’Flaherty M, Haynes (forthcoming) Housing consumption patterns & earnings behaviour of income support recipients over time, AHURI Final Report