The HOT lane in Israel: small step to the system, giant ...
29
THE HOT LANE IN ISRAEL: SMALL STEP TO THE SYSTEM, GIANT LEAP TOWARDS ROAD PRICING? Galit Cohen Blankshtain*, Hillel Bar-Gera** and Yoram Shiftan*** *The Hebrew University of Jerusalem **Ben Gurion University ***Technion, Israel Institute of Technology, Haifa of the Negen, Beer-Sheva
Transcript of The HOT lane in Israel: small step to the system, giant ...
THE HOT LANE IN ISRAEL: SMALL STEP TO THE SYSTEM, GIANT LEAP TOWARDS ROAD PRICING?
Galit Cohen Blankshtain*, Hillel Bar-Gera** and Yoram Shiftan***
*The Hebrew University of Jerusalem**Ben Gurion University ***Technion, Israel Institute of Technology, Haifaof the Negen, Beer-Sheva
CONTENT
• The logic(s) behind HOT lanes: a policy perspective (Galit)
• The “fast lane” to Tel-Aviv: zoom in (Hillel)
• HOT lane as part of transport policy tool box: zoom out (Yoram)
OECD ROUNDTABLE SEPTEMBER 2020
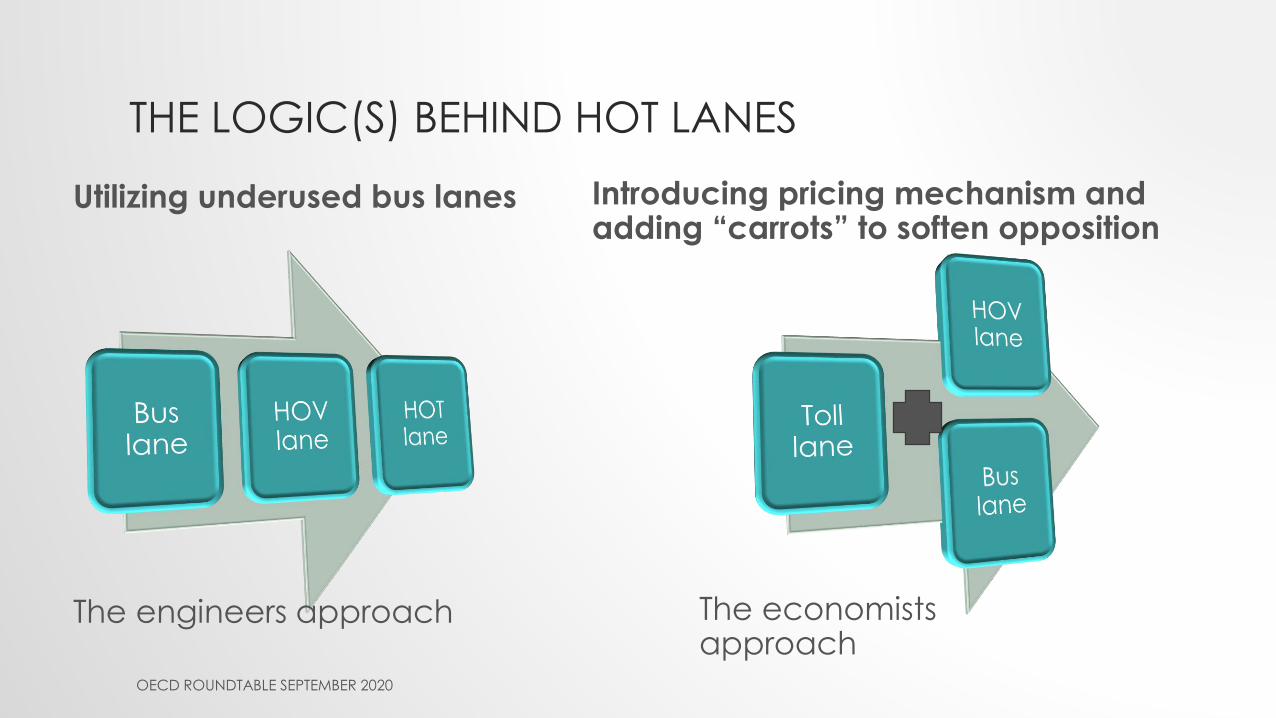
THE LOGIC(S) BEHIND HOT LANES
Utilizing underused bus lanes Introducing pricing mechanism and adding “carrots” to soften opposition
The engineers approach The economists approach
OECD ROUNDTABLE SEPTEMBER 2020
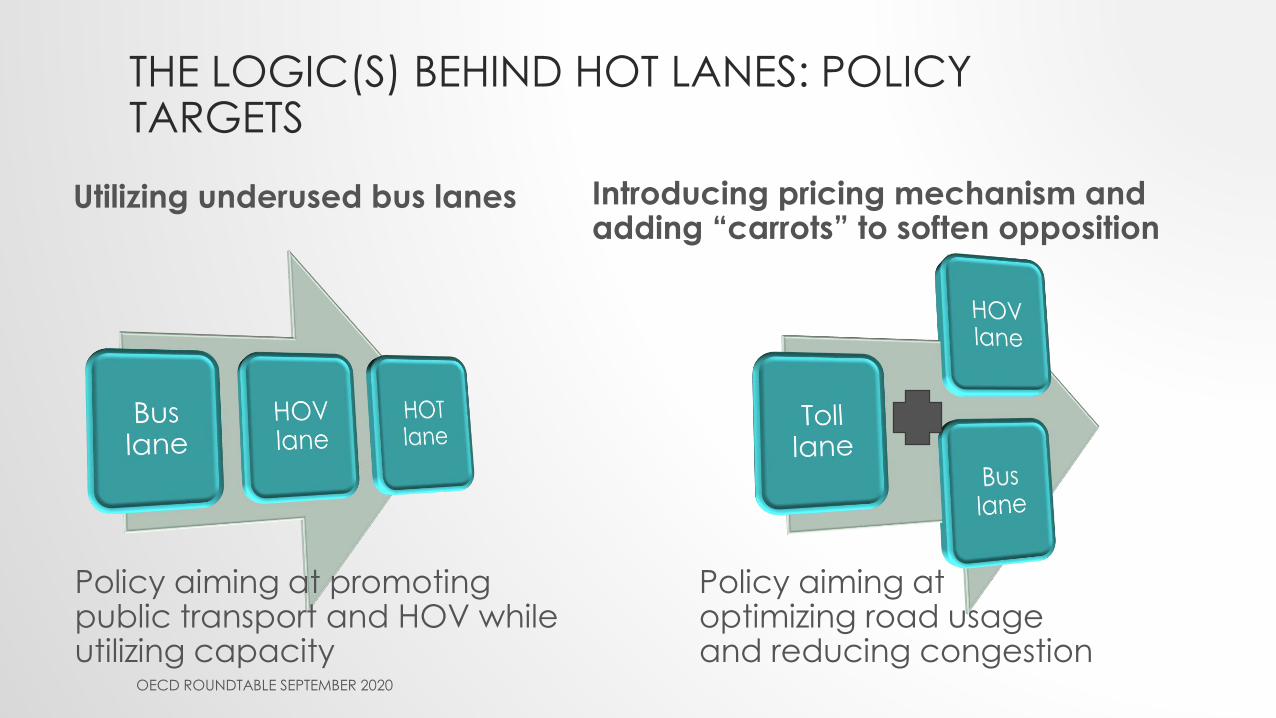
THE LOGIC(S) BEHIND HOT LANES: POLICY TARGETS
Utilizing underused bus lanes Introducing pricing mechanism and adding “carrots” to soften opposition
Policy aiming at promoting public transport and HOV while utilizing capacity
Policy aiming at optimizing road usage and reducing congestion
OECD ROUNDTABLE SEPTEMBER 2020

THE LOGIC(S) BEHIND HOT LANES: EQUITY ASPECTS
Utilizing underused bus lanes Introducing pricing mechanism and adding “carrots” to soften opposition
Paying cars support the non-paying cars
It is not just for the affluents, others can also enjoy the laneOECD ROUNDTABLE SEPTEMBER 2020
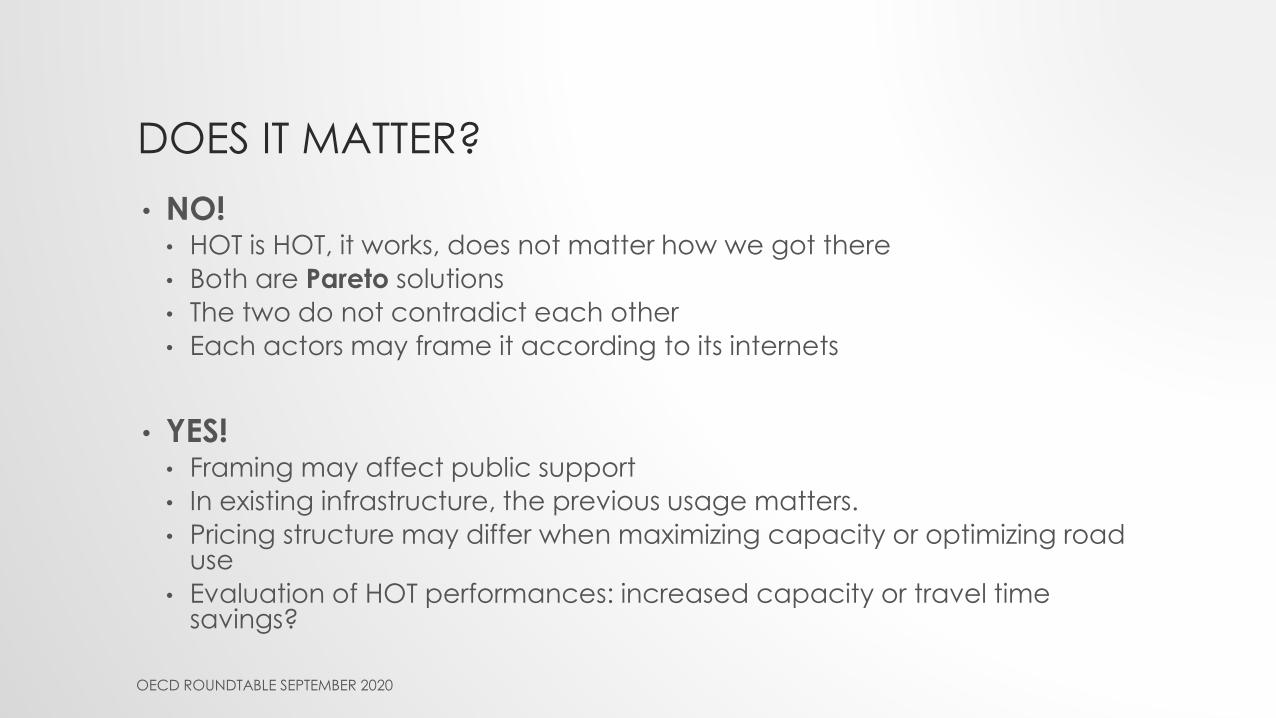
DOES IT MATTER?
• NO!• HOT is HOT, it works, does not matter how we got there
• Both are Pareto solutions
• The two do not contradict each other
• Each actors may frame it according to its internets
• YES!• Framing may affect public support
• In existing infrastructure, the previous usage matters.
• Pricing structure may differ when maximizing capacity or optimizing road use
• Evaluation of HOT performances: increased capacity or travel time savings?
OECD ROUNDTABLE SEPTEMBER 2020
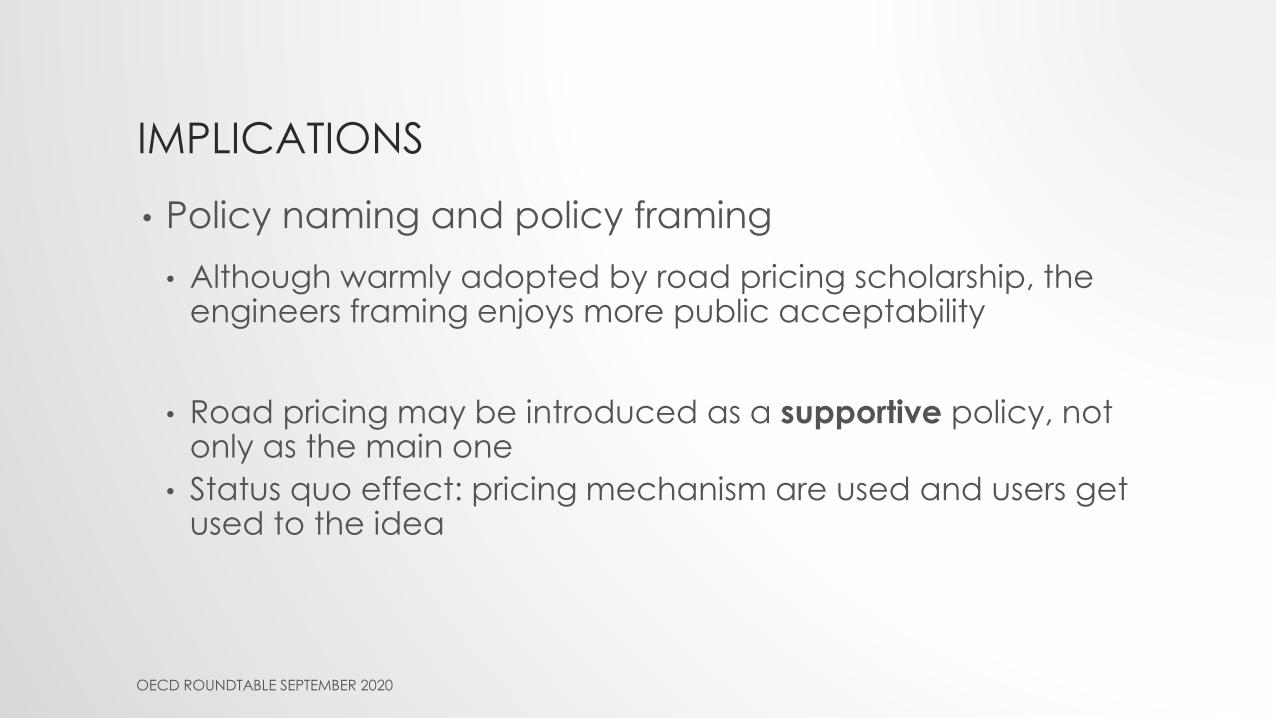
IMPLICATIONS
• Policy naming and policy framing
• Although warmly adopted by road pricing scholarship, the engineers framing enjoys more public acceptability
• Road pricing may be introduced as a supportive policy, not only as the main one
• Status quo effect: pricing mechanism are used and users get used to the idea
OECD ROUNDTABLE SEPTEMBER 2020
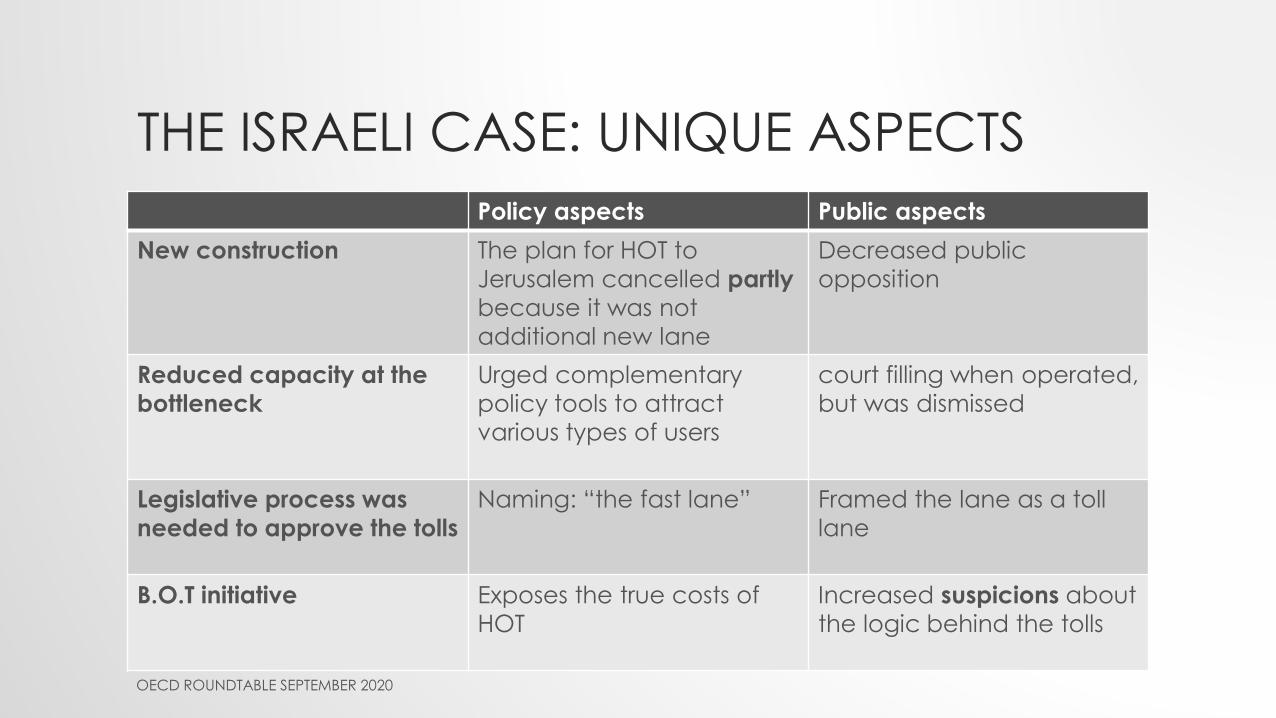
THE ISRAELI CASE: UNIQUE ASPECTS
Policy aspects Public aspects
New construction The plan for HOT to
Jerusalem cancelled partly
because it was not
additional new lane
Decreased public
opposition
Reduced capacity at the
bottleneck
Urged complementary
policy tools to attract
various types of users
court filling when operated,
but was dismissed
Legislative process was
needed to approve the tolls
Naming: “the fast lane” Framed the lane as a toll
lane
B.O.T initiative Exposes the true costs of
HOT
Increased suspicions about
the logic behind the tolls
OECD ROUNDTABLE SEPTEMBER 2020
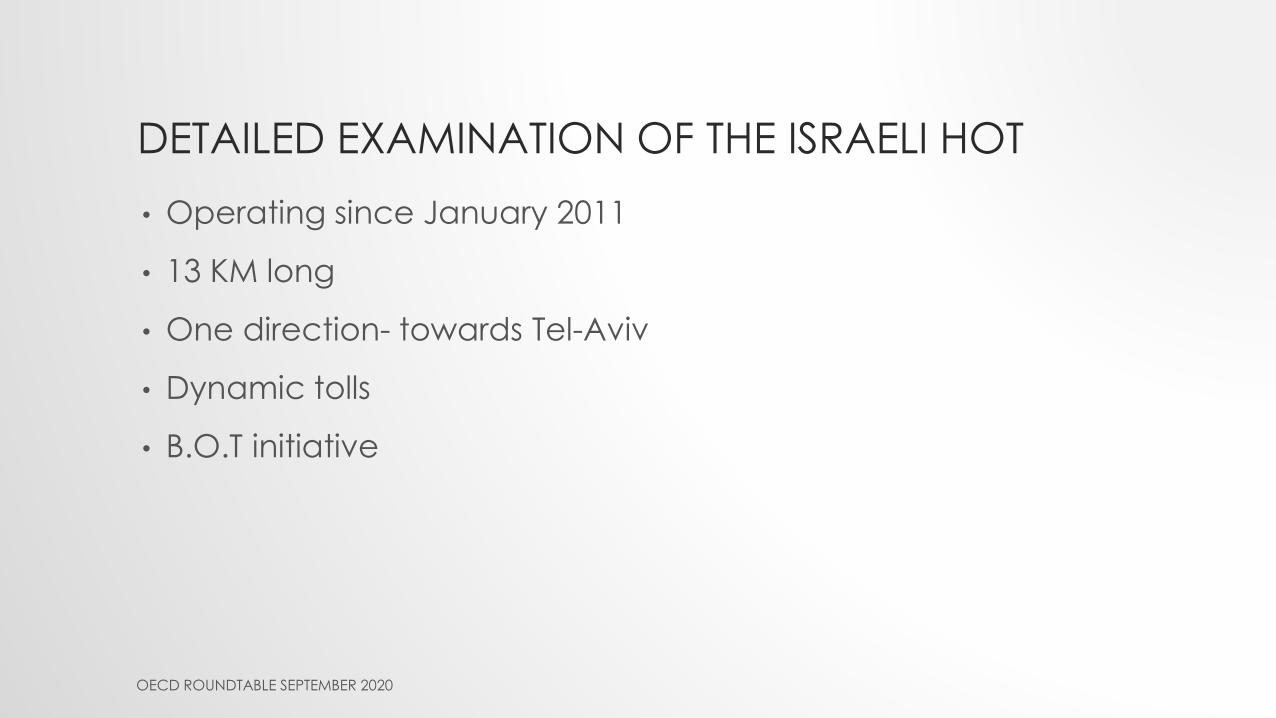
DETAILED EXAMINATION OF THE ISRAELI HOT
• Operating since January 2011
• 13 KM long
• One direction- towards Tel-Aviv
• Dynamic tolls
• B.O.T initiative
OECD ROUNDTABLE SEPTEMBER 2020

THE FAST LANE
OECD ROUNDTABLE SEPTEMBER 2020
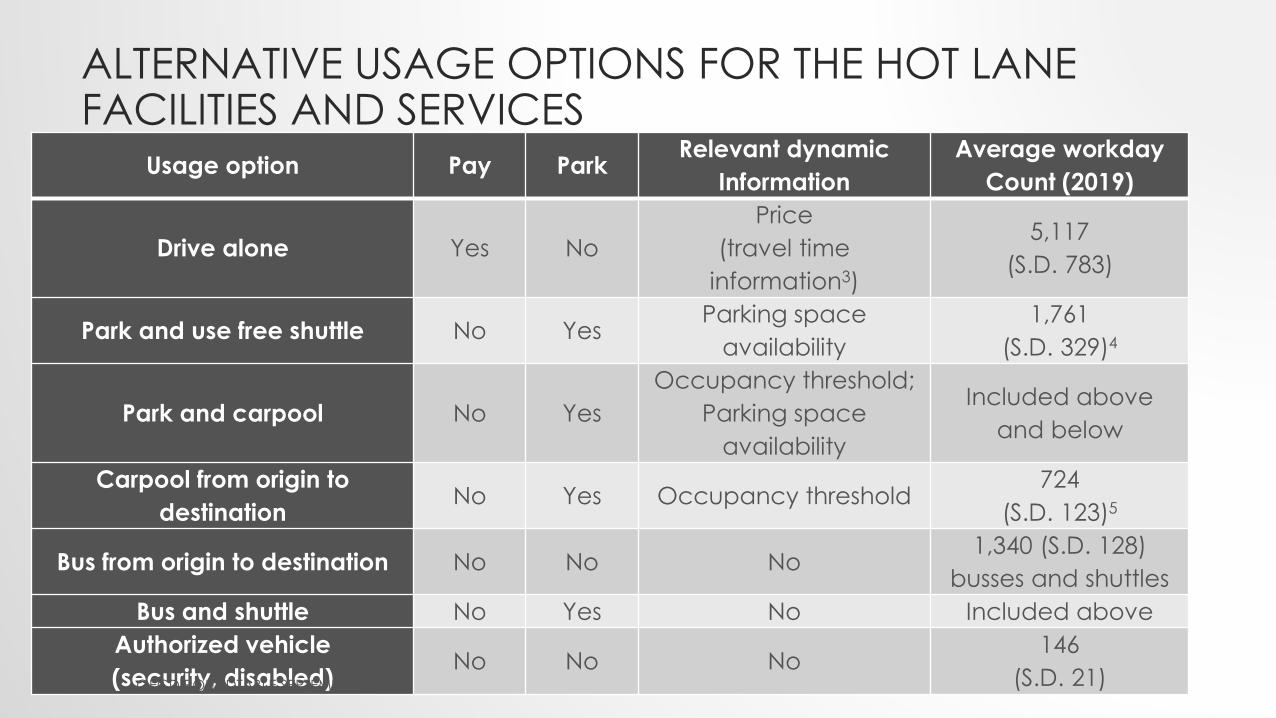
ALTERNATIVE USAGE OPTIONS FOR THE HOT LANE FACILITIES AND SERVICES
Usage option Pay ParkRelevant dynamic
Information
Average workday
Count (2019)
Drive alone Yes No
Price
(travel time
information3)
5,117
(S.D. 783)
Park and use free shuttle No YesParking space
availability
1,761
(S.D. 329)4
Park and carpool No Yes
Occupancy threshold;
Parking space
availability
Included above
and below
Carpool from origin to
destinationNo Yes Occupancy threshold
724
(S.D. 123)5
Bus from origin to destination No No No1,340 (S.D. 128)
busses and shuttles
Bus and shuttle No Yes No Included above
Authorized vehicle
(security, disabled)No No No
146
(S.D. 21)OECD ROUNDTABLE SEPTEMBER 2020

HOT AND SHUTTLE USERS CHARACTERISTICS
• Most HOT paying users are occasional: 56% once, 30% two to five times
• Most shuttle users are commuters: 84% workers, 73% arrival is 6:30-9:30; 59% activities of >8 hours.
• 72% do not have reserved parking at their destination
• Most (56%) used private car before the shuttle service was in operation
• Sources: Matat, 2016, based on data for July 1st, 2014 to June 30th, 2015; Katoshevski-Cavari et al. (2018), based on a survey of 530 shuttle users.
OECD ROUNDTABLE SEPTEMBER 2020

PARKING LOT (2000) AND SHUTTLES
OECD ROUNDTABLE SEPTEMBER 2020
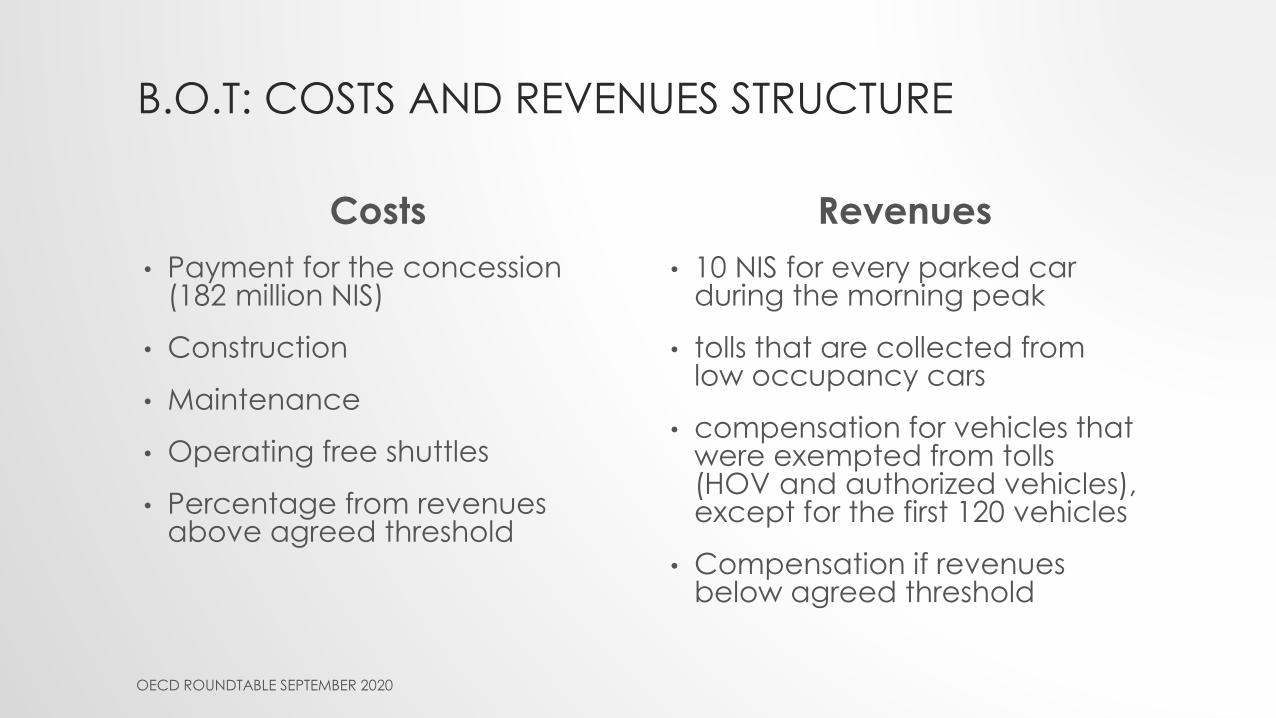
B.O.T: COSTS AND REVENUES STRUCTURE
Costs
• Payment for the concession (182 million NIS)
• Construction
• Maintenance
• Operating free shuttles
• Percentage from revenues above agreed threshold
Revenues
• 10 NIS for every parked car during the morning peak
• tolls that are collected from low occupancy cars
• compensation for vehicles that were exempted from tolls (HOV and authorized vehicles), except for the first 120 vehicles
• Compensation if revenues below agreed threshold
OECD ROUNDTABLE SEPTEMBER 2020

TRAFFIC VOLUME AT THE EAST ENTRANCE TO THE HOT LANE, AND ON ROAD NUMBER 1(average of values within the inter-quartile range for workdays during June and July 2011)
OECD ROUNDTABLE SEPTEMBER 2020

TRAVEL TIME IN THE HOT AND GP LANES BY TIME OF DAY
(average of values within the inter-quartile range for workdays during June and July 2011)
HOT GP
OECD ROUNDTABLE SEPTEMBER 2020

TOLLS IN THE HOT LANE BY TIME OF DAY (average of values within the inter-quartile range for workdays during June and July 2011)
OECD ROUNDTABLE SEPTEMBER 2020

FAST LANES: THE NEXT STEP
OECD ROUNDTABLE SEPTEMBER 2020
• Through the CBD (along Ayalon highway)
• Two-directions
• 11 gates per direction
• 2-4 toll sections per direction
• Two parking lots (7K+3K parking spots)
• Additional capacity
• Predetermined toll profile, by time of day
• Operator incentive based on utilization

Zooming out
OECD ROUNDTABLE SEPTEMBER 2020
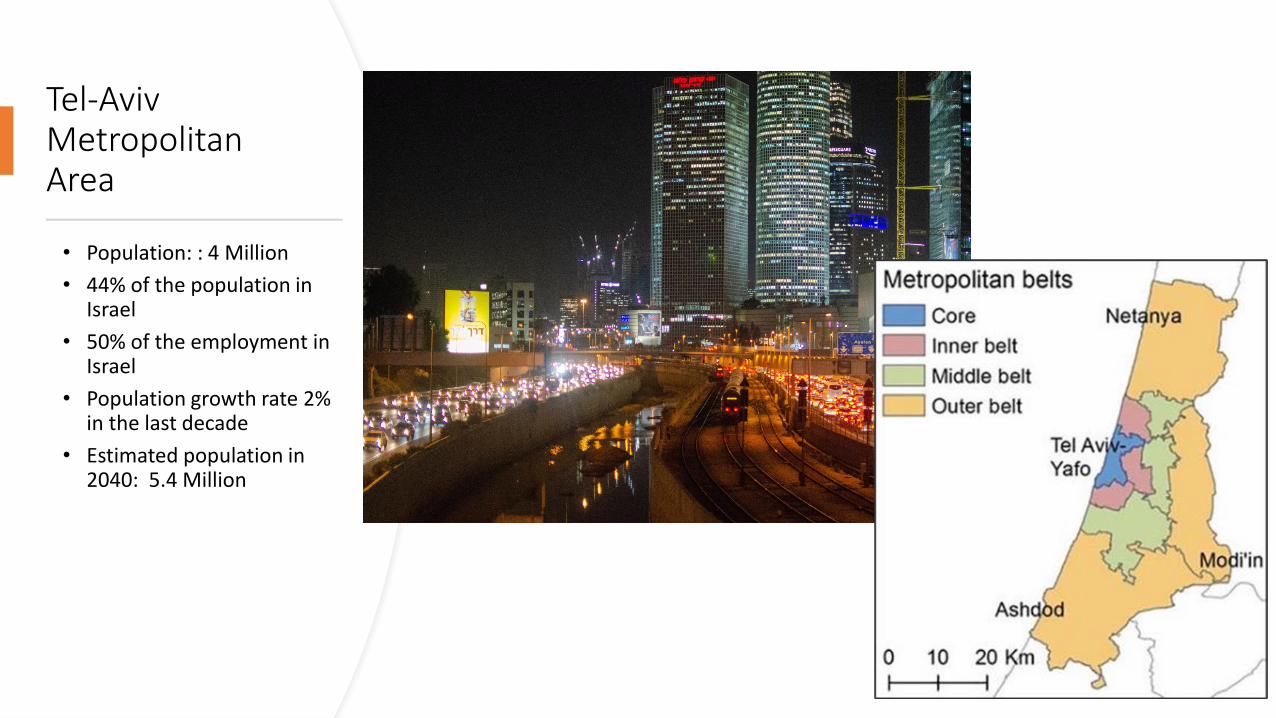
Tel-Aviv Metropolitan Area
• Population: : 4 Million
• 44% of the population in Israel
• 50% of the employment in Israel
• Population growth rate 2% in the last decade
• Estimated population in 2040: 5.4 Million

CONGESTION INTEL-AVIV
• According to TomTom, Tel-Aviv is the 21st most congested cities in the word, out of 416 cities that were evaluated in 57 countries
• Travel time during peak time is 90% longer than off peak
• Developed cities with metro systems are at lower ranking
OECD ROUNDTABLE SEPTEMBER 2020
City and
congestion
rank
Morning
extra
time
Evening
extra
time
Number
of metro
lines
Share of
public
transport out
of motorized
trips
Tel Aviv
21
28 min 27 min 0 105
Lisbon
81
20 min 23 min 4 41%
Berlin
94
15 min 18 min 10 46%
Madrid
243
17 min 14 min 13 41%
Extra trave time during peak hour for a 30-minute trip

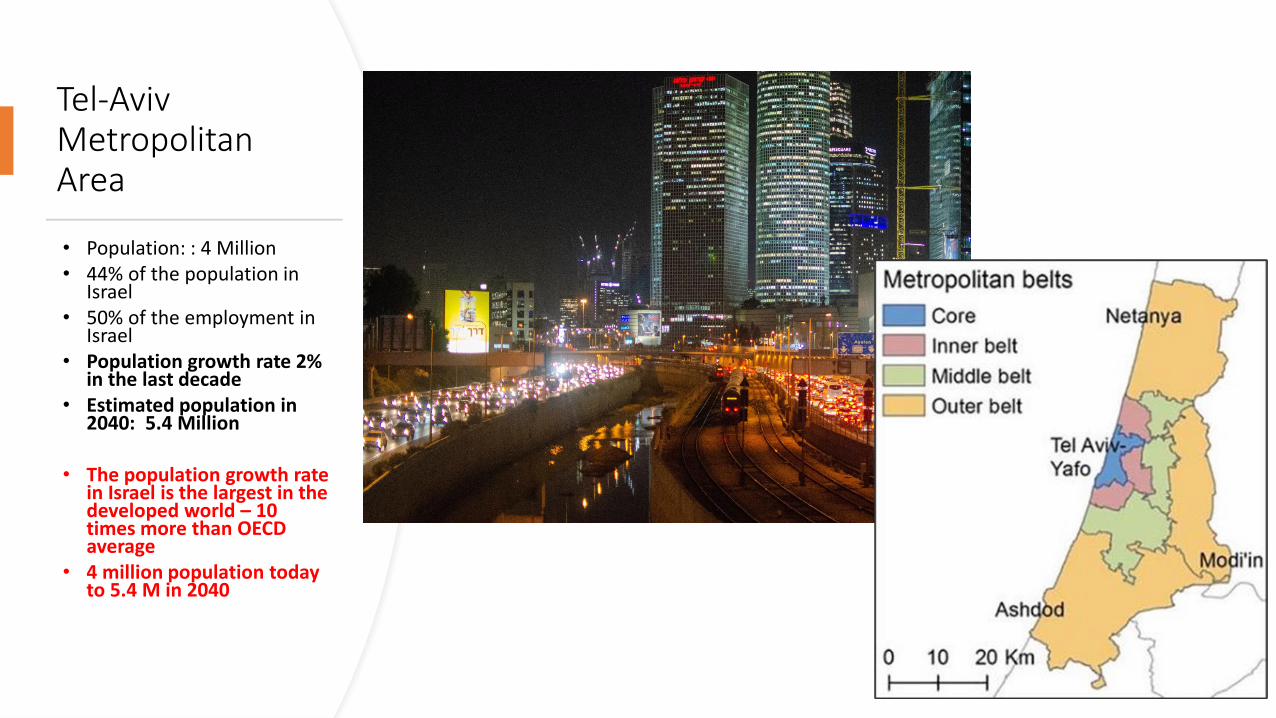
Tel-Aviv Metropolitan Area
• Population: : 4 Million• 44% of the population in
Israel• 50% of the employment in
Israel• Population growth rate 2%
in the last decade• Estimated population in
2040: 5.4 Million
• The population growth rate in Israel is the largest in the developed world – 10 times more than OECD average
• 4 million population today to 5.4 M in 2040
Congestion pricing and the subway24
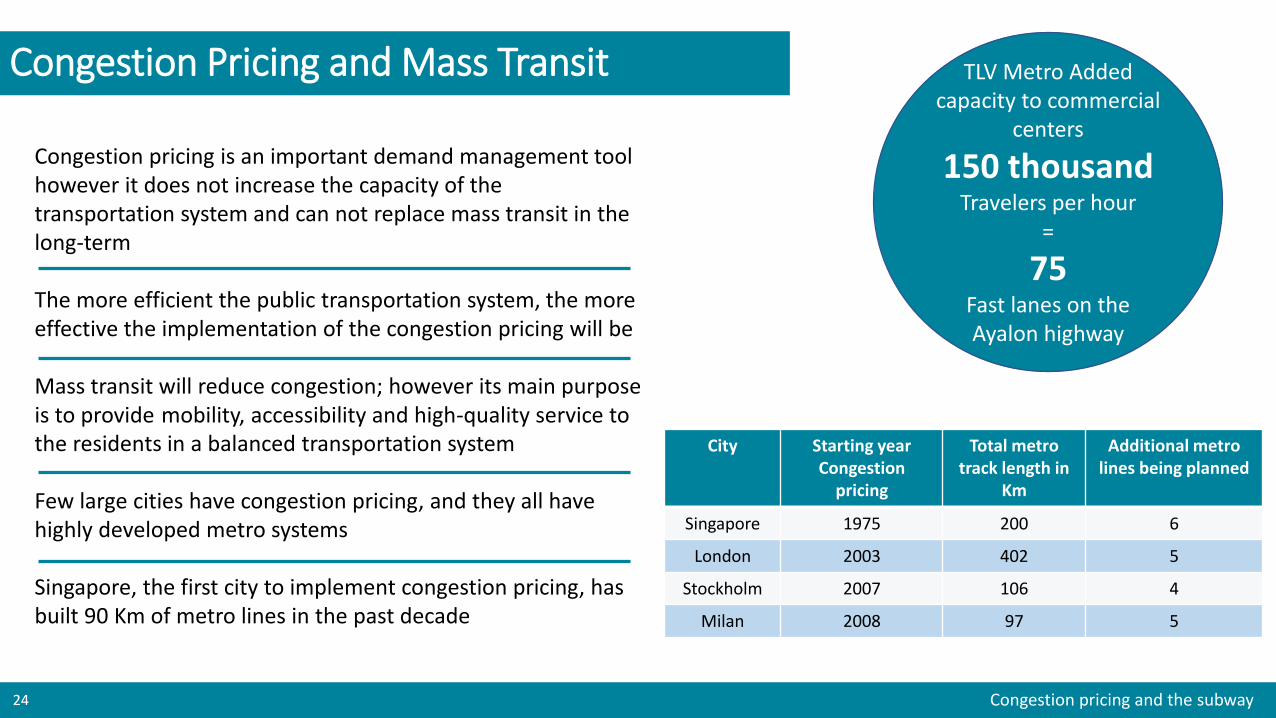
Congestion Pricing and Mass Transit
24
TLV Metro Added capacity to commercial
centers
150 thousandTravelers per hour
=
75Fast lanes on the Ayalon highway
City Starting year Congestion
pricing
Total metro track length in
Km
Additional metro lines being planned
Singapore 1975 200 6
London 2003 402 5
Stockholm 2007 106 4
Milan 2008 97 5
Congestion pricing is an important demand management tool however it does not increase the capacity of the transportation system and can not replace mass transit in the long-term
The more efficient the public transportation system, the more effective the implementation of the congestion pricing will be
Mass transit will reduce congestion; however its main purpose is to provide mobility, accessibility and high-quality service to the residents in a balanced transportation system
Few large cities have congestion pricing, and they all have highly developed metro systems
Singapore, the first city to implement congestion pricing, has built 90 Km of metro lines in the past decade
Congestion pricing and the metro25
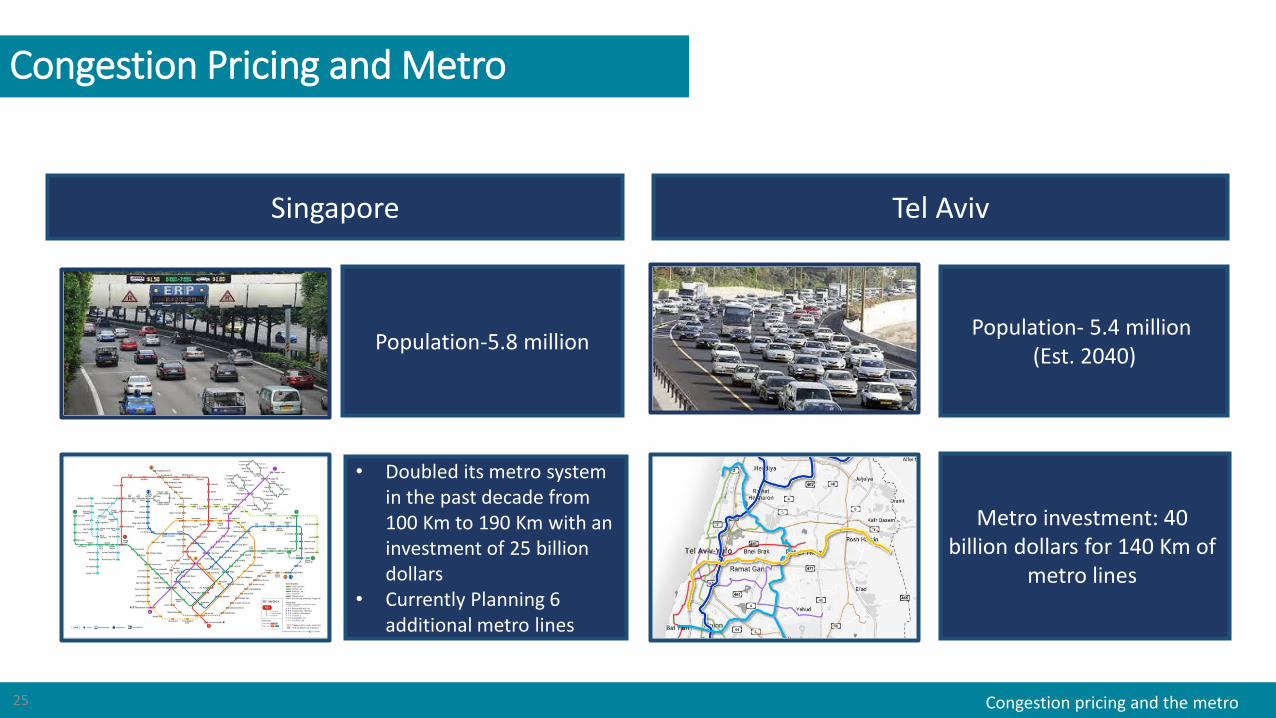
Congestion Pricing and Metro
Population-5.8 million
Singapore
Population- 5.4 million (Est. 2040)
Tel Aviv
Metro investment: 40 billion dollars for 140 Km of
metro lines
• Doubled its metro system in the past decade from 100 Km to 190 Km with an investment of 25 billion dollars
• Currently Planning 6 additional metro lines
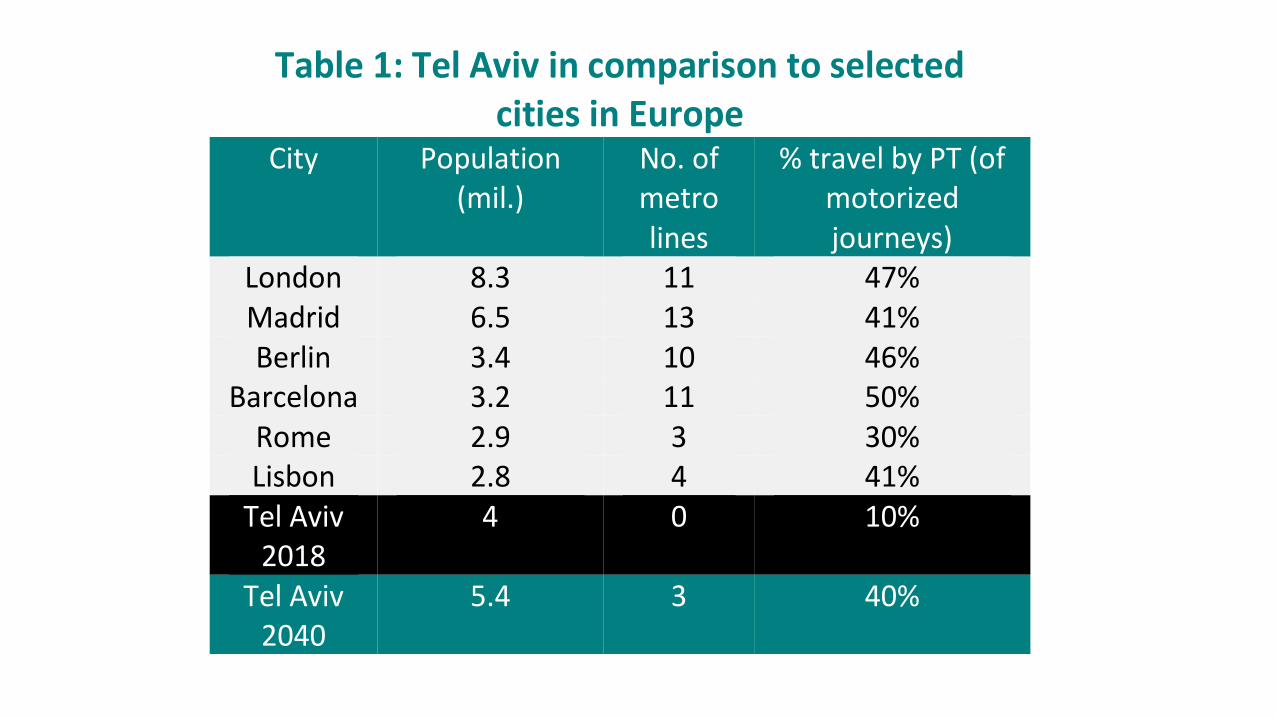
Table 1: Tel Aviv in comparison to selected cities in Europe
City Population (mil.)
No. of metro lines
% travel by PT (of motorized journeys)
London 8.3 11 47% Madrid 6.5 13 41% Berlin 3.4 10 46%
Barcelona 3.2 11 50% Rome 2.9 3 30% Lisbon 2.8 4 41%
Tel Aviv 2018
4 0 10%
Tel Aviv 2040
5.4 3 40%
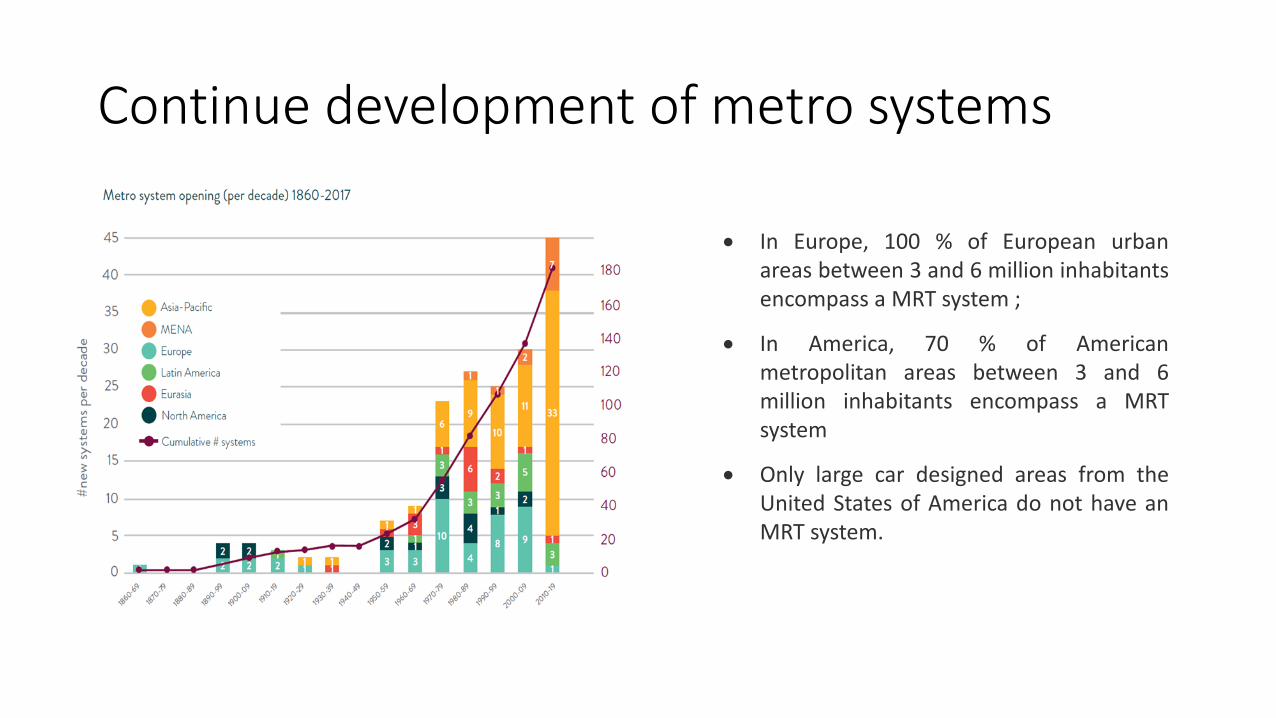
Continue development of metro systems
In Europe, 100 % of European urbanareas between 3 and 6 million inhabitantsencompass a MRT system ;
In America, 70 % of Americanmetropolitan areas between 3 and 6million inhabitants encompass a MRTsystem
Only large car designed areas from theUnited States of America do not have anMRT system.
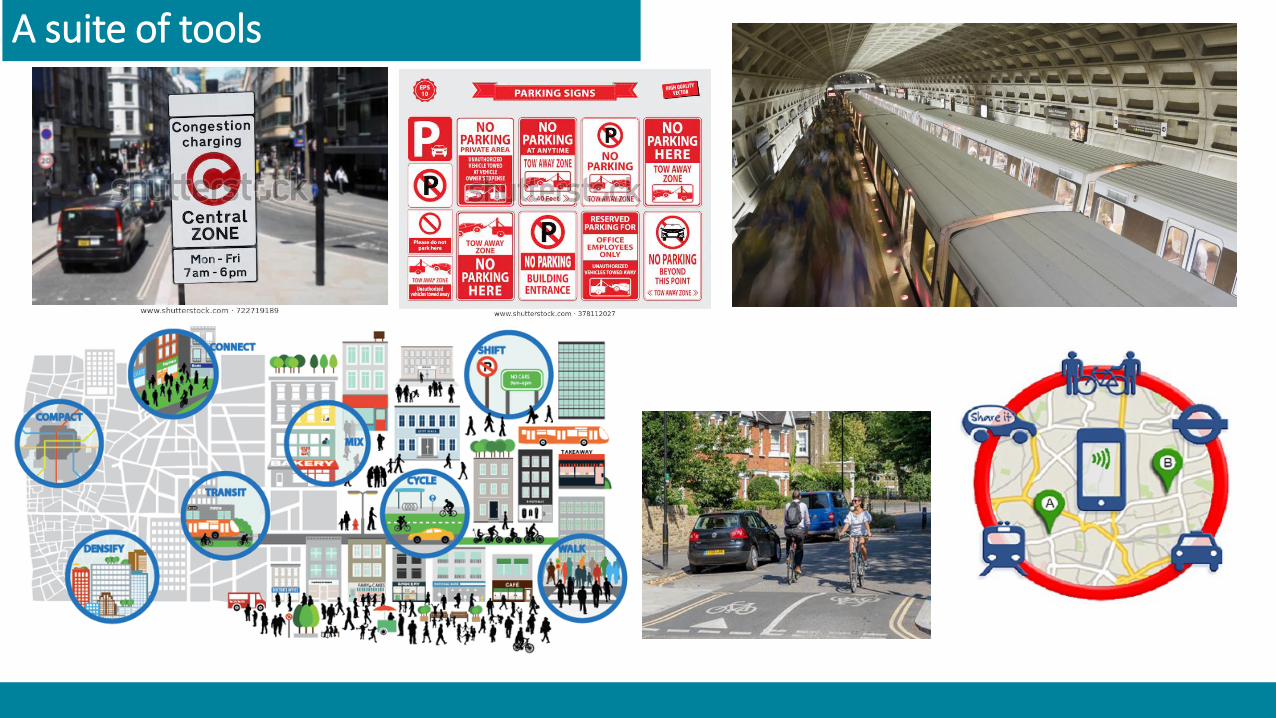
A suite of tools
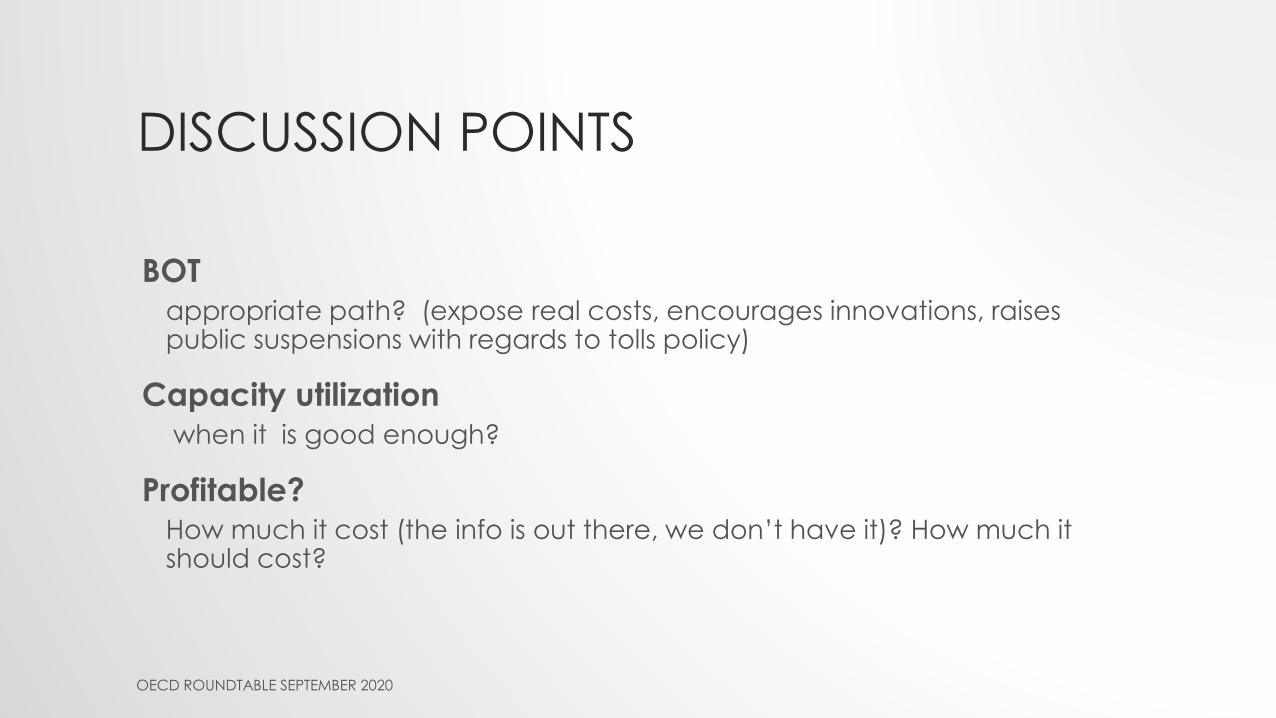
DISCUSSION POINTS
BOTappropriate path? (expose real costs, encourages innovations, raises public suspensions with regards to tolls policy)
Capacity utilizationwhen it is good enough?
Profitable?How much it cost (the info is out there, we don’t have it)? How much it should cost?
OECD ROUNDTABLE SEPTEMBER 2020