The Hong Kong Polytechnic University POLARIZATION ...
169
Transcript of The Hong Kong Polytechnic University POLARIZATION ...


The Hong Kong Polytechnic University
Department of Electrical Engineering
POLARIZATION-MAINTAINING PHOTONIC CRYSTAL
FIBER BASED SENSORS
AND FIBER BRAGG GRATINGS SENSOR SYSTEM
FU Hongyan
A thesis submitted in partial fulfillment of the requirements for
The Degree of Doctor of Philosophy
August, 2008

CERTIFICATE OF ORIGINALITY
I hereby declare that this thesis is my own work and that, to the best of my
knowledge and belief, it reproduces no material previously published or written nor
material which has been accepted for the award of any other degree or diploma,
except where due acknowledgement has been made in the text.
( Signed)
FU Hongyan ( Name of Student )

Abstract - i -
ABSTRACT
This thesis describes the investigation of fibre optic sensor technologies
that focus on the development of fibre sensing elements based on polarization-
maintaining photonic crystal fibre (PM-PCF) and fibre Bragg gratings (FBGs),
and their multiplexing techniques. Various multiplexing techniques of PM-PCF
based Sagnac interferometers have been investigated. A novel scheme to realize
high-speed FBG sensor interrogation by using dispersion-compensating module,
and a new wavelength-division multiplexing technique to achieve long-distance
FBG sensing over 75 km using broadband light sources were investigated. In
addition, we also studied a time-division multiplexing scheme for FBG sensors
based on pulse modulated semiconductor optical amplifier (SOA) ring cavity.
A fibre optic polarimetric torsion sensor based on PM-PCF with high
torsion sensitivity and low sensitivity to temperature was developed. The torsion
sensitivity of the proposed sensor is ~ 0.014/° within a linear twist range from 30°
to 70°. It is highly repeatable over 90-degree twist in both clockwise and
counterclockwise directions. The experimental results were in excellent
agreement with predicted results. PM-PCF as sensing elements in Sagnac
configuration for pressure and high temperature measurements were also
investigated. Measurement results show that high pressure sensitivity of 3.42
nm/MPa, and high temperature measurement up to 1160°C with good linearity of
about 11 pm/°C in the range of 400°C – 800°C were achieved. Their performance
was compared with temperature sensors based on FBGs written with UV

Abstract - ii -
irradiation or with femtosecond laser. The results show that PM-PCF based
Sagnac interferometer is a good candidate for long-term high temperature
measurements because of the lack of a doped core that would diffuse to the
cladding and eventually render the fibre non-singlemode.
Three multiplexing techniques of PM-PCF sensors in Sagnac
configuration were proposed. One technique employed coarse wavelength
division multiplexer (CWDM) to separate each Sagnac interferometer in different
wavelength bands. The other two schemes were based on connecting several
Sagnac interferometers in series along a single fibre and by using couplers to
multiplex the sensors in parallel. The CWDM multiplexing technique is simple to
implement, whereas the other two techniques require post measurement data
processing.
Two main challenges of FBG sensor systems are high-speed FBG
sampling beyond the kHz range and long-distance interrogation. We have
developed a novel ultra-fast FBG interrogation system based on dispersion-
compensation fibre that converts wavelength shift to time difference, permitting
FBG interrogation up to 2.44 MSamples/second. Two different approaches for
long-distance FBG sensing were investigated. By cascading three broadband light
sources with different wavelength bands along a fibre link, a 75-km sensing
distance with an impressive high effective dynamic range of 60 dB was achieved.
The second scheme used a pulse modulated SOA ring cavity demonstrated time-

Abstract - iii -
division multiplexing of 6 FBG sensors along a 40-km optical fibre with better
than 20 dB optical signal-to-noise ratio.

ACKNOWLEDGEMENTS
I would like to express my sincere thanks to my chief supervisor, Professor Hwa-Yaw
Tam, for introducing me to the world of fiber optic sensors research and his invaluable
guidance, support and encouragement during my Ph.D. study. I am very grateful to my
co-supervisor, Professor Ping-Kong Alexander Wai, for his invaluable guidance, support
and encouragement during my Ph.D. study. In addition, I would like to thank Professor
Chao Lu for his invaluable discussion, suggestion and support.
Many thanks to my colleagues, and note especially Dr. Heliang Liu, Dr. WengHong
Chung, Dr. Xinyong Dong, Dr. Sunil K. Khijwania, Dr. Liyang Shao, Mr. David Au for
their kindly collaboration and technical support. I would like to thank Dr. Michael Liu,
Dr. Jian Ju, Dr. Limin Xiao, Dr. K. K. Qureshi, Dr. Feng Xinhuan, Dr. C. Y. Li, Dr.
Kevin Lui, Dr. C. C. Lee, Dr. Yiping Wang, Mr. Xin Shi, Mr. Shaohao Wang, Mr.
Yuheng Huang, Dr. Zhaohui Li for their support and suggestions. In addition, I would
like to take this opportunity to thank all the members of the photonics research group.
I am indebted to my parents and wish to express my thanks for their constant trust which
permits me to pursuit the excellence. I wish to express my gratitude to my wife Li Qian
for her continuous moral support. And thanks to my younger brother and two sisters for
their encouragement.
I wish to express my gratitude to the Research Grant Committee of the Hong Kong
Polytechnic University for providing the financial support for my Ph.D. study.

Contents - i -
CONTENTS
ABSTRACT
ACKNOWLEDGMENTS
Chapter 1 Introduction
1.1 Research Motivation and Contributions 1
1.2 Thesis Outline 4
1.3 Publications 6
Chapter 2 Background Review
2.1 Introduction 9
2.2 Photonic Crystal Fibers 9
2.2.1 Basic Properties of Photonic Crystal Fiber 9
2.2.1.1 Index Guiding PCF and Photonic Band Gap Guiding PCF 10
2.2.1.2 Characteristics of Optical Guidance 14
2.2.2 Optical Fiber Sensors based on Photonic Crystal Fibers 21
2.3 Fundamentals of Fiber Bragg Gratings 25
2.3.1 Basic Principles of Fiber Bragg Gratings and FBG Sensors 25
2.3.2 Multiplexing techniques of FBG Sensors 28
2.3.3 Interrogation Techniques for FBG Sensors 36
2.4 Summary 39
References 40
Chapter 3 Torsion Sensor Based on Polarization-Maintaining Photonic Crystal Fiber

Contents - ii -
3.1 Introduction 49
3.2 Theoretical Analysis of PM-PCF based Optical Fiber Torsion Sensor 51
3.3 Experimental Results of the Proposed Torsion Sensor 55
3.3.1 Performance of the PM-PCF based Torsion Sensor 55
3.3.2 Temperature Characteristics 57
3.4 Summary 58
References 60
Chapter 4 Pressure Sensor Realized with Polarization-Maintaining Photonic Crystal Fiber based Sagnac Interferometer
4.1 Introduction 63
4.2 Fiber Bragg Gratings Pressure Sensors 64
4.3 Background Review of Polarization-Maintaining Fiber Sagnac Interferometer 66
4.3.1 Fiber Sagnac Interferometer 66
4.3.2 Sensing Applications of Sagnac Interferometer 67
4.4 Pressure Sensor based on PM-PCF Sagnac Interferometer 69
4.4.1 Principle of Pressure Sensor with PM-PCF Sagnac Interferometer 69
4.4.2 Performance of the Pressure Sensor 72
4.4.3 Compact Size and Temperature Insensitive 75
4.5 Summary 77
References 79
Chapter 5 High Temperature Sensor Using a Polarization-Maintaining Photonic Crystal Fiber based Sagnac Interferometer
5.1 Introduction 83
5.2 High Temperature Characteristics of Fiber Bragg Gratings and Long Period Gratings 84

Contents - iii -
5.2.1 Properties of Fiber Gratings at High Temperature 84
5.2.2 High Temperature Sensor with Femtosecond Laser Fabricated FBG 85
5.2.3 CO2 Laser Fabricated Long Period Gratings for High Temperature Sensing 89
5.2.4 Characteristics of Tapered Long Period Gratings on PCF at High Temperature 92
5.3 High Temperature Sensor based on PM-PCF Sagnac Interferometer 94
5.3.1 Temperature Characteristics of PM-PCF 94
5.3.2 Performance of PM-PCF Sagnac Interferometer as a High Temperature Sensor 95
5.4 Summary 98
References 100
Chapter 6 Multiplexing of Polarization-Maintaining Photonic Crystal Fiber based Sagnac Interferometer
6.1 Introduction 104
6.2 Multiplexing Techniques of PM-PCF based Sagnac Interferometer Sensors 105
6.2.1 CWDM Technique 105
6.2.2 Multiplex in Series along a Single Fiber 108
6.2.3 Multiplex in Parallel by Couplers 110
6.3 Summary 112
References 113
Chapter 7 Dispersion Compensating Module based Interrogator for Fiber Bragg Grating Sensors
7.1 Introduction 114
7.2 FBG Interrogation System based on Dispersion Compensating Module 115
7.2.1 Experimental Setup and Operating Principle 115
7.2.2 Experimental Results and Discussion 117

Contents - iv -
7.3 Summary 121
References 122
Chapter 8 Long-distance and Quasi-distributed Fiber Bragg Gratings Sensor System
8.1 Introduction 123
8.2 High Dynamic Range Long-distance and Quasi-distributed FBG Sensor System with Three Broadband Light Sources in Series 128
8.2.1 High Dynamic Range for Interrogation 129
8.2.2 Sensing Distance 132
8.3 Long-distance and Quasi-distributed FBG Sensor System using a Pulse Modulated Semiconductor Optical Amplifier Ring Cavity 138
8.3.1 Synchronization Issue 140
8.3.2 Multiplexing Capability 144
8.4 Summary 150
References 151
Chapter 9 Conclusions and Future Work
9.1 Summary 153
9.2 Conclusions 155
9.2 Future Work 157

Chapter 1 Introduction
Chapter 1
Introduction
1.1 Research Motivation and Contributions
Optical fiber sensors have been studied intensely for more than 30 years with their
applications developed rapidly in variety of areas in recent years. Initially, most of the
fiber sensors remained laboratory-based at the prototype stage and were developed to
replace conventional electro-mechanical sensors which are well established, have proven
reliabilities and relatively low manufacturing costs, thus less commercial successes have
been achieved. In recent years, the manufacturing cost of fiber sensors is decreasing and
more fiber sensors are implemented for industrial applications. Optical fiber sensors offer
important advantages such as electrically passive operation, EMI immunity, high
sensitivity, and large-scale multiplexing capability. The promising utilization of optical
fiber sensors plays an important role in variety of areas include civil engineering
structural monitoring, textile structural composites monitoring, railway, spacecraft,
marine, nuclear and medical applications.
Photonic crystal fibers (PCFs), emerged recently with a wide range of inherent
fabrication geometry, have attracted lots of research activities due to a host of highly
unusual and tailorable properties. PCF is a new class of optical fiber based on the
properties of photonic crystals, which renders its ability to confine light in hollow cores
1

Chapter 1 Introduction
and with confinement characteristics not possible in conventional optical fibers. A variety
of application areas including fiber-optic communications, fiber lasers, nonlinear devices,
high-power transmission, and high sensitive gas sensors are exploited for PCF. Sensing is
a relatively unexplored area for PCF. However, the opportunities are myriad with many
fields including biomedical sensing, environmental monitoring, and structural monitoring.
Different types of PCFs provide lots of novelties that can benefit sensing applications.
For example, a commercial available polarization-maintaining PCF (PM-PCF) exhibits
high birefringence with temperature insensitive and exceptional low bending loss. The
PM-PCF is thus found to be a promising candidate in sensing applications including
torsion, pressure and high temperature, etc.
Fiber Bragg gratings (FBGs) represent a key element in the established and
emerging fields of optical fiber sensing. FBG has been considered an excellent sensor
element which is suitable for measuring static and dynamic fields, such as temperature,
strain, and pressure, etc. The wavelength-encoded measurand information makes FBG
sensor self-referencing, rendering it independent of light level fluctuation due to source
power or connector losses that plague many other types of optical fiber sensors. The
capability of multiplexing FBGs makes the FBG sensing applications much more
attractive than other types of optical-fiber sensors, different multiplexing techniques have
been proposed and developed. The interrogation of FBG sensors is also important with
emphasis on the accuracy, resolution, and speed. For practical applications of FBG sensor,
special requirements are required for certain sensor systems. These include high speed
interrogation, long-distance and quasi-distributed sensing, etc.
2

Chapter 1 Introduction
In this thesis, we describe the investigation of polarization-maintaining photonic
crystal fiber (PM-PCF) based sensors which have their own advantages over grating
sensors. In addition, Fiber Bragg grating (FBG) sensor systems with special requirements
for practical applications have been studied and developed.
The main contributions made during the author’s Ph.D. study are summarized as
follow:
• Investigation of the PM-PCF for torsion sensing applications. A novel PM-PCF
based optic polarimetric torsion sensor has been proposed and demonstrated
experimentally. High normalized torsion sensitivity was measured to be ~0.014/°
within the linear twist angle range from 30° to 70°. The proposed torsion sensor is
highly repeatable over 90-degree twist in both CW and CCW directions.
• Development of a PM-PCF based Sagnac interferometer for pressure sensing. A
high pressure sensitivity of 3.42 nm/MPa has been achieved by using a 58.4-cm
PM-PCF. The proposed pressure can be made very compact and with reduced
temperature sensitivity.
• The temperature characteristics of the PM-PCF based Sagnac interferometer from
room temperature to 1160°C have been investigated and compared with other
fiber grating based temperature sensors. The PM-PCF based Sagnac
interferometer has potential for high temperature sensing applications. A
temperature sensitivity of ~ 11pm/°C was achieved from 400°C to 800°C.
• The multiplexing capability of PM-PCF based Sagnac interferometer sensors has
been investigated and three multiplexing techniques were proposed and
demonstrated experimentally. One was based on the wavelength domain
3

Chapter 1 Introduction
multiplexing by using CWDM, while the other two schemes were based on direct
connection in series along a single fiber and multiplexing in parallel by couplers.
• A novel high speed FBG sensor interrogation system has been proposed and
demonstrated. It is based on the transformation from wavelength domain to time
domain by using dispersion compensating module. Instead of measuring the
Bragg wavelength shift, the sensing information is determined by the time
difference in the time domain. The promising high interrogation speed has been
studied.
• A long-distance and quasi-distributed FBG sensor system has been investigated.
Two schemes have been proposed and demonstrated experimentally, one was the
cascaded three broadband light sources based on a wavelength division
multiplexing (WDM) technique and the other was with time division multiplexing
(TDM) based on a pulse modulated semiconductor optical amplifier (SOA) ring
cavity. The numbers of FBGs distributed along the long distance are 6 with 75 km
and 40 km, respectively.
1.2 Thesis Outline
It is the author’s intention that this thesis be readable for an audience that has a
general knowledge in the field of physics, optics and mathematics. The fundamentals of
photonic crystal fibers (PCFs) and fiber Bragg gratings (FBGs) are therefore reviewed
along with a short introduction to their sensing applications in chapter 2. The main
properties of PCFs have been reviewed and their applications for sensing are introduced.
The principle of FBG sensor is given followed with its related sensing application
techniques include the multiplexing techniques and the interrogation techniques.
4

Chapter 1 Introduction
Chapter 3 gives an introduction to the utilization of optical fibers as torsion
sensors with special attention paid to polarization-maintaining fibers. The use of PM-PCF
as a fiber optic polarimetric torsion sensor has also been proposed and demonstrated
experimentally. Theoretical analysis is carried out for our proposed torsion sensor which
agrees well with the experimental results. The high torsion sensitivity and reduced
temperature sensitivity of our proposed torsion sensor is then studied in detail.
In Chapter 4, FBG based pressure sensors have been briefly reviewed first. Then,
we give a background review of the principle of Sagnac interferometer and its application
in both fiber optic communications and fiber optic sensing. The unique characteristics of
PM-PCF provide benefit to it as a pressure sensing device, such as temperature
insensitivity, low bending loss, compact size, etc. The principle and performance of our
proposed pressure sensor have been studied in detail.
Chapter 5 focuses on the study of different optical fibers’ properties at high
temperature. Several kinds of fiber sensor are investigated, such as those based on
Femtosecond laser fabricated FBG, CO2 laser fabricated LPG, Tapered LPG on
conventional fiber, and Tapered LPG on PCF. Finally, the PM-PCF based Sagnac
interferometer is proposed and demonstrated for high temperature sensing applications.
The temperature coefficient obtained was ~ 11pm/°C with a good linearity within the
temperature range from 400°C to 800°C.
In Chapter 6, we study the multiplexing capability of PM-PCF based Sagnac
interferometer. Three multiplexing techniques have been proposed, which are based on
multiplexing in the wavelength domain by using CWDM, direct connection in series
along a single fiber, and multiplexing in parallel by using couplers. Among the three
5

Chapter 1 Introduction
proposed multiplexing techniques, the CWDM technique enables real-time system
implementation.
Chapter 7 describes a novel high speed FBG sensor interrogation system we have
proposed. A brief introduction of a high speed interrogation system is given at the
beginning of this chapter. Then, we describe the principle of our proposed FBG
interrogation system. Instead of having the conventional detection of Bragg wavelength
shift, we transform the wavelength shift to time difference in the time domain by a using
dispersion compensating module. Furthermore, the Bragg wavelength shift can be
obtained by measuring the time difference in time domain with the implementation of
high speed devices such as modulator and photondetectors. The potential of the system
for high speed interrogation and has also been studied. An effective sampling speed of
2.44 megasamples per second has been demonstrated experimentally.
In Chapter 8, we have proposed and investigated two schemes for the
implementation of a long-distance and quasi-distributed FBG sensor system. One is based
on three cascaded broadband light sources a long a fiber link, and the other is based on a
pulse modulated SOA ring cavity. An introduction to the research and development of
long-distance and quasi-distributed FBG sensor system is provided at the beginning of
this chapter. The high dynamic interrogation range and sensing distance of the first
scheme is analyzed. For the pulse modulated SOA ring cavity scheme, the
synchronization issue and multiplexing capability have been studied.
Chapter 9 summarizes the thesis and discusses the future work that will be
extended.
6

Chapter 1 Introduction
1.3 Publications
The following publications arose during the research study:
Journal Papers
1 H. Y. Fu, H. Y. Tam, L. Y. Shao, X. Y. Dong, P. K. A. Wai, C. Lu, and Sunil K.
Khijwania, “Pressure Sensor Realized with Polarization-Maintaining Photonic
Crystal Fiber based Sagnac Interferometer,” Applied Optics, Vol. 47, pp.2835-2839,
(2008).
2 H. Y. Fu, H. L. Liu, X. Y. Dong, H. Y. Tam, P. K. A. Wai, and C. Lu, “High-speed
fibre Bragg grating sensor interrogation using dispersion compensation fibre,”
Electronics Letters, Vol.44, pp.618-619, (2008).
3 H. Y. Fu, H. L. Liu, W. H. Chung, and H. Y. Tam, “A Novel Fiber Bragg Grating
Sensor Configuration for Long-distance Quasi-distributed Measurement,” IEEE
Sensors Journal, Vol.8, pp.1598-1602, (2008).
4 X. Y. Dong, L. Y. Shao, H. Y. Fu, H. Y. Tam, and C. Lu, “Intensity-modulated
fiber Bragg grating sensor system based on radio-frequency signal measurement,”
Optics Letters, Vol. 33, No. 5, pp.482-484, Mar. 2008.
Conference Papers
1 H. Y. Fu, S. K. Khijwania, H. Y. Au, X. Y. Dong, H. Y. Tam, P. K. A. Wai, and C.
Lu, “Novel fiber optic polarimetric torsion sensor based on polarization-
maintaining photonic crystal fiber,” 19th International Conference on Optical Fiber
Sensors (OFS’19), Perth, Australia, Apr. 2008.
7

Chapter 1 Introduction
2 H. Y. Fu, H. L. Liu, H. Y. Tam, P. K. A. Wai, and C. Lu, “Novel Dispersion
Compensating Module based Interrogator for Fiber Bragg Grating Sensors,” 33rd
European Conference on Optical Communication (ECOC’2007), Vol.2, Tu3.6.5,
pp.95-96, Berlin, Germany, Sep. 2007.
3 H. Y. Fu, H. L. Liu, H. Y. Tam, P. K. A. Wai and C. Lu, “Long-distance and quasi-
distributed FBG sensor system using a SOA based ring cavity scheme,” in Proc. Of
Optical Fiber Communication Conference (OFC’2007), OMQ5, California, USA,
Mar. 2007.
4 X. Y. Dong, L. Y. Shao, H. Y. Fu, H. Y. Tam, and C. Lu, “FBG sensor
interrogation based on RF signal measurement,” 19th International Conference on
Optical Fiber Sensors (OFS’19), Perth, Australia, Apr. 2008.
5 H. L. Liu, W. H. Chung, H. Y. Fu, and H. Y. Tam, “A Novel FBG Sensor
Configuration for Long-distance Measurement,” 18th International Conference on
Optical Fiber Sensors (OFS’18), Cancun, Mexico, Oct. 2006.
8

Chapter 2 Background Review
Chapter 2
Background Review
2.1 Introduction
In this chapter, we will give a background review on two important fiber optic
components, the photonic crystal fibers (PCFs) and fiber Bragg gratings (FBGs). The
basic principles together with their main properties will be described, and emphasis will
be on their sensing applications.
2.2 Photonic Crystal Fibers
2.2.1 Basic Properties of Photonic Crystal Fiber
Photonic crystal fiber (PCF), also called microstructured optical fiber, is a new
class of optical fiber that guides light by a periodic array of microstructure running down
the entire fiber length [1-3].
PCFs are drawn by the same methods as conventional optical fibers. PCF perform
is constructed either by stacking silica capillaries [3], by drilling holes or by extrusion [4,
5]. Then the preform is drawn down to a much smaller diameter on a fiber-drawing tower,
shrinking the preform cross section while maintaining the same features. Kilometers of
PCF can be drawn from a single preform. Most of the PCFs have been fabricated in silica
glasses. However, other glasses have also been used to obtain particular optical properties.
9

Chapter 2 Background Review
Microstructured polymer optical fibers which have been termed “MPOF” have been
explored with graded index structures, ring structured fibers and hollow core fibers [4]. A
combination of polymer and chalcogenide glass was reported by Temelkuran et al. for
10.6 µm wavelengths where silica is not transparent [6].
2.2.1.1 Index Guiding PCF and Photonic Band Gap Guiding PCF
Based on the flexibility of fabrication methods, both solid core and hollow core
PCFs can be fabricated, as shown in Figure 2.1. However, the guiding mechanisms
between them are completely different. While the solid core PCF depends on modified
total internal reflection (M-TIR) which is similar to the conventional optical fiber, optical
transmission in the hollow core PCF is based on the photonic band gap (PBG) that allows
the core to have lower refractive index than the cladding. The PBG fibers confine light
using a photonic band gap rather than index guiding. The existing of full 2-D PBG in
silica/air structure was demonstrated by Birks et al. as early as 1995 [7].
Figure 2.1 Scanning electron micrographs of PCFs. (a) Index guiding photonic crystal
fiber with solid core [1] and (b) photonic band gap crystal fiber with hollow core [3].
10

Chapter 2 Background Review
Index guiding photonic crystal fiber is based on the modified total internal
reflection (M-TIR) and guides light similar with the conventional fiber. Figure 2.1 (a)
shows this kind of PCF with the central capillary replacing with a solid rod. It may be
defined as one when the mean cladding refractive index is lower than that of core.
However, the index difference between cladding and core is much larger than that of
conventional fibers which is typically around one percent. The low-index cladding
exhibits unique characteristics that distinguish it markedly from that of conventional fiber.
The core does not become multimode no matter how short the wavelength of the light,
that is endlessly single mode (ESM) [2]. The ESM property can be understood by
considering the strong wavelength dispersion of photonic crystal cladding which causes
the core-cladding refractive index difference to fall as the wavelength becomes shorter.
βFSM is the propagation constant of the fundamental space-filling mode (FSM) which is
the fundamental mode of the infinite photonic crystal cladding without the central defect
or core [2]. βFSM < β prohibits light propagation in the cladding and its strong wavelength
dependence prevents transmission of short-wavelength light. In contrast, conventional
fibers guide more and more modes as the wavelength becomes shorter.
Figure 2.2 shows the propagation diagram of a PCF with 45% air-filling fraction
[7, 8]. The propagation diagram is a convenient graphical tool for describing light
propagation in fiber, which gives the frequency ranges as a function of axial wavevector
β. Light is free to propagation for β < kn, where k=ω/c is the vacuum wavevector and n is
the refractive index at that frequency for the considered region in the diagram. It is
evanescent for β > kn, and at β = kn, the critical angle is reached resulting the TIR that
light incident from a medium with refractive index larger than n. For conventional single-
11

Chapter 2 Background Review
mode fiber, all the guided modes should be with wavevector in the interval of kncl < β <
knco, where nco and ncl are the core and cladding refractive indices, respectively. The
propagation diagram of a triangular lattice of air channel in silica glass with 45% air-
filling fraction has been investigated [7]. As shown in Figure 2.2, the vertical axis is the
normalized frequency ωΛ/c and the horizontal axis is the normalized wavevector βΛ,
where Λ is the spacing between the adjacent air holes. In region 1, light is free to
propagate in air, photonic crystal (PC) and silica. The propagation of light is turned off
for air in region 2 and further turned off for PC in region 3. Finally, light is evanescent
for all the media in region 4. The PCF possesses unique characteristics that full photonic
band gaps exist (the black fingers). Light is free to propagate in the silica core but
blocked by the PC at point A. The fascinating point is that light is free to propagate in the
air while blocked from penetrating through the cladding at point B. The existed black
fingers overlap with air line (β/k=1), is the conditions required for a hollow-core mode.
Figure 2.2 Propagation diagram for a PCF with 45% air-filling fraction [8].
12

Chapter 2 Background Review
Photonic band gap guiding photonic crystal fiber is based on the photonic crystal
that prohibits light propagation in the cladding due to the PBG effects while permiting
light transmission in a low-index core. The operation principle of PBG guiding PCF is
physically different from that of conventional fiber, and even different from that of index
guiding PCF. A hollow-core fiber is unexpected and was even unbelievable for a long
time since a positive core-cladding index difference is the fundamental physical
requirement for TIR. However, with the novelty of PBG effects, the hollow-core PCF
comes into view and was finally realized. Figure 2.1 (b) shows the first hollow-core
photonic band gap crystal fiber [3]. The hollow-core brings lots of attractive properties
for PCF including easy to couple light into the core, extreme low loss guidance in
vacuum or compatible gas, strong interactions are possible for low-index materials filled
in the core such as gas, high power delivery with low nonlinear effects, atom guiding and
laser delivery of small particles, etc., all of these open up a new era for the applications of
PCFs.
Various types of PCFs have been proposed and investigated by restructuring the
transverse plane or introducing doped materials with different refractive indices other
than air or pure silica. All these PCFs are either based on the mechanism of index guiding
or photonic band gap guiding. Figure 2.3 shows some representative sketches for the
different PCFs which bring us their unique characteristics.
13

Chapter 2 Background Review
Figure 2.3 Representative sketches of different types of PCFs that has been developed
(The black regions are hollow, the white regions are pure silica, and grey ones are doped-
silica) [8].
2.2.1.2 Characteristics of Optical Guidance
Attenuation: Low attenuation is one of the main reasons that the use of fiber become
practical for optical communication and it has always been concerned as an important
factor for other applications. In PCFs, the losses are governed by two main parameters,
namely the fraction of light in the glass and the roughness at the air-glass interfaces.
These losses can be classified as three categories: (a) absorption and scattering (b)
confinement loss and (c) bend loss.
For solid-core PCF, low loss down to 0.24 dB/m at 1550 nm was reported in 1999
[9]. However, the length was limited to tens of meters for such PCF. Later, a record level
stands at 0.28 dB/km at 1550 nm was achieved by one group in Japan and a hundred
14

Chapter 2 Background Review
kilometers of this PCF was used for the first PCF-based penalty-free dispersion-managed
soliton transmission system at 10 Gb/s [10]. The roughness of glass-air interfaces of
solid-core PCF results slightly higher loss than that of the conventional SMF whose loss
is limited by Rayleigh scattering and material absorption within bulk glass [11]. While
the basic scattering and absorption of bulk glass can be greatly reduced owing to the
empty or gas-filled core for hollow-core PCF, its loss is still limited by the surface
roughness caused by frozen-in capillary waves. Under this limitation, the lowest reported
attenuation achieved in hollow-core PCF is 1.2 dB/km at 1620 nm [12].
Similar to the evanescent plane waves in the cladding of a conventional fiber, if
the thickness of the PCF cladding is not large enough, there is substantial attenuation for
the evanescent field amplitudes at the cladding/coating boundary. White et al.
investigated the confinement loss of a solid-core PCF without considering the material
absorption and fabrication defects (Figure 2.4) [13]. Their results show that larger loss at
smaller values of hole diameter to pitch ratio d/Λ, and increase in the number of rings of
holes can enhance the confinement, thus reducing the loss. At a fixed hole pitch Λ of 2.3
µm, the confinement loss of the PCF with three rings of holes is wavelength dependent as
shown in Figure 2.4 (b). The hollow-core PCF experiences the loss similarly, and an
increase in the number of rings in the cladding can strengthen the whole PBG effect to
achieve low loss levels.
15

Chapter 2 Background Review
Figure 2.4 Confinement loss for a solid-core PCF as a function of (a) the number of rings
and hole diameter to pitch ratio and (b) wavelength with a fixed hole pitch of 2.3 µm [13].
Conventional fiber suffers an additional loss if bent with a critical radius and the
loss depends on wavelength, core-cladding refractive index step, and the third power of
16

Chapter 2 Background Review
core radius [5]. Its single mode bandwidth is limited by the higher order mode cutoff at
short wavelength and macro-bend loss at the long wavelength. A solid-core PCF also
exhibits a short-wavelength bend edge caused by the coupling from the fundamental
mode to higher order modes, which leak out of the core finally. However, the long-
wavelength bend edge can only occurs for λ >> Λ/2 which is located beyond the
transparent window of silica glass [14]. By contrast, hollow-core PCF is highly
insensitive to bend loss and no significant loss is observed until the fiber breaks. The
physical reason behind this is the effective depth of confinement for guided light due to
the PBG effect.
(a) (b) (c)
(d) (e) (f)
Figure 2.5 Scanning electronic microscopy (SEM) images of various Hi-Bi PCFs with
both solid core and hollow core.
17

Chapter 2 Background Review
Birefringence: The two fundamental modes of a perfect hexagonal symmetric PCF are
not degenerate, namely, the fiber is not birefringent [15, 16]. However, due to the large
glass-air index difference, PCFs are easy to yield a degree of birefringence by even a
slight distortion caused during the fabrication process. High birefringence PCFs (Hi-Bi
PCFs) can then be achieved by introducing different air-holes along the two principle
axes or by having a local elongation of the core region to lift the degeneracy [17-25].
As shown in Figure 2.5, various Hi-Bi PCFs have been designed and/or fabricated
with both solid core and hollow core. Figure 2.5 (a) shows the first Hi-Bi PCF reported
by A. Ortigosa-Blanch et al. The twofold rotational symmetry was introduced to the PCF
by different air hole sizes in the cladding [17] and a beat length with approximately 0.4
mm at the wavelength of 1540 was achieved. Another type of Hi-Bi PCF (Figure 2.5b)
has been fabricated with low loss of 1.3 dB/km at 1550 nm by one research group in
Japan [18]. The modal birefringence is introduced with two large air holes surrounding
the core in one of the orthogonal direction. The birefringence is determined by the ratio
(d1/d2) between the diameters of the two large air holes and that of the small air holes in
cladding, modal birefringence of 1.4x10⁻³ was achieved with a ratio of 0.40 while light
leakage will happen if the ratio is further increased [19]. The anisotropy can also be
introduced to the core instead of the cladding, however, the fabrication control is
comparable difficult. Figure 2.5 (c) shows a near-elliptic core index-guiding PCF,
birefringence of 1.129x10⁻³ at 1545 nm was predicted while higher than that was
achieved experimentally [20]. Based on the idea of PANDA fibers, boron-doped silica
can also act as stress applying parts to bring birefringence for PCF, as shown in Figure
2.5 (d) [21, 22]. The fiber was realized to have both single mode and with practical
18

Chapter 2 Background Review
constant birefringence at large wavelength range. Highly birefringent hollow core PCFs
which with asymmetric air cores have also been suggested and numerical analysis
indicated the high birefringence in the order of 10-3 is possible [23]. Chen et al. have
realized a hollow core PCF experimentally with birefringence as high as 0.025 at 1550
nm [44]. The core has an anisotropic shape with twofold symmetry with a long axis of
9.4 µm and a short axis of 8.1 µm (Figure 2.5 e). For highly birefringent hollow core PCF,
one can reduce the field intensity at the core-cladding interfaces as well as the fraction of
the mode power resides within the glass by incorporating number of localized features
within the glass ring surround the core (Figure 2.5 f) [25].
Group velocity dispersion (GVD): The Group velocity dispersion (GVD) will cause
different frequencies of light to travel at different group velocity in the fiber. It is a
crucial factor that one needs to be considered for telecommunication systems and all
those applications that are related with optical nonlinearity. For conventional SMF, the
sign of GVD changes from anomalous (D>0) to normal (D<0) at the wavelength around
1.3 µm. The magnitude and sign of GVD in PCF can be easily designed by using
different patterns of holes. The anomalous dispersion can be achieved at wavelengths
which are impossible for conventional fibers [26]. It enables the demonstration of soliton
propagation and supercontinuum (SC) generation [27, 28]. The broadband continuum
spectrum can be generated efficiently with a small effective core area PCF by pumping
light at the zero dispersion wavelength. As shown in Figure 2.6, ultra-broadband
continuum with wavelengths from 500 nm to 1600 nm was achieved by injecting 100-fs
short pulses around 790 nm with peak power at 8 kW to a 75-cm PCF [28]. The PCF
19

Chapter 2 Background Review
used has a calculated zero-dispersion wavelength of 767 nm. The broadband spectrum
provides a range of new source wavelengths for sensing applications.
Figure 2.6 Optical spectrum of the generated supercontinuum in a 75-cm PCF which is
pumped by a 100-fs pulse (the dashed curve) [28].
Kerr Nonlinearities: PCFs can enhance or reduce the kerr nonlinearities. Together with
the controlling of GVD, we can study lots of nonlinear effects include four-wave mixing,
self-phase modulation, soliton formation, and stimulated Raman scattering [8]. One of the
most successful applications of nonlinear PCFs is the SC generation we have just
discussed. Some other applications are 1) parametric amplifiers and oscillators, 2)
correlated photon pairs which is an important source for quantum communications, 3)
soliton self-frequency shift cancellation.
20

Chapter 2 Background Review
2.2.2 Optical Fiber Sensors based on Photonic Crystal Fibers
Owing to its novel optical properties, PCF is now finding applications in a variety
of area of optical communication and optical fiber sensing. For the optical fiber sensing
applications, PCF demonstrated its potential in areas such as biomedical sensing,
environmental monitoring, and structural sensing [29-39].
Figure 2.7 SEM image of a large-mode-area double-clad fiber for two-photon
fluorescence detection [29].
As shown in Figure 2.7, a double-clad PCF was used to improve the detection
efficiency of fluorescence detection [29]. By using double-cladding, both of the
excitation and collection efficiencies can be optimized, while that of the fiber probe based
on conventional SMFs is limited by the low numerical aperture (NA). The excitation light
(810 nm) is launched to the sample through inner core and two-photon fluorescence (580
nm) is collected back through a high-NA outer core. Jensen et al. detected biomolecules
in an aqueous solution utilizing the interaction between the evanescent field and the
filling material in PCFs [30]. The solution is filled in the air holes of the PCFs, and
21
Chapter 2 Background Review
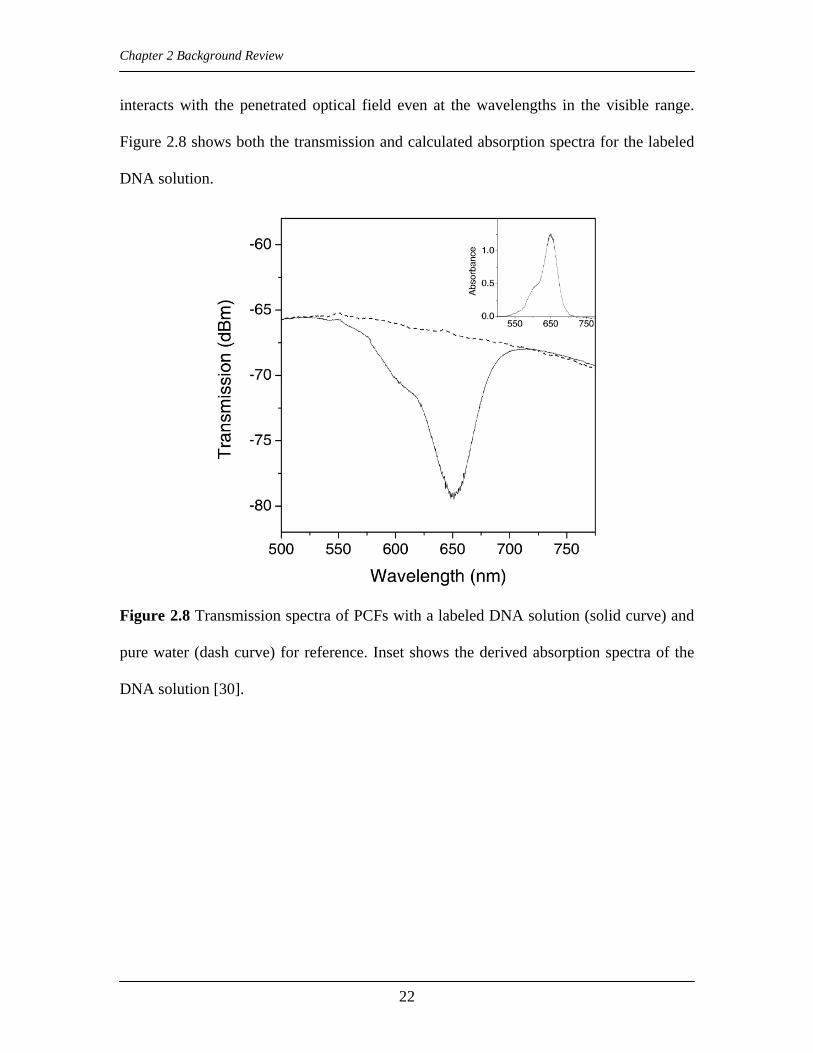
interacts with the penetrated optical field even at the wavelengths in the visible range.
Figure 2.8 shows both the transmission and calculated absorption spectra for the labeled
DNA solution.
Figure 2.8 Transmission spectra of PCFs with a labeled DNA solution (solid curve) and
pure water (dash curve) for reference. Inset shows the derived absorption spectra of the
DNA solution [30].
22

Chapter 2 Background Review
Figure 2.9 Measured absorption spectrum of 100% acetylene with a 75-cm PCF [31].
Gas or liquid can be filled in the air holes of PCFs which offers the possibility of
environmental sensing applications [31-33]. In comparison with conventional fibers,
PCFs do not need to be striped of the cladding or coating that makes them durable.
Furthermore, the extremely long optical path lengths and ultra-low bending loss permits
sensitive and compact sensors to be realized, benefiting sensing applications for gas or
liquid. With the enhanced evanescent field effects achieved by PCFs, the concentration of
pollutants can be measured from the absorption spectra when light propagates through the
gas for a range of wavelengths [34]. The transmission spectrum of a 75-cm PCF hole-
filled with near 100% acetylene is shown in Figure 2.9 [31]. Absorption of 7 dB was
measured at the 1521 nm. Fini has designed a novel water-core PCF for aqueous sensing
applications [32]. Ritari et al. investigated the characteristics of gas sensing by using
photonic bandgap PCFs with a hollow core [33]. It demonstrates the ability of such PCFs
in sensing both strongly (acetylene/hydrogen cyanide) and weakly (methane/ammonia)
absorbing gases.
23

Chapter 2 Background Review
Figure 2.10 SEM images of multi-core PCFs for bend sensing. (a) Three-core PCF (b)
Two-core PCF.
PCFs also show their promising sensing applications for temperature, pressure,
tension, bend, etc. Bock et al. measured the sensitivity of group index single-mode PCF
to temperature, hydrostatic pressure, and tension [35]. By using an interferometric
method, the susceptibilities of the group refractive index to temperature, elongation, and
static pressure are measured to be ,151028.1/ −−×+= KdTdN strainddN /40.0/ −=ε
and respectively. Statkiewicz et al. studied the sensitivity of
birefringence and polarization properties of a highly birefringent PCF to hydrostatic
pressure, strain, and temperature [36-37]. Deformation of the structure can be monitored
by using multiple-core PCFs (Figure 2.10). Bending of the fiber can be detected by
analyzing its far-field pattern fringes to determine the strain induced phase difference for
each of the three cores, and a bend sensitivity of 2.33 rad mm
15100.1/ −−×−= MPadpdN
-1 has been achieved by this
method [38]. A two-core PCF was used to address remote optical fiber curvature and the
bend sensitivity of 127 rad/rad and angular resolution better than 170 µrad was obtained
at 25 Hz [39].
24

Chapter 2 Background Review
2.3 Fundamentals of Fiber Bragg Gratings
2.3.1 Basic Principles of Fiber Bragg Gratings and FBG Sensors
Fiber Bragg gratings (FBGs) play an important role in the established and
emerging aspect of optical communications as pump lockers in optical fiber amplifiers,
dispersion compensators, narrowband wavelength reflectors in Raman amplifiers, etc.
FBGs are also commonly used as fiber optic sensors due to its wavelength-selective
nature, EMI immunity and large-scale multiplexing capability [40]. It is a periodic
perturbation of the refractive index along the fiber core that is formed by exposing it to an
intense optical interference pattern. The first demonstration of permanent gratings in an
optical fiber was done by Hill et al. in 1978 at the Canadian Communications Research
Centre (CRC), Ottawa, Canada [41-42]. Using a germania-doped silica fiber and visible
argon ion laser radiation, the gratings were formed by the standing wave in the fiber and
known as “Hill gratings”. Photosensitivity which refers to a permanent change in the
index of refraction of the fiber core when exposed to light with characteristic wavelength
and intensity was thought to be only associated with the “Hill gratings”, but it has been
observed though photoexcitation at different UV wavelengths in a wide variety of
different fibers in the following years of research. At present, various techniques can be
used to inscribe standard and complex Bragg grating structures in the optical fibers using
‘side-writing’ approach in which UV light is irradiated from the side of the fiber. One of
the most effective methods for inscribing Bragg gratings in photosensitive fiber is the
phase-mask technique.
25

Chapter 2 Background Review
Fiber Cladding Bragg Grating Fiber Core
Λ
Braggbroad λλ − Braggλ
Index Modulation
broadλ
Transmission Spectrum Reflection Spectrum
Figure 2.11 Schematic representation of uniform Bragg gratings, with the reflection
spectrum and transmission spectrum under broadband incident light.
Uniform gratings [43] with the phase fronts perpendicular to the fiber’s
longitudinal axis and gratings planes with constant period, are considered the
fundamental building block for most Bragg grating structures. When a guided fiber mode
is incident upon a fiber grating, a certain proportion of the incident light is scattered at
each grating plane. Upon the so-called Bragg condition, the scattering created in each
wavelet would be in phase and a substantial proportion of the incident light would be
deflected to backward-traveling mode. The strongest reflection occurs at the first order
Bragg condition and the Bragg wavelength can be expressed as [43]:
Λ= effB n2λ , (2.1)
where neff is the effective refractive index of the fiber core, Λ is the grating period. Figure
2.11 shows the reflection and transmission spectra of a uniform FBG.
26

Chapter 2 Background Review
The impact of fiber Bragg gratings in the field of fiber-optic sensing is enormous.
FBGs are simple, intrinsic sensing elements that are photo-inscribed into silica fibers and
have all the advantages normally attributed to fiber optic sensors, such as electrically
passive operation, EMI immunity, and high sensitivity. In addition, the devices have an
inherent self-referencing capability and high multiplexing capacity in a serial fashion
along a single fiber. The measurand information is wavelength-encoded, thereby making
the sensor self-referencing, rendering it independent of light power fluctuation due to
source or connector losses that plague many other types of fiber optic sensor. Also, their
very low insertion loss and narrowband wavelength reflection offer convenient serial
multiplexing along a single monomode optical fiber, thus many network topologies can
be used for sensor system, thereby increasing flexibility.
The Bragg wavelength depends on the effective index of refraction of the core and
the periodicity of the grating. As both the effective index of refraction of the core and the
periodicity of the grating will affect by changes in strain and temperature, using (2.1) the
shift in Bragg wavelength due to strain and temperature changes is given by [43]
TT
nT
nl
ln
ln
effeff
effeff
B ∆∂Λ∂
+∂
∂Λ+∆
∂Λ∂
+∂
∂Λ=∆ )(2)(2λ . (2.2)
The first term in (2.2) represents the strain effect on optical fiber, while the second term
represents the effect on optical fiber by temperature.
A change in the strain of the fiber produces a Bragg wavelength shift due to
changes in the grating period and the photoelastic induced change in the refractive index.
The change in Bragg wavelength with applied strain can be expressed as [43]
ελλ ∆−=∆ )1( eBB p , (2.3)
where pe is an effective photoelastic coefficient, ε∆ is the applied strain. For silica fiber,
27

Chapter 2 Background Review
pe has a numerical value about 0.22, thus the normalized strain response is found to be
[43]
161078.01 −−×=∆∆ µεελ
λB
B
. (2.4)
For silica fiber operating at 1550 nm, the typical wavelength-strain sensitivity of FBG is
about µε/2.1 pm .
The dependence of the Bragg wavelength on temperature arises due to both the
changes in the refractive index and in the grating period, which the former one is the
dominant effect. The fractional Bragg wavelength shift for a temperature change T∆ is
given by [43]
TB
B ∆+=∆ )( ζαλλ , (2.5)
where α is the thermal expansion coefficient and ζ is the thermo-optic coefficient. The
typical wavelength-temperature sensitivity of FBGs written in Corning’s SMF28 fiber at
1550 nm is about 13 Cpm °/ .
2.3.2 Multiplexing Techniques of FBG Sensors
A large number of multiplexing schemes [40, 43] have been reported, but
generally they all fall into one of the following categories: wavelength-division-
multiplexing, time-division-multiplexing, spatial-division-multiplexing, code-division-
multiple-access, frequency-modulated continuous wave multiplexing, or a combination of
the aforementioned approaches.
Wavelength-Division-Multiplexing (WDM)
28

Chapter 2 Background Review
The most popular technique for multiplexing FBG sensors is WDM. FBG sensors
with different Bragg wavelengths can be written along a single optical fiber. Physical
separation between the sensors can be arbitrary or can be adjusted for desired locations. A
spectral window and guard bands must be allocated to each grating to accommodate the
operation range of the wavelengths expected from it during strain or temperature
measurements. This limits the number of gratings which will fit within the spectrum of a
given optical source. For example, a uniform spacing of 4 nm between the Bragg
wavelengths of the adjacent gratings correspond to strain measurement range of about
±1500 µe at 1550 nm for each sensor. Consequently, the maximum sensor numbers that
can be supported by a broadband source with a 40-nm spectrum width is 10.
Broadband Source
1λ 2λCoupler
VFP
Scanning Signal
Photodetector
Tunable Optical filter (TOF)
Nλ
Output
Figure 2.12 Schematic diagram of WDM with tunable filter approach [44].
Figure 2.12 shows a WDM scheme with a tunable optical filter (TOF) to measure
the different centre wavelengths of FBG sensor [44]. It uses a wavelength scanning
device, making system compact, reliable and easy to use in practice. As the TOF scans
29
Chapter 2 Background Review
over the returned signals from gratings, the Bragg wavelengths can be determined and
recorded from the voltage applied VFP to the filter. The level of sensor crosstalk is limited
by the extinction ratio of the filter. If the bandpass cut-off of the TOF is sufficiently steep
or the spectral separation between the gratings is large enough, the crosstalk can be
negligible.
A combined WDM and interferometric-detection system offers high wavelength
shift resolution was reported in [45]. The light reflected from each grating is sent through
a slightly unbalanced Mach-Zehnder interferometer to convert the wavelength changes
into phase changes. The signals are demultiplexed by use of WDM filter. The information
is contained in the phase changes and can be extracted using a phase-generated carrier
technique.
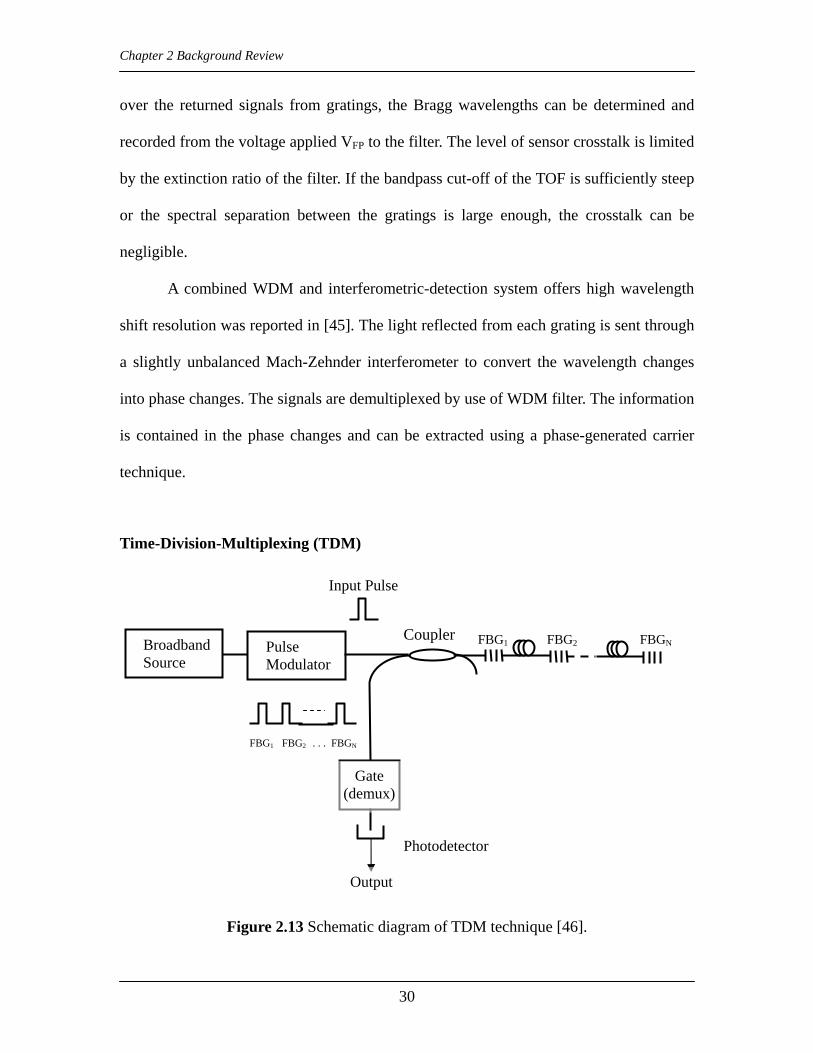
Time-Division-Multiplexing (TDM)
Input Pulse
Pulse Modulator
Coupler
FBG1 FBG2 . . . FBGN
FBG1 FBG2 FBGN
Output
Photodetector
Gate (demux)
Broadband Source
Figure 2.13 Schematic diagram of TDM technique [46].
30

Chapter 2 Background Review
As shown in Figure 2.13, TDM technique uses a pulsed or gated continuous-wave
(CW) source to illuminate gratings in sequence as the pulse travels along the fiber, the
reflected signals from the gratings are separated in time domain. The physical separation
between the gratings is limited by the input pulse width. A fast time-gated photodetector
can be then used to select the signal from individual grating for analysis. To achieve a
large multiplexing, the use of narrow pulses that involves relatively large peak power and
large bandwidth of photodetector are required. Therefore, in general the maximum sensor
numbers is limited to be less than 10.
Combined with interferometric wavelength shift detection scheme, four FBG
elements along a single fiber, separated by 5 m long fiber delay line with each other, have
been demonstrated by Weis et al [46]. A strain resolution of ~ 1 Hzn /ε was reported.
The grating elements in the sensor array can be either with same Bragg wavelength or
with different Bragg wavelengths. When combining TDM with WDM, reusing the source
spectrum can increase the number of sensors significantly. The sensors with same Bragg
wavelength are located at different time windows. The FBG sensors can be connected in
serial, in parallel or in branching topology.
31
Chapter 2 Background Review
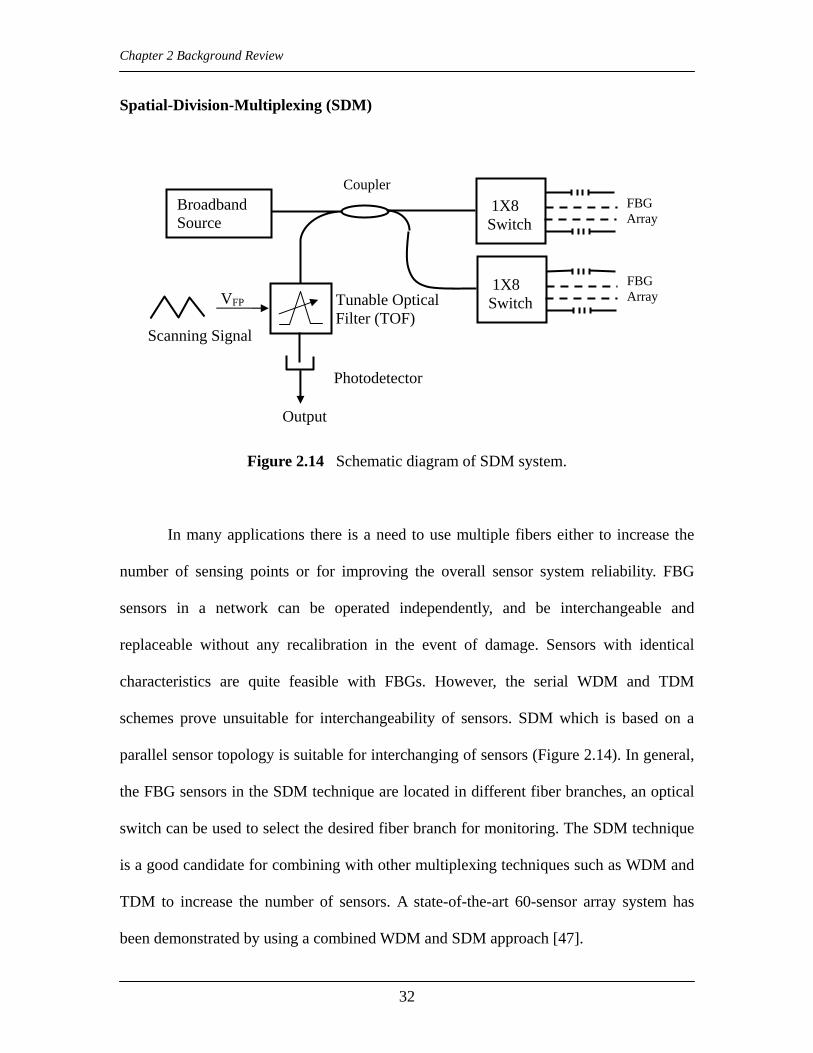
Spatial-Division-Multiplexing (SDM)
Broadband Source
VFP
Coupler
Tunable Optical Filter (TOF)
Photodetector
1X8 Switch
FBG Array
FBG Array
1X8 Switch
Scanning Signal
Output
Figure 2.14 Schematic diagram of SDM system.
In many applications there is a need to use multiple fibers either to increase the
number of sensing points or for improving the overall sensor system reliability. FBG
sensors in a network can be operated independently, and be interchangeable and
replaceable without any recalibration in the event of damage. Sensors with identical
characteristics are quite feasible with FBGs. However, the serial WDM and TDM
schemes prove unsuitable for interchangeability of sensors. SDM which is based on a
parallel sensor topology is suitable for interchanging of sensors (Figure 2.14). In general,
the FBG sensors in the SDM technique are located in different fiber branches, an optical
switch can be used to select the desired fiber branch for monitoring. The SDM technique
is a good candidate for combining with other multiplexing techniques such as WDM and
TDM to increase the number of sensors. A state-of-the-art 60-sensor array system has
been demonstrated by using a combined WDM and SDM approach [47].
32

Chapter 2 Background Review
Code-Division-Multiple-Access (CDMA)
Tunable Laser
Sensor 1 Output
Sensor1 Sensor2 Intensity Modulator
Coupler
PRBS
Delay
Delay
Photodetector
LPF
LPF
Mixer
Sensor 2 Output
Figure 2.15 Schematic diagram of a CDMA system (LPF: low pass filter) [48].
A pseuodorandom bit sequence (PRBS) is incorporated in the CDMA system as
shown in Figure 2.15 [48]. The PRBS is used for simplicity of the experimental
demonstration, while other bit sequence can also be used. The response of the FBG array
to a given PRBS is correlated with a time-shifted sequence of the same PRBS. By
adjusting the time delay between successive FBGs to be equal to one bit length or
multiple bit lengths of the PRBS, a given individual grating signal can be demultiplexed
by correlating with a reference PRBS which has the same bit shift. The number of sensors
in a CDMA system depends on the length of bit sequence, which can be up to (2m-1) by
assuming a one-bit time delay between sensors, where m is the number of bits of the
sequence. For m = 8, it was expected to multiplex up to 100 sensors. However, the source
crosstalk such as coherent effect was not investigated and only ~ 20 dB crosstalk was
demonstrated in a two sensor system. Further work needs to be carried out to fully
33

Chapter 2 Background Review
understand the potential of this technique.
Frequency-Modulated Continuous Wave (FMCW) Multiplexing
The FMCW technique is based on the modulation of light intensity from a
broadband source by a linear frequency-swept RF carrier with demodulation achieved by
using a tunable optical fiber (Figure 2.16) [49]. The carrier is generated by a voltage-
controlled oscillator (VCO). Signals from the FBG sensors at different positions in an
array are separated in the frequency-domain and can be separated by bandpass filters.
FBG1 FBG2 FBGN
Output
Photodetector reference signal
Coupler
Signal Generator
mixer
VCO
Intensity Modulator
TOF
Broadband Source
Figure 2.16 Schematic diagram of a FMCW multiplexing system [49].
As multiplexing is one of the important advantages of FBG sensors, different
multiplexing techniques are being continuously developed. WDM and TDM are two of
the most popular multiplexing techniques nowadays. Using these two methods,
interrogation of 1000 and 3000 sensors was achieved by OTDR and OFDR respectively
[50, 51]. There is a “bandwidth” constraint for WDM and a “time” constraint for TDM.
Methods are given trying to overcome these constraints, such as intensity and wavelength
dual-coding technique (IWDM) [52]. It was shown that IWDM can double the sensor
34
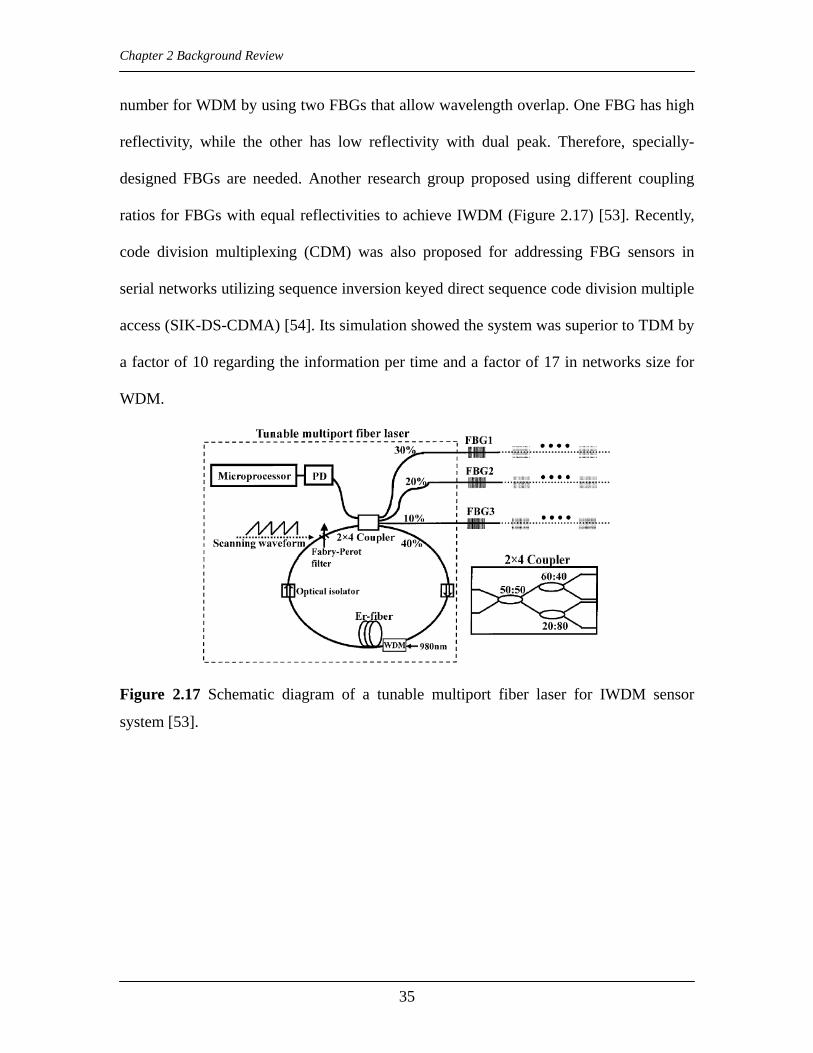
Chapter 2 Background Review
number for WDM by using two FBGs that allow wavelength overlap. One FBG has high
reflectivity, while the other has low reflectivity with dual peak. Therefore, specially-
designed FBGs are needed. Another research group proposed using different coupling
ratios for FBGs with equal reflectivities to achieve IWDM (Figure 2.17) [53]. Recently,
code division multiplexing (CDM) was also proposed for addressing FBG sensors in
serial networks utilizing sequence inversion keyed direct sequence code division multiple
access (SIK-DS-CDMA) [54]. Its simulation showed the system was superior to TDM by
a factor of 10 regarding the information per time and a factor of 17 in networks size for
WDM.
Figure 2.17 Schematic diagram of a tunable multiport fiber laser for IWDM sensor
system [53].
35

Chapter 2 Background Review
2.3.3 Interrogation Techniques for FBG Sensors
Several techniques [55] have been demonstrated for performing wavelength
shifting detection in FBG sensors. Edge or bandpass filters provide a wavelength-
intensity conversion. There is a tradeoff between the sensitivity and the measurement
range (Figure 2.18). Using this approach, resolution of about µε5± has been
demonstrated [56].
Edge filter FBG Signal
λ
Figure 2.18 Conversion of wavelength to intensity using edge filter method.
As shown in Figure 2.19, a tunable filter approach for detecting the Bragg
wavelength is one of the most successful techniques for interrogating FBG sensors. The
tunable filter can be Fabry-Perot (FP) filter, acousto-optic filter or FBG-based filter. The
basic principle of the tunable filter approach is that the passband wavelength transmit
through the filter depends on the voltage applied to the piezoelectric stacks that drive the
filter. As the filter is tuned, the passband scans over the return signals from the FBGs.
The wavelength can be determined and recorded from the voltage applied to the filter as
the return optical signal is detected. In strain measurement, resolution of the order
36

Chapter 2 Background Review
about µε1± has been demonstrated using FP approach [57].
Figure 2.19 Schematic diagram of tunable filter method.
The interferometric detection technique [58] is also a form of filtering with a
sinusoidal transfer function, with the phase term dependent on the input wavelength from
the FBG sensor (Figure 2.20). This technique is extremely sensitive to weak dynamic
Bragg wavelength shifts. Dynamic shift in the wavelength on the order of ~10-6 nm have
been experimentally demonstrated during week mechanical perturbation of grating.
Tunable Filter
FBG Signal
λ
Interferometric
λ
FBG
Figure 2.20 Principle of interferometric detection method.
37

Chapter 2 Background Review
A charge-coupled device (CCD) spectrometer [59] is a simple method for
interrogation the gratings; the reflected light from the gratings is dispersed onto a linear
CCD array using bulk grating and appropriate optics. This approach collects all the light
returned by each grating. The spectrometer reads the wavelength with a resolution
determined by the product of the grating’s linear dispersion at the detector plane with the
pixel width, and the received wavelength converted into position information along a line
imaged onto the array of the detector element. This instrument has demonstrated a strain
sensitivity of ~1µε and a bandwidth from static strain to 4 kHz.
Another form of direct spectroscopic tool suitable for analyzing the return FBG
signals is Fourier analysis. The light from an array of grating sensors is fed to an
interferometer in which one arm can be scanned to change the relative optical path
lengths. When the length of one arm is scanned, an interferogram between two
components is generated at the detector as the path difference passes through zero. A
discrete frequency component corresponding to the grating signal can be observed from
frequency spectrum obtained by Fourier transforming the interferogram. Any Bragg
wavelength shift of grating sensor can be detected by monitoring shifts in the Fourier
frequency component. Bragg wavelength shift with resolution of ~ 0.015 nm has been
demonstrated [60].
38

Chapter 2 Background Review
2.4 Summary
We presented a brief review on PCFs and FBGs which are the two main fiber
optical components investigated for sensing applications during this Ph.D. study. For the
first part, we focused on the fundamentals of PCFs, and some characteristics unique to
this class of novel fiber. The light guiding mechanism of PCFs makes it physically
different from the conventional fibers, exhibits flexibility on the fiber design/fabrication
and thus offers a variety of merits which are impossible in the past. Finally, we have a
brief review on the optical fiber sensors based on PCF. In the second part, the basic
principle of FBGs is given with the development history, the fabrication, the optical
properties, and their responses to some physical parameters including temperature and
strain which make them promising candidates in lots of sensing areas. The multiplexing
techniques and interrogation methods of FBG sensors are also introduced.
39

Chapter 2 Background Review
References [1] J. C. Knight, T. A. Birks, P. St. J. Russell, D. M. Atkin, “All-silica single-mode
optical fiber with photonic crystal cladding,’ Optics Letters, Vol. 21, pp. 1547-1549,
(1996).
[2] T. A. Birks, J. C. Knight, and P. St. J. Russell, “Endlessly single-mode photonic
crystal fiber,” Optics Letters, Vol. 22, pp. 961-963, (1997).
[3] R. F. Cregan, B. J. Mangan, J. C. Knight, T. A. Birks, P. St. J. Russell, P. J. Roberts,
and D. C. Allan, “Single-mode photonic band gap guidance of light in air,” Science,
Vol. 285, pp. 1537-1539, (1999).
[4] M. van Eijkelenborg, M. Large, A. Argyros, J. Zagari, et al, “Microstructured
polymer optical fibre,” Optics Express, Vol. 9, pp. 319-327, (2001).
[5] P. St. J. Russell, “Photonic crystal fibers,” Science, Vol. 299, pp.358-362, (2003).
[6] B. Temelkuran, S. D. Hart, G. Benoit, J. D. Joannopoulos, Y. Fink, “Wavelength-
scalable hollow optical fibres with large photonic bandgaps for CO2 laser
transmission,” Nature, Vol. 420, pp.650-653, (2002).
[7] T. A. Birks, P. J. Roberts, P. St. J. Russell, D. M. Atkin, and T. J. Shepherd, “Full
2-D photonic bandgaps in silica/air structures,” Electronics Letters, Vol. 31, pp.
1941-1943, (1995).
[8] P. St. J. Russell, “Photonic-Crystal Fibers,” Journal of Lightwave Technology, Vol.
24, pp.4729-4749, (2006).
[9] P. Bennett, T. Monro, and D. Richardson, “Toward practical holey fiber technology:
fabrication, splicing, modeling, and characterization,” Optics Letters, Vol. 24, pp.
1203-1205, (1999).
40

Chapter 2 Background Review
[10] K. Kurokawa, K. Tajima, K. Tsujikawa, K. Nakajima, T. Matsui, I. Sankawa, and T.
Haibara, “Penalty-free dispersion-managed soliton transmission over a 100-km low
loss PCF,” Journal of Lightwave Technology, Vol. 24, pp.32-37, (2006).
[11] P. J. Roberts, F. Couny, H. Sabert, B. J. Mangan, T. A. Birks, J. C. Knight and P. St.
J. Russell, “Loss in solid-core photonic crystal fibers due to interface roughness
scattering,” Optics Express, Vol. 13, pp. 7779-7793, (2005).
[12] P. J. Robert, F. Couny, H. Sabert, B. J. Mangan, D. P. Williams, L. Farr, M. W.
Mason and A. Tomlinson, “Ultimate low loss of hollow-core photonic crystal
fibres,” Optics Express, Vol. 13, pp. 236-244, (2005).
[13] T. P. White, R. C. McPhedran, C. M. de Sterke, L. C. Botten, and M. J. Steel,
“Confinement losses in microstructured optical fibers,” Optics Letters, Vol. 26, pp.
1660-1662, (2001).
[14] T. Sorensen, J. Broeng, A. Bjarklev, E. Knudsen, and S. E. Barkou Libori, “Macro-
bending loss properties of photonic crystal fibre,” Electronics Letters, Vol. 37, pp.
287-289, (2001).
[15] M. J. Steel, T. P. White, C. Martijn de Sterke, R. C. McPhedran, and L. C. Botten,
“Symmetry and degeneracy in microstructured optical fibers,” Optics Letters, Vol.
26, pp. 488-490, (2001).
[16] M. Koshiba and K. Saitoh, “Numerical verification of degeneracy in hexagonal
photonic crystal fibers,” IEEE Photonics Technology Letters, Vol.13, pp.1522-1524,
(2001).
41

Chapter 2 Background Review
[17] A. Ortigosa-Blanch, J. C. Knight, W. J. Wadsworth, J. Arriaga, B. J. Mangan, T. A.
Birks, and P. St. Russell, “Highly birefringent photonic crystal fibers,” Optics
Letters, Vol. 25, pp. 1325-1327, (2000).
[18] K. Suzuki, H. Kubota, S. Kawanishi, M. Tanaka, and M. Fujita, “Optical properties
of a low-loss polarization-maintaining photonic crystal fiber,” Optics Express, Vol.
9, pp. 676-680, (2001).
[19] H. Kubota, S. Kawanishi, S. Koyanagi, M. Tanaka and S. Yamaguchi, “Absolutely
Single Polarization Photonic Crystal Fiber,” IEEE Photonics Technology Letters,
Vol.16, pp.182-184, (2004).
[20] P. R. Chaudhuri, V. Paulose, C. L. Zhao, and C. Lu, “Near-elliptic core
polarization-maintaining photonic crystal fiber: Modeling birefringence
characteristics and realization,” IEEE Photonics Technology Letters, Vol.16,
pp.1301-1303, (2004).
[21] J. R. Folkenberg, M. D. Nielsen, N. A. Mortensen, C. Jakobsen, and H. R.
Simonsen, “Polarization maintaining large mode area photonic crystal fiber,” Optics
Express, Vol. 12, pp. 956-960, (2004).
[22] T. Ritari, H. Ludvigsen, M. Wegmuller, M. Legre, N. Gisin, J. R. Folkenberg, and
M. D. Nielsen, “Experimental study of polarization properties of highly birefringent
photonic crystal fibers,” Optics Express, Vol. 12, pp. 5931-5939, (2004).
[23] K. Saitoh and M. Koshiba, “Photonic Bandgap Fibers with High Birefringence,”
IEEE Photonics Technology Letters, Vol.14, pp.1291-1293, (2002).
42

Chapter 2 Background Review
[24] X. Chen, M. J. Li, N. Venkataraman, M. T. Gallagher, W. A. Wood, A. M. Crowley,
Joel P. Carberry, Luis A. Zenteno, and Karl W. Koch, “Highly birefringent hollow-
core photonic bandgap fiber,” Optics Express, Vol. 12, pp. 3888-3893, (2004).
[25] P. J. Roberts, D. P. Williams, H. Sabert, B. J. Mangan, D. M. Bird, T. A. Birks, J. C.
Knight and P. St. J. Russell, “Design of low-loss and highly birefringent hollow-
core photonic crystal fiber,” Optics Express, Vol. 12, pp. 7329-7341, (2006).
[26] M. J. Gander, R. McBride, J. D. C. jones, D. Mogilevtsev, T. A. Birks, J. C. Knight,
and P. St. J. Russell, “Experimental measurement of group velocity dispersion in
photonic crystal fibre,” Electronics Letters, Vol. 35, pp. 63-64, (1999).
[27] W. J. Wadsworth, J. C. Knight, A. Ortigosa-Blanch, J. Arriaga, E. Silvestre, and P.
St. J. Russell, “Soliton effects in photonic crystal fibres at 850 nm,” Electronics
Letters, Vol. 36, pp. 53-55, (2000).
[28] J. K. Randa, R. S. Windeler, and A. J. Stentz, “Visible continuum generation in air-
silica microstructure optical fibers with anomalous dispersion at 800 nm,” Optics
Letters, Vol. 25, pp. 25-27, (2000).
[29] M. T. Myaing, J. Y. Ye, T. B. Norris, T. Thomas, J. R. Baker, W. J. Wadsworth, G.
Bouwmans, J. C. Knight and P. St. J. Russell, “Enhanced two-photon biosensing
with double-clad photonic crystal fibers,” Optics Letters, Vol. 28, pp. 1224-1226,
(2003).
[30] J. B. Jensen, L. H. Pedersen, P. E. Hoiby, L. B. Nielsen, T. P. Hansen, J. R.
Folkenberg, J. Riishede, D. Noordegraaf, K. Nielsen, A. Carlsen and A. Bjarklev,
“Photonic crystal fiber based evanescent-wave sensor for detection of biomolecules
in aqueous solutions,” Optics Letters, Vol. 28, pp. 1224-1226, (2004).
43

Chapter 2 Background Review
[31] Y. L. Hoo, W. Jin, H. L. Ho, D. N. Wang, and R. S. Windeler, “Evanescent-wave
gas sensing using microstructure fiber,” Optical Engineering, Vol. 41, pp. 8-9,
(2002).
[32] J. M. Fini, “Microstructure fibres for optical sensing in gases and liquids,”
Measurement Science and Technology, Vol. 15, pp. 1120-1128, (2004).
[33] T. Ritari, J. Tuominen, H. Ludvigsen, J. C. Petersen, T. Sorensen, T. P. Hansen and
H. R. Simonsen, “Gas sensing using air-guiding photonic bandgap fibers,” Optics
Express, Vol. 12, pp. 4080-4087, (2004).
[34] T. M. Monro, D. J. Richardson and P. J. Bennett, “Developing holey fibres for
evanescent field devices,” Electronics Letters, Vol. 35, pp. 1188-1189, (1999).
[35] W. J. Bock, W. Urbanczyk and J. Wojcik, “Measurements of sensitivity of the
single-mode photonic crystal holey fibre to temperature, elongation and hydrostatic
pressure,” Measurement Science and Technology, Vol. 15, pp. 1496-1500, (2004).
[36] G. Statkiewicz, T. Martynkien, and W. Urbanczyk, “Measurements of modal
birefringence and polarimetric sensitivity of the birefringent holey fiber to
hydrostatic pressure and strain,” Optics Communications, Vol. 241, pp. 339-348,
(2004).
[37] T. Nasilowski, T. Martynkien, G. Statkiewicz, M. Szpulak, J. Olszewski, G.
Golojuch, W. Urbanczyk, J. Wojcik, P. Mergo, M. Makara, F. Berghmans, and H.
Thienpont, “Temperature and pressure sensitivities of the highly birefringent
photonic crystal fiber with core asymmetry,” Applied Physics B, Vol.81, pp. 325-
331, (2005).
44

Chapter 2 Background Review
[38] P. M. Blanchard, J. G. Burnett, G. R. G. Erry, A. H. Greenaway, P. Harrison, B. J.
mangan, J. C. Knight, P. St. J. Russell, M. J. Gander, R. McBride, and J. D. C.
Jones, “Two-dimensional bend sensing with a single, multi-core optical fibre,”
Smart Mater. Struct., Vol. 9, pp. 132-140, (2000).
[39] W. N. MacPherson, M. J. Gander, R. McBride, J. D. C. Jones, P. M. Blanchard, J.
G. Burnett, A. H. Greenaway, B. Mangan, T. A. Birks, J. C. Knight, P. St. J. Russell,
“Remontely addressed optical fibre curvature sensor using multicore photonic
crystal fiber,” Optics Communications, Vol. 241, pp. 339-348, (2004).
[40] A. D. Kersey, M. A. Davis, H. J. Partrick, M. Leblance, K. P. Koo, C.G. Askins, M.
A. Putnam, and E. J. Friebele, “Fiber grating sensors,” Journal of Lightwave
Technology, Vol.15, pp.1442–1463, (1997).
[41] K.O. Hill, Y. Fujii, D. C. Johnson and B. S. Kawasaki, “Photosensitivity in optical
fibre wavelength: application to reflection filter fabrication,” Applied Physics
Letters, Vol.32, pp.647-649, (1978).
[42] B. S. Kawasaki, K. O. Hill, D. C. Johnson, and Y. Fujii, “Narrow-band Bragg
reflectors in optical fibre,” Optics Letters, Vol.3, pp.66-68, (1978).
[43] A. Othonos and K. Kalli, “Fiber Bragg gratings: fundamentals and applications in
telecommunications and sensing,” Artech House Publishers, (1999).
[44] A. D. Kersey, T. A. Berkoff and W. W. Morey, “Multiplexed fiber Bragg grating
strain-sensor system fiber Fabry-Perot wavelength filter,” Optics Letters, Vol.18,
pp.1370-1372, (1993).
45

Chapter 2 Background Review
[45] T. A. Berkoff and A. D. Kersey, “Fiber Bragg grating array sensor system using
bandpass wavelength division multiplexer and interferometric detection,” IEEE
Photonics Technology Letters, Vol. 8, pp.1522-1524, (1996).
[46] R. S. Weis, A. D. Kersey and T. A. Berkoff, “A four-element fiber grating sensor
array with phase sensitive detection,” IEEE Photonics Technology Letters, Vol. 6,
pp.1469-1472, (1994).
[47] M. A. Davis, D. G. Bellemore, M.A. Putnam and A. D. Kersey, “Interrogation of 60
fiber Bragg grating sensors with microstrain resolution capacity,” Electronics
Letters, Vol.32, pp.177-178, (1996).
[48] K. P. Koo, A. B. Tveten and S. T. Vohra, “Dense wavelength division multiplexing
of fibre Bragg grating sensors using CDMA,” Electronics Letters, Vol. 35, pp.165-
167, (1999).
[49] P. K. C. Chan, W. Jin and M. S. Demonkan, “FMCW multiplexing of fiber Bragg
grating sensors,” Journal of Selected Topics in Quantum Electronics, Vol. 6,
pp.756-763, (2000).
[50] L. C. G. Valente, A. M. B. Braga, A. S. Ribeiro, R. D. Regazzi, W. Ecke, C.
Chojetzki, and R. Willsch, “Time and Wavelength Multiplexing of Fiber Bragg
Grating Sensors Using a Commercial OTDR,” 15th International Conference on
Optical Fiber Sensors (OFS’15), pp.151-154, (2002).
[51] B. A. Childers et al., “Use of 3000 Bragg grating strain sensors distributed on four
eight-meter optical fibers during static load tests of a composite structure,”
http://techreports.larc.nasa.gov/ltrs/PDF/2001/mtg/NASA-2001-8spie-bac.pdf.
46

Chapter 2 Background Review
[52] L. Zhang, Y. Liu, J. A. R. Wiliams, and I. Bennion, “Enhanced FBG strain sensing
multiplexing capacity using combination of intensity and wavelength dual-coding
technique,” IEEE Photonics Technology Letters, Vol.11, pp.1638–1641, (1999).
[53] P. C. Peng, J. H. Lin, H. Y. Tseng, and S. Chi, “Intensity and Wavelength-Division
Multiplexing FBG Sensor System Using a Tunable Multiport Fiber Ring Laser,”
IEEE Photonics Technology Letters, Vol.16, (2004).
[54] S. Abbenseth and S. I. Lochmann, “Distinct enlargement of network size or
measurement speed for serial FBG sensor networks utilizing SIK-DS-CDMA,”
Journal of Physics: Conference Series 15, pp.149-154, (2005).
[55] K. T. V. Grattan and B. T. Meggitt, “Optical Fiber Sensor Technology: Devices and
Technology,” Volume Two, Chapman & Hall, (1998).
[56] M. A. Davis and A. D. Kersey, “All-fibre Bragg grating strain-sensor demodulation
technique using a wavelength division coupler,” Electronics Letters, Vol. 30, pp.75-
77, (1994).
[57] A. Locco, H. G. Limberger, R.P. Salathe, L.A. Everall, K.E. Chisholm, J.A.R.
Williams and I. Bennion, “Bragg grating fast tunable filter for wavelength division
multiplexing,” Journal of Lightwave Technology, Vol.17, pp.1217-1221, (1999).
[58] A. D. Kersey, T. A. Berkoff and W. W. Morey, “High-resolution fibre-grating
based strain sensor with interferometric wavelength-shift detection,” Electronics
Letters, Vol. 28, pp.236-238, (1992).
[59] Y. Hu, S. Chen, L. Zhang, I. Bennion, “Multiplexing Bragg gratings using
combined wavelength and spatial division techniques with digital resolution
enhancement,” Electronics Letters, Vol.33, pp.1973-1975, (1997).
47

Chapter 2 Background Review
[60] M. A. Davis and A. D. Kersey, “Application of a Fiber Fourier Transform
Spectrometer to the Detection of Wavelength-Encoded Signals from Bragg Grating
Sensors,” Journal of Lightwave Technology, Vol.13, pp.1289-1295, (1995).
48

Chapter 3 Torsion Sensor Based on Polarization-Maintaining Photonic Crystal Fiber
Chapter 3
Torsion Sensor Based on Polarization-Maintaining
Photonic Crystal Fiber
3.1 Introduction
The unique characteristics of PCFs, such as large signal-sample interaction length,
manipulation of fiber characteristics with careful design of air-hole parameters, and
endlessly single-mode guidance have attracted lots of research interest in recent years
[1-5]. In particular, sensing applications using PCFs have also been widely explored.
However, most research efforts mainly exploit the PCF characteristics to realize
gas/liquid sensors with guided-wave/evanescent-wave interaction [1-5]. It has been
established that PCF based optical fiber sensors offer extraordinary sensitivity for
gas/liquid monitoring. Recently, polarization-maintaining PCFs (PM-PCFs) have been
studied for stain/pressure sensing [6, 7]. PM-PCFs offer additional advantages over
conventional PM fibers owing to the high birefringence and low thermal sensitivity of
PCFs [8, 9]. However, PCFs/PM-PCFs were not exploited for torsion monitoring. Torsion
is an important parameter for structural health monitoring and other kinds of engineering
applications. All-optical torsion sensors, based on fiber Bragg gratings (FBGs), long
period gratings (LPGs) and high birefringence fibers, have been reported [10-13]. For the
FBG-based torsion sensor reported in reference 10, torsion induces strain to an FBG
49

Chapter 3 Torsion Sensor Based on Polarization-Maintaining Photonic Crystal Fiber
glued onto the surface of an elastic shaft and the resulting wavelength shift is measured to
calculate the applied torsion with limited twist angle range determined by the shaft. In
reference 11, a torsion sensor based on a 16-mm long HF-etched corrugated LPG and a
twist sensitivity of 0.036 nm/rad m-1 was reported. Resonant wavelength dependence of
twist angle and direction in CO2 induced LPG with twist sensitivity of up to 0.032 nm/rad
m-1 was demonstrated [12]. A torsion sensor based on FBG written in high
birefringence fiber was proposed by Lo et al [13] with a low twist angle resolution of
about 0.3° that is limited by the measurement of the intensity ratio by the optical
spectrum analyzer (OSA) at the two peak wavelengths of the FBG. All the reported
torsion sensors [10-13] are based on conventional fibers that exhibit relatively large
temperature that affect the measurement results. Typical temperature coefficients of
FBGs written in standard fibers and PM fibers are 10 pm/°C and 14 pm/°C [14],
respectively and that in LPGs is generally much larger. On the contrary, PCFs are made
entirely of fused silica that has a low thermal expansion coefficient and consequently
fiber optic sensors based on PCFs are less temperature-dependent.
In this chapter, we propose and experimentally demonstrate a novel fiber optic
polarimetric torsion sensor based on PM-PCF. A simplified theoretical analysis is also
given to explain the operation principle of the proposed torsion sensor. The twist angle of
the PM-PCF-based torsion sensor was measured by polarimetric detection. High
normalized sensitivity was measured to be ~0.014/° within the linear twist angle range
from 30° to 70° and it is highly repeatable over 90-degree twist in both clockwise (CW)
50

Chapter 3 Torsion Sensor Based on Polarization-Maintaining Photonic Crystal Fiber
and counterclockwise (CCW) directions. Owing to low thermal coefficient of PM-PCF,
the proposed torsion sensor eliminates the requirement of temperature compensation
when deployed in harsh environment where temperature fluctuation is inevitable. High
birefringence of the PM-PCF ensures the torsion sensor to be compact, releasing the
limitation of the torsion gauge length.
3.2 Theoretical Analysis of PM-PCF based Optical Fiber
Torsion Sensor
Figure 3.1 illustrates the experimental setup of the proposed PM-PCF-based
torsion sensor. The light source used in this experiment was a tunable semiconductor
laser (Santec®, Model TSL-210) operating at 1550 nm. The polarization extinction ratio
of this light source was higher than 40 dB. A polarization controller (OFR®) was used to
adjust the polarization state of the light launched into the PM-PCF. The PM-PCF
(PM-1550-01, produced by Blaze-Photonics®) has a beat length of < 4 mm at 1550 nm
and polarization extinction ratio of >30 dB over 100 m. The scanning electron
micrograph (SEM) image of the transverse cross section of the PM-PCF is shown in the
inset of Figure 3.1. Mode field diameters for the two orthogonal polarizations were 3.6
and 3.1 µm respectively. The total loss of the two splicing points was ~4 dB and was
achieved by repeated arc discharges applied over the splicing points to collapse the air
holes of the small-core PM-PCF [15]. The length of the PM-PCF used in our experiment
was ~15 cm.
51

Chapter 3 Torsion Sensor Based on Polarization-Maintaining Photonic Crystal Fiber
Inset
Optical Powermeter
Highly Polarized Light Source
Polarization Controller
Polarizer
PM-PCF
Twist region
Figure 3.1 Schematic diagram of the proposed PM-PCF based fiber optic polarimetric torsion sensor.
The optical sensing system was set up on an optical table to ensure stability.
Initially, one end of the straight & horizontal section of the PM-PCF was fixed on a
mount and the other end on a twist stage without any pre-straining and pre-twisting. The
twist stage was capable of applying required twist with the twist angle measurement
provision. Owing to the limitation of setup, the smallest twist which could be applied in
the present study was 1o. Polarimetric detection of the output light signal was achieved
with a linear polarizer (OFR®) together with a power meter (Ilxlightwave®, FSM-8210).
Initially, the polarization state of the polarization controller was adjusted to obtain
maximum power at the output. Maximum output power can be achieved only when the
polarization state of the output light is parallel to the pass-axis of the linear polarizer.
52

Chapter 3 Torsion Sensor Based on Polarization-Maintaining Photonic Crystal Fiber
Hence we adjusted both the polarization controller and the linear polarizer to get the
maximum output power at the beginning. With the PM-PCF under twist, the optical
output power was observed varying as a function of the twist angle.
y Twist PM-PCF Input End
Twist PM-PCF Output End
α β
θ
Polarizer
x
Figure 3.2 Coordinate of the principal axis for the fiber optic torsion sensing system.
Figure 3.2 shows the coordinate of the principal axis for the fiber optic torsion
sensing system. θ is the angle made by the pass axis of the linear polarizer with x-axis, β
is the principal axis angle of PM-PCF input end and α is the twist angle of the PM-PCF.
Considering the polarization state of the light during propagation, the optical system can
be described as
53

Chapter 3 Torsion Sensor Based on Polarization-Maintaining Photonic Crystal Fiber
[ ][ ][ )( )( )( αβθ −−=⎥⎥⎦
⎤
⎢⎢⎣
⎡RotationRotationPolarizer
EE
outy
outx ]
, (3.1) [ ][ ] ⎥⎦
⎤⎢⎣
⎡×
0 )( ),(
inxE
RotationM βδα
where the is the amplitude of the highly-polarized input light, and are
the amplitudes of the two orthogonal polarized lights at the output end. The Jones
matrices of the linear polarizer is given as
inxE out
xE outyE
. (3.2) ⎥⎦
⎤⎢⎣
⎡=
)(sin)cos()sin()sin()cos()(cos
)]([ 2
2
θθθθθθ
θPolarizer
Jones matrix for the coordinate rotation with angle σ is given as
, (3.3) ⎥⎦
⎤⎢⎣
⎡−
=)cos()sin()sin()cos(
)]([σσσσ
σRotation
and the Jones matrix of the twisted PM-PCF is given as
, (3.4) ⎥⎦
⎤⎢⎣
⎡⋅⋅+⋅−
⋅⋅⋅−=
γγδγγγαγγαγγδγ
δα/)sin(cos/sin
/sin/)sin(cos)],([
ii
M
where γ = (α2 + δ2)1/2 and δ = π·lT ·(nx – ny)/λ, lT is the length of PM-PCF. The phase
retardation angle of the PM-PCF is 2δ. The output power of polarimetric detection thus
can be obtained as
. (3.5) [ ]∗
⎥⎥⎦
⎤
⎢⎢⎣
⎡⋅= out
y
outxout
youtx E
EEEI
The PM-PCF used in our experiment had a high birefringence with a beat length less than
4 mm. Further, the length of the PM-PCF used in our experiment was ~15 cm. Hence, α
<< 2δ. Under this condition, the twisted PM-PCF acts as an optical rotator and the system
becomes insensitive to the gauge length [13]. After adjusting the polarizer, we achieved a
54

Chapter 3 Torsion Sensor Based on Polarization-Maintaining Photonic Crystal Fiber
maximum output power at the beginning. This arrangement can be well described by
assuming β = 0° or 90° and θ = 0°. This leads to the intensity of optical output
approximately as
22cos in
xEI ⋅= α . (3.6)
3.3 Experimental Results of the Proposed Torsion Sensor
3.3.1 Performance of the PM-PCF based Torsion Sensor
-24
-20
-16
-12
-8
-90 -60 -30 0 30 60 90Twist Angle (degree)
Pow
er (d
Bm
)
CWCCW
Figure 3.3 Measured output power vs. twist angle of PM-PCF.
Figure 3.3 shows the measured output power as a function of twist angle of the
PM-PCF. As can be observed, output power is highly sensitive to the applied twist with a
variation of more than 12 dB when the twist angle was varied in the range of [-π/2 π/2].
In addition, the power variation was highly symmetric. The same figure shows the sensor
55

Chapter 3 Torsion Sensor Based on Polarization-Maintaining Photonic Crystal Fiber
response when the PM-PCF was twisted from -π/2 to π/2 (CW twist) and then from π/2
to -π/2 (CCW twist). These results show a complete reversible nature of the proposed
torsion sensor. As can be noticed, the twist sensitivity varies with the twist angle. For
small twist angle, the power level follows a slow decreasing smooth curve; while at larger
twist angles, the power level falls down sharply.
Intensity
0
0.2
0.4
0.6
0.8
1
-90 -60 -30 0 30 60 90Twist Angle (degree)
ExperimentTheory
Figure 3.4 Normalized intensities vs. twist angle with °= 90β and °= 0θ .
Further, the consistency between experimental as well as theoretical results was
investigated. Figure 3.4 illustrates theoretically simulated (as discussed in the previous
section) as well as experimental observed normalized output intensities against twist
angles. Sensor response matches qualitatively well with that of the theoretically simulated
one for entire range of applied twist. A high degree of quantitative agreement was
observed when the applied twist to PM-PCF was small (~20°). However, for the higher
56

Chapter 3 Torsion Sensor Based on Polarization-Maintaining Photonic Crystal Fiber
twist angles, experimentally observed intensities were little higher in comparison to the
theoretically predicted intensities. This is maybe because of the received optical power at
other polarization states, which is not perfectly filtered out by the linear polarizer. This
also explains why the power did not go to zero when the applied twist was close to ±90°.
From 30° to 70°, the power decreases with a good linearity and the calculated slope is ~
0.014/°. This linear region is important for designing a real sensing device for practical
applications. The linear region of the sensor covers over 40° of twist angle. If the
PM-PCF is pre-twisted to the mid-point of the linear region (i.e. 50° as shown in Figure
3.4), then a torsion sensor with a linear response of ±20° can be realized.
3.3.2 Temperature Characteristics
The effect of ambient temperature on the sensor response is a critical issue while
designing a sensor system for real-field applications. Hence, the effects of ambient
temperature fluctuations on the sensor performance were also investigated. For this, the
twisted PM-PCF sensing element was placed in a temperature-controlled container, and
the temperature within the container was varied from 20°C to 70°C. Figure 3.5 shows a
typical measured sensor response under temperature variations. As can be observed, the
power variation is only 0.2 dB against a temperature variation of 50°C. This shows that
the temperature sensitivity of the proposed sensor is negligibly small. Thus, if the
proposed sensor is applied to an environment where temperature variation is not very
large, the need for temperature compensation schemes can be completely eliminated.
57

Chapter 3 Torsion Sensor Based on Polarization-Maintaining Photonic Crystal Fiber
However, the measured temperature sensitivity of the proposed sensor exhibits a fairly
linear response of about -0.004 dB/°C over the temperature range of 20°C – 70°C.
Therefore, temperature-compensation of the proposed torsion sensor can be easily
implemented using another sensor such as FBG to measure the ambient temperature.
y = -0.0046x + 0.1109R2 = 0.9889
-0.3
-0.2
-0.1
0
0.1
20 30 40 50 60 70Temperature (oC)
Pow
er V
aria
tion
(dB
)
Figure 3.5 Power Stabilities of the torsion sensing system under temperature variation.
3.4 Summary
A novel fiber optic polarimetric torsion sensor employing a PM-PCF as a sensing
element is proposed and demonstrated experimentally. A simplified theoretical analysis of
the torsion sensor is carried out. Experimental results of the sensor matches well with the
theoretically simulated one. It is the first reported PM-PCF/PCF sensor exploited for
58

Chapter 3 Torsion Sensor Based on Polarization-Maintaining Photonic Crystal Fiber
torsion monitoring. The proposed torsion sensor exhibits high sensitivity of about 0.014/°
within the linear twist range from 30° to 70° and it is highly repeatable over 90-degree
twist in both CW and CCW directions. Compared to conventional fiber optical torsion
sensors, the proposed sensor exhibits reduced temperature sensitivity, eliminating the
temperature compensation requirements in applications where the temperature variation
is not very large. In addition, this sensor is simple to design, compact in size, easy to
manufacture, and highly sensitive to the applied twist. This makes it an excellent
candidate for torsion sensing for real field applications.
59

Chapter 3 Torsion Sensor Based on Polarization-Maintaining Photonic Crystal Fiber
Reference
[1] T. M. Monro, D. J. Richardson, and P. J. Bennett, “Developing holey fibres for
evanescent field devices,” Electronics Letters, Vol. 35, pp.1188-1189, (1999).
[2] Y. L. Hoo, W. Jin, C. Shi, H. L. Ho, D. N. Wang, and S. C. Ruan, “Design and
modeling of a photonic crystal fiber gas sensor,” Applied Optics, Vol. 42,
pp.3509-3515, (2003).
[3] J. M. Fini, “Microstructure fibres for optical sensing in gases and liquids,”
Measurement Science and Technology, Vol. 15, pp.1120-1128, (2004).
[4] J. B. Jensen, L. H. Pedersen, P. E. Hoiby, L. B. Nielsen, T. P. Hansen, J. R.
Folkenberg, J. Riishede, D. Noordegraaf, K. Nielsen, A. Carlsen, and A. Bjarklev,
“Photonic crystal fiber based evanescent-wave sensor for detection of biomolecules
in aqueous solutions,” Optics Letters, Vol. 29, pp.1974-1976, (2004).
[5] C. M. B. Cordeiro, E. M. dos Santos, C. H. Brito Cruz, C. J. de Matos, and D. S.
Ferreira, “Lateral access to the holes of photonic crystal fibers – selective filling
and sensing applications,” Optics Express, Vol. 14, pp.8403-8412, (2006).
[6] X. Y. Dong, H. Y. Tam and P. Shum, “Temperature-insensitive strain sensor with
polarization-maintaining photonic crystal fiber based Sagnac interferometer,”
Applied Physics Letters. Vol. 90, 151113 (2007).
[7] H. K. Gahir and D. Khanna, “Design and development of a
temperature-compensated fiber optic polarimetric pressure sensor based on
photonic crystal fiber at 1550 nm,” Applied Optics, Vol. 46, pp.1184-1189, (2007).
60

Chapter 3 Torsion Sensor Based on Polarization-Maintaining Photonic Crystal Fiber
[8] K. Suzuki, H. Kubota, S. Kawanishi, M. Tanaka, and M. Fujita, “Optical properties
of a low-loss polarization-maintaining photonic crystal fiber,” Optics Express, Vol.
9, pp.676-680, (2001).
[9] D. H. Kim and J. U. Kang, “Sagnac loop interferometer based on polarization
maintaining photonic crystal fiber with reduced temperature sensitivity,” Optics
Express, Vol. 12, pp.4490-4495, (2004).
[10] X. G. Tian and X. M. Tao, “Torsion Measurement Using Fiber Bragg Grating
Sensors,” Experimental Mechanics, Vol. 41, pp.248-253, (2001).
[11] L. A. Wang, C. Y. Lin, G. W. Chern, “A torsion sensor made of a corrugated long
period fibre grating,” Measurement Science and Technology, Vol. 12, pp.793-799,
(2001)
[12] Y. P. Wang, J. P. Chen and Y. J. Rao, “Torsion characteristics of Long-period fibre
gratings induced by high-frequency CO2 laser pulses,” Applied Optics, Vol. 22,
pp.1167-1172, (2005).
[13] Y. L. Lo, B. R. Chue and S. H. Xu, “Fiber torsion sensor demodulated by a
high-birefringence fiber Bragg grating,” Optics Communication, Vol. 230,
pp.287-295, (2004)
[14] D. Liu, N. Q. Ngo, S. C. Tjin, and X. Dong, “A Dual-Wavelength Fiber Laser
Sensor System for Measurement of Temperature and Strain,” IEEE Photonics
Technology Letters, Vol.19, 1148-1150 (2007).
61

Chapter 3 Torsion Sensor Based on Polarization-Maintaining Photonic Crystal Fiber
[15] L. M. Xiao, W. Jin, and M. S. Demokan, “Fusion splicing small-core photonic
crystal fibers and single-mode fibers by repeated arc discharges,” Optics Letters,
Vol. 32, pp.115-117, (2007).
62

Chapter 4 Pressure Sensor Realized with Polarization-Maintaining Photonic Crystal Fiber based Sagnac Interferometer
Chapter 4
Pressure Sensor Realized with Polarization-Maintaining
Photonic Crystal Fiber based Sagnac Interferometer
4.1 Introduction
The presence of air holes in the PCFs opens a new range of possible applications.
Direct pressure sensing is one of these applications that attract a lot of research interests.
In this chapter, we propose and demonstrate a pressure sensor based on a PM-PCF
Sagnac interferometer. A brief introduction on FBG pressure sensors reported in journal
and conference publications will be given, followed by a review on the application of
Sagnac interferometer in fiber optic sensing. For our proposed Sagnac interferometer
based pressure sensor using PM-PCF, the Sagnac loop itself acts as a sensitive pressure
sensing element, making it an ideal candidate for pressure sensor for harsh environment
applications. The proposed pressure sensor does not require polarimetric detection and
the measured information is wavelength-encoded. Theoretical analysis for the pressure
induced spectral shift is also presented together with the operation principle. An
interesting feature of the proposed pressure is the ultra-low bending loss of the PM-PCF,
permitting very compact fiber optic pressure sensor to be realized. Furthermore, we
studied the coiling diameter and the coiling direction and found that no significant affects
63

Chapter 4 Pressure Sensor Realized with Polarization-Maintaining Photonic Crystal Fiber based Sagnac Interferometer
on the sensing performance. In addition, the pressure sensor exhibits low temperature
sensitivity.
4.2 Fiber Bragg Gratings Pressure Sensors
FBG sensors have been utilized for both temperature and strain sensing with great
success, however, they are less attractive for the pressure sensing applications. The
reason behind this is that the fiber diameter changes resulting from the applied pressure is
very small and thus low sensitivity for the measurement. Xu et al. have reported the first
pressure sensor using a bare FBG, and the measured wavelength-pressure coefficient is
3.04×10⁻³ nm/MPa over a pressure range of 70 MPa [1]. Several schemes have been
proposed to increase the low intrinsic sensitivity of bare FBG pressure sensor by
mechanical amplification using various transducer designs. These include a glass-bubble
housing of FBG [2], a polymer-coated FBG [3], shielded polymer coating of FBG [4,5],
FBG embedded to a piston-like diaphragm with thin metal cylinder [6], and transducer
setup [7]. As shown in Figure 4.1 (a), an FBG is embedded in a polymer-filled metal
cylinder and experiences pressure by the strain from the polymer under applied pressure
[4]. The wavelength-pressure coefficient achieved of –5.28 nm/MPa is three orders
higher than that of a bare FBG pressure sensor. A diaphragm structured FBG pressure
sensor with both ends of FBG under strain has been proposed to further increase the
sensitivity [6], and the wavelength-pressure coefficient is 7 nm/MPa (Figure 4.1(b)).
Figure 4.1 (c) shows a transducer setup for FBG pressure sensing [7], the pressure
applied to the gas container can be measured through the lever which introduced strain to
the FBG. The sensitivities of all these FBG pressure sensors were significantly enhanced,
64

Chapter 4 Pressure Sensor Realized with Polarization-Maintaining Photonic Crystal Fiber based Sagnac Interferometer
however, they are complicated in terms of fabrication, implementation, and are not
suitable for application in harsh environments. The erosion of metal and the bulk size of
these configurations affect their implementations for the sensing applications such as in
down-hole oil well.
(a) (b)
(c)
Figure 4.1 Configurations of FBG based pressure sensors. (a) FBG embedded in a
polymer-filled metal cylinder (b) FBG pressure sensor based on piston-like diaphragm (c)
FBG pressure sensor using a lever with pressured gas container.
65

Chapter 4 Pressure Sensor Realized with Polarization-Maintaining Photonic Crystal Fiber based Sagnac Interferometer
4.3 Background Review of Polarization-Maintaining Fiber
Sagnac Interferometer
4.3.1 Fiber Sagnac Interferometer
The fiber Sagnac loop mirror is a very attractive device for both optical fiber
communication and optical fiber sensing [8]. Figure 4.2 shown a simple implementation
of a Sagnac loop mirror constructed by splicing the output ports (port 3 and port 4) of a
directional 3-dB optical coupler together. Light launched into port 1 is splitted equally
into two counter propagating waves by the coupler, with half of it transmits through port
3 and the remaining half couples to port 4. The two waves travel with identical optical
paths in opposite directions and a constructive interference is formed at port 1 when they
return back to the coupler. Light coupled within the coupler experiences a π/2 phase lag
with respect to light traveling straight through. Therefore, all the light outputs to port 1
and the reflectivity limited only by the losses of the splice, fiber and coupler, while no
light is output at port 2. However, if a section of highly birefringent (Hi-Bi) fiber is
inserted into the loop, different optical paths will be introduced to the two counter
propagating waves by the Hi-Bi fiber. The phase difference (∆φ) between the two waves
is given by [8]:
λπφ BL2 =∆ (4.1)
where Β, L and λ are, the birefringence, the length of the Hi-Bi fiber and the wavelength
of the light, respectively. Therefore, for a given Β and L, the transmission (T) at port 2
and reflection (R = 1 – T) at port 1 of the Hi-Bi fiber loop mirror depends on the
wavelength of operation and both are approximately periodic functions of wavelength.
66

Chapter 4 Pressure Sensor Realized with Polarization-Maintaining Photonic Crystal Fiber based Sagnac Interferometer
The Sagnac interferometer has several advantages over traditional interferometers, such
as the input polarization independence and the periodicity of the formed spectral filter
which depends only on the length of the Hi-Bi fiber but not the length of the fiber loop.
Figure 4.2 A fiber Sagnac loop mirror [8].
4.3.2 Sensing Applications of Sagnac Interferometer
Optical fiber Sagnac interferometers have been used in optical communications as
well as fiber optic sensing [9-14]. In the field of optical communications, they can be
employed as wavelength division multiplexing filters, gain-flattening filters for erbium-
doped fiber amplifiers, comb filters for multiwavelength fiber lasers, and in dispersion
compensation [9-12]. They have also been developed for gyroscopes and other sensor
applications due to their unique advantages such as simple design, easy to manufacture,
and less susceptible to environmental pickup noise in comparison to other types of fiber-
optic sensors [13,14]. Polarization-maintaining fiber (PMF) is usually used in Sagnac
interferometers to introduce an optical path difference and cause interference between the
two counter-propagating waves in the fiber loop [15-19]. However, conventional
67

Chapter 4 Pressure Sensor Realized with Polarization-Maintaining Photonic Crystal Fiber based Sagnac Interferometer
polarization-maintaining fibers (e.g. Panda and Bow-tie PMFs) have a high thermal
sensitivity due to the large thermal expansion coefficient difference between boron-doped
stress-applying parts and the cladding (normally pure silica). Consequently, conventional
PMFs exhibit temperature-sensitive birefringence. Typical temperature coefficients of
Panda and Bow-tie fibers are -1.9 nm/°C and -1.2 nm/°C, respectively [20]. Therefore
conventional PMF based Sagnac interferometer sensors exhibit very high temperature
sensitivity, which is about one and two orders of magnitude of higher than that of long-
period fiber grating (LPG) and fiber Bragg grating (FBG) sensors [15,16]. When they are
used for sensing other measurands rather than temperature such as pressure, the
temperature change and fluctuation will cause serious cross-sensitivity effects and would
affect the measurement accuracy significantly.
In recent years, polarization-maintaining photonic crystal fiber (PM-PCF) has
become commercially available and subsequently attracted lots of research interest in
investigating its potential in communications and sensing applications [21-23]. PM-PCF
possesses very low bending loss due to the large numerical aperture and small core
diameter. This feature is crucial for the realization of practical sensors. It is also
significantly less temperature dependent than conventional PMFs due to its pure silica
construction without any doped materials in the core or cladding, except with air holes
running along the entire length of the fibers. Previous reports showed that the thermal
sensitivity of PM-PCF based Sagnac interferometers is 55-164 times smaller than that of
conventional PMF based ones [24, 25]. Temperature induced cross-sensitivity effects can
thus be neglected for sensing applications in which the temperature variation is not too
large. Furthermore, owing to the flexible fabrication design of PM-PCF, its birefringence
68

Chapter 4 Pressure Sensor Realized with Polarization-Maintaining Photonic Crystal Fiber based Sagnac Interferometer
can be much higher than that of conventional PMFs [26]. This helps to reduce the length
of the sensing fiber.
PM-PCF based Sagnac interferometer employed as strain sensor which
demonstrated high sensitivity of 0.23 pm/µε and measurement range up to 32 mε, has
been reported [22]. PM-PCF based pressure sensor with polarimetric detection has also
been proposed and demonstrated [23]. Polarimetric sensor is complicated and generally
not preferred in most applications. We propose and demonstrate a pressure sensor based
on PM-PCF Sagnac interferometer. The Sagnac loop itself acts as a sensitive pressure
sensing element, making it an ideal candidate for pressure sensor.
4.4 Pressure Sensor based on PM-PCF Sagnac
Interferometer
4.4.1 Principle of Pressure Sensor with PM-PCF Sagnac Interferometer
Figure 4.3 shows the experimental setup of our proposed pressure sensor with
PM-PCF based Sagnac interferometer. It includes a conventional 3-dB single-mode fiber
coupler and a 58.4-cm PM-PCF. The PM-PCF (PM-1550-01, by Blaze-Photonics®) has a
beat length of < 4 mm at 1550 nm and a polarization extinction ratio of >30 dB over 100
m. The scanning electron micrograph (SEM) image of the transverse cross section of the
PM-PCF is shown in the inset of Figure 4.3. Mode field diameters for the two orthogonal
polarization modes are 3.6 and 3.1 µm respectively. The combined loss of the two
splicing points is ~4 dB. Low splicing loss could be achieved by repeated arc discharges
applied over the splicing points to collapse the air holes of the small-core PM-PCF [27].
The collapsing enlarges the mode field at the interface of the PM-PCF so as to match the
69

Chapter 4 Pressure Sensor Realized with Polarization-Maintaining Photonic Crystal Fiber based Sagnac Interferometer
mode field of the single-mode fiber (SMF). The Sagnac interferometer is laid in an open
metal box and the box is placed inside a sealed air tank. The tank is connected to an air
compressor with adjustable air pressure which was measured with a pressure meter. The
input and output ends of the Sagnac interferometer are placed outside the air tank. When
a broadband light source (amplified spontaneous emission from a pumped erbium-doped
fiber) is connected to the input, an interference output as shown in Figure 4.4 can be
observed. By measuring the wavelength shift of one of the transmission minimums with
an optical spectrum analyzer (OSA), the applied pressure to the PM-PCF can be
determined.
Broadband Light Source
Air Compressor
Pressure Meter
Sealed Air Tank
3dB Coupler
PM-PCF ××
Inset
OSA
Figure 4.3 Schematic diagram of the proposed pressure sensor constructed with PM-PCF
based Sagnac interferometer.
In the fiber loop, the two counter-propagating lights split by the 3-dB single-mode
fiber coupler interfere again at the coupler and the resulting spectrum is determined by
70

Chapter 4 Pressure Sensor Realized with Polarization-Maintaining Photonic Crystal Fiber based Sagnac Interferometer
the relative phase difference introduced to the two orthogonal guided modes mainly by
the PM-PCF. Ignoring the loss of the Sagnac loop, the transmission spectrum of the fiber
loop is approximately a periodic function of the wavelength, and is given by [24]
[ ] 2/)cos(1 δ−=T . (4.2) The total phase difference δ introduced by the PM-PCF can be expressed as
Pδδδ += 0 , (4.3) where 0δ and Pδ are the phase differences due to the intrinsic and pressure-induced
birefringence over the length, L, of PM-PCF and are given by [23]
λ
πδ LB ⋅⋅=
20 and (4.4)
λ
πδ
LPK PP
⋅∆⋅=
)(2. (4.5)
B = ns - nf is the birefringence of the PM-PCF, ns and nf are effective refractive indices of
the PM-PCF at the slow and fast axis, respectively. P∆ is the applied pressure and the
birefringence-pressure coefficient of PM-PCF can be described as [23]
Pn
Pn
K fsP ∂
∂−
∂∂
= . (4.6)
The spacing, S, between two adjacent transmission minimums can be approximated by
[24]
. (4.7) )/(2 LBS ⋅= λThe pressure-induce wavelength shift of the transmission minimum is ∆λ = S·δP/2π. Thus
the relationship between wavelength shift and applied pressure can be obtained by
PB
K P ∆⋅⋅
=∆ )( λλ . (4.8)
Equation (4.8) shows that for a small wavelength shift, the spectral shift is linearly
proportional to the applied pressure.
71

Chapter 4 Pressure Sensor Realized with Polarization-Maintaining Photonic Crystal Fiber based Sagnac Interferometer
4.4.2 Performance of the Pressure Sensor
-35
-30
-25
-20
-15
-10
-5
0
1544 1548 1552 1556 1560Wavelength (nm)
Tran
smis
sion
(dB
)
5.3 nm
Figure 4.4 Transmission spectrum of the PM-PCF based Sagnac interferometer
measured by OSA.
Figure 4.4 shows the transmission spectrum of the PM-PCF based Sagnac
interferometer by OSA at atmospheric pressure, i.e. at zero applied pressure. The spacing
between two adjacent transmission minimums is ~5.3 nm and an extinction ratio better
than 20 dB was achieved. The intrinsic birefringence of the PM-PCF used in our
experiment is 7.8×10⁻⁴ at 1550 nm.
72
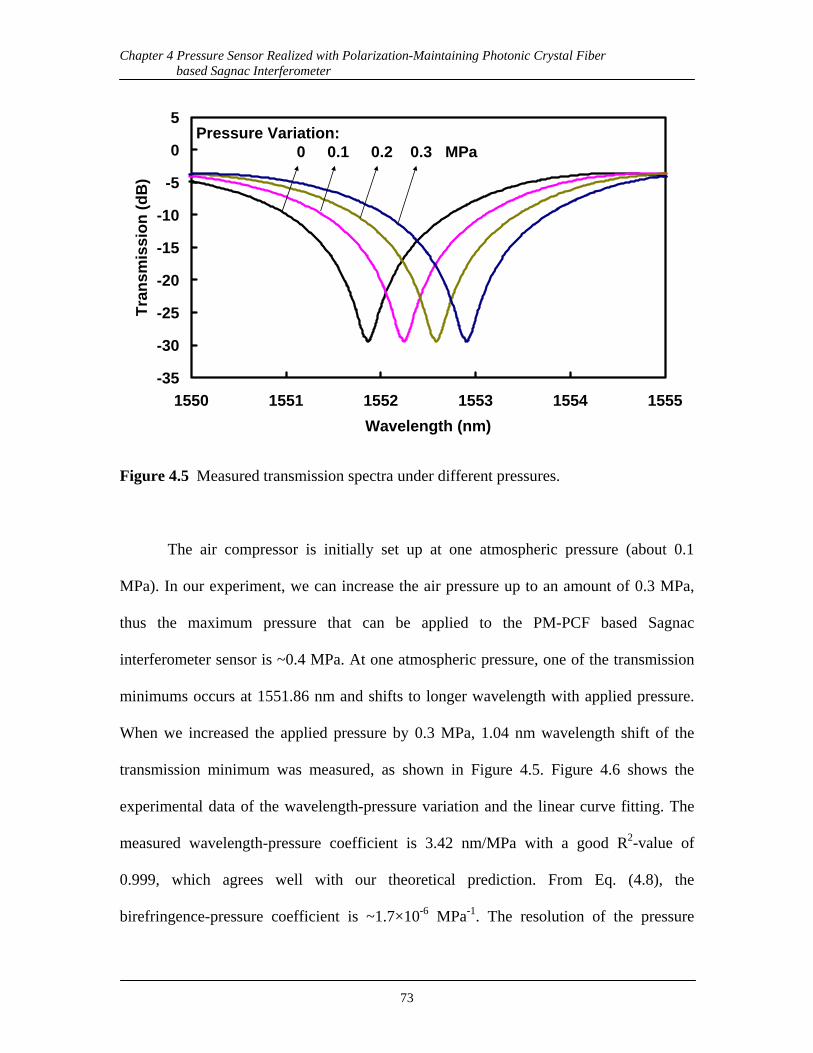
Chapter 4 Pressure Sensor Realized with Polarization-Maintaining Photonic Crystal Fiber based Sagnac Interferometer
-35
-30
-25
-20
-15
-10
-5
0
5
1550 1551 1552 1553 1554 1555Wavelength (nm)
Tran
smis
sion
(dB
)Pressure Variation: 0 0.1 0.2 0.3 MPa
Figure 4.5 Measured transmission spectra under different pressures.
The air compressor is initially set up at one atmospheric pressure (about 0.1
MPa). In our experiment, we can increase the air pressure up to an amount of 0.3 MPa,
thus the maximum pressure that can be applied to the PM-PCF based Sagnac
interferometer sensor is ~0.4 MPa. At one atmospheric pressure, one of the transmission
minimums occurs at 1551.86 nm and shifts to longer wavelength with applied pressure.
When we increased the applied pressure by 0.3 MPa, 1.04 nm wavelength shift of the
transmission minimum was measured, as shown in Figure 4.5. Figure 4.6 shows the
experimental data of the wavelength-pressure variation and the linear curve fitting. The
measured wavelength-pressure coefficient is 3.42 nm/MPa with a good R2-value of
0.999, which agrees well with our theoretical prediction. From Eq. (4.8), the
birefringence-pressure coefficient is ~1.7×10⁻⁶ MPa-1. The resolution of the pressure
73

Chapter 4 Pressure Sensor Realized with Polarization-Maintaining Photonic Crystal Fiber based Sagnac Interferometer
measurement is ~2.9 kPa when using an OSA with a 10-pm wavelength resolution. Due
to the limitation of our equipment, we have not studied the performance of this pressure
sensor for high pressure at this stage. However, we found that the PM-PCF can withstand
high pressure up to 10 MPa without damaging its structure by immersing the PM-PCF in
a bomb chamber filled with hydrogen at 10 MPa.
y = 3.4237x + 1551.9R2 = 0.999
1551.6
1552
1552.4
1552.8
1553.2
0 0.05 0.1 0.15 0.2 0.25 0.3 0.35Pressure (MPa)
Wav
elen
gth
(nm
)
Figure 4.6 Wavelength shift of the transmission minimum at 1551.86 nm against applied
pressure with variation up to 0.3 MPa based on one atmospheric pressure.
74

Chapter 4 Pressure Sensor Realized with Polarization-Maintaining Photonic Crystal Fiber based Sagnac Interferometer
4.4.3 Compact Size and Temperature Insensitive
Although the length of PM-PCF used in our experiment is 58.4 cm, it is important
to note that the PM-PCF can be coiled into a very small diameter circle with virtually no
additional bending loss. A Compact pressure sensor based on the proposed design can
thus be realized. The induced bending loss by coiling the PM-PCF fiber into 10 turns of
5-mm diameter circle, shown in the inset of Figure 4.6, is measured to be less than 0.01
dB with power meter (FSM-8210, by ILX Lightwave Corporation). The exceptional low
bending loss will simplify sensor design and packaging, fulfills the strict requirements of
some applications where small size is needed, such as in down-hole oil well applications.
To investigate the effects of coiling, we have studied two extreme cases in which the PM-
PCF was wound with its fast-axis and then its slow-axis on the same plane of the coil.
There were no measurable changes for either the birefringence or the wavelength-
pressure coefficient when the fiber was coiled into a 15-mm diameter and 6-mm diameter
circles with coiling in both orientations. The coiling of the PM-PCF into small diameter
circles makes the entire sensor very compact and could reduce any unwanted
environmental distortions such as vibrations.
The wavelength-pressure coefficient is independent of the length of the PM-PCF,
as described in Eq. (4.8). Figure 4.5 shows the wavelength-pressure coefficients are 3.46
nm/MPa and 3.43 nm/MPa for PM-PCF with length of 40 cm and 79.6 cm respectively.
After comparing the two wavelength-pressure coefficients with that of the pressure
sensor with a 58.4-cm PM-PCF (Fig. 4.7), we observe that the wavelength-pressure
coefficient is constant around 1550 nm, this agrees well with our theoretical prediction.
However, the length of the PM-PCF cannot be reduced too much, because this would
75

Chapter 4 Pressure Sensor Realized with Polarization-Maintaining Photonic Crystal Fiber based Sagnac Interferometer
result in broad attenuation peaks in the transmission spectrum and that will reduce the
reading accuracy of the transmission minimums.
y = 3.4637x + 1549.8
R2 = 0.9978
y = 3.4337x + 1549.6
R2 = 0.999
1549.2
1549.6
1550
1550.4
1550.8
1551.2
0 0.05 0.1 0.15 0.2 0.25 0.3 0.35
Pressure (MPa)
Wavelength (nm)
Figure 4.7 Wavelength shift of the transmission minimum against applied pressure for
PM-PCFs with length of 40 cm (circle) and 79.6 cm (triangle), the wavelength-pressure
coefficients are 3.46 nm/MPa and 3.43 nm/MPa respectively.
Temperature sensitivity of the proposed pressure sensor is also investigated by
placing the sensor inside an oven and varying its temperature. Figure 4.8 shows the
wavelength shift of a transmission minimum versus temperature linearly with a good R2-
value of 0.9984. The measured temperature coefficient is -2.2 pm/°C, which is much
smaller than the 10 pm/°C of fiber Bragg grating. The temperature may be neglected for
applications which operate over a normal temperature variation range.
76

Chapter 4 Pressure Sensor Realized with Polarization-Maintaining Photonic Crystal Fiber based Sagnac Interferometer
y = -2.2357x + 46.333R2 = 0.9984
-250
-200
-150
-100
-50
0
50
20 40 60 80 100 120 140
Temperature (oC)
Wav
elen
gth
Shift
(pm
)
Figure 4.8 Wavelength shift of the transmission minimum at 1551.86 nm against
temperature.
4.5 Summary
A novel fiber Sagnac interferometer pressure sensor realized by using a PM-PCF as the
sensing element has been proposed and demonstrated. Experimental results and
simplified theoretical analysis of the pressure sensor have been presented. Pressure
measurement results show a sensing sensitivity of 3.42 nm/MPa which is achieved by
using a 58.4-cm PM-PCF based Sagnac interferometer. Important features of the pressure
sensor are the low thermal coefficient and the exceptional low bending loss of the PM-
PCF which permits the fiber to be coiled into a 5-mm diameter circle. This allows the
realization of a very compact pressure sensor.
77

Chapter 4 Pressure Sensor Realized with Polarization-Maintaining Photonic Crystal Fiber based Sagnac Interferometer
Considering the whole pressure sensing system, we can also replace the light
source with laser and use photodiode for intensity detection at the sensing signal receive
end. Since the power fluctuation is very small even when the PM-PCF is bended,
intensity detection is practical for real applications. Due to the compact size of laser and
photodiode, the entire system can be made into a very portable system. Furthermore, the
use of intensity detection instead of wavelength measurement would greatly enhance
interrogation speed and consequently makes the system much more attractive.
Based on the high wavelength-pressure coefficient, the compact size, the reduced
temperature sensitivity characteristic, and other intrinsic advantages of fiber-optic
sensors, such as light weight and electromagnetically passive operation, the proposed
pressure sensor is a promising candidate for pressure sensing even in harsh environments.
The demonstrated measurement range is 0.3 MPa which is limited by the test apparatus
available in our lab. The performance of our proposed pressure at the high pressure needs
to be investigated in further study. High temperature performance is also a very important
characteristic for harsh environmental applications which will be presented in next
chapter.
78

Chapter 4 Pressure Sensor Realized with Polarization-Maintaining Photonic Crystal Fiber based Sagnac Interferometer
References
[1] M. G. Xu, L. Reekie, Y. T. Chow, and J. P. Dakin, “Optical in-fiber grating high
pressure sensor,” Electronics Letters, Vol.29, pp.398-399, (1993).
[2] M. G. Xu, H. Geiger, and J. P. Dakin, “Fibre grating pressure sensor with enhanced
sensitivity using a glass-bubble housing,” Electronics Letters, Vol.32, pp.128-129,
(1996).
[3] Y. Q. Liu, Z. Y. Guo, Y. Zhang, K. S. Chiang, and X. Y. Dong, “Simultaneous
pressure and temperature measurement with polymer-coated fibre Bragg grating,”
Electronics Letters, Vol.36, pp.564-565, (2000).
[4] Y. Zhang, D. J. Feng, Z. G. Liu, Z. Y. Guo, X. Y. Dong, K. S. Chiang, and B. C. B.
Chu, “High-Sensitivity Pressure Sensor Using a Shielded Polymer-Coated Fiber
Bragg Grating,” IEEE Photonics Technology Letters, Vol. 13, pp.618-620, (2001).
[5] H. J. Sheng, M. Y. Fu, T. C. Chen, W. F. Liu, and S. S. Bor, “A Lateral Pressure
Sensor Using a Fiber Bragg Grating,” IEEE Photonics Technology Letters, Vol. 16,
pp.1146-1148, (2004).
[6] W. T. Zhang, F. Li, Y. L. Liu, and L. H. Liu, “Ultrathin FBG Pressure Sensor With
Enhanced Responsivity,” IEEE Photonics Technology Letters, Vol. 19, pp.1553-
1555, (2007).
[7] Y. S. Hsu, Likarn Wang, Wen-Fung Liu, and Y. J. Chiang, “Temperature
Compensation of Optical Fiber Bragg Grating Pressure Sensor,” IEEE Photonics
Technology Letters, Vol. 18, pp.874-876, (2006).
[8] D. B. Mortimore, “Fiber Loop Reflectors,” Journal of Lightwave Technology, Vol.
6, pp.1217-1224, (1988).
79

Chapter 4 Pressure Sensor Realized with Polarization-Maintaining Photonic Crystal Fiber based Sagnac Interferometer
[9] S. Kim, and J. U. Kang, “Polarization-Independent “Figure-Eight” Birefringent
Sagnac Variable Comb-Filter/Attenuator,” IEEE Photonics Technology Letters, Vol.
16, pp.494-496, (2004).
[10] S. P. Li, K. S. Chiang, and W. A. Gambling, “Gain Flattening of an Erbium-Doped
Fiber Amplifier Using a High-Birefringence Fiber Loop Mirror,” IEEE Photonics
Technology Letters, Vol. 13, pp.942-944, (2001).
[11] X. P. Dong, S. P. Li, K. S. Chiang, M. N. Ng, and B. C. B. Chu, “Multiwavelength
erbium-doped fibre laser based on a high-birefringence fibre loop mirror,”
Electronics Letters, Vol. 36, pp. 1609-1610, (2000).
[12] S. Chung, B. A. Yu, and B. H. Lee, “Phase Response Design of a Polarization-
Maintaining Fiber Loop Mirror for Dispersion Compensation,” IEEE Photonics
Technology Letters, Vol. 13, pp.942-944, (2001).
[13] V. Vali and R. W. Shorthill, “Fiber ring interferometer,” Applied Optics, Vol. 15,
pp.1099-1103, (1976).
[14] S. Knudsen and K. Blotekjaer, “An ultrasonic fiber-optic hydrophone incorporating
a push-pull transducer in a Sagnac interferometer,” Journal of Lightwave
Technology, Vol. 12, pp.1696-1700, (1994).
[15] A. N. Starodumov, L. A. Zenteno, D. Monzon, and E. De La Rose, “Fiber Sagnac
interferometer temperature sensor,” Applied Physics Letters, Vol. 70, pp.19-21,
(1997).
[16] E. De La Rose, L. A. Zenteno, A. N. Starodumov and D. Monzon, “All-fiber
absolute temperature sensor using an unbalanced high-birefringence Sagnac loop,”
Optics Letters, Vol. 22, pp.481-483, (1997).
80

Chapter 4 Pressure Sensor Realized with Polarization-Maintaining Photonic Crystal Fiber based Sagnac Interferometer
[17] Y. J. Song, L. Zhan, S. Hu, Q. H. Ye, and Y. X. Xia, “Tunable multiwavelength
Brillouin-Erbium fiber laser with a polarization-maintaining fiber Sagnac loop
filter,” IEEE Photonics Technology Letters, Vol. 16, pp.2015-2017, (2004).
[18] M. Campbell, G. Zheng, A. S. Holmes-Smith, and P. A. Wallace, “A frequency-
modulated continuous wave birefringent fibre-optic strain sensor based on a Sagnac
ring configuration,” Measurement Science and Technology, Vol. 10, pp.218-224,
(1999).
[19] Y. Liu, B. Liu, X. Feng, W. Zhang, G. Zhou, S. Yuan, G. Kai, and X. Dong, “High-
birefringence fiber loop mirrors and their applications as sensors,” Applied Optics,
Vol. 44, pp.2382-2390, (2005).
[20] O. Frazao, J. M. Baptista, and J. L. Santos, “Recent Advances in High-
Birefringence Fiber Loop Mirror Sensors,” Sensors, Vol.7, pp.2970-2983, (2007).
[21] G. Kakarantzas, A. Ortigosa-Blanch, T. A. Birks, P. St. Russell, L. Farr, F. Couny,
and B. J. Mangan, “Structural rocking filters in highly birefringent photonic crystal
fiber,” Optics Letters, Vol. 28, pp.158-160, (2003).
[22] X. Y. Dong, H. Y. Tam and P. Shum, “Temperature-insensitive strain sensor with
polarization-maintaining photonic crystal fiber based Sagnac interferometer,”
Applied Physics Letters, Vol. 90, 151113, (2007).
[23] H. K. Gahir, and D. Khanna, “Design and development of a temperature-
compensated fiber optic polarimetric pressure sensor based on photonic crystal fiber
at 1550 nm,” Applied Optics, Vol. 46, pp.1184-1189, (2007).
[24] C. L. Zhao, X, Yang, C. Lu, W. Jin, and M. S. Demokan, “Temperature-insensitive
interferometer using a highly birefringent photonic crystal fiber loop mirror,” IEEE
81

Chapter 4 Pressure Sensor Realized with Polarization-Maintaining Photonic Crystal Fiber based Sagnac Interferometer
Photonics Technology Letters, Vol. 16, pp.2535-2537, (2004).
[25] D. H. Kim, and J. U. Kang, “Sagnac loop interferometer based on polarization
maintaining photonic crystal fiber with reduced temperature sensitivity,” Optics
Express, Vol. 12, pp.4490-4495, (2004).
[26] T. P. Hansen, J. Broeng, S. E. B. Libori, E. Knudosen, A. Bjarklev, J. R. Jensen,
and H. Simonsen, “Highly birefringent index-guiding photonic crystal fibers,” IEEE
Photonics Technology Letters, Vol. 13, pp.588-590, (2001).
[27] L. M. Xiao, W. Jin, and M. S. Demokan, “Fusion splicing small-core photonic
crystal fibers and single-mode fibers by repeated arc discharges,” Optics Letters,
Vol. 32, pp.115-117, (2007).
82

Chapter 5 High Temperature Sensor with Polarization-Maintaining Photonic Crystal Fiber based Sagnac Interferometer
Chapter 5
High Temperature Sensor Using a Polarization-
Maintaining Photonic Crystal Fiber based Sagnac
Interferometer
5.1 Introduction
Optical fiber sensors have many advantages over conventional sensors, particularly for
temperature measurement/monitoring in hazardous environments. Fiber optic distributed
temperature monitoring systems based on Raman optical time-domain reflectometry
(OTDR) have been commercially available from Sumitomo® since early 90’s. These
sensing systems are ideal for monitoring temperature distribution over many kilometers
and are widely used in the detection of hot-spots in transmission lines and in oil-filled
transformers. However, Raman OTDR systems are expensive and therefore too costly to
implement in applications where fewer sensors could be used or distributed monitoring is
not needed. The major cost of an FBG system is the interrogator which is mainly
determined by the speed of interrogation. Generally, temperature measurement does not
require high-speed interrogation and therefore cost-effective FBG temperature sensors
are widely deployed in hazardous environment where conventional sensors could not be
used. FBG is intrinsically sensitive to temperature and thus has been intensively
investigated as temperature sensor [1]. Some other temperature sensors based on fiber
83

Chapter 5 High Temperature Sensor with Polarization-Maintaining Photonic Crystal Fiber based Sagnac Interferometer
devices are also proposed [1-3]. Although FBG based temperature sensor works with
high performance in the low temperate range, its stability in the high temperature has
long been a challenge to researchers. Various techniques have been studied to increase
the thermal stability of gratings through accelerated ageing [4], formation of type II [5, 6],
type IIA [7], pre-irradiation [8] and chemical composition gratings [9]. The high
temperature sensing is extremely important for many applications including furnace
monitoring, combustion research, down-hole oil exploration, etc.
In this chapter, we have investigated the high temperature characteristics of
different fiber sensors which are based on fiber Bragg gratings, long period gratings, and
photonic crystal fiber. The femtosecond laser written FBG can support high temperature
sensing up to 1000°C with good linearity and stability. The high temperature properties
of two types of long period gratings have also been investigated. One is fabricated by
CO2 laser based on conventional single-mode fiber and the other is fabricated with taped
photonic crystal fiber.
The temperature characteristics of our proposed pressure sensor based on PM-
PCF Sagnac interferometer is studied in this chapter. And the proposed sensor is found to
be a promising candidate for high temperature sensing.
5.2 High Temperature Characteristics of Fiber Bragg
Gratings and Long Period Gratings
5.2.1 Properties of Fiber Gratings at High Temperature
Silica-based fiber Bragg grating (FBG) induced with UV lasers has been proved
to be highly versatile, simple, intrinsic sensing elements for more than a decade. However,
84

Chapter 5 High Temperature Sensor with Polarization-Maintaining Photonic Crystal Fiber based Sagnac Interferometer
the decay of UV-induced refractive index changes accelerated with increased temperature,
and thus affects the sensing performance significantly for applications at high
temperature. One of the alternative methods to improve the thermal stability and to
achieve large refractive index changes has then been proposed by using high power,
femtosecond pulse duration, IR laser radiations [2, 10, 11]. Furthermore, a point-by-point
writing technique using infrared femtosecond laser has been achieved, which used neither
phase-masks nor photosensitized fibers [2]. The femtosecond laser fabricated FBG shows
its promising potential for high temperature application [11].
5.2.2 High Temperature Sensor with Femtosecond Laser Fabricated
FBG
The Aston Photonics Research Group kindly gave us several femtosecond laser
written FBGs [2] for high temperature evaluation. The experimental setup shown in
Figure 5.1 was used for investigation of the high temperature performance of
femtosecond laser fabricated FBG. It comprised a broadband light source (SLED) at the
input and an optical spectrum analyzer (OSA) for measurement of spectrum of the FBG
via an optical circulator. Initially, the broadband light source illuminates the FBG after
the light enters port 1 of the circulator and out from port 2. The light reflected from the
FBG at the Bragg wavelength returns back to port 2 and output to port 3 for measurement.
The FBG is placed in the middle of a quartz tube and the tube is put into a furnace system.
The temperature of the FBG can then be adjusted and measured by the furnace system.
The thermocouple is used for measuring the temperature which feeds back to the furnace
system for both temperature control and temperature display.
85

Chapter 5 High Temperature Sensor with Polarization-Maintaining Photonic Crystal Fiber based Sagnac Interferometer
1 2
3
Circulator
Furnace System
Quartz Tube
FBG
Thermocouple
OSA
Broadband
Light Source
Figure 5.1 Experimental setup of Femtosecond written FBG high temperature
measurement
Figure 5.2 shows the Bragg wavelength shift of FBG when the temperature is
increased from 50°C to 1000°C. The Bragg wavelength shifts by around 16 nm to longer
wavelength when the temperature was increased by about 1000°C, and the thermal
coefficient is ~ 16pm/°C. Temperature cycling of the FBG is taken from 400°C to
1000°C. As shown in Figure 5.3, it is the reflection spectra of the FBG between 400°C
and 1000°C with a step of 100°C. The temperature coefficient is measured to be ~
16pm/°C for this temperature range and it shows high linearity with R2 value close to 1
(Figure 5.4). Two cycles of temperature measurement were carried out and compared.
The wavelength difference between the heat up and cool down processes is mainly due to
the inconsistence of the temperature change speed of these two processes. And this can
be confirmed after the comparison of the two sets of data for both heat up and cool down
processes (Figure 5.5 and Figure 5.6). Both showed both high repeatability and good
linearity.
86

Chapter 5 High Temperature Sensor with Polarization-Maintaining Photonic Crystal Fiber based Sagnac Interferometer
1558
1560
1562
1564
1566
1568
1570
1572
1574
1576
0 200 400 600 800 1000 1200
Temperature (°C)
Wav
elen
gth
(nm
)
Figure 5.2 Wavelength shift of Femtosecond laser fabricated FBG from 50°C to 1000°C.
-80
-70
-60
-50
-40
-30
-20
1555 1560 1565 1570 1575 1580 1585
Wavelength (nm)
Pow
er (d
Bm
)
400°C500°C600°C700°C800°C900°C1000°C
Figure 5.3 Reflection Spectra of FBG at temperature from 400°C to 1000°C.
87

Chapter 5 High Temperature Sensor with Polarization-Maintaining Photonic Crystal Fiber based Sagnac Interferometer
y = 0.0169x + 1558.4R2 = 0.9997
y = 0.0165x + 1558.3R2 = 0.9982
1564
1566
1568
1570
1572
1574
1576
400 500 600 700 800 900 1000
Temperature (°C)
Wav
elen
gth
(nm
)
Heat Up
Cool Down
Figure 5.4 Bragg wavelength shift of FBG during temperature cycling test at temperature
from 400°C to 1000°C.
y = 0.0169x + 1558.4R2 = 0.9997
y = 0.0168x + 1558.6R2 = 0.9991
1564
1566
1568
1570
1572
1574
1576
400 500 600 700 800 900 1000Temperature (°C)
Wav
elen
gth
(nm
)
Heat Up 1Heat Up 2
Figure 5.5 Bragg wavelength shift of FBG during temperature cycling test when the
temperature is increased from 400°C to 1000°C.
88

Chapter 5 High Temperature Sensor with Polarization-Maintaining Photonic Crystal Fiber based Sagnac Interferometer
y = 0.0166x + 1558.2R2 = 0.997
y = 0.0165x + 1558.3R2 = 0.9982
1564
1566
1568
1570
1572
1574
1576
400 500 600 700 800 900 1000
Temperature (°C)
Wav
elen
gth
(nm
)
Cool Down 1
Cool Down 2
Figure 5.6 Bragg wavelength shift of FBG during temperature cycling test when the
temperature is decreased from 1000°C to 400°C.
5.2.3 CO2 Laser Fabricated Long Period Gratings for High
Temperature Sensing
UV-induced long period gratings (LPGs) in standard fiber have large temperature
coefficients in general. However, some alternative fabrication methods can lower the
temperature sensitivity and improve the thermal stability.
Figure 5.7 shows the experimental setup of high temperature measurement of the
LPG. It includes a broadband light source (SLED) at the input and using optical spectrum
analyzer (OSA) to measure at the output transmission spectrum. The broadband light
source illuminates the LPG which is laid in the middle of a quartz tube and the tube is put
into a furnace system. The temperature of the LPG can then be adjusted by the furnace
89
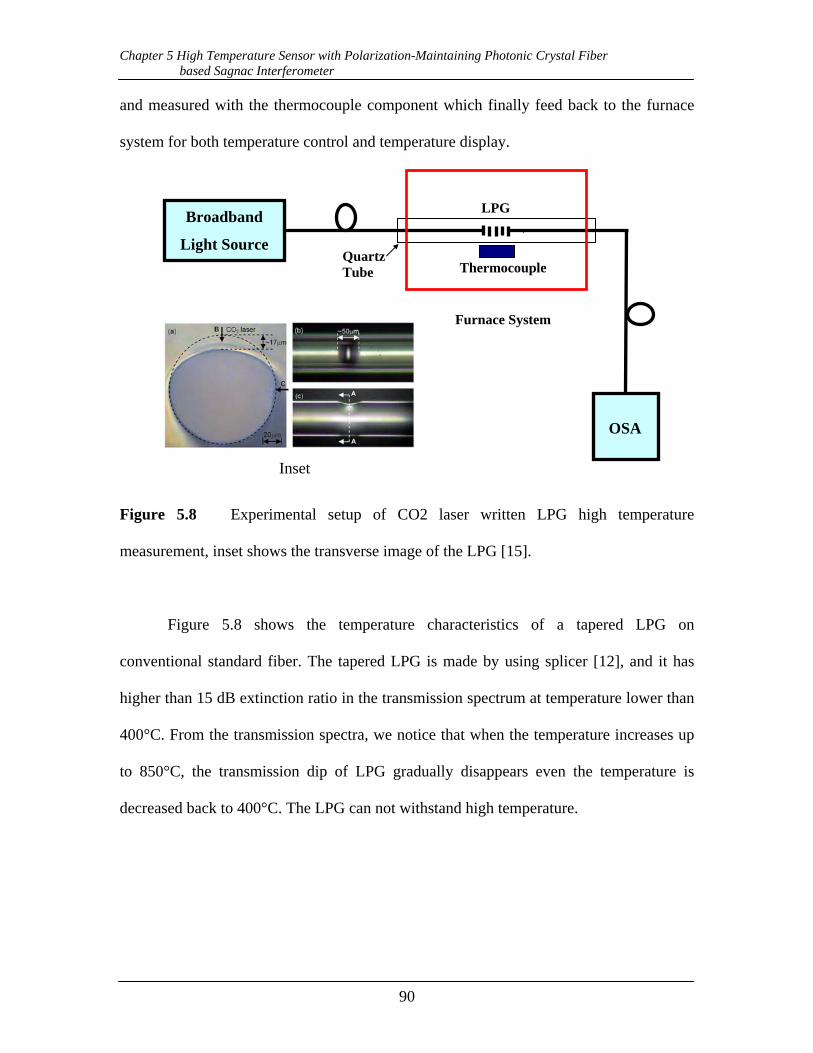
Chapter 5 High Temperature Sensor with Polarization-Maintaining Photonic Crystal Fiber based Sagnac Interferometer
and measured with the thermocouple component which finally feed back to the furnace
system for both temperature control and temperature display.
Broadband
Light Source
LPG
Thermocouple
Furnace System
Quartz Tube
Inset
OSA
Figure 5.8 Experimental setup of CO2 laser written LPG high temperature
measurement, inset shows the transverse image of the LPG [15].
Figure 5.8 shows the temperature characteristics of a tapered LPG on
conventional standard fiber. The tapered LPG is made by using splicer [12], and it has
higher than 15 dB extinction ratio in the transmission spectrum at temperature lower than
400°C. From the transmission spectra, we notice that when the temperature increases up
to 850°C, the transmission dip of LPG gradually disappears even the temperature is
decreased back to 400°C. The LPG can not withstand high temperature.
90

Chapter 5 High Temperature Sensor with Polarization-Maintaining Photonic Crystal Fiber based Sagnac Interferometer
-20
-15
-10
-5
0
5
1600 1610 1620 1630 1640 1650 1660 1670 1680 1690 1700Wavelength (nm)
Pow
er (d
Bm
)
400°C
550°C
850°C400°C
550°C
850°C
Figure 5.8 The temperature characteristics of the tapered LPG based on conventional
single mode fiber from 400°C to 850°C with a step of 50°C (Blue: 400°C, Green:
550°C, Red: 850°C, Black: others temperatures).
Contrary to the LPG by tapering conventional SMF, the CO2 laser fabricated LPG
has better performance at high temperature [3, 13-15]. When temperature increases, the
resonant wavelength of the CO2 laser written LPG at ~1570 nm shifts toward longer
wavelength (as shown in Figure 5.9). The spectra broaden at higher temperature and the
distinction ratio decreases. Compare the resonant wavelength at 400°C during the heat up
and cool down process, we notice that there is a quite significant changes which towards
the shorter wavelength. We then anneal the LPG at 650°C for 16 hours (As shown in
Figure 5.10). The resonant wavelength shifts to shorter wavelength, and the wavelength
shift becomes less when the time increases. This agrees well with the previous report by
Davis [3].
91
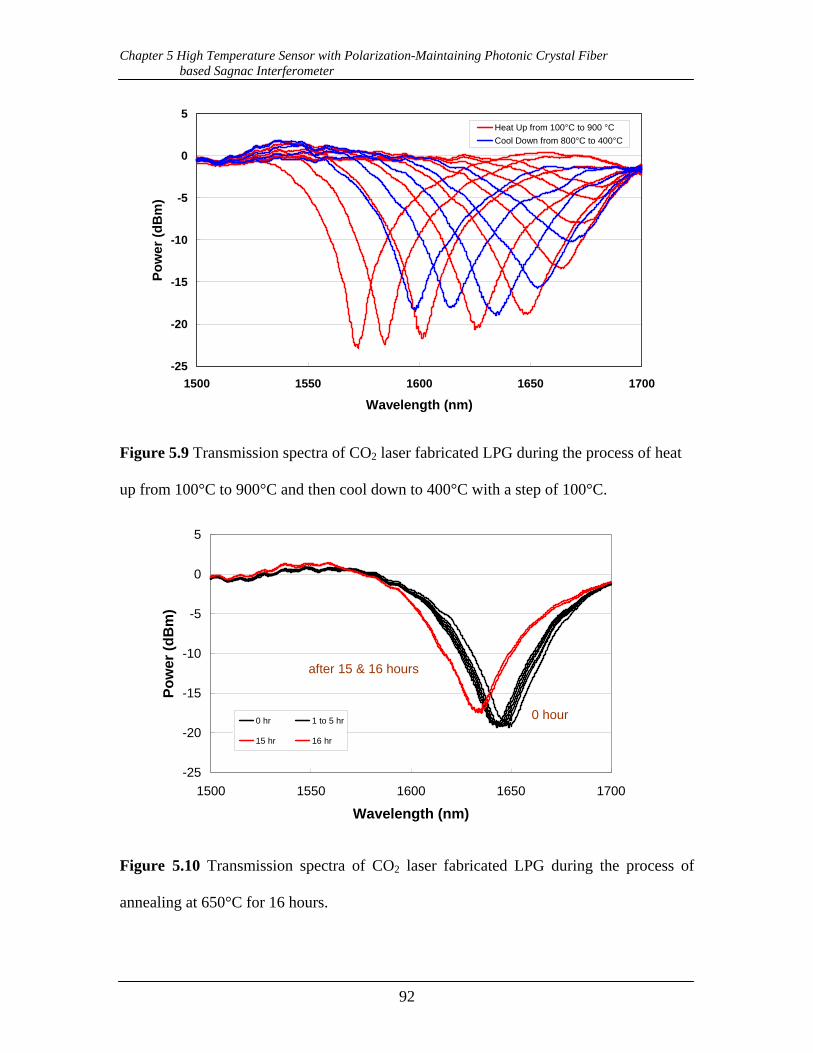
Chapter 5 High Temperature Sensor with Polarization-Maintaining Photonic Crystal Fiber based Sagnac Interferometer
-25
-20
-15
-10
-5
0
5
1500 1550 1600 1650 1700
Wavelength (nm)
Pow
er (d
Bm
)
Heat Up from 100°C to 900 °CCool Down from 800°C to 400°C
Figure 5.9 Transmission spectra of CO2 laser fabricated LPG during the process of heat
up from 100°C to 900°C and then cool down to 400°C with a step of 100°C.
-25
-20
-15
-10
-5
0
5
1500 1550 1600 1650 1700
Wavelength (nm)
Pow
er (d
Bm
)
0 hr 1 to 5 hr
15 hr 16 hr
after 15 & 16 hours
0 hour
Figure 5.10 Transmission spectra of CO2 laser fabricated LPG during the process of
annealing at 650°C for 16 hours.
92

Chapter 5 High Temperature Sensor with Polarization-Maintaining Photonic Crystal Fiber based Sagnac Interferometer
5.2.4 Characteristics of Tapered Long Period Gratings on PCF at High
Temperature
We have also fabricated LPGs on photonic crystal fiber (Crystal Fiber A/S®,
LMA10) by tapering with splicer [12]. Figure 5.11 shows the spectrum of the LPG made
by tapering the PCF with splicer. The high temperature investigation of this PCF based
tapered LPG shows that it is more stable for keeping the extinction ratio. However, due to
the higher-order modes interference when temperature increases, there are ripples
generated in the spectrum. The ripples affect the measurement for the wavelength shift of
the resonant wavelength of LPG.
Figure 5.11 Transmission spectrum of the PCF based tapered LPG.
93

Chapter 5 High Temperature Sensor with Polarization-Maintaining Photonic Crystal Fiber based Sagnac Interferometer
-40
-35
-30
-25
-20
-15
-10
-5
1390 1400 1410 1420 1430 1440 1450 1460 1470 1480 1490Wavelength (nm)
Pow
er (d
Bm
)
400°C
450°C
500°C
550°C
600°C
650°C
700°C
750°C
800°C
850°C
Figure 5.12 Transmission spectra of PCF based tapered LPG during the process of
temperature increase from 400°C to 850°C with a step of 50°C.
5.3 High Temperature Sensor based on PM-PCF Sagnac
Interferometer
5.3.1 Temperature Characteristics of PM-PCF
Recently, polarization-maintaining photonic crystal fiber (PM-PCF) has become
commercially available and subsequently attracted lots of research interest in
investigating its potential in communications and sensing applications [16-22]. PM-PCF
possesses very low temperature dependence in comparison with conventional PMFs and
fiber gratings due to its pure silica construction without any doped materials in the core
or cladding, except with air holes running along the entire length of the fibers. Previous
reports showed that the thermal sensitivity of PM-PCF based Sagnac interferometers is
94

Chapter 5 High Temperature Sensor with Polarization-Maintaining Photonic Crystal Fiber based Sagnac Interferometer
55-164 times smaller than that of conventional PMF based ones [17, 22]. This feature is
crucial for the realization of practical sensors where the temperature fluctuation is
inevitable in most of the applications. A further investigation of this PM-PCF based
Sagnac interferometer for high temperature application is carried out in this part.
5.3.2 Performance of PM-PCF Sagnac Interferometer as a High
Temperature Sensor
3dB Coupler
Furnace System
PM-PCF
Thermocouple Quartz Tube
OSA
Broadband
Light Source
Figure 5.13 Experimental setup of high temperature measurement for PM-PCF based
Sagnac interferometer
Figure 5.13 shows the experimental setup of our proposed pressure sensor with
PM-PCF based Sagnac interferometer. It includes a conventional 3-dB single-mode fiber
coupler and a 28.5-cm PM-PCF (PM-1550-01, by Blaze-Photonics®). The PM-PCF is
coiled and laid in a quartz tube and the tube is placed inside a furnace system. The
temperature of the furnace can be adjusted, and can be measured by using a thermocouple.
When a broadband light source (superluminescent light emitting diode, SLED) is
connected to the input, an interference output can be observed (as shown in Figure 5.14).
95

Chapter 5 High Temperature Sensor with Polarization-Maintaining Photonic Crystal Fiber based Sagnac Interferometer
By measuring the wavelength shift of one of the transmission minimums with an optical
spectrum analyzer (OSA), the applied temperature to the PM-PCF can be determined.
Figure 5.14 Transmission spectrum of the PM-PCF based Sagnac interferometer at room
temperature.
1545
1550
1555
1560
1565
1570
1575
0 100 200 300 400 500 600 700 800
Temperature (°C )
Wav
elen
gth
(nm
)
Figure 5.15 Wavelength shift of a transmission minimum of the PM-PCF based Sagnac
interferometer when temperature increases from room temperature to 800°C.
96

Chapter 5 High Temperature Sensor with Polarization-Maintaining Photonic Crystal Fiber based Sagnac Interferometer
Figure 5.15 shows the wavelength shift of the transmission minimum of the PM-
PCF based Sagnac interferometer. Initially, the Sagnac interferometer is at room
temperature. We then increase the temperature of the furnace to 800°C steadily. When
the temperature is low (less then 200°C), the transmission minimum will shift to shorter
wavelength with a temperature coefficient ~ -2 pm/°C. However, the wavelength shifts
with irregular trend when the temperature further increases until it reaches ~550°C. We
believe this phenomenon is due to the burning of the PM-PCF coating. The wavelength
shifts to longer wavelength with a good linearity until the temperature is up to ~ 800°C.
A few temperature cycles are carried out between 400°C and 800°C. Figure 5.16 shows
one of the cycles that we increase the temperature from 400°C to 800°C and then cool
down to 400°C again. The temperature coefficient is ~ 11pm/°C with a good linearity of
R2-value close to 1. And the difference between heat up and cool down processes is also
affected by the furnace which we mentioned in the previous high temperature
measurement for femtosecond laser fabricated FBG.
When the temperature is further increased, the wavelength shifts to shorter
wavelength (as shown in Figure 5.17). It is postulated that the irregular wavelength shift
is due to the thermodynamic structural rearrangement of the glass [23] or chemical
changes. Another possible explanation is the relaxation of residual axial stress which is
frozen into the fiber during the draw process [24].
97

Chapter 5 High Temperature Sensor with Polarization-Maintaining Photonic Crystal Fiber based Sagnac Interferometer
y = 0.0112x + 1560.6R2 = 0.9983
y = 0.0105x + 1560.7R2 = 0.9952
1564
1565
1566
1567
1568
1569
1570
400 450 500 550 600 650 700 750 800Temperature (°C)
Wav
elen
gth
(nm
)
Heat UpCool Down
Figure 5.16 Wavelength shift of a transmission minimum of the PM-PCF based Sagnac
interferometer during temperature cycling test at temperature between 400°C and 800°C.
1545
1550
1555
1560
1565
1570
1575
400 500 600 700 800 900 1000 1100 1200Temperature (°C)
Wav
elen
gth
(nm
)
Figure 5.17 Wavelength shift of a transmission minimum of the PM-PCF based Sagnac
interferometer when the temperature increases from 400°C to 1160°C.
98

Chapter 5 High Temperature Sensor with Polarization-Maintaining Photonic Crystal Fiber based Sagnac Interferometer
5.4 Summary
In this chapter, we investigate the high temperature characteristics of several types
of fiber gratings and the PM-PCF based Sagnac interferometer. The femtosecond laser
fabricated FBG performances well for high temperature sensing. The thermal coefficient
of the FBG is ~ 16pm/°C with good linearity in the temperature range from 400°C to
1000°C. Two types of LPGs have been studied for the high temperature sensing, and they
shows better performance than the tapered LPG based on conventional SMF. One is the
CO2 laser fabricated LPG, and the other is tapered LPG based on PCF. The high
temperature properties of the CO2 laser fabricated LPG has been investigated. The
extinction ratio for the resonant coupling is varied and annealing process is needed for
achieving high temperature sensing. The tapered LPG based on PCF can be used for high
temperature sensing, however, the higher-order modes interference generates easily at
high temperature. Compare to other conventional fibers, the PCF shows its advantages
for applications at high temperature due to it novel structure with pure silica and air holes.
The PM-PCF based Sagnac interferometer is a promising candidate for the high
temperature sensing applications. We study the performance of PM-PCF based Sagnac
interferometer for temperature sensing at the range from 400°C to 800°C. The
temperature coefficient is ~ 11pm/°C with a good linearity within the temperature range.
99

Chapter 5 High Temperature Sensor with Polarization-Maintaining Photonic Crystal Fiber based Sagnac Interferometer
References
[1] A. D. Kersey, M. A. Davis, H. J. Partrick, M. Leblance, K. P. Koo, C. G. Askins, M.
A. Putnam, and E. J. Friebele, “Fiber grating sensors,” Journal of Lightwave
Technology, Vol. 15, pp.1442-1463, (1997).
[2] A. Martinez, I. Y. Khrushchev, and I. Bennion, “Thermal properties of fibre Bragg
gratings inscribed point-by-point by infrared femtosecond laser,” Electronics
Letters, Vol. 41, pp. 176-177, (2005).
[3] D. D. Davis, T. K. Gaylord, E. N. Glytsis, and S. C. Metter, “Very-high-
temperature stable CO2-laser-induced long-period fibre gratings,” Electronics
Letters, Vol. 35, pp. 740-742, (1999).
[4] T. Erdogan, V. Mizrahi, P. J. Lemaire, and D. Monroe, “Decay of ultraviolet-
induced fiber Bragg gratings,” Journal of Applied Physics, Vol.76, pp. 73-80,
(1994).
[5] C. G. Askins, T.-E. Tsai, G. M. Williams, M. A. Putnam, M. Bashkansky, and E. J.
Friebele, “Fiber Bragg reflectors prepared by a single excimer pulse,” Optics
Letters, Vol. 17, pp.833-835, (1992).
[6] J. L. Archambault, L. Reekie and P. St. J. Russell, “100% reflectivity Bragg
reflectors produced in optical fibres by single excimer laser pulses,” Electronics
Letters, Vol. 29, pp. 453-455, (1993).
[7] L. Dong and W. F. Liu, “Thermal decay of fiber Bragg gratings of positive and
negative index changes formed at 193 nm in a boron-codoped germanosilicate
fiber,” Applied Optics, Vol. 36, pp.8222-8226, (1997).
[8] M. Aslund and J. Canning, “Annealing properties of gratings written into UV-
100

Chapter 5 High Temperature Sensor with Polarization-Maintaining Photonic Crystal Fiber based Sagnac Interferometer
presensitized hydrogen-outdiffused optical fiber,” Optics Letters, Vol. 25, pp.692-
694, (2000).
[9] M. Fokine, “Formation of thermally stable chemical composition gratings in optical
fibers,” Journal of the Optical Society of America B, Vol. 19, pp.1759-1765, (2002).
[10] A. Martinez, M. Dubov, I. Khrushchev, and I. Bennion, “Direct writing of fibre
Bragg gratings by femtosecond laser,” Electronics Letters, Vol. 40, pp. 1170-1171,
(2004).
[11] D. Grobnic, C. W. Smelser, S. J. Mihailov, and R. B. Walker, “Long-term thermal
stability tests at 1000°C of silica fibre Bragg gratings made with ultrafast laser
radiation,” Measurement Science and Technology, Vol. 17, pp. 1009-1013, (2006).
[12] L. Y. Shao, J. Zhao, X. Y. Dong, H. Y. Tam, C. Lu, and Sailing He, “Long-period
grating fabricated by periodically tapering standard single-mode fiber,” Applied
Optics, Vol. 47, pp.1549-1552, (2008).
[13] D. D. Davis, T. K. Gaylord, E. N. Glytsis, S. G. Kosinski, S. C. Mettler, and A. M.
Vengsarkar, “Long-period fibre grating fabrication with focused CO2 laser pulses,”
Electronics Letters, Vol. 34, pp. 302-303, (1998).
[14] Y. J. Rao, Y. P. Wang, Z. L. Ran, and T. Zhu, “Novel Fiber-Optic Sensors Based
on Long-Period Fiber Gratings Written by High-Frequency CO2 Laser Pulses,”
Journal of Lightwave Technology, Vol. 21, pp.1320-1327, (2003).
[15] Y. P. Wang, D. N. Wang, W. Jin, H. L. Ho, J. Ju, “Mode field profile and
polarization dependence of long period fiber gratings written by CO2 laser,” Optics
Communications, Vol.281, pp.2522-2525, (2008).
[16] G. Kakarantzas, A. Ortigosa-Blanch, T. A. Birks, P. St. Russell, L. Farr, F. Couny,
101

Chapter 5 High Temperature Sensor with Polarization-Maintaining Photonic Crystal Fiber based Sagnac Interferometer
and B. J. Mangan, “Structural rocking filters in highly birefringent photonic crystal
fiber,” Optics Letters, Vol. 28, pp.158-160, (2003).
[17] C. L. Zhao, X, Yang, C. Lu, W. Jin, and M. S. Demokan, “Temperature-insensitive
interferometer using a highly birefringent photonic crystal fiber loop mirror,” IEEE
Photonics Technology Letters, Vol. 16, pp.2535-2537, (2004).
[18] X. Y. Dong, H. Y. Tam and P. Shum, “Temperature-insensitive strain sensor with
polarization-maintaining photonic crystal fiber based Sagnac interferometer,”
Applied Physics Letters, Vol. 90, 151113, (2007).
[19] H. K. Gahir, and D. Khanna, “Design and development of a temperature-
compensated fiber optic polarimetric pressure sensor based on photonic crystal fiber
at 1550 nm,” Applied Optics, Vol. 46, pp.1184-1189, (2007).
[20] H. Y. Fu, Sunil K. Khijwania, H. Y. Au, Xinyong Dong, H. Y. Tam, P. K. A. Wai,
and C. Lu, “Novel fiber optic polarimetric torsion sensor based on polarization-
maintaining photonic crystal fiber,” 19th International Conference on Optical Fiber
Sensors (OFS’19),Proceedings Of SPIE, Vol.7004, pp. 70042V1-70042V4, (2008).
[21] H. Y. Fu, H. Y. Tam, L. Y. Shao, X. Y. Dong, P. K. A. Wai, C. Lu, and Sunil K.
Khijwania, “Pressure Sensor Realized with Polarization-Maintaining Photonic
Crystal Fiber based Sagnac Interferometer,” Applied Optics, Vol. 47, pp.2835-2839,
(2008).
[22] D. H. Kim, and J. U. Kang, “Sagnac loop interferometer based on polarization
maintaining photonic crystal fiber with reduced temperature sensitivity,” Optics
Express, Vol. 12, pp.4490-4495, (2004).
[23] M. Sceats and P. A. Krug, “Photoviscous annealing: dynamics and stability of
102

Chapter 5 High Temperature Sensor with Polarization-Maintaining Photonic Crystal Fiber based Sagnac Interferometer
photorefractivity in optical fibers,” SPIE Proc. Photosensitivity and Self-
Organization in Optical Fibers and Waveguides, Vol.2044, pp. 113-120, (1993).
[24] M. Janos and J. Canning, “Permanent and transient resonances thermally induced in
optical fibre Bragg gratings,” Electronics Letters, Vol. 31, pp. 1007-1009, (1995).
103

Chapter 6 Multiplexing of Polarization-Maintaining Photonic Crystal Fiber based Sagnac Interferometer
Chapter 6
Multiplexing of Polarization-Maintaining Photonic
Crystal Fiber based Sagnac Interferometer
6.1 Introduction
In previous chapters, we have investigated the PM-PCF based Sagnac
interferometer for pressure and high temperature sensing applications. The multiplexing
capability of Sagnac interferometers plays a very important role when the sensor system
is expanded. The multiplexing can reduce the cost per sensing point for the sensor system
by sharing the optical source, interrogator and other components with the system. In
addition, multi-parameter detection can be achieved within the same sensor system. The
multiplexing of fiber optic sensors has attracted considerable research interest in past
decades, such as the multiplexing of FBGs [1, 2]. The FBG has an excellent potential of
dense multiplexing, a few multiplexing techniques to be mentioned including WDM,
TDM, SDM, CDMA and FMCW.
In this chapter, we propose three different multiplexing techniques for the Sagnac
interferometers. The output spectrum of a Sagnac interferometer is a periodic sine-like
wave in the wavelength domain. Similar to the WDM technique of FBGs, we propose a
multiplexing technique for Sagnac interferometers in wavelength domain based on coarse
wavelength division multiplexer (CWDM). For demonstration, two Sagnac
interferometers are multiplexed by using a filter wavelength division multiplexer
(FWDM). Multiplexing Sagnac interferometers by connecting in series along a single
104

Chapter 6 Multiplexing of Polarization-Maintaining Photonic Crystal Fiber based Sagnac Interferometer
fiber is another promising technique. It is the simplest method in terms of structure that
there is no additional component needed. Furthermore, Sagnac interferometers can be
multiplexed in parallel by using couplers. We demonstrate a configuration with two
Sagnac interferometers multiplexed by two 3-dB couplers. The sensing information of the
first multiplexing technique can be obtained by direct measurement within channels of
the CWDM. However, post measurement data processing is needed for the last two
multiplexing techniques. Among the three proposed multiplexing techniques, the CWDM
technique enables easy real-time system implementation.
6.2 Multiplexing Techniques of PM-PCF based Sagnac
Interferometer Sensors
6.2.1 CWDM Technique
The experimental setup of multiplexing two Sagnac interferometers by using
CWDM is shown in Figure 6.1. It includes a broadband light source, an optical spectrum
analyzer (OSA), two identical filter wavelength division multiplexers (FWDMs) and two
Sagnac interferometers with different length of PM-PCFs. The length of the PM-PCF1 is
~ 40 cm and the length of PM-PCF2 is ~ 80 cm. The operation range of the two FWDMs
is C band / L band (1500~1562 nm/1570~1640 nm). The insertion losses are less than 0.4
dB with flatness less than 0.3 dB. After the broadband light launches into the first
FWDM, the light is splitted into C band and L band. These two bands of lights then
illuminate the two PM-PCF based Sagnac interferometers separately and are combined
again by the second FWDM. The OSA is used to measure the output spectrum.
105

Chapter 6 Multiplexing of Polarization-Maintaining Photonic Crystal Fiber based Sagnac Interferometer
Broadband Light Source PM-PCF 2
3 dB Coupler
FWDM F WDM OSA
3 dB Coupler
PM-PCF 1
Figure 6.1 Experimental setup of FWDM multiplexing technique for two PM-PCF based
Sagnac interferometers.
Figure 6.2 shows the output spectrum measured by the OSA. In the figure, a good
flatness is shown for the operation wavelength range of the two FWDMs, while there is a
wavelength range (1562 nm to 1570 nm) overlapped by the edges of the two FWDMs
which is not suitable for measurement. By measuring the individual transmission
minimum of the two Sagnac interferometers within their corresponding wavelength
ranges, sensing information of both Sagnac interferometers can be obtained. The output
spectrum for Sagnac interferometer based on PM-PCF 1 and PM-PCF 2 is in L band and
C band, respectively.
106

Chapter 6 Multiplexing of Polarization-Maintaining Photonic Crystal Fiber based Sagnac Interferometer
-40
-35
-30
-25
-20
-15
-10
-5
1500 1520 1540 1560 1580 1600 1620 1640
Wavelength (nm)
Tran
smis
sion
(dB
)
Figure 6.2 Output Spectrum of the CWDM multiplexing technique for PM-PCF based
Sagnac interferometer.
The fundamental of this method is to multiplex Sagnac interferometers in
wavelength domain which is similar to the WDM technique for FBG sensors. However, it
has some different properties than that of WDM technique. Except the same limitation
due to the bandwidth of the broadband light source, there are some other constraints for
this proposed technique. The number of PM-PCF based Sagnac interferometers can be
multiplexed is limited by the number of the available channels of the CWDM. If we use
CWDMs with more channels, more Sagnac interferometers can be multiplexed. However,
the bandwidth of one CWDM channel must be larger than the period of the
corresponding Sagnac interferometer output spectrum to ensure at least one transmission
minimum within the channel all the time. The period of the output spectrum of a Sagnac
107

Chapter 6 Multiplexing of Polarization-Maintaining Photonic Crystal Fiber based Sagnac Interferometer
interferometer is determined by equation (4.7). Furthermore, the operation wavelength
range for each Sagnac interferometer covers a broad wavelength range and it is flexible to
choose one period of range for measurement. This is different from that of FBG sensor
which requires to be operated within a small wavelength range which is fixed by the
Bragg wavelength of the perticulare FBG.
6.2.2 Multiplex in Series along a Single Fiber
PM-PCF 1 PM-PCF 2
Broadband Light Source
3 dB Coupler 3 dB Coupler OSA
Figure 6.3 Experimental setup of in series multiplexing technique for PM-PCF based
Sagnac interferometer.
Another multiplexing scheme is to multiplex Sagnac interferometers in series
along one single fiber. Figure 6.3 shows the experimental setup used for multiplexing two
Sagnac interferometers by connecting them directly. There is no other optical component
needed for this scheme which makes it simplest in consideration of the structure. For
demonstration, we have only two Sagnac interferometers spliced together with each other
108

Chapter 6 Multiplexing of Polarization-Maintaining Photonic Crystal Fiber based Sagnac Interferometer
along the fiber link. The length of the PM-PCF1 and PM-PCF2 are ~ 40 cm and ~ 80 cm,
respectively. The output spectrum can be approximately derived as
⎥⎦
⎤⎢⎣
⎡+•+= )2sin()2sin(10 2
221
11 θλπθλπ
SL
SLLogPoutput , (6.1)
where Lk , Sk, kθ are the loss, the period of the output spectrum and the initial phase of the
Sagnac interferometer k , respectively.
Figure 6.4 shows the output spectrum measured by OSA. To obtain the sensing
information, the wavelength shift of the transmission minimums of each Sagnac
interferometer needs to be determined, thus we need to measure the changes of their
initial phases. From the output spectrum, the un-known parameters of (6.1) can be
determined by using data processing. More Sagnac interferometers can be multiplexed
along the fiber. However, this will increase the computation complexity.
-60
-50
-40
-30
-20
-10
1520 1530 1540 1550 1560 1570 1580Wavelength (nm)
Tran
smis
sion
(dB
)
Figure 6.4 Output Spectrum of the in series multiplexing technique for PM-PCF based
Sagnac interferometer.
109
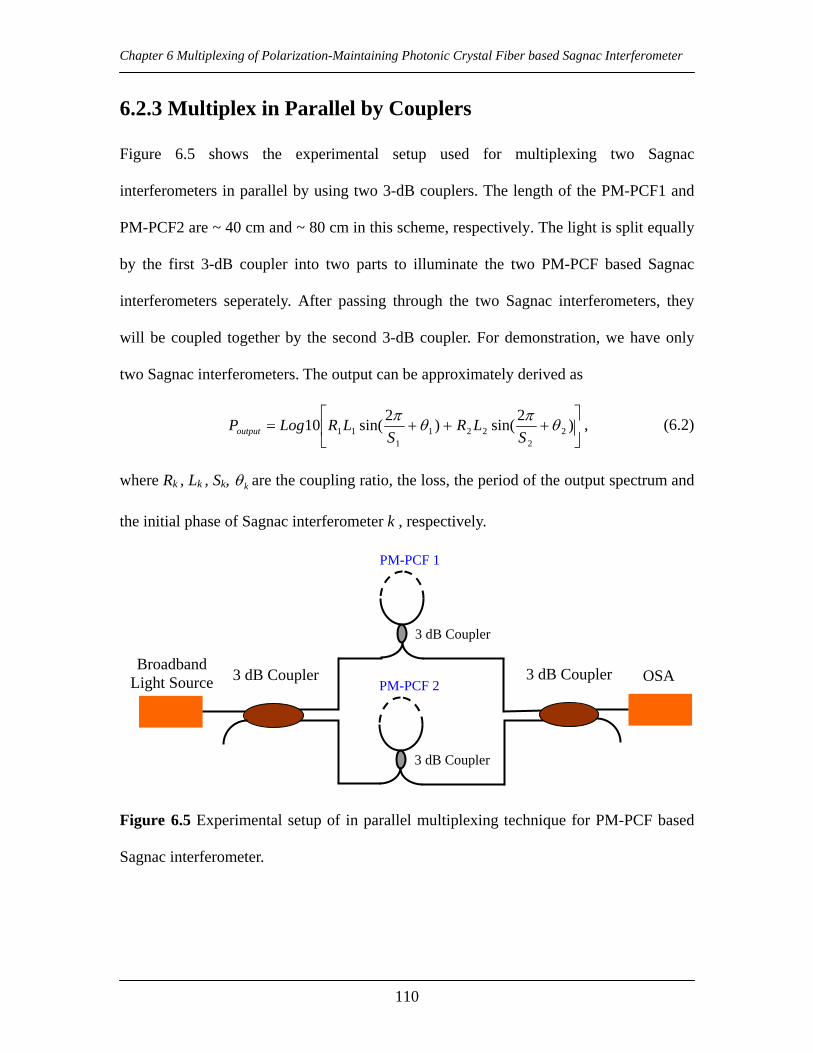
Chapter 6 Multiplexing of Polarization-Maintaining Photonic Crystal Fiber based Sagnac Interferometer
6.2.3 Multiplex in Parallel by Couplers
Figure 6.5 shows the experimental setup used for multiplexing two Sagnac
interferometers in parallel by using two 3-dB couplers. The length of the PM-PCF1 and
PM-PCF2 are ~ 40 cm and ~ 80 cm in this scheme, respectively. The light is split equally
by the first 3-dB coupler into two parts to illuminate the two PM-PCF based Sagnac
interferometers seperately. After passing through the two Sagnac interferometers, they
will be coupled together by the second 3-dB coupler. For demonstration, we have only
two Sagnac interferometers. The output can be approximately derived as
⎥⎦
⎤⎢⎣
⎡+++= )2sin()2sin(10 2
2221
111 θπθπ
SLR
SLRLogPoutput , (6.2)
where Rk , Lk , Sk, kθ are the coupling ratio, the loss, the period of the output spectrum and
the initial phase of Sagnac interferometer k , respectively.
PM-PCF 1
Broadband Light Source PM-PCF 2
3 dB Coupler
3 dB Coupler OSA3 dB Coupler
3 dB Coupler
Figure 6.5 Experimental setup of in parallel multiplexing technique for PM-PCF based
Sagnac interferometer.
110

Chapter 6 Multiplexing of Polarization-Maintaining Photonic Crystal Fiber based Sagnac Interferometer
Figure 6.7 shows the output spectrum measured by OSA. The output spectra of the two
Sagnac interferometers are shown in orange and blue curves by taking measurement
before they launch into the second coupler. The black curve is the spectrum of the whole
system measured by OSA after the second coupler. Similar to previous scheme, the
sensing information is determined by the change of the initial phase of each Sagnac
interferometer. Post measurement data processing is also needed for this scheme.
Couplers with more ports can be used to increase the multiplexing capability. However,
the post measurement data processing will become more complicated under this
circumstance.
-45
-40
-35
-30
-25
-20
-15
-10
-5
0
1520 1530 1540 1550 1560 1570 1580Wavelength (nm)
Tran
smis
sion
(dB
)
40 cm PM-PCF 80 cm PM-PCF 40 & 80 cm PM-PCF
Figure 6.4 Output Spectra of the in parallel multiplexing technique for PM-PCF based
Sagnac interferometer (in Black) and the two individual Sagnac interferometers (in
orange and blue respectively).
111

Chapter 6 Multiplexing of Polarization-Maintaining Photonic Crystal Fiber based Sagnac Interferometer
6.3 Summary
In summary, three different multiplexing techniques of the PM-PCF based Sagnac
interferometers have been proposed and demonstrated experimentally. The CWDM
technique is one direct method for the multiplexing of Sagnac interferometers. It is easy
for interrogation that we only need to have the spectrum measurement for each channel.
Multiplexing of the Sagnac interferometers in series along a single fiber has simplest
structure. A third scheme is based on the use of couplers, that a few Sagnac
interferometers can be multiplexed in parallel. The last two schemes are post
measurement data processing needed and the computation complexity will increase
significantly when the number of the Sagnac interferometer increases. One of the
drawbacks for CWDM technique is its cost. However, it provides direct measurement and
the cross-talk between signals of different channel is significant suppressed by the
CWDM devices and then can be ignored. To conclude, the CWDM multiplexing
technique is the preferred candidate among all the three multiplexing techniques in
consideration of the real-field applications.
References
112

Chapter 6 Multiplexing of Polarization-Maintaining Photonic Crystal Fiber based Sagnac Interferometer
[1] A. D. Kersey, M. A. Davis, H. J. Partrick, M. Leblance, K. P. Koo, C.G. Askins, M.
A. Putnam, and E. J. Friebele, “Fiber grating sensors,” Journal of Lightwave
Technology, Vol.15, pp.1442–1463, (1997).
[2] A. Othonos and K. Kalli, “Fiber Bragg gratings: fundamentals and applications in
telecommunications and sensing,” Artech House Publishers, (1999).
113

Chapter 7 Dispersion Compensating Module based Interrogator for Fiber Bragg Grating Sensors
Chapter 7
Dispersion Compensating Module based Interrogator
for Fiber Bragg Grating Sensors
7.1 Introduction
Fibre Bragg gratings (FBGs) have proved themselves as the ideal candidates for
measuring strain and temperature in smart structures, civil engineering or other harsh
environments. The advantages of FBG sensor over conventional electrical sensors include
small size, light-weight, immunity to electromagnetic interference, low cost and other
inherent advantages of fibre optic sensors. FBG emerges as one of the most successful
fibre-optic sensors due to its wavelength-encoded nature which makes it insensitive to
intensity fluctuation caused by losses in the connection fibre and connectors [1]. The key
technology for an FBG sensor system is the interrogation of the shift of the Bragg
wavelength reflected from an FBG. Various approaches to realize FBG interrogators have
been developed, including those based on scanning filters, tunable lasers, interferometry,
discriminator using the power ratios of optical filters, holographic grating based
spectroscopic charge coupled device (CCD), long period gratings and chirped FBGs [2].
High-speed interrogation of FBG sensors in the order of megasamples per second is
desirable in some applications where fast dynamic system response measurement is
required. Most reported methods, however, interrogate FBGs at less than 1,000 samples
114

Chapter 7 Dispersion Compensating Module based Interrogator for Fiber Bragg Grating Sensors
per second. Some schemes for high speed interrogation were proposed recently, based on
arrayed waveguide grating and short-pulse interferometry [3, 4]. In this chapter, we
propose and demonstrate a novel FBG sensor interrogation system [5,6] using EOM and
a dispersion compensating module to convert wavelength to time measurement. The
system can interrogate FBGs at speed in the order of megasamples per second.
7.2 FBG Interrogation System based on Dispersion
Compensating Module
7.2.1 Experimental Setup and Operating Principle
Figure 7.1 shows the experimental setup of the proposed FBG interrogation
system. An erbium-doped fibre amplified spontaneous emission (ASE) source launches
light into port 1 of a 3-port circulator and illuminates the FBG array via port 2 of the
circulator. The light whose wavelength falls in the reflection spectrum of the FBG array
will be reflected back to the circulator. Light from port 3 of the circulator is launched to
the electro-optic modulator (EOM) which is driven by a pulse pattern generator (PPG)
that generates one bit “1” follows by a string of bit “0”. The pulsed signal is then fed to
the dispersion compensation module. The spectrum within the pulse comprises the
different wavelength components reflected by the FBG array and they take different
times to propagate the dispersion compensation module. By measuring the time shift, ∆t,
we obtain the wavelength shift, ∆λ by the relationship
∆λ = ∆t/D, (7.1)
115

Chapter 7 Dispersion Compensating Module based Interrogator for Fiber Bragg Grating Sensors
where D is the total dispersion of the dispersion compensating module. Variations of ∆t
give the dynamic response of the FBGs. In absolute strain or temperature measurements,
one of the FBGs in the array with either the shortest or longest wavelength can be used as
a reference, and the time difference between it and the other FBGs are measured. The
basic principle of the proposed interrogation technique is that instead of measuring
wavelength shift using a wavelength meter, the dispersion fibre converts the wavelength
difference to time difference which can be easily measured using a low-cost but
high-speed photoreceiver and oscilloscope.
Figure 7.1 Experimental setup of the proposed FBG interrogation system.
The Broadband ASE source used in this experiment has high saturation output
power of +27 dBm and operating wavelength from 1540 nm to 1565 nm. The EOM
(JDSU®, OC-192) is a 10 Gb/s LiNbO3 modulator driven by a pulse pattern generator
116
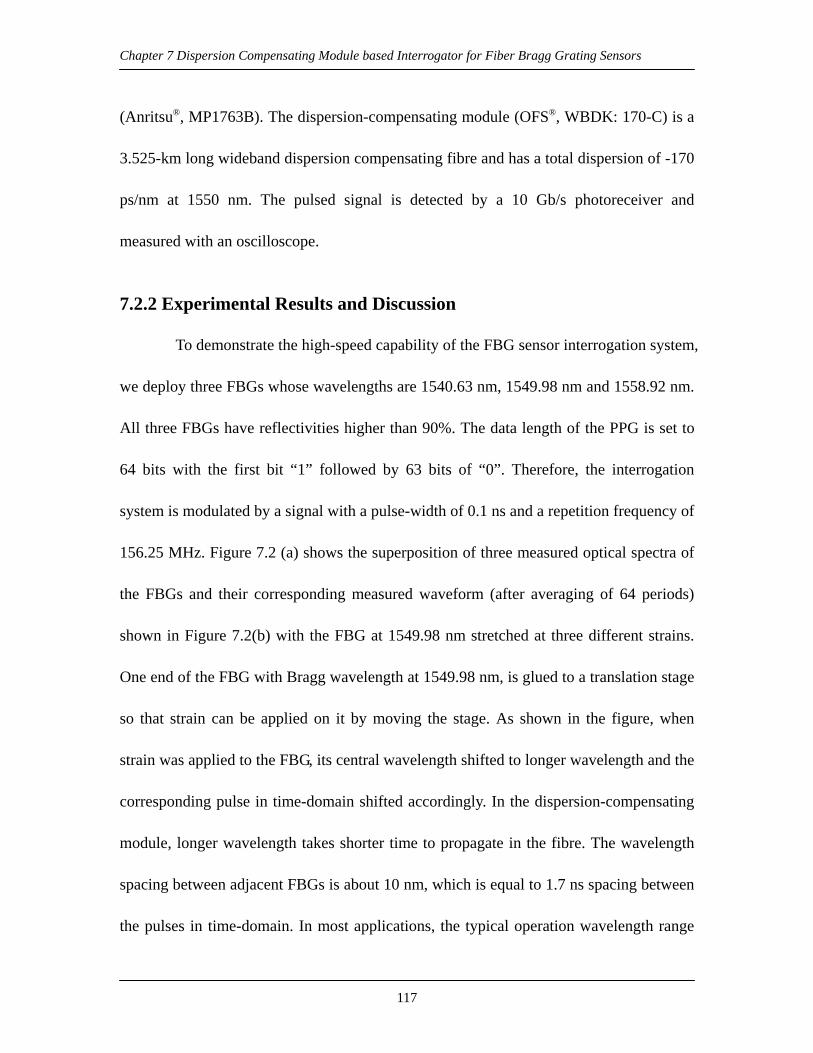
Chapter 7 Dispersion Compensating Module based Interrogator for Fiber Bragg Grating Sensors
(Anritsu®, MP1763B). The dispersion-compensating module (OFS®, WBDK: 170-C) is a
3.525-km long wideband dispersion compensating fibre and has a total dispersion of -170
ps/nm at 1550 nm. The pulsed signal is detected by a 10 Gb/s photoreceiver and
measured with an oscilloscope.
7.2.2 Experimental Results and Discussion
To demonstrate the high-speed capability of the FBG sensor interrogation system,
we deploy three FBGs whose wavelengths are 1540.63 nm, 1549.98 nm and 1558.92 nm.
All three FBGs have reflectivities higher than 90%. The data length of the PPG is set to
64 bits with the first bit “1” followed by 63 bits of “0”. Therefore, the interrogation
system is modulated by a signal with a pulse-width of 0.1 ns and a repetition frequency of
156.25 MHz. Figure 7.2 (a) shows the superposition of three measured optical spectra of
the FBGs and their corresponding measured waveform (after averaging of 64 periods)
shown in Figure 7.2(b) with the FBG at 1549.98 nm stretched at three different strains.
One end of the FBG with Bragg wavelength at 1549.98 nm, is glued to a translation stage
so that strain can be applied on it by moving the stage. As shown in the figure, when
strain was applied to the FBG, its central wavelength shifted to longer wavelength and the
corresponding pulse in time-domain shifted accordingly. In the dispersion-compensating
module, longer wavelength takes shorter time to propagate in the fibre. The wavelength
spacing between adjacent FBGs is about 10 nm, which is equal to 1.7 ns spacing between
the pulses in time-domain. In most applications, the typical operation wavelength range
117

Chapter 7 Dispersion Compensating Module based Interrogator for Fiber Bragg Grating Sensors
for an FBG sensor is about 2 nm, which corresponds to 0.34 ns. With a time period of 6.4
ns, the number of FBG sensors can be handled is 18. However, more FBG sensors can be
interrogated by increasing the time period to extend the wavelength range. If we take one
of the FBGs as reference, we can determine the wavelength shift of the other two FBGs.
The referenced FBG can also serve as temperature compensator, since in most
applications temperature fluctuation is inevitable.
-70
-60
-50
-40
-30
-20
1525 1535 1545 1555 1565
Wavelength (nm)
Opt
ical
pow
er (d
Bm
)
(a) Measured optical spectra of the 3 FBG sensing signals.
118

Chapter 7 Dispersion Compensating Module based Interrogator for Fiber Bragg Grating Sensors
-4
-3
-2
-1
0
1
2
3
4
0 1 2 3 4 5
Time (ns)
Am
plitu
de (m
V)
(b) Measured time-domain spectra of the 3 FBG sensing signals.
Figure 7.2 (a) Measured optical spectra and (b) time-domain spectra of the 3 FBG
sensing signals with the FBG at 1550 nm under strain tuning.
Figure 7.3 shows the measured time shift as a function of the wavelength shift of
one of the FBGs. The Bragg wavelength of the FBG was varied by 5-nm, and the
measured linearity is very good with a R-square value of 0.9992. The coefficient of time
shift as a function of wavelength shift is 0.168 ps/pm, which correspondent to a response
rate of 0.202 ps/µε, as the wavelength-strain sensitivity of the FBG is 1.2 pm/µε. The
measurement results agree well with the theoretical prediction given by Eq. (7.1). The
highest time-base resolution of the oscilloscope (Agilent, 86100A) used in our
experiment is 2 ps/division and thus the wavelength shift resolution can be achieved is ~
119

Chapter 7 Dispersion Compensating Module based Interrogator for Fiber Bragg Grating Sensors
12 pm in our case. Higher resolution could be achieved using longer length of the fibre or
fibres with larger dispersion parameters. However, this may introduce higher loss as
well as larger signal pulse broadening that make accurate peak measurement difficult.
Curve-fitting techniques could be employed to improve the accuracy of detecting the
peak of broadened pulses.
y = 168.45x - 7.6732R2 = 0.9992
0
100
200
300
400
500
600
700
800
900
0 1 2 3 4 5 6Wavelength Shift (nm)
Tim
e Sh
ift (p
s)
Figure 7.3 Time shift as a function of wavelength shift.
The proposed FBG sensing interrogator has no moving parts and can demodulate
FBGs at very high speed. As a result of the rapid progress of optical communications,
high-speed devices such as modulators and photodetectors are becoming inexpensive and
readily available. In our experiment, a 10 Gb/s modulator was used to generate 0.1 ns
pulses with a time period of 6.4 ns and according to Eq. (7.1) covers a wavelength range
of about 37.65 nm. There is a trade-off between the interrogation speed and the
120
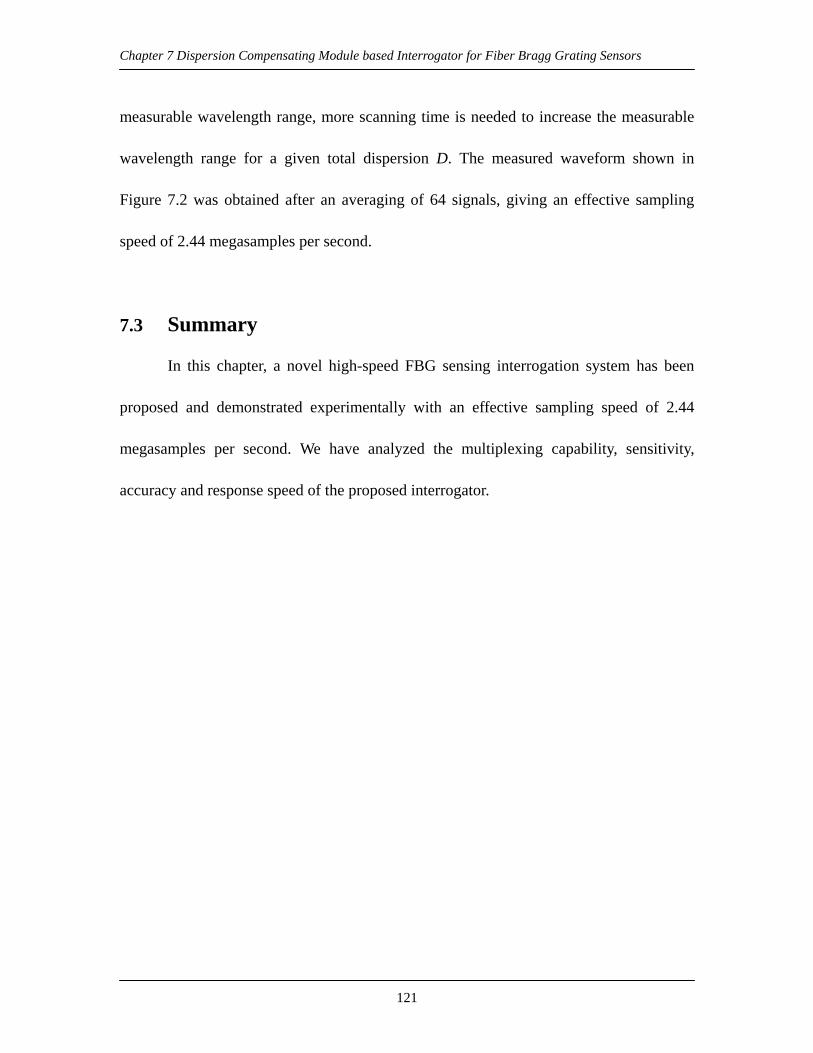
Chapter 7 Dispersion Compensating Module based Interrogator for Fiber Bragg Grating Sensors
measurable wavelength range, more scanning time is needed to increase the measurable
wavelength range for a given total dispersion D. The measured waveform shown in
Figure 7.2 was obtained after an averaging of 64 signals, giving an effective sampling
speed of 2.44 megasamples per second.
7.3 Summary
In this chapter, a novel high-speed FBG sensing interrogation system has been
proposed and demonstrated experimentally with an effective sampling speed of 2.44
megasamples per second. We have analyzed the multiplexing capability, sensitivity,
accuracy and response speed of the proposed interrogator.
121

Chapter 7 Dispersion Compensating Module based Interrogator for Fiber Bragg Grating Sensors
References
[1] A. D. Kersey, M. A. Davis, H. J. Patrick, M. Leblanc, K. P. Koo, C. G. Askins, M.
A. Putnam, and E. J. Friebele, “Fiber Grating Sensors,” Journal of Lightwave
Technology, Vol. 15, pp.1442-1463, (1997).
[2] Y. J. Rao, “In-fibre Bragg grating sensors,” Measurement Science and Technology,
Vol. 8, pp. 355-375, (1997).
[3] K. Levin, J. Matrat, and O. Gunnarsson, “Evaluation of a High Sampling Rate
Time-domain Multiplexing Fiber-optic Sensor System,” Structural Health
Monitoring, Vol. 2, pp.107-113, (2003).
[4] Y. Sano, and T. Yoshino, “Fast Optical Wavelength Interrogator Employing
Arrayed Waveguide Grating for Distributed Fiber Bragg Grating Sensors,” Journal
of Lightwave Technology, Vol. 21, pp.132-139, (2003).
[5] H. Y. Fu, H. L. Liu, H. Y. Tam, P. K. A. Wai, and C. Lu, “Novel Dispersion
Compensating Module based Interrogator for Fiber Bragg Grating Sensors,” 33rd
European Conference on Optical Communication (ECOC’2007), Berlin, Germany,
Sep. 2007.
[6] H. Y. Fu, H. L. Liu, Xinyong Dong, H. Y. Tam, P. K. A. Wai, and C. Lu,
“High-speed fibre Bragg grating sensor interrogation using dispersion
compensation fibre,” Electronics Letters, Vol.44, pp.618-619, (2008).
122

Chapter 8 Long-distance and Quasi-distributed Fiber Bragg Grating Sensor System
Chapter 8
Long-distance and Quasi-distributed Fiber Bragg
Gratings Sensor System
8.1 Introduction
For sensing over a long distance, fiber has advantage over conventional sensor
systems due to the low loss of fiber cable. A sensor system that quasi-distributes FBGs
along long-distance fiber is attractive for applications such as railway system monitoring
where there is a need to gather information along the rail networks. FBG sensor system
has shown its advantages over those conventional electronic based sensor systems when
used for railway networks. Typical distance of a metro railway is a few tens of kilometers
with some of them go up to 100 km. For inter city railway system, the distance can be
much larger than 100 km. FBG sensor system capable of operating over a long distance is
thus necessary. Research on long distance FBG sensor system has attracted much
research interest in recent years [1-6]. The maximum transmission distance with a
broadband light source is limited to about 25 km due to Rayleigh scattering effect and
intrinsic loss of the fiber link [7].
Several schemes to further extend the sensing distance were proposed by
employing Raman amplification or hybrid amplification. P.C. Peng et al proposed two
schemes for long-distance FBG sensor system. They have shown sensing distance of 25
123

Chapter 8 Long-distance and Quasi-distributed Fiber Bragg Grating Sensor System
km with a few FBG sensors located at the far end of fiber. One of the schemes (as shown
in Figure 8.1) is based on the use of a linear cavity Raman laser configuration formed by
FBGs and a fiber loop mirror to achieve high optical signal-to-noise ratio (SNR), but the
number of FBG sensors in this system is limited due to the relatively low Raman gain
which is difficult to improve even when using high Raman pump power and multi-
wavelength pumping. Another approach proposed as shown in Figure 8.2 is a multi-
wavelength fiber ring laser configuration with a erbium-doped waveguide amplifier
(EDWA) and a semiconductor optical amplifier (SOA), but only 6 or so FBG sensors can
be used due to the narrow effective bandwidth (<20nm) which depends on the overlap of
the spectrum between EDWA and SOA.
Figure 8.1 Fiber Bragg grating sensor system using a linear-cavity fiber laser scheme
with a distributed Raman amplifier as a gain medium [1].
124

Chapter 8 Long-distance and Quasi-distributed Fiber Bragg Grating Sensor System
Figure 8.2 Fiber Bragg grating sensor system using a fiber ring laser with hybrid
amplifier. The hybrid amplifier comprises an erbium-doped waveguide amplifier (EDWA)
and a semiconductor optical amplifier (SOA) [2].
Figure 8.3 Fiber Bragg grating (FBG) based Raman laser sensing probe for long-distance,
remote temperature sensing application [3].
Figure 8.3 shows another long-distance sensing system. Its sensing probe can be
placed at a distance up to 50 km. It uses a Raman laser configuration with multiple
sensing FBGs and a tunable chirped FBG. This proposed laser sensor has two
125

Chapter 8 Long-distance and Quasi-distributed Fiber Bragg Grating Sensor System
independent resonance cavities defined by a combination of two FBGs and a tunable
broadband chirped FBG with high reflectivity. Even though high SNR can be achieved by
this configuration, the number of FBG sensors is still limited.
Y. J. Rao et al have studied the long-distance FBG sensor system based on tunable
fiber ring laser configuration with a combination of bidirectional Raman amplification
and dual erbium-doped fiber (EDF) amplification (Figure 8.4). The hybrid Raman-EDF
amplification configuration arranged in the ring laser is used to enhance the OSNR of
FBG sensor signals owing to the high gain of the erbium-doped fiber amplifier (EDFA)
and the low noise of the Raman amplification. It is said that such a sensor system can
support a large number of FBG sensors by making use of the tunable filter with spatial
division multiplexing (SDM). As shown in the figure, it needs two section fibers to
achieve a 50 km sensing distance, thus increase the complexity of the whole system.
Figure 8.4 Schematic diagram of a long-distance FBG sensing system with hybrid
Raman-EDF amplification based on a tunable fiber ring laser configuration [5].
126

Chapter 8 Long-distance and Quasi-distributed Fiber Bragg Grating Sensor System
In this chapter, two schemes for the long-distance and quasi-distributed FBG
sensor system are proposed and demonstrated. One is by cascading three broadband light
sources along the fiber link and the other is based on pulse modulated semiconductor
amplifier (SOA) ring cavity.
In the first schemes, three broadband light sources having different wavelength
bands with different output spectral densities are used to illuminate the FBG sensors,
Rayleigh backscattering is significantly reduced and a FBG sensor system distributed
over 75 km long transmission fiber with 60-dB effective dynamic range is realized. It is
important to note that in the proposed approach, the interrogation system is located at one
end of the fiber link and the broadband light sources are strategically placed along the
link purely for illuminating the FBGs and no communication/interface between the
interrogator and broadband sources is necessary. The FBG sensor multiplexing
configuration enables the increase of fiber length as well the number of FBG sensors
distributed along the fiber, and at the same time extend the effective dynamic range of the
interrogator without affecting the system response time.
The second scheme is a more practical and simple one. It is based on pulse
modulated SOA ring cavity. Both the light source and interrogation system are located at
one end of the fiber link, and there are only FBG sensors along the fiber link. We have
studied the synchronization issue of this proposed sensor system. The multiplexing
capability together with the sensing distance has been investigated. By using a TDM
technique, 6 FBGs can be quasi-distributed along a 40-km fiber. An Optical signal-to-
noise ratio (OSNR) better than 20 dB was achieved for this sensor system.
127

Chapter 8 Long-distance and Quasi-distributed Fiber Bragg Grating Sensor System
8.2 High Dynamic Range Long-distance and Quasi-
distributed FBG Sensor System with Three Broadband
Light Sources in Series
Figure 8.5 Configuration of the proposed FBG sensor system (VOA, variable optical
attenuator;ASE, amplified spontaneous emission source; BS, broadband source).
Figure 8.5 shows the configuration of the first proposed long-distance and quasi-
distributed FBG sensor system. FBGs with different reflection wavelengths are located
along the transmission fiber for quasi-distributed sensing. In conventional peak detection
system, a single broadband light source is used to illuminate the FBG array via port 1 and
port 2 of the circulator while the reflected signal is measured by a tunable optical filter
and the detector via port 2 and port 3 of the circulator. Note that in conventional systems,
points B and C, and points D and E are connected together. The optical spectral density,
photodetector sensitivity, Rayleigh scattering, and the total loss of the sensing path which
128

Chapter 8 Long-distance and Quasi-distributed Fiber Bragg Grating Sensor System
includes the insertion loss of sensors, splicing points and fiber attenuation, affect the
transmission length of a sensor system. According to [7], noise accumulated due the
Rayleigh scattering would limit the maximum transmission fiber to about 25 km.
8.2.1 High Dynamic Range for Interrogation
In our proposed sensor configuration as shown in Figure 8.5, the sensor path is
divided into different fiber sections in which each section is illuminated with a broadband
light source of different wavelength bands, and the insertion loss of section i is denoted
by Lsection i. Light from broadband source i is launched into sensor section i via port 1 and
port 2 of circulator i. The reflected light from a FBG in sensor section i will be detected
via sensor section i, section (i-1),…, section 1, port 2-3 of circulator i, port 2-3 of
circulator (i-1),…, and port 2-3 of circulator 1. We assumed that the insertion loss of all
the circulators from port 1 to port 2, and that from port 2 to port 3 are equal and are
denoted by Lcir.
The optical power reflected from the FBGs should not be greater than the
maximum allowable optical power, Pmax, of the optical detector. On the other hand, the
optical power reaching the optical detector should be greater than the detector’s
sensitivity, Psen. Therefore, for an n-section sensor configuration and assuming 100%
reflection FBGs were used, the output spectral density, Si, of broadband light source i
(defined as dBm/0.1 nm) must satisfy the following conditions:
, and (8.1) ( ) ∑−
=
+++=1
1sectioncirmax 1
n
iii LLnPS
. (8.2) ( ) ∑−
=
++++≥1
1 section sectioncirsen 21
n
iini LLLnPS
129

Chapter 8 Long-distance and Quasi-distributed Fiber Bragg Grating Sensor System
In equations (8.1) and (8.2), we assumed that the FBGs and the bandwidth of the
tunable optical filter have an equivalent rectangular spectral width of about 0.1 nm.
Equation (8.1) describes the optical power incident on the detector of the interrogator by
any one of the FBGs located in fiber section i. Equation (8.2) gives the required
minimum optical power, reflected from any FBG, at the detector.
In conventional FBG systems, the FBG closest to the interrogator reflects the
highest optical power to the optical detector and the FBG furthest in the link must reflects
sufficient optical power (>Psen) at the detector. Therefore the dynamic range, Dconventional,
of conventional FBG sensing systems can be expressed as
[ ] [link
linkcir0cir0
senmaxalconvention
2 222
LLLSLS
PPD
=−−−−= ]
−= (8.3)
where So is the optical spectral power density of the interrogator and Llink is the fiber link
loss from the interrogator to the furthest FBG. In Equation (8.3), we assumed that the
fiber connecting the closest FBG and port 2 of the circulator is short and does not
contribute significant loss to the link. A typical commercial FBG interrogator has a 20-dB
dynamic range, allowing a fiber link loss of 10 dB only. If an FBG introduces splice loss
of 0.2 dB (from 2 fusion splices), then a 25-FBG distributed sensor link would be limited
to less than 25 km by the dynamic range of the instrument.
In the proposed system, the dynamic range can be obtained from Equation (8.1)
and Equation (8.2) as:
(8.4) n
n
LDLPPD
section
sectionsenmax
2 2
≥⇒≥−=
Equation (8.4) is similar to that of a conventional FBG system described by Equation (3)
but it is now the largest link loss of a fiber section instead of the entire fiber link that is
130

Chapter 8 Long-distance and Quasi-distributed Fiber Bragg Grating Sensor System
limited by the dynamic range of the system. Consequently, a much longer sensing fiber
link can be designed by cascading several such fiber sections together.
Figure 8.6 Optical spectra of the three broadband sources with different output powers
and center wavelengths.
In our experiment, three ASE fiber sources with broad bandpass filters at different
center wavelengths were used to illuminate three FBG arrays. Two FBGs were employed
in each array to simulate the FBGs reflecting the strongest and weakest light at the
detector. The wavelengths of the six FBGs are 1539.21 nm, 1540.72 nm, 1549.72 nm,
1551.04 nm, 1558.42 nm, and 1560.12 nm. The reflectivities of all the FBGs are higher
than 95 %. The FBGs used in our experiment were fabricated in hydrogen-loaded
standard telecommunication fiber (Corning SMF-28) using a 248 nm excimer laser, and
annealed at 120°C for about 2 days. A 25-km of standard single mode fiber and a
variable optical attenuator are inserted between the two FBGs to emulate large number of
sensors installed in each section. Assuming a detector with 20-dB dynamic range was
131

Chapter 8 Long-distance and Quasi-distributed Fiber Bragg Grating Sensor System
used, total insertion loss of each section is adjusted to about 10 dB by using an attenuator.
For a photodetector having a sensitivity of -50 dBm, and the port to port loss of the
circulator is 0.5 dB, output power density of ASE 1, ASE 2 and ASE 3 of -26 dBm/0.1
nm, -15.5 dBm/0.1 nm and -5 dBm/0.1 nm respectively were designed for the experiment.
ASE 1 and ASE 2 are constructed with 8 m of Erbium-doped fiber (Highwave®., 741
EDF) and forward pumped by 980 nm pump lasers with 100 mW and 170 mW,
respectively, while the highest power light source (ASE 3) is pumped by two pump lasers,
100 mW and 150 mW in the forward and backward directions, respectively. Bandpass
filters are used for each ASE source to filter the out of band signal in order to minimize
the Rayleigh scattering noise, the center wavelength of the bandpass filters employed for
ASE 1, ASE 2 and ASE 3 are 1540 nm, 1550 nm and 1560 nm respectively, the resultant
optical spectra of the sources measured with an optical spectrum analyzer (OSA) are
shown in Figure 8.6. For practical application, tunable optical filter and a photodetector
could be used to measure the signal reflected from the FBG sensors to detect the peak
wavelength of each FBG. In our experiment, an OSA with 0.1 nm resolution is used
because of its higher sensitivity so that the entire spectrum can be observed.
8.2.2 Sensing Distance
Figure 8.7 shows the measured output spectrum in which only one broadband
light source is employed to represent a conventional FBG sensor system and the three
sensor sections are connected directly using fiber connectors. The optical signal-to-noise
ratio (OSNR) of the three FBGs, 1551.04 nm, 1558.42 nm and 1560.12 nm, located in
section 2 and section 3 is relatively low because of the Rayleigh scattering noise, and
132

Chapter 8 Long-distance and Quasi-distributed Fiber Bragg Grating Sensor System
their peak wavelength cannot be easily resolved even with a high sensitivity OSA. The
power difference between the highest and lowest reflected FBG signals is about 30 dB
which is much greater than the 20-dB dynamic range of a typical FBG interrogator.
Figure 8.7 Measured optical spectra of the sensor system when only a single high power
broadband source is operated to simulate a conventional sensor system.
(a) With bandpass filters
133

Chapter 8 Long-distance and Quasi-distributed Fiber Bragg Grating Sensor System
(b) Without bandpass filters
Figure 8.8 Measured optical spectra of the FBG sensor system using broadband source:
(a) with bandpass filters and (b) without bandpass filters.
Figure 8.8 (a) shows the measured output spectrum of the novel FBG sensor
system, 20 dB dynamic range and more than 10 dB OSNR were observed. The bandpass
filters connected after the ASE sources are used to filter the optical powers outside the
wavelength range of interest to minimize Rayleigh scattering noise. Fig. 8.8 (b) shows
the measured output spectrum of the FBG sensor system when the bandpass filters are
removed, the Rayleigh scattering background noise has increased by about 3 dB as
compared to that in Fig. 8.8 (a). The difference in intensity between the closest and
furthest FBGs (for example, between FBG 1 and FBG 2) within a section depends on the
spectral density profile of the ASE as well as the link loss between the two FBGs. The
isolation from port 3 to port 1 of the circulators is very high (~60 dB), therefore the FBGs
in section i are illuminated only by ASE i. It is important to note that when ASE k fails,
only the sensors in section k cannot be detected, whereas all the sensors connected to
134

Chapter 8 Long-distance and Quasi-distributed Fiber Bragg Grating Sensor System
other sections are still measurable. Figure 8.9 (a) to (c) shows the optical spectrum of the
sensor system when the first, second and third ASE source is respectively switched off.
(a) Measured reflected light when ASE 1 is switched off.
(b) Measured reflected light when ASE 2 is switched off.
135

Chapter 8 Long-distance and Quasi-distributed Fiber Bragg Grating Sensor System
(c) Measured reflected light when ASE 3 is switched off.
Figure 8.9 Measured optical spectra of the FBG sensor system when (a) the first, (b) the
second and (c) the third ASE source is individually switched off.
The proposed configuration can be deployed in sensor systems where a large
number of FBGs are needed and the FBGs are spanned along tens of km of optical fiber,
such as in railway monitoring application. This system also overcomes the 25-km sensor
link limitation due to Rayleigh scattering noise in conventional sensor system
configuration. In fact, by using this three sections sensor system, the dynamic range of
the system is improved by three times compared to a conventional FBG interrogation
system. According to Equation (8.4), if we assume the insertion loss for each FBG
sensor is 0.2 dB and the fiber loss is 0.2 dB/km, our demonstrated 60 dB effective
dynamic range system can actually support 150 FBG sensors for short length of
transmission fiber or 75 FBG sensors over 75 km transmission fiber length. The number
136

Chapter 8 Long-distance and Quasi-distributed Fiber Bragg Grating Sensor System
of sensors or length of transmission fiber can be substantially improved if more sensor
sections are incorporated into the system. The Rayleigh scattering effect can be further
reduced if the broadband light sources are designed properly, for example using sharp
cut-off, flat-top optical bandpass filters.
137

Chapter 8 Long-distance and Quasi-distributed Fiber Bragg Grating Sensor System
8.3 Long-distance and Quasi-distributed FBG Sensor System
using a Pulse Modulated Semiconductor Optical
Amplifier Ring Cavity
Another scheme proposed for the long-distance and quasi-distributed FBG
sensing is based on pulse modulated semiconductor optical amplifier (SOA) ring cavity
[6, 8]. Compared with the first scheme, the second scheme has an advantage that the light
source and the interrogation system are all at one end of the sensing fiber link. This is
beneficial for practical system applications.
Figure 8.10 shows the experimental setup of the proposed sensor system. The ring
cavity includes a semiconductor optical amplifier, a coupler, an array of FBG sensors and
a 3-port circulator. The SOA functions as a light source, a gating device as well as an
optical amplifier. The 20% port of the coupler is the output of this sensor system and
signals are measured with an optical spectrum analyzer (OSA) after passing through an
isolator, while the other output port feeds to port 1 of the circulator and illuminates the
FBG array via port 2. The reflected signal by the FBGs will then return back to the input
of SOA through port 3 of the circulator. The circulator here also ensures uni-directional
operation of the ring cavity. The SOA can act as a gate by switching its biasing current.
Initially, when the SOA is on, it will generate light due to amplified spontaneous
emission (ASE) without the presence of any optical input signal. Some of the light whose
wavelength falls in the reflection spectrum of the FBG array will be reflected. If the SOA
is modulated at a frequency that synchronized with the return signal of one of the FBGs,
signal from that particular FBG will be amplified while signals reflected from other
138

Chapter 8 Long-distance and Quasi-distributed Fiber Bragg Grating Sensor System
FBGs will be attenuated. The SOA is driven by a pulse generator with frequency (fi) and
pulse width (τ ) to probe the FBG sensors along the fiber. The relation between the ring
cavity length and probe frequency in synchronization is:
)2(/ 0 ii LLncf += , (8.5)
where fi is the probe frequency for FBGi, c is the speed of light, n is the refractive index
of fiber, L0 is length of the ring cavity excludes sensing fiber connected to port 2 of the
circulator and Li is the distance of FBGi from the circulator.
FBG1 FBG2 FBGn
SOA 20:80 Coupler
Pulse Generator
Off
On
Circulator
L2 Ln
Isolator
1 3 2
L1
OSA
Figure 8.10 Experimental setup of sensor system and the timing signal (on-off signal)
applied to the SOA for addressing different FBGs in the sensor array. Changing the probe
frequency can select signals of different FBGs at different distances.
The SOA (Samsung Electronics®, OA40B3A) used in this experiment has greater
than 25 dB of small-signal gain and 40 nm of 3dB optical bandwidth which is centered at
1540 nm. The saturation output power is 7 dBm with 150mA operating current. The SOA
139

Chapter 8 Long-distance and Quasi-distributed Fiber Bragg Grating Sensor System
was biased at 30 mA and modulated with 120 mA by a current driver (Analog Devices,
AD9662) which is controlled by a pulse generator (Standard Research Systems®, DG535).
8.3.1 Synchronization Issue
-16
-15.4
-14.8
-14.2
-13.6
-13
19.3 19.4 19.5 19.6 19.7 19.8Probe Frequency (kHz)
Opt
ical
Pow
er (d
Bm
)
0
8
16
24
32
40Time Difference, T d
OSN
R (d
B)
-τ -τ/2 0 τ/2 τ
Figure 8.11 Optical power and OSNR as a function of probe frequency. The FBG is
located at 5 km, and the pulse width is 500 ns.
In order to investigate how synchronization between the probe frequency and
signal round-trip time affects system performance, a high reflectivity (above 90%) FBG
was inserted at 5.013 km of the fiber. Figure 8.11 shows the optical power and OSNR of
140

Chapter 8 Long-distance and Quasi-distributed Fiber Bragg Grating Sensor System
the output signal as a function of probe frequency of the pulse generator. The pulse width
of the signal was 500 ns. The optical power was measured by an optical power meter
(ILX Lightwave®, FPM-8210) and the OSNR was measured with an OSA (Agilent®,
86140B). Since the optical signal is pulsed, the actual OSNR should be much higher. The
synchronized probe frequency was about 19.58 kHz. However, the signal can still be
detected when the frequency was varied from 19.39 kHz to 19.78 kHz, corresponding to
a difference in periods of 1,017 ns which is approximately twice the pulse width.
-5
5
15
25
35
45
-100 0 100 200 300 400 500 600
Time (ns)
Volta
ge (m
V)
(a)
(b)
τ
1/ 1/ 2f fl h τ− =
Figure 8.12 The output signal pulse shapes at (a) synchronized probe frequency and (b)
un-synchronized probe frequency.
141

Chapter 8 Long-distance and Quasi-distributed Fiber Bragg Grating Sensor System
-10
0
10
20
30
40
50
-0.5 0.5 1.5 2.5 3.5 4.5
Time (us)
Volta
ge (m
V)
Figure 8.13 Concave of the return signal for 500 ns pulse is due to the relaxation
oscillation of the bias current driver circuit of SOA.
The synchronization between the probe frequency and the ring cavity round-trip
time affects the signal power significantly. When the probe frequency shifts away from
the synchronized frequency, the minimum and maximum probe frequency must satisfy
equation (8.6) to ensure the returned signal arriving at the SOA overlaps with the “on”
time slot of the SOA, as shown in the inset of Figure 8.12.
τ2/1/1 =− hl ff , (8.6)
where τ is the pulse width and fl and fh are the lowest and highest probe frequencies,
respectively. Figure 8.12 is the pulse shape of the output signal detected by a 25GHz
142

Chapter 8 Long-distance and Quasi-distributed Fiber Bragg Grating Sensor System
photodetector (New Focus®, Model1414) and measured with an oscilloscope (Tektronix®,
TDS714L). It shows the pulse shape of the synchronized optical signal (at probe
frequency of 19.58 kHz which corresponds to one round-trip time, Trt, of light that
reflects and arrives back at the FBG) and un-synchronized optical signal (probe
frequency = 19.54 kHz). The concave for the pulse shape of the synchronized signal is
due to the relaxation oscillation of the bias current driver circuit of the SOA, as shown in
Figure 8.13. Considered the un-synchronized signal’s pulse shape shown in Figure
8.12(b), the time difference, Td, between the arrival time of the reflected light at the SOA
and the start of the SOA switch “ON” time. In this particular case, the reflected light
arrives 104.5 ns before the SOA switches “ON”. Consequently, only part (500 ns – 104.5
ns = 395.5 ns) of the reflected pulse is amplified by the SOA after one round-trip and 291
ns (395.5 ns-104.5 ns) of the pulse amplified after 2 round-trips, and so on. The portion
of the reflected light that arrives at the SOA before it is switched on is blocked. The
power amplitudes for each time step are different. The lowest power step is the ASE
noise generated by the SOA when it is switched on. The second power step is the optical
power of the returned signal after one round-trip together with in-band ASE noise that is
slightly suppressed. For the third power step, the returned signal is after two round-trips
and ASE noise is significantly suppressed. After two round-trips of propagating in the
cavity, the signal reaches saturation and thus the power level does not change much. It
should be noted that the number of round-trips before the signal reaches saturation
depends on the saturation power of the SOA and the cavity loss. The two different
gradient magnitudes of the optical power shown in Figure 8.11 are due to these two
amplification processes. For Td in [τ /2, τ] or [-τ /2, -τ], the output signal comprises the
143
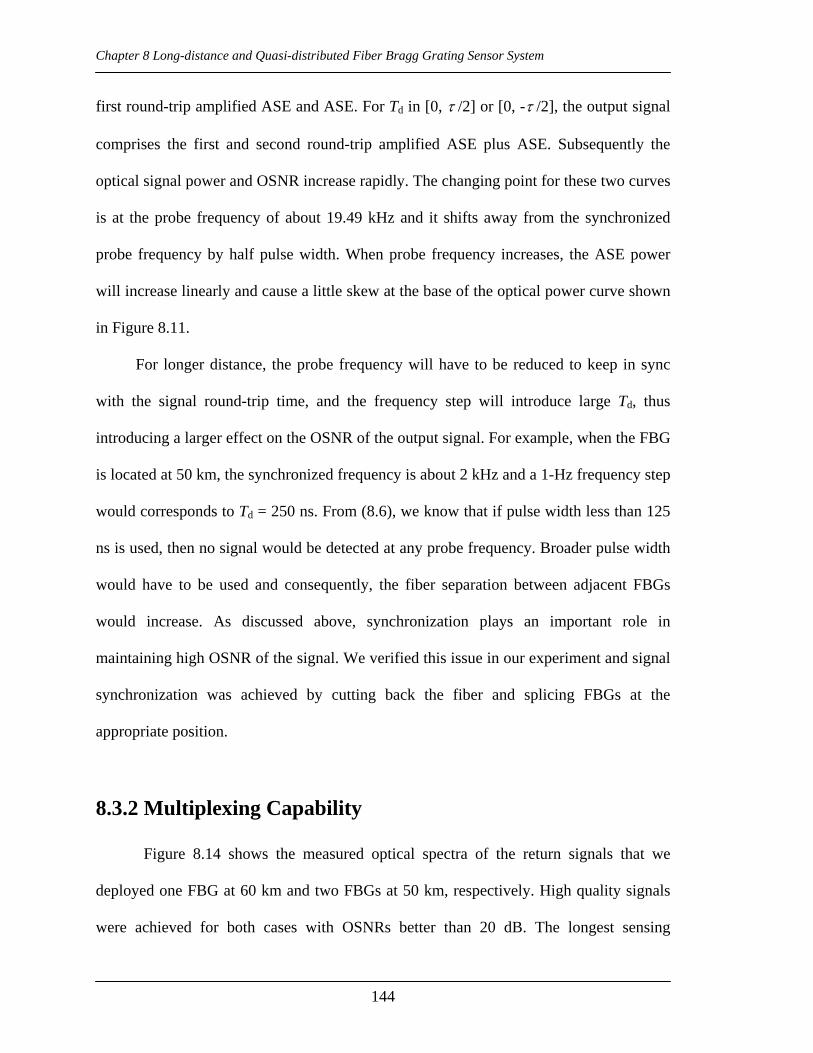
Chapter 8 Long-distance and Quasi-distributed Fiber Bragg Grating Sensor System
first round-trip amplified ASE and ASE. For Td in [0, τ /2] or [0, -τ /2], the output signal
comprises the first and second round-trip amplified ASE plus ASE. Subsequently the
optical signal power and OSNR increase rapidly. The changing point for these two curves
is at the probe frequency of about 19.49 kHz and it shifts away from the synchronized
probe frequency by half pulse width. When probe frequency increases, the ASE power
will increase linearly and cause a little skew at the base of the optical power curve shown
in Figure 8.11.
For longer distance, the probe frequency will have to be reduced to keep in sync
with the signal round-trip time, and the frequency step will introduce large Td, thus
introducing a larger effect on the OSNR of the output signal. For example, when the FBG
is located at 50 km, the synchronized frequency is about 2 kHz and a 1-Hz frequency step
would corresponds to Td = 250 ns. From (8.6), we know that if pulse width less than 125
ns is used, then no signal would be detected at any probe frequency. Broader pulse width
would have to be used and consequently, the fiber separation between adjacent FBGs
would increase. As discussed above, synchronization plays an important role in
maintaining high OSNR of the signal. We verified this issue in our experiment and signal
synchronization was achieved by cutting back the fiber and splicing FBGs at the
appropriate position.
8.3.2 Multiplexing Capability
Figure 8.14 shows the measured optical spectra of the return signals that we
deployed one FBG at 60 km and two FBGs at 50 km, respectively. High quality signals
were achieved for both cases with OSNRs better than 20 dB. The longest sensing
144

Chapter 8 Long-distance and Quasi-distributed Fiber Bragg Grating Sensor System
distance depends on the one roundtrip loss of the cavity and the gain of SOA. In our
experiment, good performance of one high reflectivity FBG located at 60 km was
achieved, as shown in Figure 8.14(a). The FBG is with Bragg wavelength centered at
1550.58 nm and reflectivity around 90%. In addition, to investigate the wavelength-
division multiplexing (WDM) of such system, we deploy 2 FBGs close to each other at
the location of 50 km. The Bragg wavelengths of the two FBGs are centered at 1544.56
nm and 1550.58 nm with reflectivities around 98% and 90% respectively. The two return
signals are both with high OSNR better than 25 dB, this renders the capability of our
proposed sysem for applications that multiparameter measurement is needed.
-35
-30
-25
-20
-15
-10
-5
0
1547 1549 1551 1553 1555
Wavelength (nm)
Opt
ical
Pow
er (d
Bm
)
(a) Measured optical spectrum of one FBG at 60 km.
145

Chapter 8 Long-distance and Quasi-distributed Fiber Bragg Grating Sensor System
-35
-30
-25
-20
-15
-10
-5
0
1540 1545 1550 1555
Wavelength (nm)
Opt
ical
Pow
er (d
Bm
)
(b) Measure optical spectrum of two FBGs at 50 km.
Figure 8.14 (a) Measured optical spectrum of one high reflectivity FBG at 60 km. (b)
Measured optical spectrum of two high reflectivity FBGs at 50 km.
To demonstrate the long-distance and quasi-distributed FBG sensor system, we
deploy 8 FBGs along a fiber with a total length of 55.9 km. The lengths of the 8 fiber
loops are 6.3 km, 6.3 km, 6.3 km, 6.3 km, 7.6 km, 7.5 km, 7.75 km and 7.75 km. Thus
the location of the FBGs from the measurement end are 6.3 km, 12.6 km, 18.9 km, 25.2
km, 32.8 km, 40.4 km, 48.15 km and 55.90 km. The Bragg wavelength of the 8 FBGs are
spaced about 0.4 nm from each other and ranged from 1544.4nm to 1547.2nm. These 8
FBGs are arranged from low reflectivity to high reflectivity because of the distances of
their locations increase which lead to increases in propagation loss. The reflectivities of
these FBGs are about 2%, 2.5%, 4.5%, 6.4%, 13%, 26%, 64% and 95%, respectively.
The corresponding probe frequencies are 15.69 kHz, 7.968 kHz, 5.340 kHz, 4.016 kHz,
146

Chapter 8 Long-distance and Quasi-distributed Fiber Bragg Grating Sensor System
3.091 kHz, 2.513 kHz, 2.110 kHz, and 1.819 kHz respectively. The pulse width is 500 ns,
which correspond to about 100-meter fiber distance. This range is much less than the
distances between adjacent FBGs, and it ensures that no optical pulse will overlap more
than 1 FBG. There is a trade-off between sensing signal power and selecting FBG at the
particular location precisely. As shown in Figure 8.15, the OSNR of all 8 FBGs are above
20 dB. The noise level decreases when the FBG sensor is located at longer distances.
Even though the optical powers of the sensing signals are decreasing, the OSNR changes
slightly.
-60
-55
-50
-45
-40
-35
-30
-25
-20
1540 1542 1544 1546 1548 1550
Wavelength (nm)
Opt
ical
Pow
er (d
Bm
)
Figure 8.15 Measured optical spectra of 8 FBGs distributed along 56 km fiber. These
FBGs are spaced about 0.4 nm with adjacent FBGs in wavelength domain.
147

Chapter 8 Long-distance and Quasi-distributed Fiber Bragg Grating Sensor System
In order to investigate the performance of this sensing system for time-division
multiplexing (TDM), we adjust all the 8 FBGs to be at the same wavelength. Figure 8.16
shows that the first 6 FBGs can be detected with higher than 20 dB OSNR. The total loss
of the FBGi signal for one round trip can be given as:
, (8.7) )(10log101(10log2021
0)0 i
i
kkii rrLLossLoss −⎥
⎦
⎤⎢⎣
⎡−−+= ∏
−
=
α
where Loss0 is the loss of the basic part of the ring cavity that includes the SOA, coupler
and circulator, Loss0 is the attenuation coefficient of fiber (including the splicing loss
between FBG and fiber), Li is the distance of FBGi from circulator and ri is the
reflectivity of FBGi. To detect the signal from FBGi, the small-signal gain of SOA, G,
must be larger than Lossi. Considering that Loss0 = 3.0dB, α =0.19dB/km and ri =0, the
calculated loss for the 8 FBGs are 22.38dB, 23.98dB, 24.05dB, 25.31dB, 25.69dB,
26.78dB, 28.43dB and 38.53dB, respectively. For SOA with G = 27dB, only the first 6
FBGs can be detected by this sensor system. Furthermore, for the last two FBGs, the loss
is so high that there is no enough gain to compensate their losses. Figure 8.17 shows that
there is no reflection effect from other FBGs for FBG1 when keeping the Bragg
wavelength of the remaining 7 FBGs at 1546 nm and FBG1 was strain tuned. For this
sensor system, multi-reflection among FBGs is not an issue because the SOA is pulsed
and any reflected light that is not in sync with the SOA will be blocked.
148
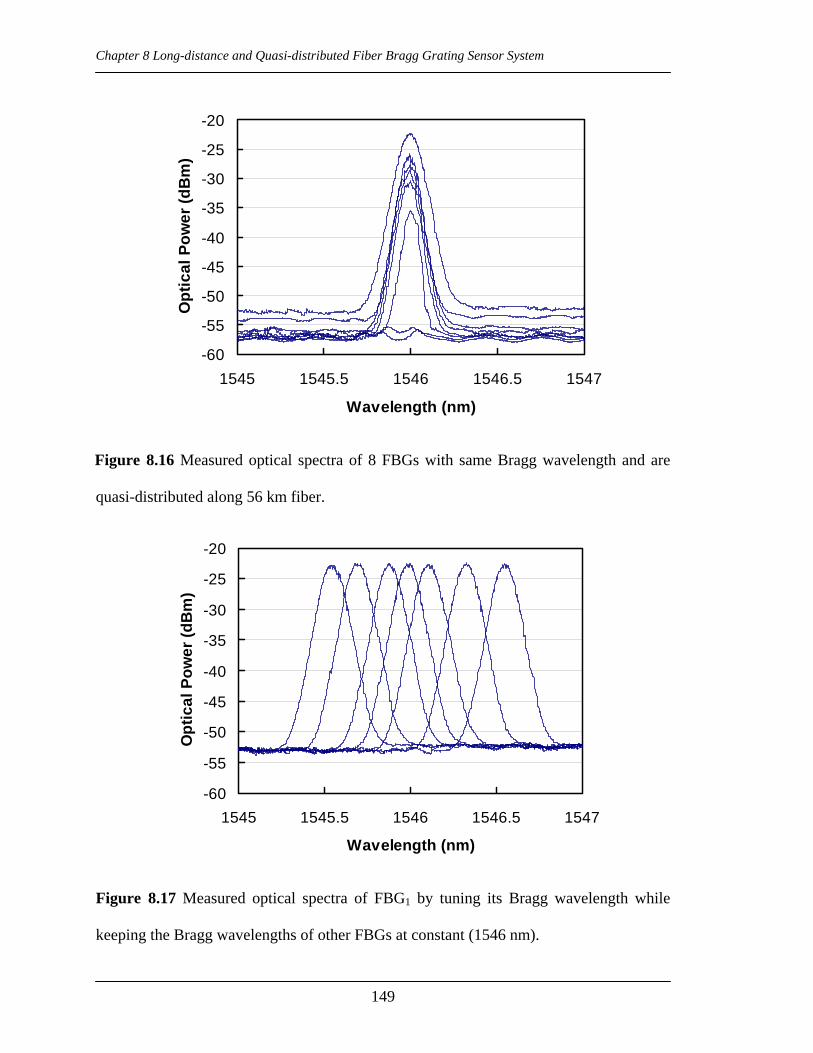
Chapter 8 Long-distance and Quasi-distributed Fiber Bragg Grating Sensor System
-60
-55
-50
-45
-40
-35
-30
-25
-20
1545 1545.5 1546 1546.5 1547
Wavelength (nm)
Opt
ical
Pow
er (d
Bm
)
Figure 8.16 Measured optical spectra of 8 FBGs with same Bragg wavelength and are
quasi-distributed along 56 km fiber.
-60
-55
-50
-45
-40
-35
-30
-25
-20
1545 1545.5 1546 1546.5 1547
Wavelength (nm)
Opt
ical
Pow
er (d
Bm
)
Figure 8.17 Measured optical spectra of FBG1 by tuning its Bragg wavelength while
keeping the Bragg wavelengths of other FBGs at constant (1546 nm).
149

Chapter 8 Long-distance and Quasi-distributed Fiber Bragg Grating Sensor System
8.4 Summary
Two long-distance and quasi-distributed FBG sensor systems were proposed and
studied experimentally. High effective dynamic range of 60 dB was realized for the first
FBG sensor system. By dividing the sensing path into three sections and using three
broadband sources of different wavelength bands, an FBG sensor system with 75 km
sensing path has been demonstrated. The second scheme is based on pulse modulated
SOA ring cavity. By applying TDM, good performance with OSNR better than 20 dB
from 6 FBG sensors along a 40-km optical fiber was achieved. The proposed system
configurations can be employed in electrical industry for railway and power utility
applications extend over a wide network area where large number of FBG sensors
distributed over long distance is required.
150

Chapter 8 Long-distance and Quasi-distributed Fiber Bragg Grating Sensor System
References [1] P. C. Peng, H. Y. Tseng, S. Chi, “Long-Distance FBG Sensor System Using a
Linear-Cavity Fiber Raman Laser Scheme,” IEEE Photonics Technology Letters,
Vol. 16, pp.575-577, (2004).
[2] P. C. Peng, K. M. Feng, W. R. Peng, H. Y. Chiou, C. C. Chang, S. Chi, “Long-
distance fiber grating sensor system using a fiber ring laser with EDWA and SOA,”
Optics Communications, Vol.252, pp.127-131, (2005).
[3] J. H. Lee, J. H. Kim, Y. G. Han, S. H. Kim, and S. B. Lee, “Investigation of Raman
fiber laser temperature probe based on fiber Bragg gratings for long-distance
remote sensing applications,” Optics Express, Vol.12, (2004).
[4] H. L. Liu, W. H. Chung, H. Y. Fu, and H. Y. Tam, “A Novel FBG Sensor
Configuration for Long-distance Measurement,” 18th International Conference on
Optical Fiber Sensors (OFS’18), Cancun, Mexico, (2006).
[5] Y. J. Rao, Z. L. Ran, N. Nie, and R. R. Chen, “Long-distance fiber Bragg grating
sensor system with a high optical signal-to-noise ratio based on a tunable fiber ring
laser configuration,” Optics Letters, Vol.31, pp.2684-2686, (2006).
[6] H. Y. Fu, H. L. Liu, H. Y. Tam, P. K. A. Wai and C. Lu, “Long-distance and quasi-
distributed FBG sensor system using a SOA based ring cavity scheme,” in Proc. Of
Optical Fiber Communication Conference (OFC’2007), OMQ5, California, USA,
(2007).
[7] Y. Nakajima, Y. Shindo, and T. Yoshikawa, “Novel concept as long-distance
transmission FBG sensor system using distributed Raman amplifier,” 16th Conf. on
Optical Fiber Sensors, Th1-4, (2003).
151

Chapter 8 Long-distance and Quasi-distributed Fiber Bragg Grating Sensor System
[8] W. H. Chung, H. Y. Tam, P. K. A. Wai, and A. Khandelwal, “ Time- and
Wavelength-Division Multiplexing of FBG Sensors Using a Semiconductor Optical
Amplifier in Ring Cavity Configuration,” IEEE Photonics Technology Letters, Vol.
17, pp.2709-2711, (2005).
152

Chapter 9 Conclusions and Future Work
Chapter 9
Conclusions and Future Work
9.1 Summary
This thesis reports the results of the studies on a number of new fiber sensor
systems. Polarization-maintaining photonic crystal fibers (PM-PCFs) based sensors
systems are proposed for a torsion sensor, a pressure sensor and a high temperature
sensor. A new scheme has been proposed to realize high speed fiber Bragg grating (FBG)
sensor interrogation systems and two schemes for realizing long-distance sensing have
also been investigated.
A PM-PCF based torsion sensor was proposed based on polarimetric detection.
The sensor provides high sensitivity to torsion and low sensitivity to temperature. The
sensitivity of the proposed torsion sensor is ~ 0.014/ o within a linear twist range from 30o
to 70o. The experimental results are highly repeatable over 90-degree twist in both CW
and CCW directions. Theoretical and experimental results of the proposed torsion sensor
are compared and are in good agreement. Study was carried out to use PM-PCF as a
direct pressure sensing element. A Sagnac interferometer with the PM-PCF as a pressure
sening element was constructed. A high pressure sensitivity and low thermal sensitivity
were realized. Pressure measurement results show a sensing sensitivity of 3.42 nm/MPa
which is achieved by using a 58.4-cm PM-PCF based Sagnac interferometer. The
exceptional low bending loss of the PM-PCF permits the fiber to be coiled into a 5-mm
diameter circle. This makes the pressure sensor very compact. Investigation was carried
out on the high temperature sensing characteristics of a Sagnac interferometer. Its
153

Chapter 9 Conclusions and Future Work
performance was compared with other gratings based temperature sensors. The results
show good promise for PM-PCF based Sagnac interferometer to be used for the high
temperature sensing applications. High temperature measurement from room temperature
to 1160°C was carried out for the PM-PCF based Sagnac interferometer. In particular, its
sensing performance from 400°C to 800°C was investigated. The temperature coefficient
obtained was ~ 11pm/°C with a good linearity within this temperature range.
The multiplexing capability is important for enhancing the performance and
increase the cost effectiveness of an optical sensor system. We proposed three
multiplexing techniques for the Sagnac interferometer. One was realized by separating
Sagnac interferometers using CWDM in the wavelength domain, and corresponding
measurement can be achieved in each channel of the CWDM. The other two schemes
were based on directly connecting several Sagnac interferometers in series along a single
fiber and by using couplers to multiplex the sensors in parallel. Direct measurement is
possible for the CWDM technique which enables easy real-time system implementation,
while post measurement data processing is needed for the other two schemes.
Fiber Bragg gratings (FBGs) have been developed for various kinds of sensing
applications with significant advantages over other fiber optic sensors. For practical
applications, special requirements are required for certain sensor systems. These include
high speed interrogation and interrogation over a long distance. For high speed sensor
interrogation, instead of measuring the Bragg wavelength shift, we measured the time
difference in the time domain by using wavelength-domain to time-domain
transformation based on a dispersion compensating module. High speed interrogation can
be achieved because there is no moving part within the interrogation system and
154

Chapter 9 Conclusions and Future Work
mechanical tuning is not necessary. This enables the benefits of inexpensive high-speed
devices such as modulators and photodetectors to be explored. An effective sampling
speed of 2.44 megasamples per second has been demonstrated experimentally in our
study. Two approaches were adopted for long-distance and quasi-distribution FBG
sensing. By cascading three broadband light sources with different wavelength bands
along a fiber link, a 75-km sensing distance with high effective dynamic range of 60 dB
was achieved. An alternative scheme that uses a pulse modulated SOA ring cavity has
demonstrated 6 FBG sensors along a 40-km optical fiber with OSNR better than 20 dB.
The multiplexing techniques with WDM and TDM were implemented for these two
schemes respectively.
9.2 Conclusions
This thesis investigates one commercially available PM-PCF and shows its
potential in various promising sensing fields. The study is carried out by considering the
novelties and merits it provided such as high birefringence, high pressure sensitivity, low
temperature sensitivity, and low bending loss. Considering these advantages over
conventional fibers, we conducted a systematic investigation and proposed the PM-PCF
for torsion sensing, pressure sensing, and high temperature sensing. Furthermore, the
multiplexing capability of PM-PCF based Sagnac interferometers is also discussed.
Temperature fluctuation is inevitable for most of the fiber optic sensors, and the issue can
be much released by using this low temperature sensitive PM-PCF. The low temperature
sensitivity is because of its pure silica with air holes structure which exhibits a thermal
robustness if compared to the stress applied parts of conventional polarization
155

Chapter 9 Conclusions and Future Work
maintaining fibers and to the fiber gratings. In addition, the novel structure makes the
PM-PCF capable of serving as a direct pressure sensor without the need of a transducer
which is usually employed for fiber gratings based pressure sensor. The thermal decay of
defects in UV-scribed gratings and the fiber core diffusion based on germanium dopant
are the two main factors than prevent their use in long-term measurement at high
temperature. While for PCFs, this is mainly limited by the thermodynamic rearrangement
of the silica structure.
High speed FBG sensor interrogation is attractive in real application. For
conventional interrogation which is based on the wavelength detection, the interrogation
speed is typically limited by the mechanical moving part of wavelength meter.
Wavelength shift can be transformed to time difference based on the dispersion
compensating module. The pulse comprised sensing signals with different wavelengths
can be separated after passing through the module. By utilization of the high speed
photoreceiver and oscilloscope, we can measure the time difference and hence attain high
speed interrogation.
With the increasing industrial application of FBG sensor, long-distance FBG
sensing becomes another interesting research topic. The sensing distance is mainly
limited by the Rayleigh scattering generated when a broadband light source was launched
to illuminate the FBG sensor array. To tackle the Rayleigh scattering issue, several
schemes can be used. One can arrange the topology of the FBG sensor system to avoid
hitting the Rayleigh scattering limit, such as cascading light sources with different power
levels along the fiber link. Also, one can use pulsed light source and/or have
amplification for the FBG sensing signals to extent the distance.
156

Chapter 9 Conclusions and Future Work
9.3 Future work
During the Ph.D. study, some promising directions have been identified and could be
followed up in a future project. In summary, these suggestions in the order of priority are
as follows:
1. Increase the high pressure range.
The pressure sensing range we have investigated is only up to 4 atmospheric pressures.
However, we noticed that PM-PCF can potentially withstand pressure up to 100
atmospheric pressures. Due to limited facility during the study, further investigation was
not carried out. High pressure sensing is in high demand in various industrial applications.
Our proposed pressure sensor is a promising candidate for high pressure applications and
further study on its potential should be useful.
2. Stability of high temperature sensor based on PM-PCF Sagnac interferometer
Study on improving the stability of the high temperature sensor based on PM-PCF
Sagnac interferometer is one attractive research direction. The reason behind irregular
wavelength shift when the temperature is higher than 800°C needs further investigation.
Annealing to improve the stability of the proposed high temperature sensor is another
issue that values further investigation.
3. Improvement on data processing for multiplexed of Sagnac interferometer sensor
systems.
157

Chapter 9 Conclusions and Future Work
The two proposed multiplexing techniques for the Sagnac interferometer by connecting
in series along a single fiber and in parallel with couplers require post measurement data
processing to acquire the sensing information. Further improvements on these two
schemes would be valuable and attractive. Their multiplexing capability can be further
investigated.
4. Improvement on data acquisition and processing for the high speed interrogation
system.
The high speed interrogation system can be further improved to obtain the higher speed
and higher sensing resolution. Curve fitting techniques can be applied to determine the
Bragg wavelength shift to increase the resolution of our proposed interrogation system. In
addition, electronic circuits with high speed digital signal processing (DSP) can be tailor-
made for the interrogation system to realize the high speed signal processing.
5. Increase the sensing distance and enhance the multiplexing capability of the FBG
sensor system.
The sensing distance and multiplexing capability of our proposed long-distance and
quasi-distribted FBG sensor system based a pulse modulated SOA ring cavity is mainly
limited by the gain and saturation power of the amplifier. To improve the scheme, we can
use other amplifiers with higher gain and higher saturation power such as the erbium-
dope fiber amplifier (EDFA) together with optical switches.
158