
The homeless count revealed that Berkeley’s unsheltered ... … · Berkeley 2015 Homeless...
18
Office of the City Manager 2180 Milvia Street, Berkeley, CA 94704 ● Tel: (510) 981-7000 ● TDD: (510) 981-6903 ● Fax: (510) 981-7099 E-Mail: [email protected] Website: http://www.CityofBerkeley.info/Manager INFORMATION CALENDAR January 26, 2016 To: Honorable Mayor and Members of the City Council From: Dee Williams-Ridley, Interim City Manager Submitted by: Kelly Wallace, Acting Director, Health, Housing & Community Services Department Subject: Berkeley 2015 Homeless Point-In-Time Count SUMMARY On January 28, 2015, hundreds of non-profit, City and County staff and volunteers, organized by EveryOne Home, carried out a Point-In-Time count of people who are homeless in Alameda County 1 . An estimated 4,040 people were homeless on that night. Of those, 834 were estimated to be homeless in Berkeley, 266 sheltered people and 568 unsheltered people. The City of Berkeley requested specific data related to the Berkeley homeless population. The last time a Berkeley specific count was conducted was in 2009. This report summarizes the data and provides more detailed data in the attached tables. The homeless count revealed that Berkeley’s unsheltered homeless population grew by 53% from the 2009 count to the 2015 count. The demographics of Berkeley’s homeless population do not seem to have changed dramatically from prior years. Major strides were made in reducing veterans’ homelessness. The numbers of chronically homeless people, people with substance use disorders and people with serious mental illness show a decrease, but this is likely in part due to a change in the survey questions used to elicit this information. CURRENT SITUATION AND ITS EFFECTS Every other year, in response to a mandate by the U.S. Department of Housing and Urban Development (HUD), EveryOne Home mobilizes staff and volunteers to implement a count of homeless people in Alameda County on a given night in late January. In 2014, the City of Berkeley requested that EveryOne Home expand their efforts to enable the 2015 Point-In-Time count to produce specific data for Berkeley’s homeless population. The results of this work are contained in the data tables in Attachment 1. Significant findings from the January 2015 homeless count are: 1 EveryOne Home is the organization coordinating the work of local government and non-profits to end homelessness in Alameda County. See http://www.everyonehome.org/ .
Transcript of The homeless count revealed that Berkeley’s unsheltered ... … · Berkeley 2015 Homeless...
Office of the City Manager
2180 Milvia Street, Berkeley, CA 94704 ● Tel: (510) 981-7000 ● TDD: (510) 981-6903 ● Fax: (510) 981-7099 E-Mail: [email protected] Website: http://www.CityofBerkeley.info/Manager
INFORMATION CALENDAR January 26, 2016
To: Honorable Mayor and Members of the City Council
From: Dee Williams-Ridley, Interim City Manager
Submitted by: Kelly Wallace, Acting Director, Health, Housing & Community Services Department
Subject: Berkeley 2015 Homeless Point-In-Time Count
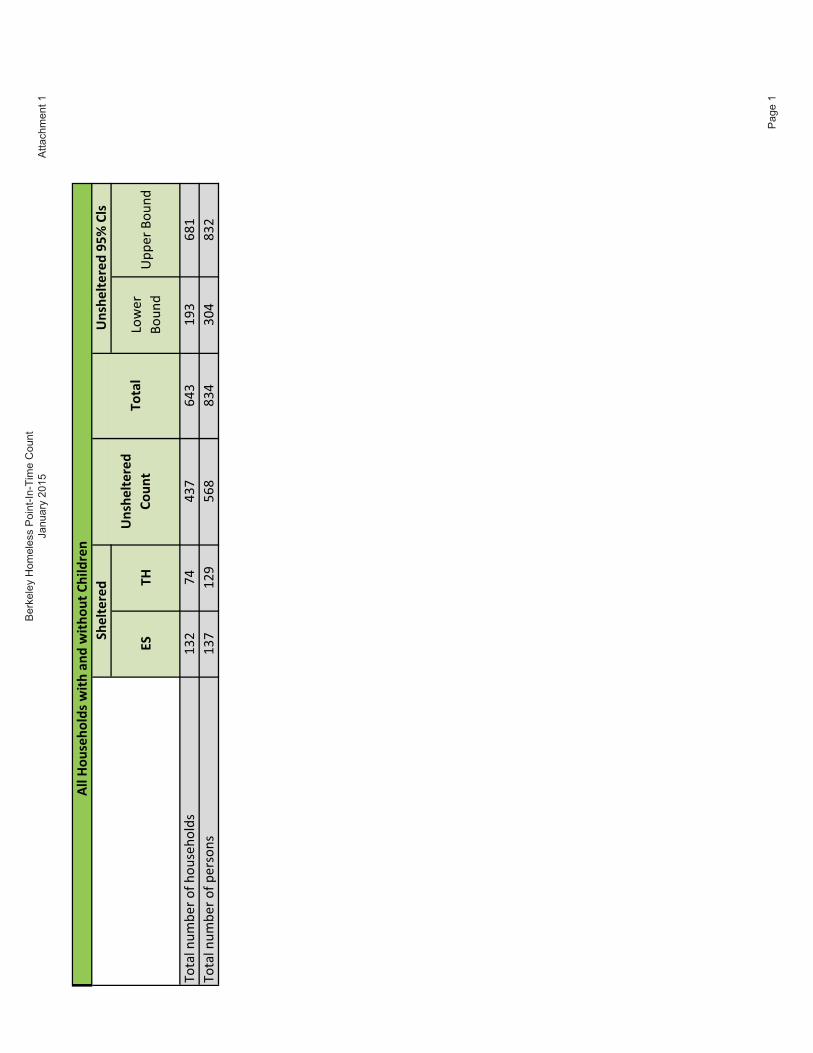
SUMMARY On January 28, 2015, hundreds of non-profit, City and County staff and volunteers, organized by EveryOne Home, carried out a Point-In-Time count of people who are homeless in Alameda County1. An estimated 4,040 people were homeless on that night. Of those, 834 were estimated to be homeless in Berkeley, 266 sheltered people and 568 unsheltered people. The City of Berkeley requested specific data related to the Berkeley homeless population. The last time a Berkeley specific count was conducted was in 2009. This report summarizes the data and provides more detailed data in the attached tables.
The homeless count revealed that Berkeley’s unsheltered homeless population grew by 53% from the 2009 count to the 2015 count. The demographics of Berkeley’s homeless population do not seem to have changed dramatically from prior years. Major strides were made in reducing veterans’ homelessness. The numbers of chronically homeless people, people with substance use disorders and people with serious mental illness show a decrease, but this is likely in part due to a change in the survey questions used to elicit this information.
CURRENT SITUATION AND ITS EFFECTS Every other year, in response to a mandate by the U.S. Department of Housing and Urban Development (HUD), EveryOne Home mobilizes staff and volunteers to implement a count of homeless people in Alameda County on a given night in late January. In 2014, the City of Berkeley requested that EveryOne Home expand their efforts to enable the 2015 Point-In-Time count to produce specific data for Berkeley’s homeless population. The results of this work are contained in the data tables in Attachment 1.
Significant findings from the January 2015 homeless count are:
1 EveryOne Home is the organization coordinating the work of local government and non-profits to end homelessness in Alameda County. See http://www.everyonehome.org/ .
rthomsen
Typewritten Text
21
Berkeley 2015 Homeless Point-In-Time Count INFORMATION CALENDAR January 26, 2016
Page 2
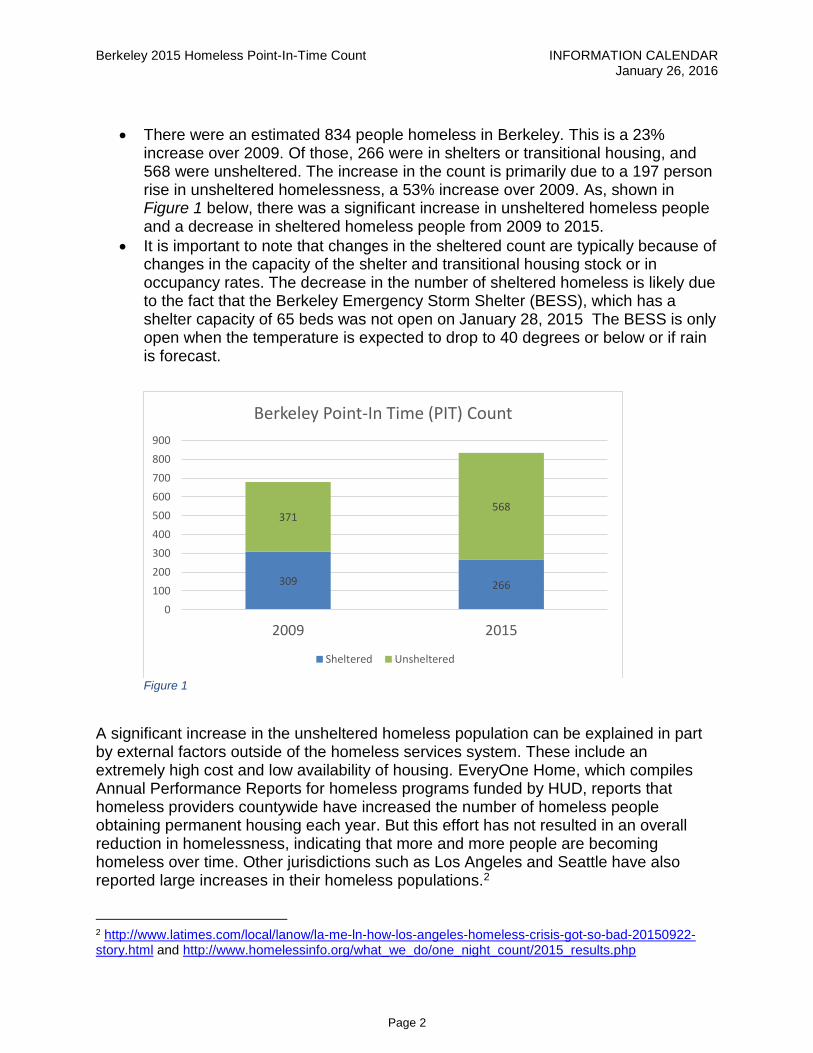
There were an estimated 834 people homeless in Berkeley. This is a 23% increase over 2009. Of those, 266 were in shelters or transitional housing, and 568 were unsheltered. The increase in the count is primarily due to a 197 person rise in unsheltered homelessness, a 53% increase over 2009. As, shown in Figure 1 below, there was a significant increase in unsheltered homeless people and a decrease in sheltered homeless people from 2009 to 2015.
It is important to note that changes in the sheltered count are typically because of changes in the capacity of the shelter and transitional housing stock or in occupancy rates. The decrease in the number of sheltered homeless is likely due to the fact that the Berkeley Emergency Storm Shelter (BESS), which has a shelter capacity of 65 beds was not open on January 28, 2015 The BESS is only open when the temperature is expected to drop to 40 degrees or below or if rain is forecast.
Figure 1
A significant increase in the unsheltered homeless population can be explained in part by external factors outside of the homeless services system. These include an extremely high cost and low availability of housing. EveryOne Home, which compiles Annual Performance Reports for homeless programs funded by HUD, reports that homeless providers countywide have increased the number of homeless people obtaining permanent housing each year. But this effort has not resulted in an overall reduction in homelessness, indicating that more and more people are becoming homeless over time. Other jurisdictions such as Los Angeles and Seattle have also reported large increases in their homeless populations.2
2 http://www.latimes.com/local/lanow/la-me-ln-how-los-angeles-homeless-crisis-got-so-bad-20150922-story.html and http://www.homelessinfo.org/what_we_do/one_night_count/2015_results.php
309 266
371568
0
100
200
300
400
500
600
700
800
900
2009 2015
Berkeley Point-In Time (PIT) Count
Sheltered Unsheltered
Berkeley 2015 Homeless Point-In-Time Count INFORMATION CALENDAR January 26, 2016
Page 3
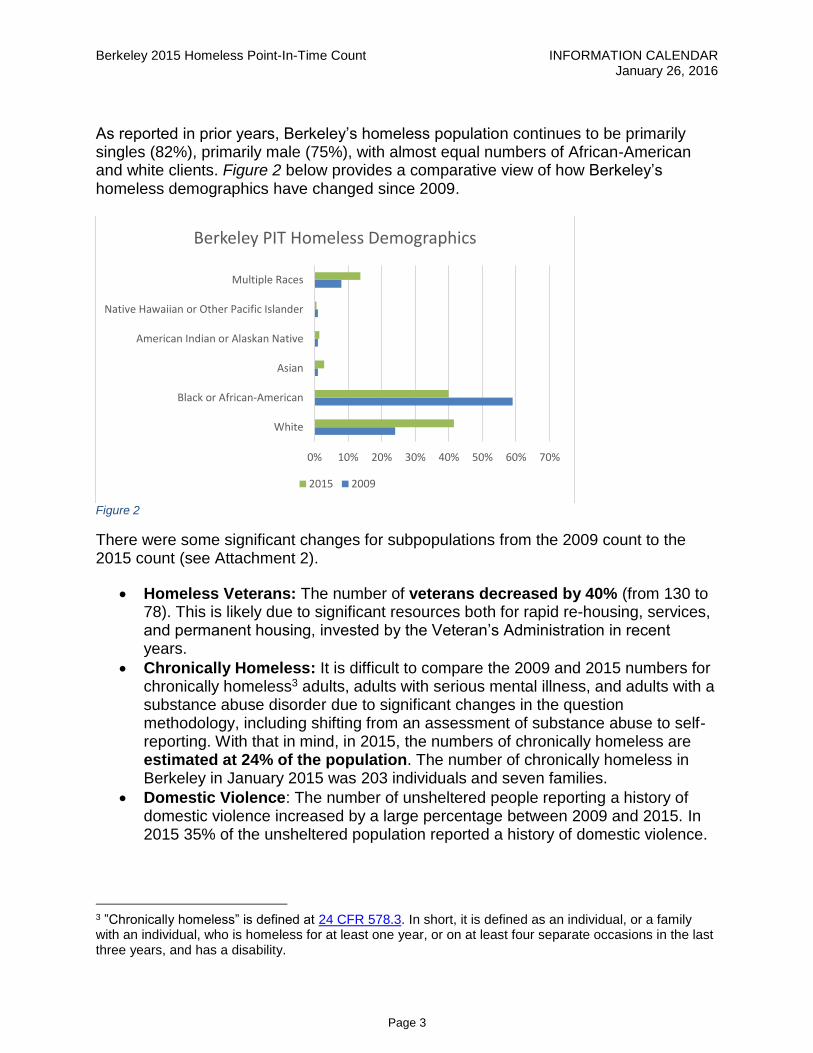
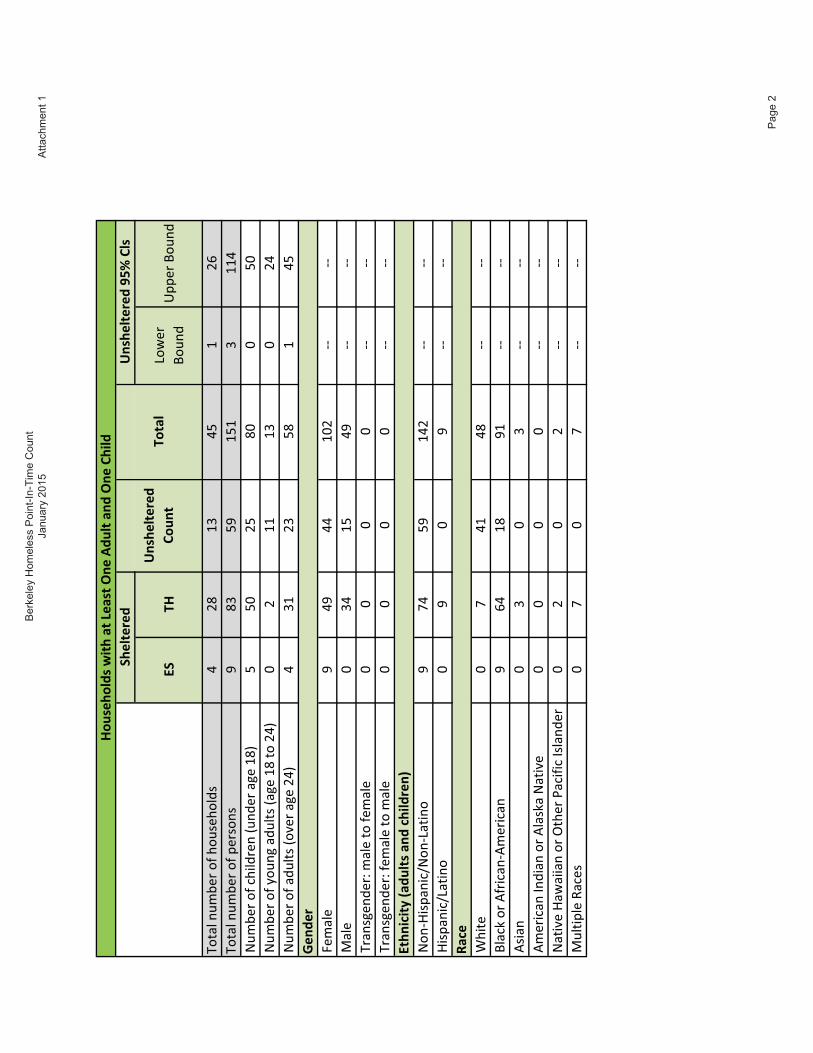
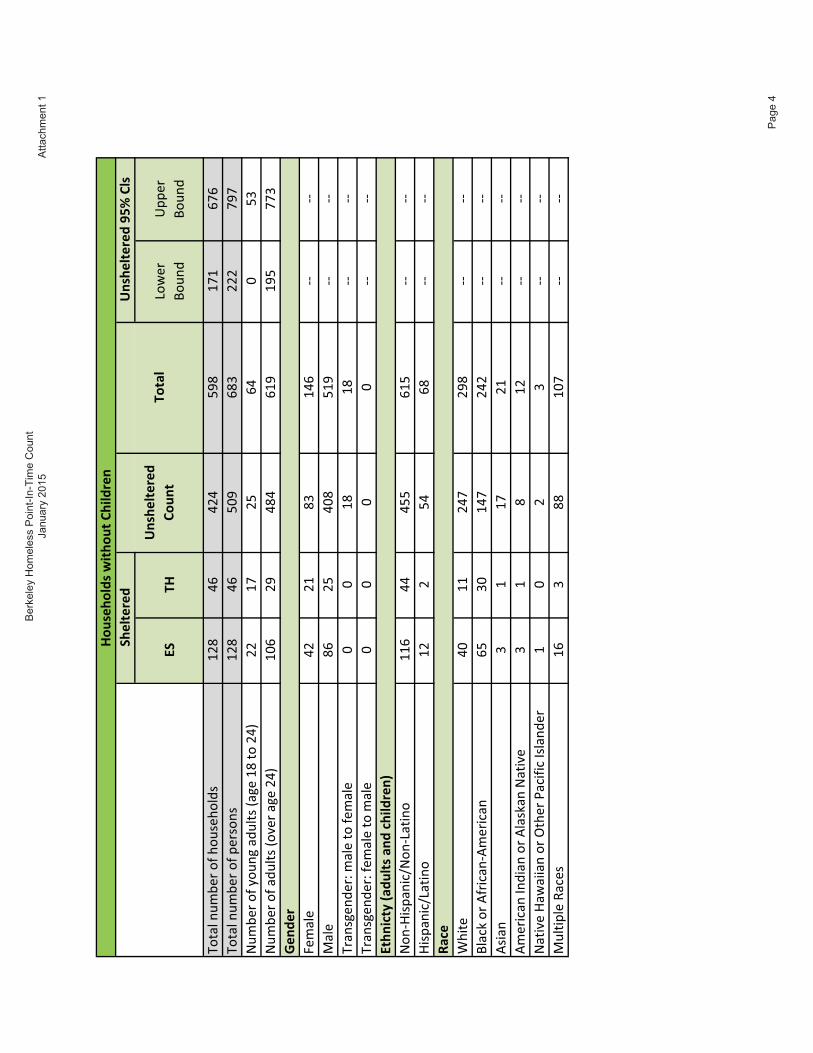
As reported in prior years, Berkeley’s homeless population continues to be primarily singles (82%), primarily male (75%), with almost equal numbers of African-American and white clients. Figure 2 below provides a comparative view of how Berkeley’s homeless demographics have changed since 2009.
Figure 2
There were some significant changes for subpopulations from the 2009 count to the 2015 count (see Attachment 2).
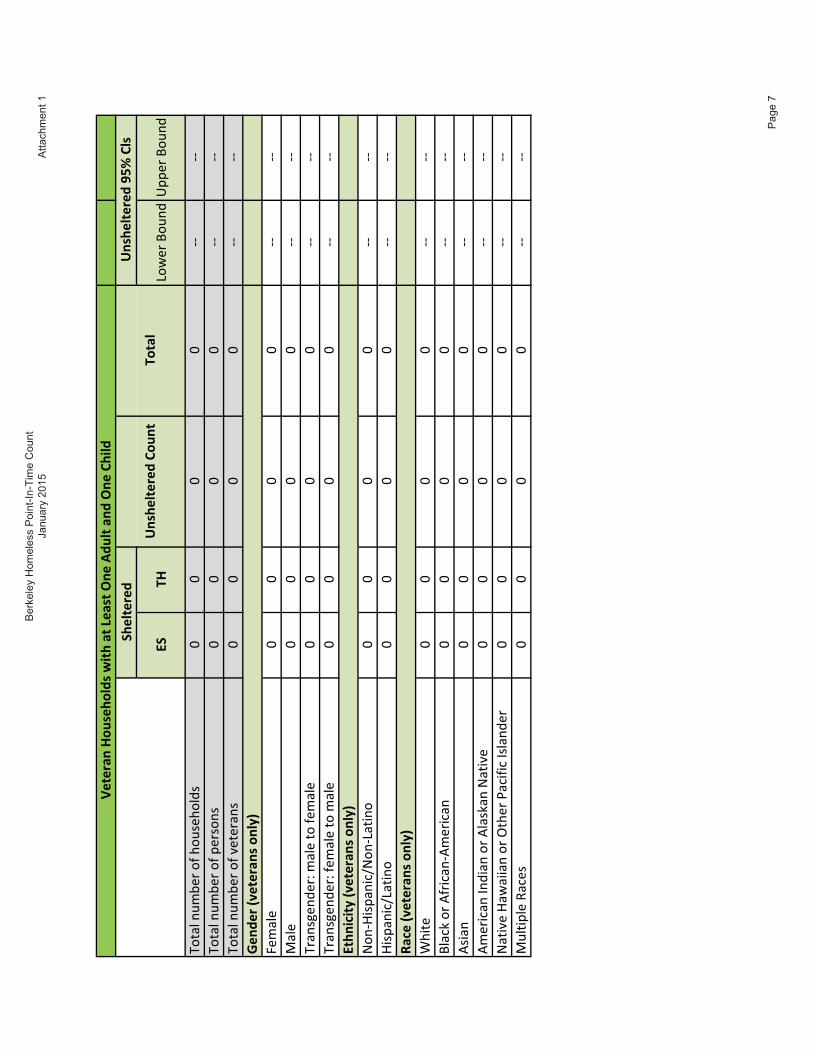
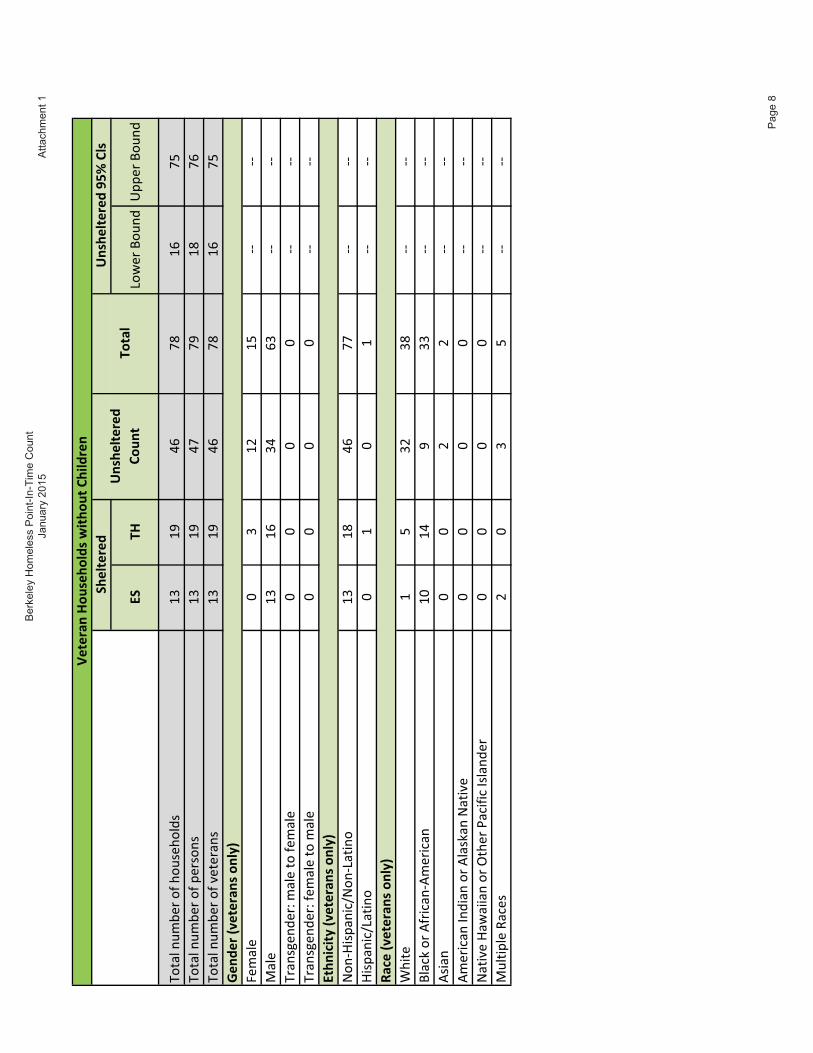
Homeless Veterans: The number of veterans decreased by 40% (from 130 to 78). This is likely due to significant resources both for rapid re-housing, services, and permanent housing, invested by the Veteran’s Administration in recent years.
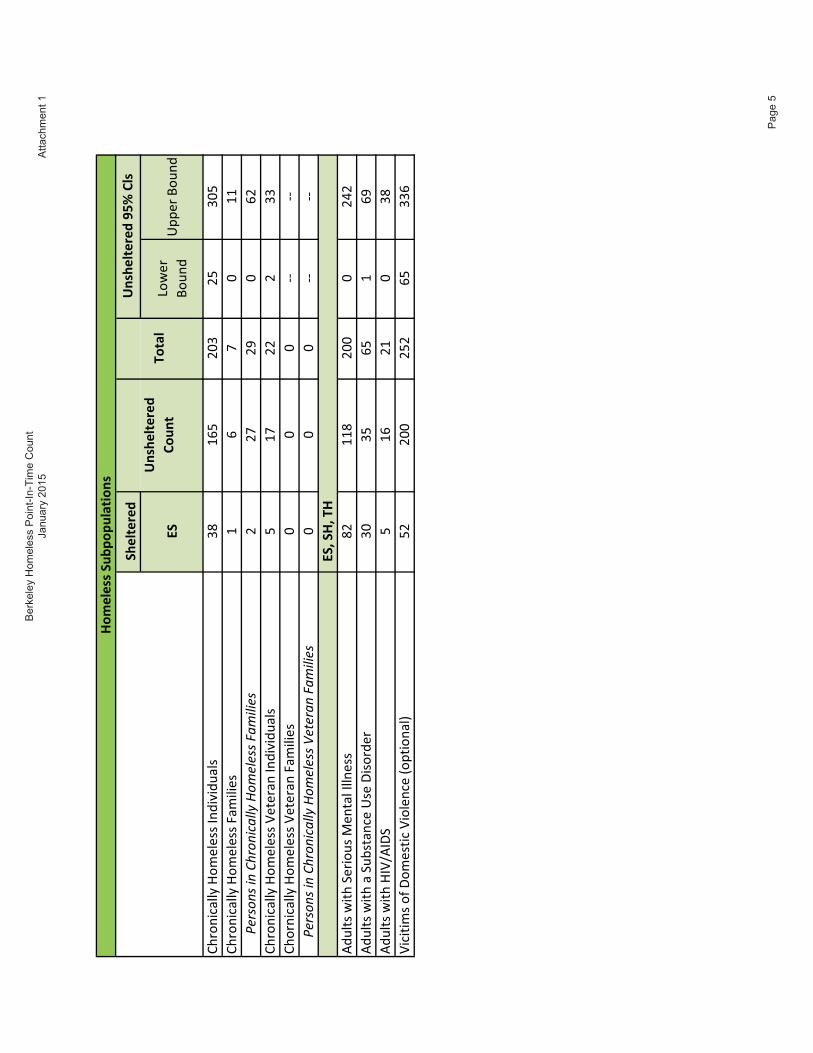
Chronically Homeless: It is difficult to compare the 2009 and 2015 numbers for chronically homeless3 adults, adults with serious mental illness, and adults with a substance abuse disorder due to significant changes in the question methodology, including shifting from an assessment of substance abuse to self-reporting. With that in mind, in 2015, the numbers of chronically homeless are estimated at 24% of the population. The number of chronically homeless in Berkeley in January 2015 was 203 individuals and seven families.
Domestic Violence: The number of unsheltered people reporting a history of domestic violence increased by a large percentage between 2009 and 2015. In 2015 35% of the unsheltered population reported a history of domestic violence.
3 ”Chronically homeless” is defined at 24 CFR 578.3. In short, it is defined as an individual, or a family with an individual, who is homeless for at least one year, or on at least four separate occasions in the last three years, and has a disability.
0% 10% 20% 30% 40% 50% 60% 70%
White
Black or African-American
Asian
American Indian or Alaskan Native
Native Hawaiian or Other Pacific Islander
Multiple Races
Berkeley PIT Homeless Demographics
2015 2009
Berkeley 2015 Homeless Point-In-Time Count INFORMATION CALENDAR January 26, 2016
Page 4
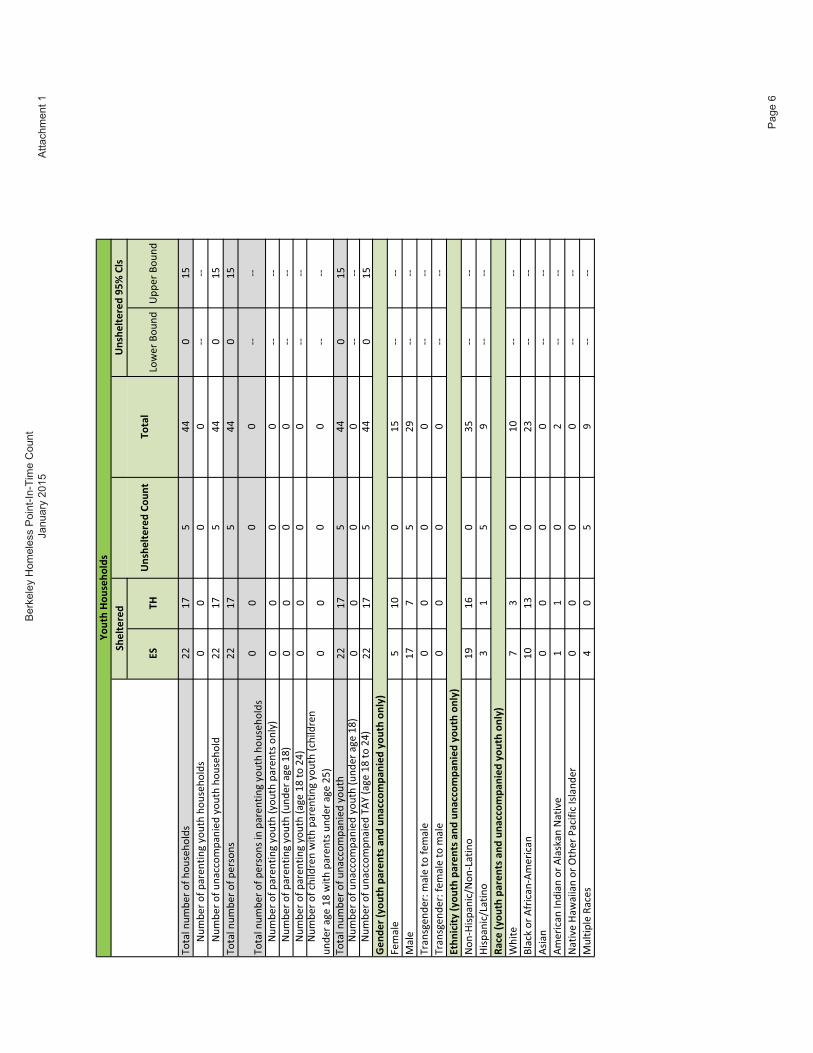
Transition Age Youth: In the 2015 homeless count, there were a total of 77 young adults aged 18-24, also known as TAY. Of the 77 TAY, 41 were in shelter and transitional housing, and 36 were unsheltered.
City Response to Homelessness The City invests approximately $3 million annually in homeless services through community agency contracts. Until recently, City dollars were overwhelmingly invested in emergency services that focused on addressing basic needs, but were not necessarily targeted to getting unsheltered people off the streets of Berkeley and into permanent housing. Prior to July 2015, funding for drop-in centers and emergency shelters accounted for 54% of City investment while 19% went to supportive services not connected to permanent housing. Only approximately 10% of City funding was invested in rapid re-housing and 9% in services linked to permanent housing. Despite ongoing efforts to target services to chronically homeless people, services in Berkeley have not served this population at a level commensurate with their prevalence in the overall Berkeley homeless population. Furthermore, almost one-third of the clients served by homeless agencies have not been literally homeless at time of entry. Data extracted from the county-wide Homeless Management Information System (HMIS) revealed that chronically homeless clients are being underserved: chronically homeless clients represent 46% of the homeless population but they account for only 30% of the people served. Though countywide efforts to focus on producing positive housing outcomes have resulted in improvements, further analysis of HMIS data shows that only a little more than a third (38%) of households served by Berkeley agencies exited to a permanent housing destination. More than half (52%) remained homeless (exited to shelter, transitional housing or the streets) or exited to other temporary housing situations, while another 7% exited to unknown situations. This rate of exit out of homelessness is not high enough to significantly reduce the number of homeless people. Importantly, data suggests that many people exit the homeless service system in the exact same situation they entered. About 21% of people exit to family and friends, either in permanent or temporary situations. This is roughly equivalent to the numbers who enter the system from staying with family and friends. This data suggests that a strategy to assist people who are living with family and friends to remain in their current housing rather than having to enter shelter or even an unsheltered situation in order to receive assistance would be effective. If nearly 20% of clients can be “diverted” from becoming literally homeless by assisting them in preserving their informal housing, resources for literally homeless people would be freed up. Finally, Berkeley homeless services have not been as well coordinated as hoped for, resulting in a frustrating experience for clients and a poor use of limited resources. In response to these issues, City Council approved funding for a new Centralized Entry
Berkeley 2015 Homeless Point-In-Time Count INFORMATION CALENDAR January 26, 2016
Page 5
System (CES), now called “The Hub” and operated by the Berkeley Food and Housing Project, which launched on January 5, 2016. The Hub is designed to serve the unsheltered homeless population in Berkeley more effectively by targeting shelter and housing resources to this population. This kind of system is a Federal requirement for all homeless Continuums of Care (CoC), established by the U.S. Department of Housing and Urban Development (HUD) as part of the 2009 HEARTH Act. Starting in July 2015, City funding has begun to shift towards services that help clients access and keep housing. The Hub, which is the main entry point to homeless housing resources in Berkeley, accounts for 28% of FY 2016 City funding. Supportive case management services aimed at maintaining people in housing is 18%. Funding for drop-in centers and emergency shelters is 25%. Funding for basic needs and other services not connected to housing is 18%. Less than 1% of community agency funding is currently invested in outreach. Funding for the Hub in FY 2016 is only enough for a nine-month period. Therefore additional resources will be needed for the Hub to continue to operate at full capacity in FY 2017. The Hub has two primary goals. The first is to “divert” people who are not actually homeless from entering shelter and other traditional homeless services by assisting them to resolve issues that are causing them to need to leave their current housing situation. The second goal is to assess clients who are actually homeless and offer services matched to their need, prioritizing services for those with the highest need. The Hub acts as the access point into emergency shelter and transitional housing, and provides housing search assistance and other housing supports. Referrals are also made through this front door to other homeless services.
Current Inventory of Homeless Services and Housing
The table below summarizes the resources available by referral through the Hub:
Type of Service Agency/Program Total Slots
Shelter Beds TOTAL 135
Berkeley Food and Housing Project (BFHP) Men’s Shelter 36
BFHP Women’s Shelter 32
Building Opportunities for Self-Sufficiency (BOSS) – Ursula Sherman Village Singles Shelter
50
Youth Engagement Advocacy Housing (YEAH) Winter Shelter 17
Transitional Housing Beds
TOTAL 77
Fred Finch Turning Point 18
BFHP Men’s Veterans Program 12
BFHP Women’s Transitional House 34
BOSS Sankofa House 4
BOSS Family Transitional Shelter 5
Women’s Daytime Drop-In Center (WDDC) Bridget House 4
Berkeley 2015 Homeless Point-In-Time Count INFORMATION CALENDAR January 26, 2016
Page 6
Other services accessible to the public not referred through the Hub are:
Dorothy Day House Berkeley Emergency Storm Shelter (operational on rainy nights or nights where the temperature is below 40 degrees)
Dorothy Day House Breakfast program
BFHP Quartermeal Dinner
WDDC Lunch Program Berkeley’s Count in Context
The County-wide homeless count undertaken in January 2015 estimated that there were 4,040 people who were homeless in Alameda County. This is essentially unchanged from the 2013 count, and down slightly from 4,341 in 2009.
Berkeley’s percentage of the homeless population county-wide has grown from 16% in 2009 to 21% in 2015. The county-wide unsheltered population has grown by 22%
Case Management Tied to Permanent Housing
TOTAL 195
BFHP 50
BOSS 41
WDDC 28
YEAH 17
Bonita House 18
Berkeley Drop-In Center (BDIC) 11
Lifelong Medical Care 30
Alcohol and Other Drug Treatment
Options Daytime Treatment 63
Options Dual Diagnosis Clinic 60
Options Transitional Housing 1,825 bednights
New Bridge Residential Treatment 714 bednights
Other Services WDDC Domestic Violence Program 65
Rubicon Employment Program 80
BDIC Representative Payee 58
BOSS Representative Payee 95
Alameda County Homeless Action Center Benefits Advocacy 80
Countywide Sheltered Count Unsheltered
Estimate Total
January 2009 2,378 1,963 4,341
January 2015 1,643 2,394 4,040
% Change -31% 22% -7%
Berkeley 2015 Homeless Point-In-Time Count INFORMATION CALENDAR January 26, 2016
Page 7
over the past six years, compared to Berkeley’s 53% increase. Oakland experienced a 45% increase in unsheltered homeless from 2009 to 2015.4
BACKGROUND Once every two years EveryOne Home estimates the number of people within the county who are homeless on a given evening. This effort, known as the Homeless Point-in-Time Count (Count), is congressionally mandated for all communities that receive U.S. Department of Housing and Urban Development (HUD) funding for homeless programs. HUD’s requirement includes a count or scientifically-derived estimate of both sheltered and unsheltered homeless people, as well as the frequency of certain subpopulation characteristics among the homeless population. HUD requires that the Count be conducted during the last ten days in January.
The sheltered portion of the Count (persons residing in shelters and transitional housing within the county) is primarily extracted from data in the County’s Homeless Management Information System, called InHOUSE and operated by the Alameda County Department of Housing and Community Development. InHOUSE includes data on persons who occupied a shelter or transitional housing bed on the night of the count. Any shelter or transitional housing program that does not participate in InHOUSE is independently surveyed for the count of people and the characteristics of those people on the night of the Count.
The Alameda County unsheltered homeless Count uses a site-based survey methodology. Unsheltered homeless persons were those receiving services who self-reported having slept in any of the following places the night before: the streets, a vehicle, an abandoned building, bus/train/BART station/airport, anywhere outside, or other place not meant for human habitation, a garage, backyard, shed, or driveway. Whereas the sheltered Count consists of the actual numbers of persons and households staying at shelters and transitional housing programs and their characteristics, the numbers of persons and households who are unsheltered on the survey night are estimated. The estimated Count of unsheltered homeless persons and households is completed using a survey conducted at four kinds of non-residential program sites serving housed and homeless low-income people including meal service sites, food pantries, drop-in centers, and outreach programs.
The fieldwork done in Berkeley included volunteers from City staff, an elected leader, non-profit agencies, residents, formerly homeless residents, young adults and other citizens. The EveryOne Home Count is not always able to include city-specific data since the resources required, including volunteers and staffing, to produce a statistically significant data sample are not always available. The last year that data specific to Berkeley was able to be produced was in 2009. The statistically supported data is provided in the attached tables in a format prescribed by the U.S. Department of
4 http://www.contracostatimes.com/breaking-news/ci_29166600/oaklands-homeless-seeking-shelter-kindness-housing-crisis-pushes
Berkeley 2015 Homeless Point-In-Time Count INFORMATION CALENDAR January 26, 2016
Page 8
Housing and Urban Development. The methodology is described in full in the report provided for the 2013 County-wide Homeless Count. 5
ENVIRONMENTAL SUSTAINABILITY There are no identifiable environmental effects or opportunities associated with the subject of this report.
POSSIBLE FUTURE ACTION The significant increase in the unsheltered homeless population in Berkeley is troubling. City staff will return to Council later in the Spring of 2016 to make recommendations regarding homeless funding for FY 2017. This will include a recommendation to fully fund Berkeley’s Coordinated Entry System in FY 2017. Council approved only partial funding in FY2016 because it was not expected to be operational until January 2016. Staff will also recommend funding for additional outreach to ensure that the unsheltered street population is being proactively engaged in housing navigation services and other referrals available at the CES
FISCAL IMPACTS OF POSSIBLE FUTURE ACTION Unknown at this time. Additional information on projected costs will be included in the FY 2016 mid-year budget update.
CONTACT PERSON Kristen Lee, Manager, Housing & Community Services Division, HHCS, 981-5427
Attachments: 1: Data Tables from the January 2015 Point-In-Time Count 2: Berkeley Point-In-Time Count Comparison, 2009 and 2015
5 http://www.everyonehome.org/media/resources_homeless-count13.pdf
����
������
��
��
�����
�
���
�����
���
���
���
���
���
������� �����
�� �������� ��� ������
� �������
��� ��������
���
����
��� ���������������
�������
�����
�� �����
���
���
�������
�����
�� �
�� �
���
���
���
Ber
kele
y H
omel
ess
Poi
nt-In
-Tim
e C
ount
Jan
uary
201
5A
ttach
men
t 1
Pag
e 1
����
������
���
� �����
�
���
���
���
����
!�
�����
��" #�����$�����%����&
���
���
!�
�����
��'�
%�������$�%����������&
��
���
!�
�����
��������$�
(����
%����&
���
���
)�����
���
****
+���
���
****
����%����,���������������
��
****
����%����,���������������
��
****
!�
*-#�
�#".!�
*���#�
���
****
-#� �#".���#�
��
****
/ #��
��
****
���"0����1��#"�*1���#"�
���
****
1�#�
��
****
1���#"��2�#�����1
���0��!��#(�
��
****
!��#(��-�
��##�����3� ���4�"#�#"�2������
��
****
+��#
���5�"��
��
****
� �����
�� �
���
�����
���
��
�� ������������������� �������
�����
��
��� ������� ���������� ������������ ���� ��� �� ���
!������
����
���
���
�������
�����
�� �����
��� ���������������
�������
�����
�� �
�� �
���
����
� �������
����
��� ��������
���
����
������
���
Ber
kele
y H
omel
ess
Poi
nt-In
-Tim
e C
ount
Jan
uary
201
5A
ttach
men
t 1
Pag
e 2
����
�������
�����
�� �
�� �
���
��
�������
�����
��" #�����$�����%����&
��
)�����
��
+���
��
����%����,���������������
��
����%����,���������������
��
!�
*-#�
�#".!�
*���#�
��
-#� �#".���#�
��
/ #��
��
���"0����1��#"�*1���#"�
��
1�#�
��
1���#"��2�#�����1
���0��!��#(�
��
!��#(��-�
��##�����3� ���4�"#�#"�2������
��
+��#
���5�"��
��
��
��
���
���
� �
��
����
��� ������������������� �������
��
�
��
�
!�����
��
��
�� �
��� ������� ������ ��������������"��#$�
� �������
����
��� ��������
���
Ber
kele
y H
omel
ess
Poi
nt-In
-Tim
e C
ount
Jan
uary
201
5A
ttach
men
t 1
Pag
e 3
����
������
���
� ���
���
�������
�����
�� �
�� �
����
���
�����
���
�������
�����
�� �����
���
�����
���
!�
�����
��'�
%�������$�%����������&
����
���
!�
�����
��������$�
(����
%����&
���
�����
���
)�����
����
****
+���
����
****
����%����,���������������
��
****
����%����,���������������
��
****
!�
*-#�
�#".!�
*���#�
���
��**
**-#� �#".���#�
���
****
/ #��
����
****
���"0����1��#"�*1���#"�
����
****
1�#�
��
****
1���#"��2�#�����1
���0��!��#(�
��
****
!��#(��-�
��##�����3� ���4�"#�#"�2������
��
****
+��#
���5�"��
���
****
���
��
���
����
�����
���
���
���
����
����
��� ������������������ �������
����
���
����
���
!�����
�����
��� ������� ��� �������
��� ���������������
���
���
� �������
����
���
��� ��������
���
�����
���
��
���
���
Ber
kele
y H
omel
ess
Poi
nt-In
-Tim
e C
ount
Jan
uary
201
5A
ttach
men
t 1
Pag
e 4
� �������
��������
���
� �����
�
�����
�����
��
���
���
���
���
���
��
****
��
****
��%���%���
�����
����
����
���
���
���
�����
�����
�&�������'((������
6 ��#"���'�-��
������2�#(#����
���
��� ���������������
��� ��������
���
����
�� �� ���
1������#�
���7����"������8#��
����
1������#�
�-29.1287
9#"#�#�
�����8
�����#"�9#���"��$� �#���&
1������#�
�7��#���+
�����2�����
���
6 ��#"���'�-��
������)
��#�#��
�������������
�����
���� �������
�������
����
��6
��#"���'�-��
������9
������2�#(#����
��6
��#"���'�-��
������9
������)��
#�#��
�������������������
� �������
�������
���� �
�� �
���
��
Ber
kele
y H
omel
ess
Poi
nt-In
-Tim
e C
ount
Jan
uary
201
5A
ttach
men
t 1
Pag
e 5
����
��������
�� �����
�
����
���
��
****
����
���
����
���
��
****
��
****
��
****
��
****
��
****
����
���
��
****
����
���
���
****
���
****
��
****
��
****
����
****
��
****
��
****
����
****
��
****
��
****
��
****
��
****
)� ���� ���
� �������
��� �����������
����
��� ���������������
�������
�����
�� �
�� �
���
���
�����!
������
�� ����#
%�'�� � �
�� ����
��
�������
�����
�� ������#� ����#
%�'�� � �
�� ����
��
�����!
������
���""��
�#���'�
� � �
�� �
���
���������
�����
�� �����
���
��
��
��
�������
�����
���""��
�#���'�
� �
���
��
���
!��������� �(���������������&(�������� �����
)�����
���
+���
���
����%����,���������������
��
����%����,���������������
��
�� ���������� �(���������������&(�������� �����
!�
*-#�
�#".!�
*���#�
���
-#� �#".���#�
��
�������� �(���������������&(�������� �����
/ #��
��� �
���"0����1��#"�*1���#"�
���
1�#�
��
+��#
���5�"��
���
������!
������
�� ����#
%�'�� �$'�
� � ��������'&
�����!
������
�� ����#
%�'�� �$�����%����&
�����!
������
�� ����#
%�'�� �$�%����������&
�����!
������
��" #������#�
� ����#
%�'�� �$" #�����
�����
%������#�
� �����������%����&
�����!
������
���""��
�#���'�
� �$
�����%����&
�����!
������
���""��
�#����1:
�$�%����������&
1���#"��2�#�����1
���0��!��#(�
��
!��#(��-�
��##�����3� ���4�"#�#"�2������
�
Ber
kele
y H
omel
ess
Poi
nt-In
-Tim
e C
ount
Jan
uary
201
5A
ttach
men
t 1
Pag
e 6
����
��������
�� �����
�
��
****
��
****
��
****
��
****
��
****
��
****
��
****
��
****
��
****
��
****
��
****
��
****
��
****
��
****
��
****
*���������� ������� ���������� ������������ ���� ���
� �������
����
�������
�����
�� �
�� �
���
��
��� �����������
�!�������+������������
��
�)�����
+���
��
������+������������
��
��
��
��
��
1�#�
1���#"��2�#�����1
���0��!��#(�
!��#(��-�
��##�����3� ���4�"#�#"�2������
��� ���������������
��
��
�� ��������+������������
���
��
�������
�����
�� �����
��
�������
�����
��(������
�
+��#
���5�"��
-#� �#".���#�
����%����,���������������
����%����,���������������
!�
*-#�
�#".!�
*���#�
/ #��
���"0����1��#"�*1���#"�
Ber
kele
y H
omel
ess
Poi
nt-In
-Tim
e C
ount
Jan
uary
201
5A
ttach
men
t 1
Pag
e 7
����
��������
�� �����
�
����
����
����
����
����
����
��
****
����
****
��
****
��
****
����
****
��
****
��
****
����
****
��
****
��
****
��
****
��
****
����
� �������
��� ��������
���
����
��
��
�� ��������+������������
�������
�����
�� �����
����
�������
�����
��(������
����
!�������+������������
����
����
)�����
*���������� ������� ��� ������
����%����,���������������
!�
*-#�
�#".!�
*���#�
-#� �#".���#�
/ #��
��� ���������������
��
����%����,���������������
������+������������
��
�� � ��
+���
�������
�����
�� �
�� �
���
� �
�� �
+��#
���5�"��
���"0����1��#"�*1���#"�
� � ��
��
1�#�
1���#"��2�#�����1
���0��!��#(�
!��#(��-�
��##�����3� ���4�"#�#"�2������
�
Ber
kele
y H
omel
ess
Poi
nt-In
-Tim
e C
ount
Jan
uary
201
5A
ttach
men
t 1
Pag
e 8

City
of B
erke
ley
Ever
yOne
Cou
nts 2
015
City
of B
erke
ley
Tota
l20
0920
15%
cha
nge
2009
2015
% c
hang
e20
0920
15%
cha
nge
HH w
ith a
t lea
st O
ne A
dult
and
One
Chi
ldN
umbe
r of H
H43
455
3232
011
1318
Num
ber o
f Per
sons
131
151
1596
92-4
3559
69Pe
rson
s <
1882
80-2
6055
-822
2514
Pers
ons 1
8-24
132
11Pe
rson
s 25+
5835
23Al
l Per
sons
18+
4971
4536
373
1334
162
HH w
ithou
t Chi
ldre
n (A
dult
Onl
y)N
umbe
r of H
H52
659
814
212
174
-18
314
424
35N
umbe
r of P
erso
ns54
968
324
213
174
-18
336
509
51Pe
rson
s 18-
2464
3925
Pers
ons 2
5+61
913
548
4
Tota
l HH
Num
ber o
f HH
569
643
1324
420
6-1
632
543
734
Num
ber o
f Per
sons
680
834
2330
926
6-1
437
156
853
Subp
opul
atio
ns*
Vete
rans
130
78-4
038
32-1
692
46-5
0Ad
ults
with
HIV
/AID
S14
2148
95
-42
616
188
DV13
925
281
7852
-33
6120
022
9
Subp
opul
atio
ns w
ith n
ew b
asel
ine
data
in 2
015*
*Ch
roni
cally
Hom
eles
s Ind
ivid
uals
306
203
8338
223
165
Adul
ts w
ith S
erio
us M
I*27
720
011
982
158
118
Adul
ts w
ith S
ubst
ance
Use
Diso
rder
*26
765
8930
178
35Ch
roni
cally
Hom
eles
s Fam
ilies
N/A
7N
/A1
N/A
6Pe
rson
s in
Chro
nica
lly H
omel
ess F
amili
esN
/A29
N/A
2N
/A27
* Su
bpop
ulat
ion
data
by
regi
on in
200
9 w
ere
repo
rted
by
wei
ghte
d pe
rcen
tage
of t
he p
opul
atio
n, n
ot N
. Val
ues i
n 20
09 (p
rese
nted
abo
ve) a
re im
pute
d fr
om th
e re
port
ed p
erce
ntag
e of
the
popu
latio
n.**
201
5 re
pres
ents
new
bas
elin
e da
ta a
nd a
re n
ot c
ompa
rabl
e to
200
9 du
e to
new
def
initi
ons o
f the
trai
t, a
sust
antia
l cha
nge
in q
uest
ion
stru
ctur
e to
, or a
new
dat
a fie
ld th
at d
idn'
t exi
st in
200
9.
Shel
tere
d Co
unt
Uns
helte
red
Estim
ates
Atta
chm
ent 2
B
erke
ley
Poi
nt-In
-Tim
e C
ount
Com
paris
on, 2
009
and
2015