The History of Resource Mobilization and Social Spending ...httpAuxPages... · The History of...
40
Working Paper 2014–6 The History of Resource Mobilization and Social Spending in Uganda Marianne S. Ulriksen and Mesharch W. Katusiimeh prepared for the UNRISD project on Politics of Domestic Resource Mobilization March 2014 UNRISD Working Papers are posted online to stimulate discussion and critical comment.
Transcript of The History of Resource Mobilization and Social Spending ...httpAuxPages... · The History of...

Working Paper 2014–6
The History of Resource Mobilization and Social Spending in Uganda Marianne S. Ulriksen and Mesharch W. Katusiimeh prepared for the UNRISD project on Politics of Domestic Resource Mobilization March 2014
UNRISD Working Papers are posted online to stimulate discussion and critical comment.
The United Nations Research Institute for Social Development (UNRISD) is an autonomous research institute within the UN system that undertakes multidisciplinary research and policy analysis on the social dimensions of contemporary development issues. Through our work we aim to ensure that social equity, inclusion and justice are central to development thinking, policy and practice.
UNRISD, Palais des Nations 1211 Geneva 10, Switzerland
Tel: +41 (0)22 9173020 Fax: +41 (0)22 9170650
[email protected] www.unrisd.org
Copyright © United Nations Research Institute for Social Development This is not a formal UNRISD publication. The responsibility for opinions expressed in signed studies rests solely with their author(s), and availability on the UNRISD Web site (www.unrisd.org) does not constitute an endorsement by UNRISD of the opinions expressed in them. No publication or distribution of these papers is permitted without the prior authorization of the author(s), except for personal use.

Introduction to Working Papers on The Politics of Domestic Resource Mobilization for Social Development This paper is part of a series of outputs from the research project on The Politics of Domestic Resource Mobilization for Social Development. The project seeks to contribute to global debates on the political and institutional contexts that enable poor countries to mobilize domestic resources for social development. It examines the processes and mechanisms that connect the politics of resource mobilization and demands for social provision; changes in state-citizen and donor-recipient relations associated with resource mobilization and allocation; and governance reforms that can lead to improved and sustainable revenue yields and services. For further information on the project visit www.unrisd.org/pdrm. This project is funded by SIDA and UNRISD core funds. Series Editors: Katja Hujo and Harald Braumann
Working Papers on The Politics of Domestic Resource Mobilization for Social Development The History of Resource Mobilization and Social Spending in Uganda Marianne S. Ulriksen and Mesharch W. Katusiimeh, March 2014. Extractive Industries, Revenue Allocation and Local Politics. Javier Arellano and Andrés Mejía Acosta. March 2014. Obstacles to Increasing Tax Revenues in Low-Income Countries. Mick Moore, November 2013. UNRISD-ICTD Working Paper No. 15 UNRISD, International Centre for Tax and Development.


v
Contents List of figures and tables .............................................................................................................................. vi Abstract ........................................................................................................................................................ vii List of acronyms .......................................................................................................................................... viii Introduction.................................................................................................................................................... 1 The Background: Political and Economic Developments in Uganda Since Independence .......................... 1
The early years: from independence to crisis ........................................................................................... 1 The first independent Government, 1962–1971 ................................................................................... 1 The period of political instability, 1971–1985 ....................................................................................... 2
The NRM Government and the period of recovery, 1986–1996 .............................................................. 3 The NRM Government, economic growth and poverty reduction, 1996-2006 ......................................... 4 Political fragmentation, changing priorities, 2006 - present ...................................................................... 5
Resource Mobilization and Reforms ............................................................................................................. 6 Negligible domestic resource mobilization, the early years 1962–1985................................................... 6 The era of reconstruction 1986–1996 ....................................................................................................... 7 Stagnated revenue generation and donor budget support 1996–2006 ................................................... 9 Piecemeal tax reforms and changing financing regimes 2006 –present ................................................ 10 Summary: Revenue mobilization in Uganda .......................................................................................... 13
Social Policy Development in Uganda ........................................................................................................ 13 Early developments, stagnation and cost recovery, 1962–1996 ............................................................ 13
Education ............................................................................................................................................ 14 Health ................................................................................................................................................. 14 Social protection ................................................................................................................................. 15
Poverty eradication programmes and social service expansion, 1996–2006 ....................................... 15 Education: Implementation of Universal Primary Education (UPE) ................................................... 16 Health: Primary healthcare reform ..................................................................................................... 17 Social protection: a neglected area .................................................................................................... 18
Changing priorities and stagnated social development? 2006–present ................................................ 18 Education ............................................................................................................................................ 19 Health ................................................................................................................................................. 20 Social protection ................................................................................................................................. 20
Public spending and social development outcomes ............................................................................... 21 Summary: Social policy development in Uganda ................................................................................... 24
Conclusion................................................................................................................................................... 24 Appendix A: Tax proposals ......................................................................................................................... 27 References .................................................................................................................................................. 28

vi
List of figures and tables Table 3.1: Domestic revenue and grants 1989/90–1995/96 ......................................................................... 7 Table 3.2: Sources of domestic revenue (total recurrent revenue performance), 1985-1996 ...................... 8 Table 3.3: Major tax reforms, 1986–1996 ..................................................................................................... 8 Table 3.4: Sources of tax revenue, as a percentage of total revenue, 1996/97 to 2005/06 ......................... 9 Table 3.5: Major tax reforms, 1996–2006 ..................................................................................................... 9 Table 3.6: Domestic revenue and grants, in actual and in per cent............................................................ 11 Table 3.7: Government revenue as a percentage of GDP ......................................................................... 12 Table 3.8: Major tax reforms, 2006–2010 ................................................................................................... 12 Table 4.1: Sectoral composition of government expenditure (excluding project aid), 1994–2004 ............. 16 Table 4.2: Consolidated expenditures for selected sectors, excluding donor projects, in percentage of total government budget, 2008–2013 ......................................................................................................... 19 Table 4.3: Indicators on social development spending and outcomes ....................................................... 22 Table 4.4: Always going without basic necessities, in a year ..................................................................... 23 Table 4.5: Going without basic necessities, several or many times in a year ............................................ 23 Figure 4.1: Lived poverty index in Uganda 2002-2012 ............................................................................... 24

vii
Abstract This paper is the first of a series of papers exploring the political and institutional contexts of resource mobilization and social spending for social development in Uganda. We provide the historical context of, and trends in, resource mobilization (domestic and external revenue) and social spending in post-independence Uganda. After years of civil war, mismanagement and general decline, Uganda turned a page in 1986 when NRM (National Resistance Movement) came to power. During the 1990s and early 2000s, Uganda was a prototypical donor-dependent country with aid constituting more than half of government revenue. During this period, the government, in partnership with donors, focused spending on targeted pro-poor development programmes, including primary education and basic health care. While priority of these social sectors has led to some improvements in social development outcomes, the quality of education and health care is still disappointing and social protection programmes remain neglected. Moreover, domestic resource mobilization has not improved considerably which points to issues of weak institutional capacity as well as the contested nature of taxation. Trends in recent years show an increasingly strained relationship between the government and its traditional donors, piecemeal and ad hoc tax reforms, promise of increasing revenue from oil, and a move in policy priorities away from human capital development to spending on infrastructure and expansion of productive sectors. Marianne S. Ulriksen is Senior Research Fellow, Centre for Social Development in Africa at the University of Johannesburg, South Africa. Mesharch W. Katusiimeh is Senior Lecturer Department of Public Administration and Governance at Uganda Christian University.

viii
List of acronyms ADBG African Development Bank Group BDV Brussels Definition Value CIT Corporate Income Tax CTL Commercial Transaction Levy EAC East African Community ESIP Education Strategic Investment Plan ESP Expanding Social Protection GAVI Global Alliance for Vaccines and Immunisation GDP Gross Domestic Product HIPC Heavily Indebted Poor Countries IDS Institute of Development Studies IFI International Financial Institutions IMF International Monetary Fund KY Kabaka Yekka LDU Local Defence Unit MGLSD Ministry of Gender, Labour and Social Development MP Member of Parliament MTEF Medium Term Expenditure Framework NDP National Development Plan NRM National Resistance Movement NSSF National Social Security Fund PAF Poverty Action Fund PAYE Pay As You Earn PEAP Poverty Eradication Action Plan RoU Republic of Uganda SAGE Social Assistance Grants for Empowerment SAP Structural Adjustment Programmes UGX Ugandan Shilling UNLF Uganda National Liberation Front UNMHCP Uganda National Minimum Health Care Package UPC Uganda People’s Congress UPDF Uganda People’s Defence Force UPE Universal Primary Education URA Uganda Revenue Authority VAT Value Added Tax WB World Bank WHO World Health Organization
1
Introduction Countries differ greatly in their social policy frameworks with consequent impacts on social development and well-being. Governments initiate policies such as education and health services as well as welfare provision, however we know little about how the sources of revenue and the way resources are mobilised affect policy priorities of decision-makers. In the case study of Uganda, where this paper is the first of five, we explore the political and institutional contexts that enable Uganda to mobilise resources for social development. The case study covers three specific themes: 1) the processes and mechanisms (contestation and bargaining) that connect the politics of resource mobilization and demands for social provision; 2) changes in state-citizen and donor-recipient relations associated with resource mobilization and allocation; and 3) governance reforms (institutional development) that lead to improved and sustainable revenue yields and services. In order to provide sufficient background and context to the three papers covering the above themes, as well as a final synthesis paper, this chapter describes the history of resource mobilization and social spending in Uganda. We start by giving a brief overview of the political and economic context in Uganda over time. This is followed, in part 3, by a discussion on the trends and developments of the composition of different revenue sources that has defined the ability of the Ugandan government to finance its development programmes. Part 4 details the evolution in social policy spending with specific focus on education, health and social protection and ends with main trends in social development outcomes. Part 5 concludes.
The Background: Political and Economic Developments in Uganda Since Independence
The early years: from independence to crisis
The first independent Government, 1962–1971 Following the elections that led to Uganda’s independence from British rule in 1962, a government alliance was formed between Kabaka Yekka (YK)—a pressure group representing the Buganda Kingdom in general and the King of Buganda (Edward Mutesa II) specifically—and the Uganda People’s Congress (UPC) led by Apollo Milton Obote. The Kabaka of Buganda became the president of Uganda with largely ceremonial powers and Apollo Milton Obote became Prime Minister. The first government in newly independent Uganda started well. Between 1962 and 1966 stability and progress was witnessed, and the economy grew in real terms at an average of 4.4per cent per annum (Kasekende et al. 2004). However, after initial stability and progress, differences and conflicts between the Kabaka and UPC intensified and came to a climax in 1966, when the Obote controlled central government used armed forces to physically crush the Buganda state (Mamdani 1976). From then on, to his overthrow in 1971, the Obote regime relied heavily on the support of the army; the military become partners of the government to the extent that no major political action could be contemplated without first ensuring the support of the military (Gingyera-Pinchwa 1994; Brett 2006). The first post-independence development plan for the period 1961/62–1966/67 was modelled along the recommendations made by a World Bank mission invited by the
UNRISD Working Paper 2014–6
2
Ugandan Government in 1962. The plan envisaged an orderly evolution from a traditional to a modern economy with increased production and wealth creating activities by encouraging a growth of local investors and entrepreneurs. A growing private sector was also regarded as an avenue for future mobilization of domestic revenue (Kasekende et al. 2004). The plan also recommended increased expenditure on education and health although the levels of social expenditure were to be maintained. The implementation of the first five-year Development Plan saw, among other things, the construction of rural hospitals, primary and secondary schools; the building of tar roads; the extension of railway lines; and the development of boreholes throughout the country.1 Priorities changed, however, when the new Amin-led regime captured political power in 1971.
The period of political instability, 1971–1985 No meaningful economic reforms happened during Idi Amin’s rule or in subsequent years due to the chaos and political instability that ensued. Idi Amin seized power in a military coup in 1971 and ruled over Uganda for eight years. Before the military coup, Idi Amin was the Army Commander during the Obote regime. Only when Yoweri Museveni took power in 1986 did the situation normalise, which will be discussed further in the next section. Museveni was involved in the war that deposed Idi Amin Dada, ending his rule in 1979, and in the rebellion that subsequently led to the demise of the Milton Obote regime in 1985. The Amin regime (1971–1979) was characterized by scarcity of basic commodities, which was partly due to factors such as businessmen fleeing the country, political uncertainty, an unsure investment climate, high inflation, balance of payment deficits, smuggling, and unregulated money inflow without corresponding fiscal regulation. Moreover, as Uganda's citizens became less confident in the stability of the formal economy due to Amin's unpredictable rule, they increasingly began to turn to the informal sector, thereby bypassing the state and its revenue-collecting authorities. This, compounded with the fact that the economy became less productive, drastically reduced state tax revenue (Brett 2006). As state revenue was so depleted, the government began borrowing from international lenders to finance its development plans at such a rate that Uganda became heavily indebted. In addition, Uganda’s international trade deteriorated due to declines in the world economy in the 1970s. Consequently, the Ugandan economy was in a dire situation by the end of Amin's regime. Areas of social development were also suffering and Ugandans increasingly experienced the deterioration of education and health sectors. Amin was overthrown in 1979 by a coalition of domestic forces under the banner of the Uganda National Liberation Front (UNLF) with strong support of the neighbouring Tanzanian army. This led to an eight-year period of crisis and uncertain rule that plagued the country with many unstable coalitions during the UNLF governments (1979–1980), the second Obote administration (1980–1985), the Okello junta years (1985–1986),2 and the early period of the National Resistance Movement (NRM) government. During Obote’s second period as President, he attempted to address the country's considerable economic woes by approaching the International Monetary Fund (IMF) and the World Bank for financial aid. This aid was dependent upon Uganda liberalizing 1 http://www.upcparty.net/obote/upc_role_Idi_Amin.htm, accessed on 19/12/2013 2 Milton Obote was overthrown in 1985 by his military commander Tito Okello Lutwa whose regime lasted
from May 1985 to January 1986, when he was overthrown by Yoweri Museveni.

The History of Resource Mobilization
and Social Spending in Uganda Marianne S. Ulriksen and Mesharch W. Katusiimeh
3
the economy with the hope that free market forces would make it more competitive in the world economy. Funds from the Bretton Woods institutions to boost production and exports began to increase, while political goodwill from the international community and willingness to trade with, and to invest in, the country also rose considerably. However, the IMF and World Bank reforms had to be abandoned in 1983 due to the civil war and were only reintroduced in 1988 by the new regime of President Yoweri Museveni.
The NRM Government and the period of recovery, 1986–1996 On assuming power in 1986, the NRM introduced many reforms aimed at political, social and economic stability, some of which had a genesis from the bush war ten-point programme. The Ten-Point Programme argued that post-independence Ugandan political rulers had greatly exacerbated the problems of economic distortion introduced by British colonial rule. The solution to these problems required a new political and economic strategy that contained ten points.3 Before taking over power in Kampala, NRM adopted the ten point programme which was to act as a guide and philosophy of thinking by its leadership. Key to the ten point programme was the building of an independent, integrated, self-sustaining economy, the rehabilitation of war-ravaged areas, and the restoration and improvement of social services. President Museveni therefore initially espoused a radical, nationalist economic plan and the government commenced on a programme built on price controls and ideas on barter trade with Libya, North Korea and Cuba. The Washington Consensus was regarded as an imperialistic imposed policy package. However, within a year of taking power, Museveni reversed and adopted the structural adjustment programme - a reform programme with the IMF and the World Bank, which incorporated various orthodox adjustment measures involving economic liberalization, deregulation, and privatization (Kjaer and Muhumuza 2009). It was for reasons of limited state resources that the NRM government began moving away from its state-interventionist economic reconstruction programme and turning to the International Financial Institutions (IFIs) as well as other multilateral and bilateral donors for economic and financial assistance (Mwenda and Tangri 2005). These reforms were vital for economic recovery in the early years of the NRM government and the Ugandan GDP started to improve with an average growth rate of 6.4per cent per annum in 1986/87 until around the early 2000s (ADBG 2010). With the economic recovery programme yielding tangible results and showing positive signals for economic stabilization, the NRM government was then able to pursue other complementary programmes, as will be elaborated upon in the next section. In a bid to promote fiscal discipline and proper budgeting, the government began in 1992/93 to formulate the Medium Term Expenditure Framework (MTEF), which was a fiscal policy tool designed for budgeting and planning. Specifically, the MTEF was to facilitate planning, guide sectoral expenditure allocation, match expenditure with the available resources and improve resource use efficiency and effectiveness. In summary, this period represents a time of recovery aided by donors whose resources helped kick-start the economy which set a foundation for economic stability and development. Also, due to the fact that Museveni’s hold of power was not threatened, the NRM government was able to initiate and implement IMF/WB directed policies that
3 http://countrystudies.us/uganda/54.htm, accessed on 19/2/2014

UNRISD Working Paper 2014–6
4
were unpopular but nevertheless regarded as essential to economic recovery (Kjaer and Katusiimeh 2012a).
The NRM Government, economic growth and poverty reduction, 1996-2006 A new constitution was promulgated in 1995 and with that started a new chapter in Ugandan politics. In this period, Uganda held two rounds of parliamentary and presidential elections, in 1996 and 2001. Both elections were held under the no-party system (the movement system).4 The first presidential election (1996) was won by President Museveni, with an overwhelming majority, largely because of the political and economic stability that Uganda had witnessed. The elections were also largely free and fair with no major incidents of election malpractices. In 2001 the situation was different. President Museveni won the presidential elections amidst widespread allegations of gross irregularities like intimidation of voters, harassment of opposition candidates and supporters, and other electoral malpractices. On the economic front, since 1997, government policy has been guided by the Poverty Eradication Action Plans (PEAPs). Although revised over the years, the PEAPs focused on programmes deemed pro-poor and included areas such as education, rural roads, primary health care, water and sanitation as well as modernization of agriculture (Kjaer and Muhumuza 2009). A strong spirit of partnership between the government, donors and civil society helped mobilize support for the implementation of PEAP. Under Uganda's decentralized system of governance, which fitted well with the framework of PEAP, local authorities became responsible for determining the implementation of sector programmes in accordance with local priorities. Involvement of communities in the planning framework was also strengthened. Uganda’s strategy formulation and implementation of PEAP and related programmes were backed by strong top political leadership. PEAP was to a large extent a country driven process. The Ministry of Planning and Economic Development and later the merged Ministry of Finance, Planning and Economic Development stood out as the lead institution in spearheading the process of strategy development and enforcing systematic implementation (Mudduli 2001). Continued donor support was made possible because of the PEAPs that proved to be the major reference point for the implementation of government policies. PEAP was also seen as instrumental in promoting a strong relationship between the President, government, the bureaucracy, civil society and donors. PEAP worked, along with other measures, to promote and protect pro-poor expenditures in the budgetary process, especially the Poverty Action Fund (PAF) that ring-fenced expenditures to areas deemed to be pro-poor and priority areas of the PEAPs; for instance, expenditure in the areas of education and health increased from 18 per cent to 35 per cent of the budget between 1997 and 2005 (Hickey 2013). Additional funds were secured for pro-poor spending as Uganda was the first country to qualify for the Heavily Indebted Poor Countries Initiative in 1998. Further harmonisation of donor funding was also promoted
4 The ruling NRM government was defined not as a political party but as a movement. Political parties
existed but were not allowed by law to conduct political activities. All those who wished to undertake political activities had to do so under the movement, hence the no-party system was referred to as the movement system. According to the 1995 Constitution of the Republic of Uganda, the movement system is defined as broad based, inclusive and non-partisan and shall conform to the following principles: participatory democracy, accountability, transparency, accessibility to all positions of leadership by all citizens and individual merit as a basis for election to political offices.
The History of Resource Mobilization
and Social Spending in Uganda Marianne S. Ulriksen and Mesharch W. Katusiimeh
5
through budget support to education and health sectors, which was largely possible due to the existence of plans and programmes such as the PEAP and PAF. During this period there was consensus with the donors with regard to the way forward for poverty alleviation and donors wielded a large influence over government policy. While the donors were enthusiastic in their support of the poverty agenda, they ignored worrying political developments, such as Uganda’s involvement in the Congo war, increased corruption in government agencies, and the lack of freedom of association exemplified by the continued consolidation of the no-party system of democracy (Hickey 2013; Barkan 2011). Although the conditions that underpinned this good relationship started to shift in the mid-2000s, as evident in the next section, donors continued to support the poverty initiative. Inflows of foreign aid made it possible for the government to begin providing basic social services to the population, to repair infrastructure, to ease the acute scarcity of essential goods and to pay civil servants salaries—all of which bolstered the legitimacy of the NRM and therefore its political standing (Tangri and Mwenda 2008). While donor aid sceptics argue that political legitimacy suffers as governments reliant on foreign aid are more accountable towards donors than to citizens, the case of Uganda indicates that this is not always the case. In fact, as will be discussed further in Paper 3, during this period the donors’ agenda coincided with the interests of the citizens, and the government gained legitimacy through donor supported poverty eradication programmes.
Political fragmentation, changing priorities, 2006 - present As discussed, the first two decades of NRM rule were focused on strengthening key political institutions, getting the economy to recover from decades of maladministration and civil wars, and building human capital along with alleviating poverty. During these years, although the no-party system of government was in place, the parliament had become a strong institution providing checks and balances on the executive. The judiciary had also retained some level of independence compared to the past years, and the local governments had some degree of power to act independently of the central government, although they relied on central government grants. However, the country continued to experience reversals in the political sphere. The return to a multiparty system in 2000 was supposed to return the country towards full democracy but instead the country moved a step backwards as is discussed in chapter 4 The constitution was extensively amended to enable the President to stand for another term, popularly known as ‘third term.” The power and independence of the local councils were diluted with the abolition of the graduated tax, increased powers of the Resident District Commissioner (a representative of the president at the local level). Local councils’ independence was further diluted by the creation of more and more districts that meant increased expenditure on public administration and with local governments relying more on the central government to fund social services provisioning (Green 2008; Barkan 2011). The government further failed in creating an adequate balance between the national development budget and the growing public administration expenditure. The cost of public administration in the form of political jobs, multiplication of administrative and political units, and discretionary tax relief programmes administered on an ad-hoc basis by high-level politicians, have continued to undermine national budgets (Mwenda 2006).

UNRISD Working Paper 2014–6
6
Freedoms have been curtailed especially with the recent passing of the Public Order Management Bill, which political commentators interpret as a move to crack down and limit the space for demonstrations and public assemblies. The independence of the judiciary is at stake especially with the retirement of the old judges who were independent minded and the appointment of the young ‘cadre’ judges. The Ugandan legislature has also been undermined because MPs with an independent mind, especially those from the NRM party, are at risk of being thrown out of parliament by President Museveni and other party members. Meanwhile, cases of corruption involving high profile government executives seem to be on the rise.5 As a result, although budget support has been the preferred method of aid disbursement in the 2000s, donors have recently been scaling down budget support. For instance, since 2008, World Bank disbursements to Uganda for general budget support have dropped from $400 million to $100 million annually (Barkan 2011). This has in turn put pressure on the Ugandan government to search for other sources of revenue. While western countries are scaling down aid, new donors are coming in, such as China, that are especially involved in financing infrastructure development. By 2010, China had become the lead investor in Uganda with a hand in most key sectors (Kjaer 2013). This period has also witnessed a move away from PEAP as the main development programme. Instead, the National Development Plan (NDP) was introduced in 2010. Unlike the PEAPs, this plan was much more a product of internal government deliberations, and, although including goals of poverty alleviation and social development, the focus is heavily on structural transformation, infrastructural development and expansion of productive sectors (Hickey 2013).
Resource Mobilization and Reforms In this part, we focus in more detail on the history of revenue mobilization in Uganda. By following the same time periods as in part two, we discuss major tax reforms, trends in domestic resource mobilization as well as developments in aid funding over time.
Negligible domestic resource mobilization, the early years 1962–1985 As regards domestic revenue mobilization, scant information exists for the period following independence. The most prominent tax targeting citizens, the Graduated Tax (Head/Poll Tax), was left over from colonial times, where it was introduced and imposed by the colonial administration as a replacement of the Hut Tax (Davey 1974). During this period, Uganda also relied on unified tax policies and an administrative system jointly administered by the initial three East African Community (EAC) members (Uganda, Tanzania and Kenya). Following the collapse of the EAC, the Income Tax Decree No.1 of 1974 was enacted to replace the East African Income Tax Act of 1970. The Decree of 1974 had a loophole that allowed discretion to the minister to declare any class of income to be exempted from tax (Muwanga 2011). This loophole was eliminated by the Income Tax Act of 1997 that generally aimed at broadening the definition of taxable income (Bategeka et al. 2009). Overall, the most important revenue source for the government was tax on coffee export, while revenue from sales tax was the second most important source (Background to the Budget 1985/86:12). Nevertheless, the extent of resource mobilization by the state up to 1986 was negligible
5 Based on author’s close monitoring of the political situation in Uganda.

The History of Resource Mobilization
and Social Spending in Uganda Marianne S. Ulriksen and Mesharch W. Katusiimeh
7
with suggested estimates of domestic revenue to constitute between 4.5 and 6.4 per cent of GDP (Background to the Budget 1984/85: 6).
The era of reconstruction 1986–1996 The coming to power of President Museveni in 1986 ended more than 20 years of political and economic instability. President Museveni promised a fundamental change in the politics and governance of Uganda. To build a stable economy, the President and his government had to mobilize resources domestically and win friends outside the country to help in the broad aim of reconstruction and development. Table 3.1 shows the extent to which the government managed to achieve these goals. As can be seen, between 1989 and 1996, both domestic revenue and grants increased tremendously; but the increase in aid was much more substantial and in the beginning of the 1990s aid covered 50 per cent of total government revenue. Although, the share of aid relative to other government revenue dropped a bit in the mid-1990s, aid again came to constitute the majority of government revenue in the subsequent period, as we shall see in the next section.6 Table 3.1: Domestic revenue and grants 1989/90–1995/96
1989/90 1990/91 1991/92 1992/93 1994/95 1995/96 Domestic revenue 86 459 136 808 187 901 287 111 531 194 622 790 Grants 24 891 14 3189 185 908 271 386 253 876 325 023 Total 111 350 279 997 373 809 558 497 785 070 947 813 Domestic revenue (% of total) 78% 49% 50% 51% 68% 64% Grants (% of total) 22% 51% 50% 49% 32% 34%
Note: amounts in million shillings. Average Exchange rate: 1 USD equivalent to 1700 UGX Source: Background to the Budget (BTTB), 1993/94, 2000/01
Considering in more detail the sources for domestic revenue, Table 3.2 reveals that although revenue from general income tax (PAYE) increased during this period, it was still minimal at about four per cent. Export tax, which used to dominate domestic revenue, dropped drastically, whereas incomes from customs and excise increased. According to the government, these changes were largely due to structural shifts where export taxes (mainly from coffee) performed poorly due to adverse trends in the world coffee market, while the administrative performance on customs, excise and sales tax improved significantly (Background to the Budget 1989/90). In addition, it is very probably that the internal economic recovery as well as some streamlining of the tax rates improved the revenue mobilization (Bakibinga 2002).
6 Also note that these figures do not include aid to civil society organisations and projects outside the
government.

UNRISD Working Paper 2014–6
8
Table 3.2: Sources of domestic revenue (total recurrent revenue performance), 1985–1996, in per cent
1985/86 1987/88 1988/89 1989/90 1991/92 1994/95 1995/96 Income tax 5.5 8.3 10.7 10.6 13.1 15.7 13.7 PAYE 0.5 0.5 1.1 0.8 1.8 4.1 4.1 Other* 5.0 7.8 9.6 9.8 11.3 11.5 9.6
Export taxes 67.3 28.8 12.2 15.0 1.1 2.9 2.1 Customs and excise 9.6 19.5 28.4 36.1 50.8 49.3 50.4 Sales tax 14.8 36.3 39.3 31.6 24.0 32.2 33.8 Other 2.7 7.1 9.4 6.7 11.0 0.0 0.0 Total 100.0 100.0 100.0 100.0 100.0 100.0 100.0
Source: Background to the Budget 1989/90, 1993/94 and 2000/01 * Other includes “income tax on other domestic economic activities other than PAYE” (BTTB 1989/90: 17)
Table 3.3: Major tax reforms, 1986–19967
1990/91 Taxes on government imports abolished Payment of taxes through commercial banks introduced, to minimize fraud and increase
efficiency in revenue collection 1991/1992 Uganda Revenue Authority (URA) set up with the view of improving tax administration. The national customs tariff system based on the Customs Cooperation Council
Nomenclature replaced with the Harmonized Commodity Description and Coding System 1992/1993 Export duty on coffee introduced 1994/95 Coffee stabilisation tax introduced
Introduction of withholding tax Introduction of tax Identification Numbers (TIN) and Computerization of income tax department.
Source: Muwanga 2011.
Beginning with the financial year 1990/1991, the government introduced a range of tax reforms (see table 3.3.). The major reform during this period was the establishment of the Uganda Revenue Authority (URA). In 1991, URA was established as a semi-autonomous body in order to improve tax administration, ensure enforcement of tax related laws, and enhance the capacity for tax revenue collection, tax assessment and accounting. The NRM government worked closely with the Bretton Woods’s institutions and with technical support from the British Government to fully establish URA as an autonomous tax collecting body. Also, the hiring of two URA expatriate Commissioner Generals 1991-1997 and 2001-2004 was vital in as far as insulating URA from bureaucratic and political interference was concerned (ADBG 2010). Although tax evasion, avoidance and opposition to taxes, especially by local politicians, remain common phenomena in Uganda,8 tax administration reforms have been instrumental for domestic revenue mobilization.9 Tax revenues increased from seven per cent of GDP in 1991 to ten per cent in 1997 (Okidi et al. 2005).
7 More details especially related to the set up of URA and the reforms are discussed in Paper 4. 8 In Paper 2, the bargaining and contestation over tax policies is discussed in more detail, and it is noted
how actors may both directly engage in tax reform issues as well as indirectly affect tax policies by evading taxation.
9 The importance of institutional reforms in improving revenue is discussed further in Paper 4.

The History of Resource Mobilization
and Social Spending in Uganda Marianne S. Ulriksen and Mesharch W. Katusiimeh
9
Stagnated revenue generation and donor budget support 1996–2006 As the Table 3.4 clearly shows, there was stagnation in revenues raised domestically during the decade of 1996 to 2006—revenue as a share of GDP hovered around 12 per cent for the entire period. The expenditure shortfall, as a result of the stagnation in terms of domestic revenue, was bridged by donors. In 1999, the donor assistance accounted for about 65 per cent of the budget outlays, and in the 1990s aid stood at over 14 per cent of GDP per year (Kasekende and Atingi-Ego 1999). By the end of June 2004, total external assistance contributed to 49 per cent of Uganda's total resource envelope (Kutesa et al. 2006). Table 3.4: Sources of tax revenue, as a percentage of total revenue, 1996/97 to 2005/06
1996/97 1998/99 2000/01 2002/03 2004/05 2005/06 Petroleum imports 27 20 18 16 16 16 Import and excise duties 14 14 14 11 11 11 Excise duty—local 11 11 9 8 7 7 VAT on imports 18 19 20 19 18 19 VAT local 12 14 16 17 15 15 CIT (corporate income tax) 2 5 5 6 8 8 PAYE (personal income tax) 5 7 9 12 12 13 Revenue as share of GDP 12.1 11.9 10.9 12.3 12 13
Source: ADBG 2010
To mitigate the effects of heavy reliance on donor aid for government expenditures, the Ugandan government in the early 2000s adopted a fiscal consolidation strategy aimed at reducing fiscal deficit. This was to be achieved through increasing domestic revenues and encouraging donors to give budget support rather than project support. By the end of this period, budget support amounted to more than half of total aid (see Table 3.6), whereas, as evident in Table 3.4, the government was not successful in increasing domestic revenue if recorded as a share of GDP. As regards domestic revenue policies and tax reforms Table 3.5 summarizes the record of this period. Table 3.5: Major tax reforms, 1996–2006
1996/97 Introduction of VAT at a standard rate of 17% to replace commercial Transaction Levy (CTL) and sales tax. 1996/97
1997/98 Introduction of a new Income Tax Act 1997/98 2000/01 Introduced General Agreement on Tariffs and Trade (GATT) valuation method in place
Brussels Definition of Value (BDV) and abolished pre-shipment inspection Abolished discretionary powers under section 4 of the Tariff Management Act 1970 for the Minister of Finance to remit import duty and excise duty under the customs and Excise Law.
2005/06 Graduated Personal Tax abolished Increase the rate of value added tax (VAT) from 17 to 18 per cent
Source: SEATINI 2010; Muwanga 2011

UNRISD Working Paper 2014–6
10
The major reforms in this period were the introduction of Value Added Tax (VAT), the new Income Tax Act and the abolition of the graduated tax. On July 1 1996, amidst huge resistance, the Government replaced the Sales Tax and Commercial Transaction Levy (first introduced in 1972) with a VAT of 17 per cent (increased to 18 per cent in 2005). Despite initial resistance by traders, strong political support enabled VAT to take root (Cawley and Zake 2009). The following year, the government enacted a new Income Tax Act of December 1997 that replaced the outdated 1974 Income Tax Decree. The graduated tax was abolished in 2005. Before its abolition, the tax had become very controversial especially during the 2001 presidential campaigns when one of the candidates—Dr. Kizza Besigye—promised to abolish the tax if elected as president. Pressure from Dr. Kizza Besigye to abolish the tax forced the President to act, first by reducing it and consequently by abolishing it ahead of the 2006 presidential elections. The abolition of graduated tax, without developing a viable alternative replacement, has undermined the decentralization process and has led to the crippling of sub-counties and other decentralized units that depended on graduated tax. Consequently, the local government’s increasing reliance on central money transfers has undermined the essence of fiscal decentralization and service delivery at local levels has suffered (Kjaer and Katusiimeh 2012b).
Piecemeal tax reforms and changing financing regimes 2006 –present While in the past, a substantial share of all government expenditures was financed by donors, aid has decreased in recent years. As indicated in Table 3.6, aid as a share of total government revenue has dropped, and budget support has also reduced relative to project support. Donors have reacted to a number of incidents, such as an increase in high profile corruption cases involving government agencies, an intensification of expenditures in the Office of the President and the Ministry of Defence as well as Museveni’s insistence on buying US$720 million worth of fighter jets in 2011. The Parliament was ‘forced’ to pass a supplementary budget because of election expenses in early 2011 (halfway through the budget year) totalling UGX 602 billion shillings—US$267.6 million—to keep the government running. Probably partly due to the supplementary budget as well as other issues related to macro-economic management, the Government failed the IMF’s annual review of the country’s macroeconomic policy for the first time in 2011.

The History of Resource Mobilization
and Social Spending in Uganda Marianne S. Ulriksen and Mesharch W. Katusiimeh
11
Table 3.6: Domestic revenue and grants, in actual and in per cent
2005/06 2006/07 2007/08 2008/09 2009/10 2010/11 2011/12 2012/13 Domestic revenue 2 313.9 2 722.5 3 246.8 3 786.6 4 319.6 6 402.0 6 634.1 7 455.8 Taxes 2 230.9 2 625.8 3 161.1 3 662.3 4 205.7 5 114.2 6 135.9 7 284.7 Oil 1 192.7 392.3 Other revenue 83.0 96.7 85.7 124.3 113.9 95.1 105.9 171.1
Grants 897.6 1 087.8 738.5 884.9 863.6 890.5 1 129.3 1 242.8 Budget support 484.4 733.2 475.2 530.9 467.3 515.5 576.0 480.7 Project support 413.2 354.6 263.3 354.0 396.3 375.0 553.3 762.1
TOTAL 3 211.5 3 810.3 3 985.3 4 671.5 5 183.2 7 292.5 7 763.4 8 698.6
Domestic revenue 72% 71% 81% 81% 83% 88% 85% 86% Taxes 69% 69% 79% 78% 81% 70% 79% 84% Oil 0% 0% 0% 0% 0% 16% 5% 0% Other revenue 3% 3% 2% 3% 2% 1% 1% 2%
Grants 28% 29% 19% 19% 17% 12% 15% 14% Budget support 15% 19% 12% 11% 9% 7% 7% 6% Project support 13% 9% 7% 8% 8% 5% 7% 9%
Note: Average Exchange rate 2005/06—2012/03: USD 1 to 2300 UGX Source: Background to the Budget 2010/11 and 2013/14
With dwindling donor support in relative terms, the regime has turned to the Uganda Revenue Authority (URA) for increased revenue collection as it awaits the expected increase in oil revenues that are expected to start flowing in 2017. But this has had the unfortunate consequence of leading to a fiscal deficit. Uganda is expecting a fiscal deficit of about 6.8 per cent in the coming financial year, up from 6.2 per cent last year, courtesy of higher expenditure on projects in the energy and transport sectors, as well as rising costs of public administration (Busuulwa 2011). As discussed earlier, the URA reforms in the 1990s resulted in some administrative streamlining and significant improvements in revenue collection, although revenues as a share of GDP did not increase by much. According to Fjeldstad and Rakner (2003) the lack of improved domestic resource mobilization in Sub-Saharan Africa (SSA) may partly be explained by patterns of fiscal corruption. In addition, there are low compliance and enforcement in some sectors of the economy as well as numerous tax exemptions. As a result, the entire country’s tax burden is borne by a very small proportion of the population being primarily the large formal companies, the government and private sector employees. After 2006, reforms of the URA are captured in its Modernization Plan (2006/7 to 2009/10) and have received financial support to the tune of US$ 15million from development partners (ADBG 2010). Key achievements in this regard include an Integrity Enhancement Programme launched in 2006, a revised code of conduct and whistle blowing policy of 200910, a tax payers charter, and tax education. The
10 The Whistleblowing policy encourages and enables employees and members of the public to
raise serious concerns and allegations of corruption and other malpractices within URA. Under section 19 of the Whistle Blowers’ Act, the whistle blower is entitled to five per cent of the recovered money within six months after the recovery.
UNRISD Working Paper 2014–6
12
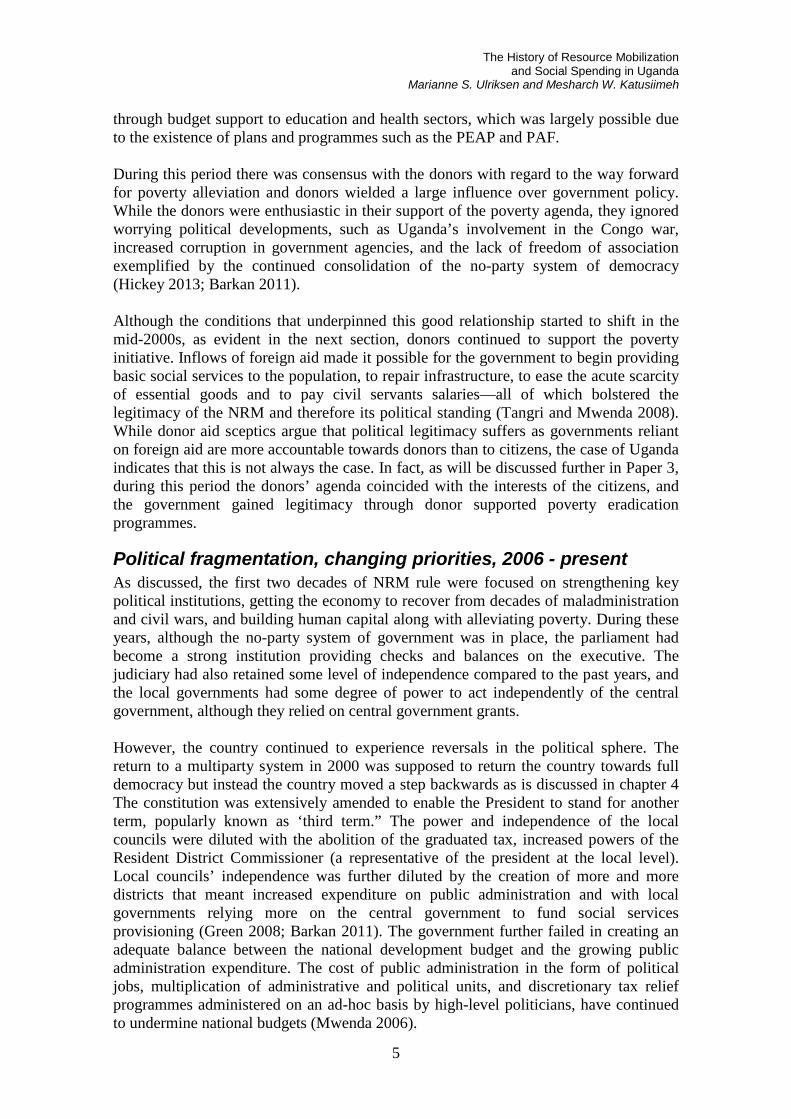
development of an integrated tax system aimed at technological improvement like electronic registration, filing electronic returns and electronic payments. Nevertheless, national government revenue as a percentage of GDP has not increased (Table 3.7). The slowing of revenue growth is partly explained by the erosion of institutional autonomy on account of political interference and deficiencies in the URA’s governance and management structures. This was most strikingly evident in politically motivated appointments and transfers that contributed to the resurfacing of corruption and organizational inefficiency (Therkildsen 2004; Robinson 2011). Table 3.7: Government revenue as a percentage of GDP
2006/07 12.6% 2007/08 12.8% 2008/09 12.2% 2009/10 12.2% 2010/11 12.3% 2011/12 12.3%
Source: Background to budgets 2006/07; 2007/08; 2008/09; 2009/10; 2010/11; 2011/12
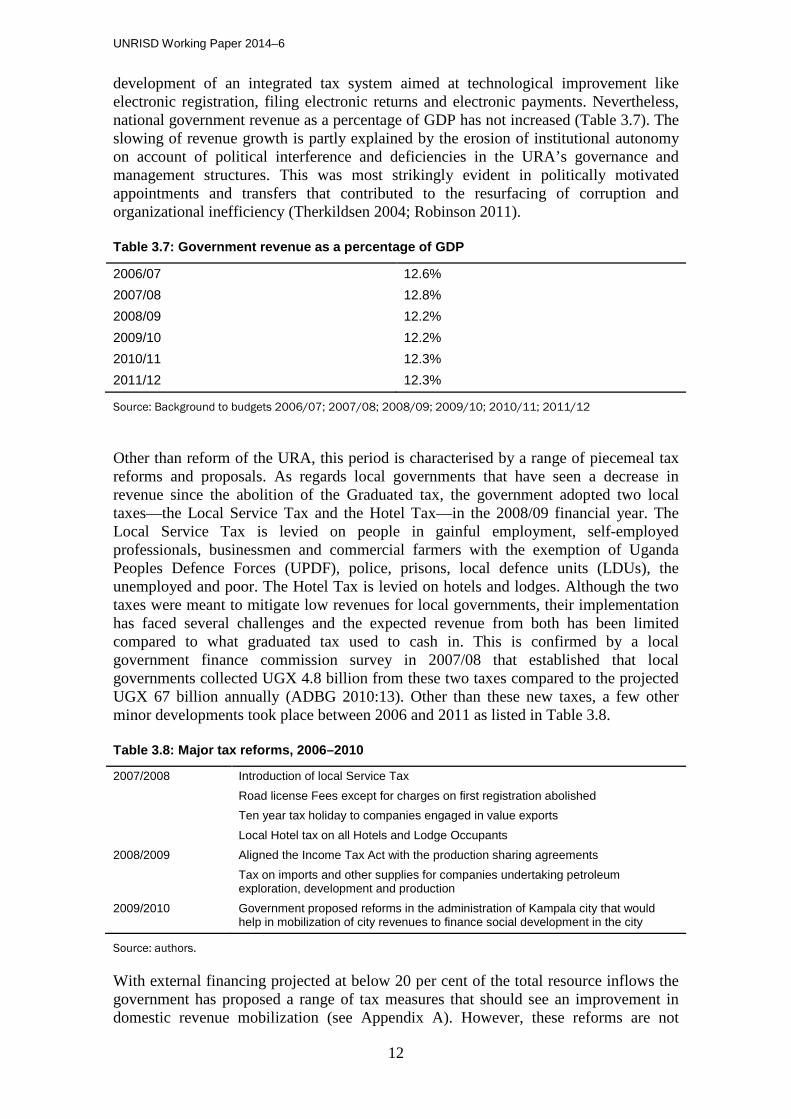
Other than reform of the URA, this period is characterised by a range of piecemeal tax reforms and proposals. As regards local governments that have seen a decrease in revenue since the abolition of the Graduated tax, the government adopted two local taxes—the Local Service Tax and the Hotel Tax—in the 2008/09 financial year. The Local Service Tax is levied on people in gainful employment, self-employed professionals, businessmen and commercial farmers with the exemption of Uganda Peoples Defence Forces (UPDF), police, prisons, local defence units (LDUs), the unemployed and poor. The Hotel Tax is levied on hotels and lodges. Although the two taxes were meant to mitigate low revenues for local governments, their implementation has faced several challenges and the expected revenue from both has been limited compared to what graduated tax used to cash in. This is confirmed by a local government finance commission survey in 2007/08 that established that local governments collected UGX 4.8 billion from these two taxes compared to the projected UGX 67 billion annually (ADBG 2010:13). Other than these new taxes, a few other minor developments took place between 2006 and 2011 as listed in Table 3.8. Table 3.8: Major tax reforms, 2006–2010
2007/2008 Introduction of local Service Tax Road license Fees except for charges on first registration abolished Ten year tax holiday to companies engaged in value exports Local Hotel tax on all Hotels and Lodge Occupants 2008/2009 Aligned the Income Tax Act with the production sharing agreements Tax on imports and other supplies for companies undertaking petroleum
exploration, development and production 2009/2010 Government proposed reforms in the administration of Kampala city that would
help in mobilization of city revenues to finance social development in the city
Source: authors.
With external financing projected at below 20 per cent of the total resource inflows the government has proposed a range of tax measures that should see an improvement in domestic revenue mobilization (see Appendix A). However, these reforms are not

The History of Resource Mobilization
and Social Spending in Uganda Marianne S. Ulriksen and Mesharch W. Katusiimeh
13
characterized by a comprehensive reform and simplification of the tax system, but rather constitute a range of small changes and piecemeal tax reforms. The discovery of oil with estimated reserves in the region of 2.3 billion barrels and with potential production estimated to be as high as 200,000 barrels per day is one issue that has come to the equation in this period. Uganda’s oil discovery was symbolically announced on 8th of October 2006, the day before the country’s 44th independence anniversary. Although it was publicly known that oil deposits had been found some ten years previously, the Government had waited until commercially viable oil reserves were discovered in the Albertine rift of Western Uganda before making its announcement (OREA 2009). A windfall of revenues from oil and gas is expected any time from the year 2015 onwards for the next twenty or thirty years. The Ugandan government, the private sector and other stakeholders hold that the structure of the economy will change, with oil becoming the major contributor to GDP (Rwakabamba and Lukwago 2013).
Summary: Revenue mobilization in Uganda Uganda is in many ways a typical aid dependent country with a correspondingly low ability to mobilise its own domestic resources. After many years of civil war, mismanagement and general decline, Uganda turned a page in 1986 when President Museveni and his NRM party came to power. Although it was then recognised that there was a need to mobilise domestic resources, and some reforms in the taxation system were instituted, development programmes from the mid-1980s onwards were primarily funded with external funding from the international financial institutions as well as other multilateral and bilateral donors. Aid continued to constitute more than half of government revenue up through the 1990s and early 2000s; this is a period with good government-donor relationships and a strong focus on and priority in funding the Poverty Eradication Action Plans (PEAPs), which targeted pro-poor development programmes in many social sectors and in rural infrastructure and agriculture. In the last decade, there has been some decline in donor support, and even though other donors, such as China, are increasingly engaged in the country, the government is trying, in ad hoc ways, to improve domestic resource mobilization. So far, however, the country has been unable to move beyond a tax revenue mark of 12-13 per cent, which is much the same as in the mid-1990s. Uganda has recently discovered substantial oil reserves and it is hoped that resources from mineral wealth can help fund the new National Development Programme (NDP), which prioritises infrastructural (roads and energy) development and the expansion of productive sectors.
Social Policy Development in Uganda This part gives a historical overview of the developments of social policies in Uganda thereby providing context to the politics of resource allocation over time. Specifically, we focus on areas that are regarded as important in promoting social development: primary education, basic health care and social protection (social insurance and social assistance schemes). In the last section, we discuss social development outcomes in more detail.
Early developments, stagnation and cost recovery, 1962–1996 It is commonly agreed that Uganda had relatively well-functioning social services in the 1960s. However, social sectors such as education and health services suffered during the

UNRISD Working Paper 2014–6
14
political and military turmoil in the 1970s and 1980s. In the late 1980 and early 1990s when the government focused on donor-led structural adjustment programmes, public spending was kept low (Matovu et al. 2011) and cost-sharing was a main feature in the financing of public services as will be elaborated upon below. In fact, social policies only started to receive budgetary priority from the mid-1990s onwards, initially starting with the expansion of primary education in 1997 and reforms in the health sector in 2001. Social protection has remained under-prioritised even up to today. In this section we give a brief overview of developments in these three social sectors up to 1996.
Education Given its interrupted history, the public education sector in Uganda has been slow to develop. Primary school enrolment rates of around 50 per cent in 1980 were similar to the enrolment rates in 1960. After the overthrow of Amin in the mid-1970s the enrolment rates increased to about 73 per cent in 1985, where they remained constant until 1995 (Penny et al. 2008). Part of the reason for the low enrolment rates, throughout the period covered in this section, is that when the government retreated from funding and providing public services during the conflict years, parents gradually took over the running and the financing of public schools. Not only was public education underfunded prior to the mid-1990s, the costs of schooling were heavily dependent on private resources and families tended to bear the main burden. It has thus been estimated that families paid more than 80 per cent of the total costs of public primary schooling (Nishimura et al. 2008). In the early 1990s, the government again started to seriously fund the primary education sector, with an increase in government contribution of 40 per cent between 1991 and 1995. However, initially large parts of the funding did not actually reach the intended schools as funds were captured by local officials and politicians (Reinikka and Svensson 2004) and it was clear that the education sector needed to be reformed.
Health In the early 1960, immediately after independence, health care services in Uganda were provided free of charge and access to care was relatively good (Reinikka and Svensson 2003). However, with the political and economic crisis in the 1970s, and in the decades that followed, payment for public health services became the norm (Lucas and Nuwagaba 1999). In the late 1980s and early 1990s, the government sought to introduce a national policy on cost sharing (that is payment of user-fees) and to work out different modalities for formalising and implementing the charging of user-fees. The government drafted a bill in 1990 to formalise cost sharing, but this was rejected by Parliament as it was argued that most people were too poor to pay for health care, that the population was already paying for health services through taxes, and that the quality of services was too abysmal to be paid for (Kivumbi and Kintu 2002; Yates et al. 2006). Nevertheless, the government mandated district authorities to charge for health services and cost sharing became increasingly formalised. A strong push for the adoption of user-fees came in 1992 when the World Bank made new loans for the health sector conditional on the introduction of a national system of user-fees. Cost sharing, as part of the Structural Adjustment Programmes that dominated in this period, was expected to generate needed resources, to promote efficiency in spending and to improve the quality of services. However, the funds generated through user-fees were minimal (often between five and ten per cent of total health expenditures) which were insufficient for the quality of services to improve.11 In addition, as many people avoided going to
11 Yates et al. 2006; Lucas and Nuwagaba 1999; Okuonzi 2004.

The History of Resource Mobilization
and Social Spending in Uganda Marianne S. Ulriksen and Mesharch W. Katusiimeh
15
health units because of the user-fee system, they did not benefit from services that were supposed to be free, such as DPT immunisation of children (Yates et al. 2006). Furthermore, even though the government introduced policies in the 1990s that exempted poor and vulnerable groups from being charged user-fees, local governments—being concerned with raising sufficient revenue—were reluctant to extend exemptions and poor people were often forced to pay anyway (Yates et al. 2006; Kivumbi and Kintu 2002).
Social protection Typical for many countries in sub-Saharan Africa, Uganda introduced formal contributory social security schemes in the late 1960s, such as the National Pensions Scheme for government employees and the National Social Security Fund (NSSF). Given its contributory nature, where employer and employee each pay a share, the NSSF only benefitted those working in the formal and mostly urbanised economy; the fund covered old age, survivors, withdrawal12 and invalidity benefits as well as an emigration grant (Kasente et al. 2002). Hence, by the mid-1990s, almost 90 per cent of the Ugandan population (for example those not formally employed in larger private companies obliged to contribute to the NSSF or working for the government) were without any meaningful form of social insurance in times of old age, illness, unemployment and maternity. Social assistance schemes (non-contributory cash transfers) were non-existing during this period and traditional systems of mutual social security funds had largely been disrupted and were insufficient sources of social protection. Even those few fortunate enough to be part of the formal social security schemes (National Pensions Scheme and NSSF) were not guaranteed income security as claims were marred by delays and actual payments often inadequate to protect the beneficiaries and their families (Ouma 1995; Kasente et al. 2002).
Poverty eradication programmes and social service expansion, 1996–2006 As discussed in section 2.3, the period 1996-2006 was characterised by government-donor consensus on the main policy priorities as defined in the Poverty Eradication Programmemes (PEAPs). Through the funding mechanisms of PAF and sector-wide support as well as the benefits coming from the Heavily Indebted Poor Countries Initiative (HIPC)13, the government and international donors committed substantial funds to both primary education and basic healthcare.
12 Withdrawal benefit is “payable to a member aged 50 years who has been out of work for a period of 12
months” (Kasente et al. 2002: 168). 13 According to the IMF, Uganda received US$ 2 billion in relief through the HIPC (IMF 2000).
UNRISD Working Paper 2014–6
16
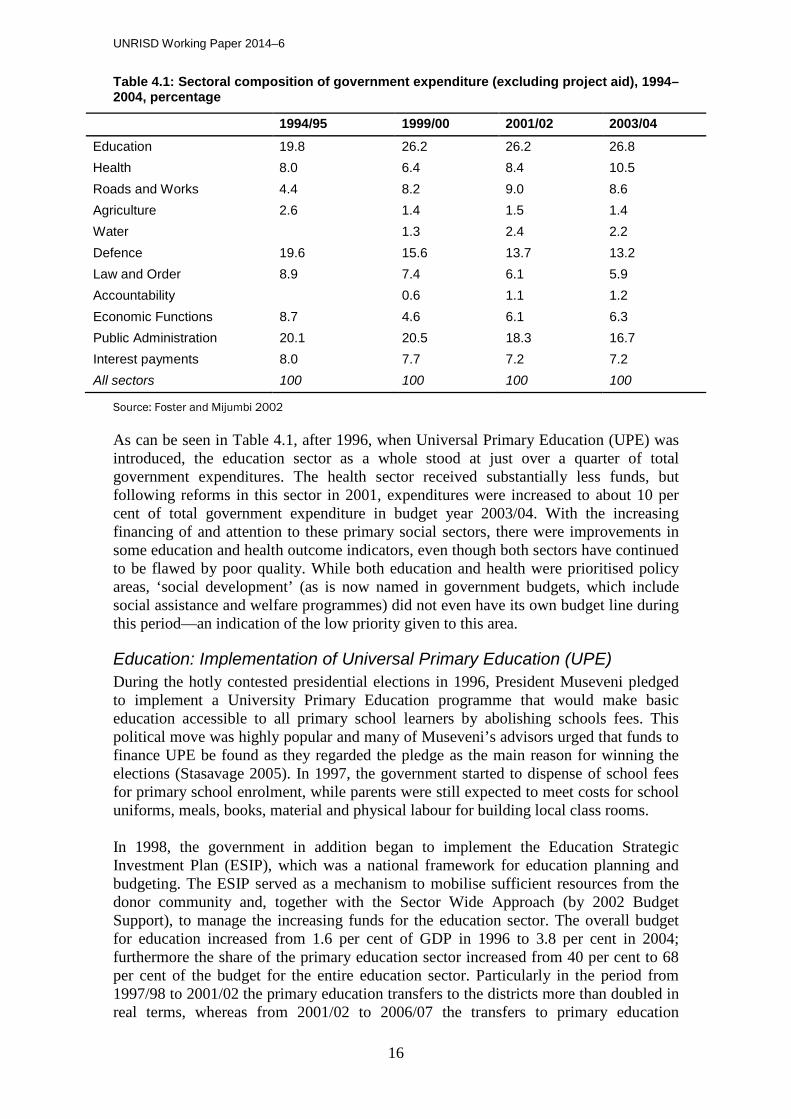
Table 4.1: Sectoral composition of government expenditure (excluding project aid), 1994–2004, percentage
1994/95 1999/00 2001/02 2003/04 Education 19.8 26.2 26.2 26.8 Health 8.0 6.4 8.4 10.5 Roads and Works 4.4 8.2 9.0 8.6 Agriculture 2.6 1.4 1.5 1.4 Water 1.3 2.4 2.2 Defence 19.6 15.6 13.7 13.2 Law and Order 8.9 7.4 6.1 5.9 Accountability 0.6 1.1 1.2 Economic Functions 8.7 4.6 6.1 6.3 Public Administration 20.1 20.5 18.3 16.7 Interest payments 8.0 7.7 7.2 7.2 All sectors 100 100 100 100
Source: Foster and Mijumbi 2002
As can be seen in Table 4.1, after 1996, when Universal Primary Education (UPE) was introduced, the education sector as a whole stood at just over a quarter of total government expenditures. The health sector received substantially less funds, but following reforms in this sector in 2001, expenditures were increased to about 10 per cent of total government expenditure in budget year 2003/04. With the increasing financing of and attention to these primary social sectors, there were improvements in some education and health outcome indicators, even though both sectors have continued to be flawed by poor quality. While both education and health were prioritised policy areas, ‘social development’ (as is now named in government budgets, which include social assistance and welfare programmes) did not even have its own budget line during this period—an indication of the low priority given to this area.
Education: Implementation of Universal Primary Education (UPE) During the hotly contested presidential elections in 1996, President Museveni pledged to implement a University Primary Education programme that would make basic education accessible to all primary school learners by abolishing schools fees. This political move was highly popular and many of Museveni’s advisors urged that funds to finance UPE be found as they regarded the pledge as the main reason for winning the elections (Stasavage 2005). In 1997, the government started to dispense of school fees for primary school enrolment, while parents were still expected to meet costs for school uniforms, meals, books, material and physical labour for building local class rooms. In 1998, the government in addition began to implement the Education Strategic Investment Plan (ESIP), which was a national framework for education planning and budgeting. The ESIP served as a mechanism to mobilise sufficient resources from the donor community and, together with the Sector Wide Approach (by 2002 Budget Support), to manage the increasing funds for the education sector. The overall budget for education increased from 1.6 per cent of GDP in 1996 to 3.8 per cent in 2004; furthermore the share of the primary education sector increased from 40 per cent to 68 per cent of the budget for the entire education sector. Particularly in the period from 1997/98 to 2001/02 the primary education transfers to the districts more than doubled in real terms, whereas from 2001/02 to 2006/07 the transfers to primary education

The History of Resource Mobilization
and Social Spending in Uganda Marianne S. Ulriksen and Mesharch W. Katusiimeh
17
flattened out, with continuous increases to the secondary and tertiary education sectors.14 The implementation of UPE coincided with the decentralisation of social services to local districts, but as the budgets were pegged to specific expenditure posts, the PAF funding mechanism ensured that funds were directed only to prioritised items (Williamson and Canagarajah 2003), so that leakage of government funds were dramatically reduced compared to the problems experienced earlier in the 1990s as reported in section 4.1. Thus, it has been reported that during this period well over 80 per cent of the intended funds reached primary schools; although it should also be acknowledged that leakages of resources between the central government and schools are still persistent problems.15 Given the political and financial push for the extension of primary education, the enrolment increased tremendously from 3.1 million children in 1996/97 to 7.2 million in 2006/07, while there were also marked improvements in schooling facilities. There was also evidence that, as a consequence of the abolition of school fees, inequalities in school attendance that were related to income, gender and region were significantly reduced (Deiniger 2003). Nevertheless, the quantitative gains were not complemented by qualitative improvements of primary education. Student-teacher ratios became among the highest in the world and student performance deteriorated with close to half of the pupils enrolling in Primary One not completing Primary Seven within the expected time frame (Uganda Debt Network 2009; Deiniger 2003).
Health: Primary healthcare reform Payment of user-fees in the health sector continued through-out the 1990s and still in 2000 the cabinet discussed ways to formalise cost sharing. At the same time, the Ministry of Health also worked with plans to phase out user-fees for primary healthcare over time. Both policy directions were scrapped, however, when during the March 2001 presidential elections, President Museveni not only promised to shelve cost sharing policies, but also pledged the immediate and total removal of cost sharing in public health facilities at the community level. To meet the expected increase in demand for services, the government concurrently introduced supply-side reforms, such as improvements in drug supply systems and increased budget allocations for pharmaceuticals (Yates et al. 2006; Nabyonga et al. 2005). Similarly to the education sector, the government set up mechanisms for budget support, which enabled the coordination of donor support for primary healthcare, although it should be noted that donors also continued to support the health sector via direct project support. While government expenditure on health remained around ten per cent of total government expenditure in this period, it is notable that primary healthcare went from receiving only 24 per cent of the total health budget in 1999/00 to receiving 52 per cent in 2000/01, 70 per cent 2001/02 and 85 per cent in 2005/06 (Hedger et al. 2010; WHO 2013). With the abolition of fees and increasing supply of health services, there was a surge in demand for public health services countrywide, and studies have shown that the poor, in particular, benefited as their utilisation of health services increased. Nevertheless, 14 Hedger et al. 2010; Nishimura et al. 2008; Penny et al. 2008. 15 Hedger et al. 2010; Penny et al. 2008; Reinikka and Svensson 2005.

UNRISD Working Paper 2014–6
18
physical access to health services was still constrained in the mid-2000s with only 57 per cent of Ugandans living within five km of a health centre. Primary healthcare was also of poor quality, unavailability of drugs forced patients to purchase medicine privately, just as there were continuous charges for supplies. Hence, out of pocket expenditures as a share of private expenditure on health fell from 71.2 per cent in 1998 to 51.8 per cent in 2001, and then climbed again in 2004 to 58.3 per cent and 66.1 per cent in 2006 (WHO 2013; Xu et al., 2006; Yates et al., 2006). In fact, it was argued at the time that the health sector continued to be underfunded, with a public per capita expenditure on health of US$ 8, against an estimated minimum per capita requirement of US$ 28, and the funding of drugs being US$ 1.2 in 2001/02 while the estimated per capita requirement was set to US$ 3.5 (Nabyonga et al. 2005; Ssengooba 2004). In the mid-2000s, the health sector was shattered by some major corruption scandals. It was revealed that two major funds for treating HIV/AIDS, tuberculosis, malaria and promoting immunization (the Global Fund and GAVI) had been subject to great misuse and the embezzlement of funds by ministers and high level managers in the Ministry of Health. Many European governments and the World Bank reacted by cutting back on their budget support for the health sector. Initially, the government appeared to prosecute the alleged guilty parties, but hearings moved slowly and little happened in the end, while donors themselves continued with budget support for the health sector after the initial cuts (Tangri and Mwenda 2013).
Social protection: a neglected area In terms of income security, most population groups in Uganda remained unprotected during 1996-2006. As before, social security systems—the National Social Security Fund (NSSF), National Pensions Scheme and a growing number of private pension schemes—were covering only a small section of the population (civil servants and some working for larger, formal private companies) but even for these groups pensions were often meagre and difficult to access. Workers in the informal economy had - and still have—no unemployment benefits, no health insurance, and no prospects of drawing a pension or any benefits in the event of injury or disability. In terms of social assistance or care, some vital assistance was reaching some vulnerable groups such as people living with AIDS, people with disabilities, internally displaced persons, widows, orphans and elderly; some programmes also targeted specific poorer regions through cash- or food-for-work schemes. However, these interventions were patchy, uncoordinated, and largely donor funded and were not part of a broader policy framework on social protection (Uganda Debt Network 2009; Kasente et al. 2002; IDS 2002).
Changing priorities and stagnated social development? 2006–present While the period 1996-2006 was clearly dominated by PEAP priorities and a push for human capital development (exemplified in the promotion of universal primary education and basic healthcare), the enthusiasm for the poverty eradication programmes cooled in the mid-2000s. Instead, the government worked towards a new overall strategy which came in 2010 with the National Development Plan. In this plan, social sectors are still considered important parts of the strategy, even though the main priority areas are energy, infrastructure and productive sectors. The change in priorities is evident in Table 4.2. Education and health expenditures are levelling out—even decreasing a bit. Social development (social assistance and welfare programmes that provide limited cash or in-kind transfers and/or care for vulnerable groups) now has its own budget—although with a very small amount (note that this budget line does not

The History of Resource Mobilization
and Social Spending in Uganda Marianne S. Ulriksen and Mesharch W. Katusiimeh
19
include expenditures for social insurance). The most dramatic change is in the energy and minerals sector where the budget increased from 4.6 per cent of total government expenditure in 2011/12 to just over 14 per cent in 2012/13, and in accordance with the NDP document, spending in this sector is set to increase even more (RoU 2010). In the following, we shall again discuss main developments in the three social sectors of our focus, while we end this part with a brief overview of social development outcomes. Table 4.2: Consolidated expenditures for selected sectors, excluding donor projects, in percentage of total government budget, 2008–2013
2008/09 2009/10 2010/11 2011/12 2012/13 Education 17.1 15.3 14.1 16.0 15.9 Health 8.5 7.0 7.3 8.1 7.1 Social development 0.5 0.5 0.3 0.5 0.3 Agriculture 3.9 4.0 3.6 3.6 3.4 Roads and Works 13.7 13.2 9.5 11.4 12.6 Public administration 14.4 15.8 15.7 14.3 11.7 Parliament 2.7 2.0 2.0 3.5 2.5 Security 12.9 16.9 20.9 13.7 7.7 Energy and Minerals 2.8 2.4 4.7 4.6 14.1
Source: The Background to the Budget 2013/14 Fiscal Year, June 2013, authors’ calculations Note: This table cannot be directly compared to Table 4.1 as the tables are based on different types of budget calculations.
Education As we saw in section 4.2, there was an immense push in the late 1990s and early 2000s to scale up the provision of primary education and to increase enrolment rates. From around 2004 there were more efforts towards achieving a greater balance between quantitative advancements to also improve the quality and efficiency of the education system and spending. In primary education some quality achievements were visible, such as reductions in the pupil-teacher and pupil-classroom ratios—from a high of 100 and 116 respectively in 1997, to 48 and 57 respectively in 2011. Furthermore, greater attention was given to training teachers and to curriculum development. Nonetheless, learning achievements have remained stubbornly behind improvements in access. This may partly be attributed to insufficient financing as public education expenditure has not kept pace with budgets and because leakages of resources is still a problem; in addition, quality improvements can be more challenging and take longer to achieve (Hedger et al. 2010; Oonyu 2012). From the mid-2000s onwards, there has been a shift towards post-primary education with increasing allocation, instruction material and teachers training for particularly secondary education. This trend is expected to continue. Thus, in the financial year 2004/05, the primary education sector took up just under 64 per cent of the government’s total education budget, whereas secondary and tertiary education used 29 per cent. In 2009/10 this had changed to 56 per cent and 36 per cent respectively (Guloba et al. 2010: Table 1 (authors’ calculations); Hedger et al. 2010). To sum up, some improvements are visible in the provision of education in Uganda. Enrolments in primary education have increased tremendously as discussed earlier, and there have also been steady increases of secondary and tertiary students in the last
UNRISD Working Paper 2014–6
20
decade; this along with greater gender equality in school attendance. Yet, there is also a sense of frustration that the substantial investments in public education have not lead to better outcomes, particularly as regards the quality of teaching and learning, while many young Ugandans are still not accessing post primary education—if at all completing primary education (Oonyu 2012; Penny et al. 2008). Hence, according to former MP Augustine Ruzindana, “an official report has established that 75 per cent of UPE students in middle and higher primary classes in all districts of Uganda can hardly read and lack the most elementary mathematics (numeracy) skills”. He goes on to argue that the effects of “a poorly educated population” (along with low productivity in the agricultural sector and stunted industrial base) are “disastrous” for the country’s developmental prospects (Ruzindana 2013).
Health To address basic health promotion, prevention, and disease management and control, the government has defined a Uganda National Minimum Health Care Package (NMHCP). However, according to the Ministry of Health, the UNMHCP only receives about 30 per cent of the total funding required and, in general, the health sector is underfinanced (Ministry of Health 2012). Consequently, out-of-pocket spending is high and households are (still) the major source of health financing, contributing about 50 per cent (Ministry of Health 2012). The continued necessity to pay for drugs, supplies and informal payments at public facilities means that many poor and vulnerable groups still face catastrophic health expenditures. The difficulties are compounded by the fact that there are no social health insurance schemes, though this is currently being discussed at a policy level (Ministry of Health 2012). Despite the corruption scandals erupting in the health sector in the mid-2000s, donors still support the sector with as much as half of overall health spending. However, on-budget health support has decreased and off-budget donor contributions to health—particularly to disease specific initiatives such as HIV, tuberculosis and malaria interventions—continue to constitute the larger part of donor support (Stierman et al. 2013). There has been some progress in service availability, with now more than 70 per cent of Ugandans living within five km of a health centre (compared to 57 per cent in the mid-2000s as mentioned in section 4.2). Nevertheless, the health sector continues to face many significant challenges that are compounded by scarce resources and budget leakages and misuse. Such challenges include inconsistent and uneven quality in service, stock-outs of drugs and supplies, and inadequate human resources with, particularly, the rural areas being short of qualified personnel. In addition, services such as those related to disease specific interventions are not integrated into the general health delivery system and constitute instead a parallel system of specific healthcare provisions (Ministry of Health 2012). The challenges in the health sector means that health outcomes are mixed, as we shall discuss in section 4.4.
Social protection Although the PEAPs and NDP carry overall objectives of poverty reduction and social development, the documents pay scant attention to social protection specifically. Since the mid-2000s the Ministry of Gender, Labour and Social Development (MGLSD) has championed efforts to promote social protection and the Ministry succeeded in 2010 to get the cabinet to approve the Expanding Social Protection (ESP) programme, which aim to reduce chronic poverty and improve life chances for poor men, women and children in Uganda. The ESP has two main components: to develop and implement a national social protection policy framework, and to implement the entirely donor-funded Social Assistance Grants for Empowerment (SAGE) programme. SAGE is a
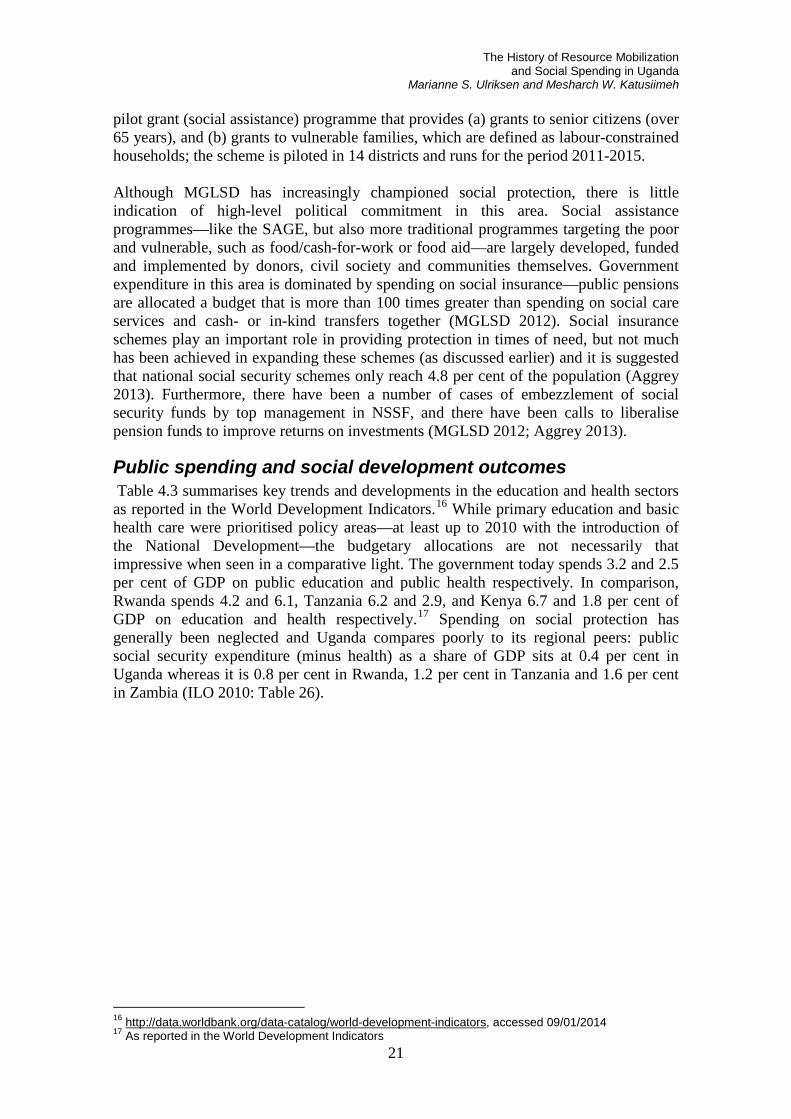
The History of Resource Mobilization
and Social Spending in Uganda Marianne S. Ulriksen and Mesharch W. Katusiimeh
21
pilot grant (social assistance) programme that provides (a) grants to senior citizens (over 65 years), and (b) grants to vulnerable families, which are defined as labour-constrained households; the scheme is piloted in 14 districts and runs for the period 2011-2015. Although MGLSD has increasingly championed social protection, there is little indication of high-level political commitment in this area. Social assistance programmes—like the SAGE, but also more traditional programmes targeting the poor and vulnerable, such as food/cash-for-work or food aid—are largely developed, funded and implemented by donors, civil society and communities themselves. Government expenditure in this area is dominated by spending on social insurance—public pensions are allocated a budget that is more than 100 times greater than spending on social care services and cash- or in-kind transfers together (MGLSD 2012). Social insurance schemes play an important role in providing protection in times of need, but not much has been achieved in expanding these schemes (as discussed earlier) and it is suggested that national social security schemes only reach 4.8 per cent of the population (Aggrey 2013). Furthermore, there have been a number of cases of embezzlement of social security funds by top management in NSSF, and there have been calls to liberalise pension funds to improve returns on investments (MGLSD 2012; Aggrey 2013).
Public spending and social development outcomes Table 4.3 summarises key trends and developments in the education and health sectors as reported in the World Development Indicators.16 While primary education and basic health care were prioritised policy areas—at least up to 2010 with the introduction of the National Development—the budgetary allocations are not necessarily that impressive when seen in a comparative light. The government today spends 3.2 and 2.5 per cent of GDP on public education and public health respectively. In comparison, Rwanda spends 4.2 and 6.1, Tanzania 6.2 and 2.9, and Kenya 6.7 and 1.8 per cent of GDP on education and health respectively.17 Spending on social protection has generally been neglected and Uganda compares poorly to its regional peers: public social security expenditure (minus health) as a share of GDP sits at 0.4 per cent in Uganda whereas it is 0.8 per cent in Rwanda, 1.2 per cent in Tanzania and 1.6 per cent in Zambia (ILO 2010: Table 26).
16 http://data.worldbank.org/data-catalog/world-development-indicators, accessed 09/01/2014 17 As reported in the World Development Indicators

UNRISD Working Paper 2014–6
22
Table 4.3: Indicators on social development spending and outcomes
1971-85 1991 1996 2001 2006 2011 Education Public spending, education, % of GDP 2.9 (2.5) 3.2 Primary school enrolment (% gross) 70.5 70.0* 131.3 118.2 109.8 Pupil-teacher ratio 34.2 33.0 37.6** 54.3 49.0 47.7 Literacy rate, youth 69.8 (80.8) 84.1 87.4 Primary completion rate 41.3 59.5 53.1 Health Public spending, health, % of GDP 1.7 2.0 2.1 2.5 Under-5 mortality rate (per 1000 live births) 196.5 175.8 163.2 140.1 101.3 74.0 Births attended by skilled staff (% of total) (37.8) 39.0 41.9 57.4 Hospital beds (per 1000 people) 1.6 0.9 1.1 (0.5) Tuberculosis treatment success (% of registered cases) 33.0 56 70 77
Source: World Development Indicators NB: For the period 1971-85 the average amount is given (there is little fluctuation in the figures). For the other columns the figure listed are for that year or, if in parenthesis, the year before or after. * Increased to 117% in 1997 ** Increased to 59 in 1997
Education and health outcomes are mixed. As reported in Table 4.3, there are some improvements in the education sector, most notably on quantitative indicators such as school enrolment and public-teacher ratio, whereas primary school completion rates have remained low and have actually deteriorated in recent years (Matovu et al. 2011). Equally, there are some improvements in the health sector—such as child mortality rates and births attended by skilled staff. However, there are also visible differences between areas prioritised by donors—disease specific interventions, where improvements in tuberculosis treatment are clear—to areas indicating overall government spending on health, where for example the availability of hospitals beds has decreased since the 1970s. In terms of poverty, there has been a decline in the share of people living in households below the poverty line, from 56 per cent in 1992/93 to 23 per cent in 2009/2010 (Matovu et al. 2011). However, such a (relatively low) poverty line does not take into account that the distribution of consumption is in fact very flat and that most Ugandans are, if not poor, then near-poor. 43 per cent of the population live above the official poverty line but below twice the poverty line, which make them considerably vulnerable to livelihood shocks and unforeseen expenditures (MGLSD 2012).
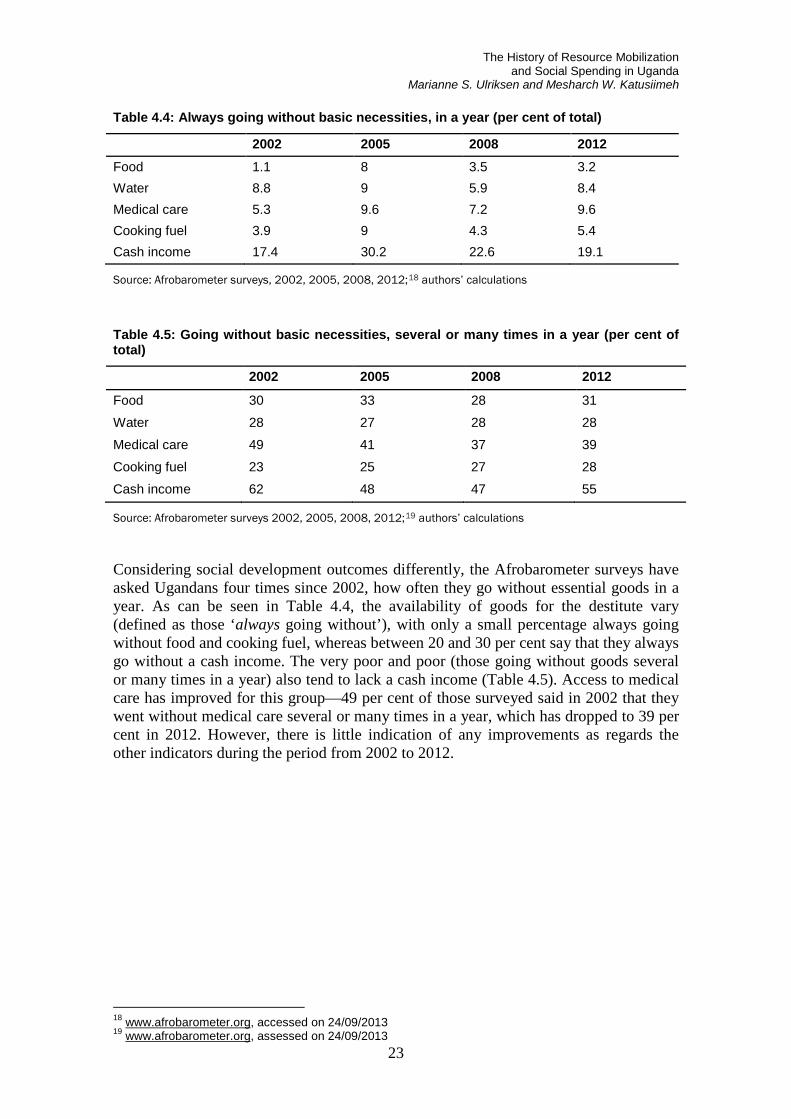
The History of Resource Mobilization
and Social Spending in Uganda Marianne S. Ulriksen and Mesharch W. Katusiimeh
23
Table 4.4: Always going without basic necessities, in a year (per cent of total)
2002 2005 2008 2012 Food 1.1 8 3.5 3.2 Water 8.8 9 5.9 8.4 Medical care 5.3 9.6 7.2 9.6 Cooking fuel 3.9 9 4.3 5.4 Cash income 17.4 30.2 22.6 19.1
Source: Afrobarometer surveys, 2002, 2005, 2008, 2012;18 authors’ calculations
Table 4.5: Going without basic necessities, several or many times in a year (per cent of total)
2002 2005 2008 2012
Food 30 33 28 31
Water 28 27 28 28
Medical care 49 41 37 39
Cooking fuel 23 25 27 28
Cash income 62 48 47 55
Source: Afrobarometer surveys 2002, 2005, 2008, 2012;19 authors’ calculations
Considering social development outcomes differently, the Afrobarometer surveys have asked Ugandans four times since 2002, how often they go without essential goods in a year. As can be seen in Table 4.4, the availability of goods for the destitute vary (defined as those ‘always going without’), with only a small percentage always going without food and cooking fuel, whereas between 20 and 30 per cent say that they always go without a cash income. The very poor and poor (those going without goods several or many times in a year) also tend to lack a cash income (Table 4.5). Access to medical care has improved for this group—49 per cent of those surveyed said in 2002 that they went without medical care several or many times in a year, which has dropped to 39 per cent in 2012. However, there is little indication of any improvements as regards the other indicators during the period from 2002 to 2012.
18 www.afrobarometer.org, accessed on 24/09/2013 19 www.afrobarometer.org, assessed on 24/09/2013
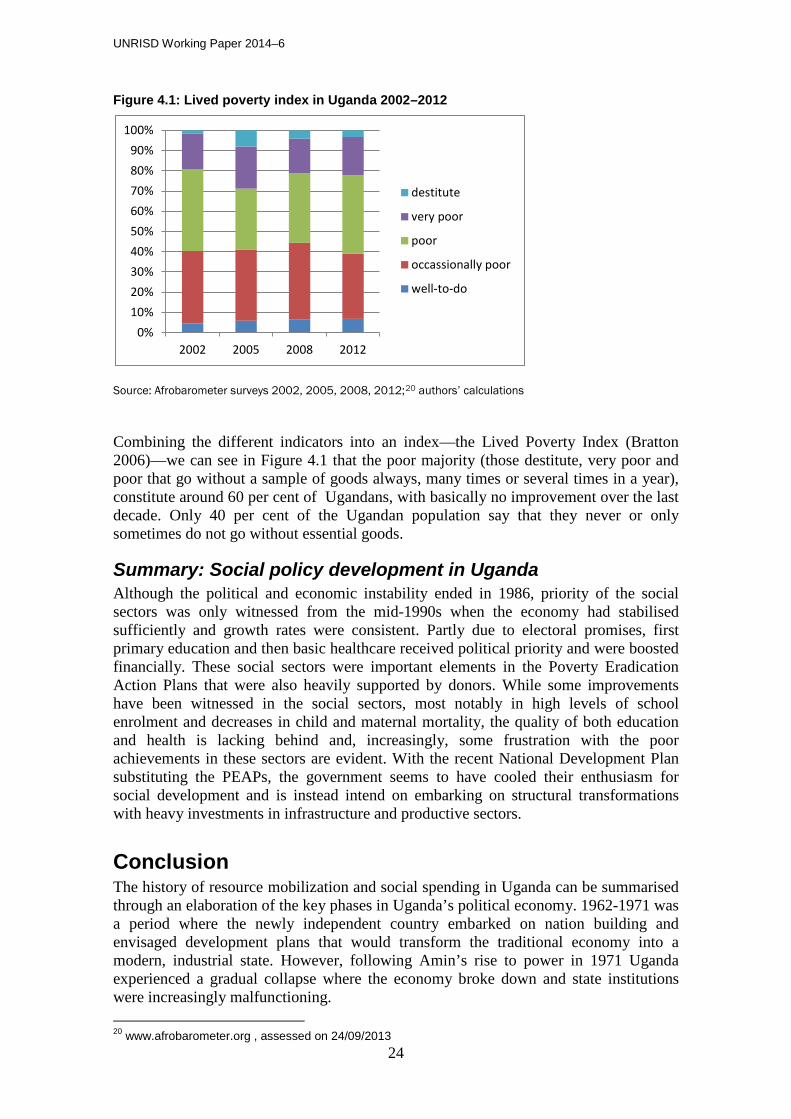
UNRISD Working Paper 2014–6
24
Figure 4.1: Lived poverty index in Uganda 2002–2012
Source: Afrobarometer surveys 2002, 2005, 2008, 2012;20 authors’ calculations
Combining the different indicators into an index—the Lived Poverty Index (Bratton 2006)—we can see in Figure 4.1 that the poor majority (those destitute, very poor and poor that go without a sample of goods always, many times or several times in a year), constitute around 60 per cent of Ugandans, with basically no improvement over the last decade. Only 40 per cent of the Ugandan population say that they never or only sometimes do not go without essential goods.
Summary: Social policy development in Uganda Although the political and economic instability ended in 1986, priority of the social sectors was only witnessed from the mid-1990s when the economy had stabilised sufficiently and growth rates were consistent. Partly due to electoral promises, first primary education and then basic healthcare received political priority and were boosted financially. These social sectors were important elements in the Poverty Eradication Action Plans that were also heavily supported by donors. While some improvements have been witnessed in the social sectors, most notably in high levels of school enrolment and decreases in child and maternal mortality, the quality of both education and health is lacking behind and, increasingly, some frustration with the poor achievements in these sectors are evident. With the recent National Development Plan substituting the PEAPs, the government seems to have cooled their enthusiasm for social development and is instead intend on embarking on structural transformations with heavy investments in infrastructure and productive sectors.
Conclusion The history of resource mobilization and social spending in Uganda can be summarised through an elaboration of the key phases in Uganda’s political economy. 1962-1971 was a period where the newly independent country embarked on nation building and envisaged development plans that would transform the traditional economy into a modern, industrial state. However, following Amin’s rise to power in 1971 Uganda experienced a gradual collapse where the economy broke down and state institutions were increasingly malfunctioning. 20 www.afrobarometer.org , assessed on 24/09/2013
0%10%20%30%40%50%60%70%80%90%
100%
2002 2005 2008 2012
destitute
very poor
poor
occassionally poor
well-to-do
The History of Resource Mobilization
and Social Spending in Uganda Marianne S. Ulriksen and Mesharch W. Katusiimeh
25
1986-1996 was a period of reconstruction. Although Museveni was initially attracted to socialist/ nationalist development plans, he soon came to realise that the government needed assistance from the IMF and the World Bank. The country therefore embarked on strict economic reforms, structural adjustment programmes, and institution building. There were attempts to strengthen domestic resource mobilization but the country became in this period increasingly reliant on donor funding. Social sectors were not yet prioritised and access to even primary schooling and basic healthcare were subject to user fees. However, having liberated Uganda from years of internal strife, Museveni and his NRM government were popular and the high level of legitimacy enabled them to pursue otherwise quite harsh reforms. 1996-2006 is a period dominated by the neo-liberal agenda and defined by the Poverty Eradication Action Plans. In order to maintain legitimacy, the government embarked on popular programmes such as universal primary education and universal access to basic healthcare, and donors—also prioritising human capital development and poverty alleviation—were keen to support these efforts. New funding modalities were used, such as the Poverty Action Fund and budget support, which were attempts to ring fence spending priorities and ensure that funds reached their intended destinations. Domestic revenue mobilization, however, continued to be low, despite a number of reforms in taxation policies and in tax administration. The current period—starting around 2006—has seen an increase in political fragmentation within the NRM and contestation towards opposition parties as well as a cooling in the relationship with donors. With external funding envisaged to be slowing down, and mineral wealth revenue not yet running in, the government is trying to improve domestic resource mobilization—so far mainly through different piecemeal tax reforms. Although social sectors are still key elements in the National Development Plan, it is clear that the government is intent on following a structural transformation strategy. In relation to the overall research themes of the Ugandan case study, this paper already illuminates some trends that will be explored in more detail in other papers. Thus, in terms of contestation and bargaining over resource mobilization and social provision (research theme I),21 we saw that social provision such as primary education and basic health care were important mechanisms to secure electoral gains for the ruling elite just as taxation has been an important arena of social contestation; illustrated for instance by protests against the Graduated Tax and its abolishment prior to the 2006 elections. Research paper 2 will further analyse different forms of social contestation with regard to indirect, direct and local taxes. The historical overview presented here also indicates some changes in the relationships between citizens and the state and between the state and donors (theme II). Overall, the relative stable and amicable relationships in the past (particularly in the 1990s with the first Poverty Eradication Action Plan) have become strained in recent years as the government increasingly relies on patronage and the constrictions of civil society 21 The research themes covers, as mentioned in the introduction: (I) Who pays: Contestation and
bargaining that connects the politics of resource mobilization and demands for social provision; (II) changes in state-citizen and donor-recipient relations associated with resource mobilization and allocation; and (III) governance reforms and institutional development for revenue mobilization and service delivery.
UNRISD Working Paper 2014–6
26
activities to remain in power. Research paper 3 will further examine how relationships between key actors and modes of financing have changed and how this has affected social development outcomes. Finally, social development outcomes are also affected by the institutional capacity of social and fiscal institutions (theme III), where for instance low domestic resource mobilization indicates insufficient capacity of the tax administration. Research paper 4 will explore the trends in budget allocations to key institutions and consider how differences in institutional capacity may affect the ability to promote revenue creation and social spending.
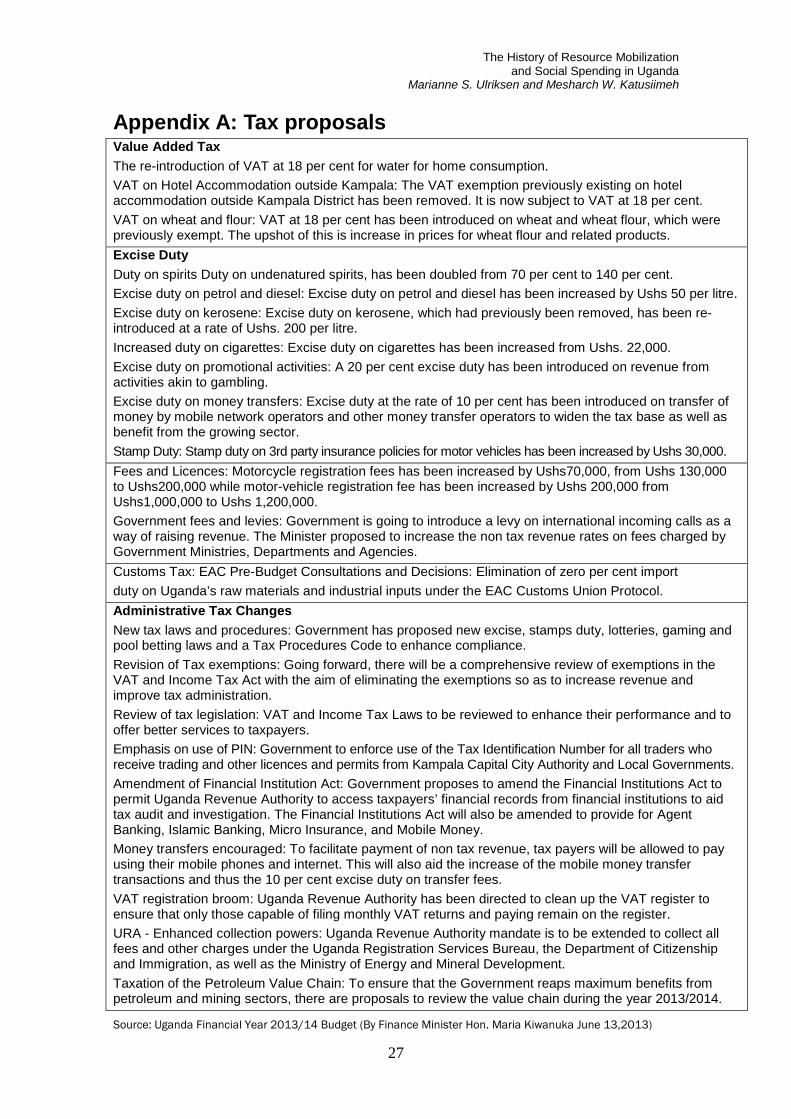
The History of Resource Mobilization
and Social Spending in Uganda Marianne S. Ulriksen and Mesharch W. Katusiimeh
27
Appendix A: Tax proposals Value Added Tax The re-introduction of VAT at 18 per cent for water for home consumption. VAT on Hotel Accommodation outside Kampala: The VAT exemption previously existing on hotel accommodation outside Kampala District has been removed. It is now subject to VAT at 18 per cent. VAT on wheat and flour: VAT at 18 per cent has been introduced on wheat and wheat flour, which were previously exempt. The upshot of this is increase in prices for wheat flour and related products. Excise Duty Duty on spirits Duty on undenatured spirits, has been doubled from 70 per cent to 140 per cent. Excise duty on petrol and diesel: Excise duty on petrol and diesel has been increased by Ushs 50 per litre. Excise duty on kerosene: Excise duty on kerosene, which had previously been removed, has been re-introduced at a rate of Ushs. 200 per litre. Increased duty on cigarettes: Excise duty on cigarettes has been increased from Ushs. 22,000. Excise duty on promotional activities: A 20 per cent excise duty has been introduced on revenue from activities akin to gambling. Excise duty on money transfers: Excise duty at the rate of 10 per cent has been introduced on transfer of money by mobile network operators and other money transfer operators to widen the tax base as well as benefit from the growing sector. Stamp Duty: Stamp duty on 3rd party insurance policies for motor vehicles has been increased by Ushs 30,000. Fees and Licences: Motorcycle registration fees has been increased by Ushs70,000, from Ushs 130,000 to Ushs200,000 while motor-vehicle registration fee has been increased by Ushs 200,000 from Ushs1,000,000 to Ushs 1,200,000. Government fees and levies: Government is going to introduce a levy on international incoming calls as a way of raising revenue. The Minister proposed to increase the non tax revenue rates on fees charged by Government Ministries, Departments and Agencies. Customs Tax: EAC Pre-Budget Consultations and Decisions: Elimination of zero per cent import duty on Uganda’s raw materials and industrial inputs under the EAC Customs Union Protocol. Administrative Tax Changes New tax laws and procedures: Government has proposed new excise, stamps duty, lotteries, gaming and pool betting laws and a Tax Procedures Code to enhance compliance. Revision of Tax exemptions: Going forward, there will be a comprehensive review of exemptions in the VAT and Income Tax Act with the aim of eliminating the exemptions so as to increase revenue and improve tax administration. Review of tax legislation: VAT and Income Tax Laws to be reviewed to enhance their performance and to offer better services to taxpayers. Emphasis on use of PIN: Government to enforce use of the Tax Identification Number for all traders who receive trading and other licences and permits from Kampala Capital City Authority and Local Governments. Amendment of Financial Institution Act: Government proposes to amend the Financial Institutions Act to permit Uganda Revenue Authority to access taxpayers’ financial records from financial institutions to aid tax audit and investigation. The Financial Institutions Act will also be amended to provide for Agent Banking, Islamic Banking, Micro Insurance, and Mobile Money. Money transfers encouraged: To facilitate payment of non tax revenue, tax payers will be allowed to pay using their mobile phones and internet. This will also aid the increase of the mobile money transfer transactions and thus the 10 per cent excise duty on transfer fees. VAT registration broom: Uganda Revenue Authority has been directed to clean up the VAT register to ensure that only those capable of filing monthly VAT returns and paying remain on the register. URA - Enhanced collection powers: Uganda Revenue Authority mandate is to be extended to collect all fees and other charges under the Uganda Registration Services Bureau, the Department of Citizenship and Immigration, as well as the Ministry of Energy and Mineral Development. Taxation of the Petroleum Value Chain: To ensure that the Government reaps maximum benefits from petroleum and mining sectors, there are proposals to review the value chain during the year 2013/2014.
Source: Uganda Financial Year 2013/14 Budget (By Finance Minister Hon. Maria Kiwanuka June 13,2013)
UNRISD Working Paper 2014–6
28
References ADBG (African Development Bank Group). 2010. Domestic Resource Mobilization for
Poverty Reduction in East Africa: Uganda Case Study. Regional Department East A (OREA). November 2010.
Aggrey, Niringiye. 2013. “An Assessment of the Social Assistance Grants for Empowerment Programme in Uganda.” In Devereux, S and M. Getu (eds), Informal and Formal Social Protection Systems in Sub-Saharan Africa. Fountain Publishers, Kampala.
Bakibinga, David J. 2002 Commercial Law in a Liberalized Economy: The Case of Uganda Inaugural Lecture Delivered at Makerere University, Kampala, Uganda, June.
Background to the Budget, Government of Uganda, for various years, 1989/90, 1993/94, 2001/02, 2006/07, 2007/08, 2008/09, 2009/10, 2010/11, 2011/12, 2013/14.
Barkan, Joel D. 2011. Uganda: Assessing Risks to Stability: A Report of the Centre for Strategic and International Studies. http://csis.org/files/publication/110623_Barkan_ Uganda_Web.pdf, accessed on 16 November 2013.
Bategeka, Lawrence, Madina Guloba and Julius Kiiza. 2009. Gender and Taxation: Analysis of Personal Income Tax (PIT). Research Series No. 58. Economic Policy Research Centre (EPRC), Kampala.
Bratton, Michael. 2006. Poor People and Democratic Citizenship in Africa. Afrobarometer, Working Paper No. 56.
Brett, E.A. 2006. State failure and success in Uganda and Zimbabwe: The logic of political decay and reconstruction in Africa: Working paper No. 78. Crisis State Programme. Development Research Centre.
Busuulwa, Benerd. 2011. Uganda faces growing fiscal deficit up to 2013. In the East African June 5, 2011.
Cawley, Gerry and Justin Zake. 2009. “Tax Reform. In Uganda’s Economic Reforms.” In Kuteesa, Florence, Emmanuel Tumusiime-Mutebile, Alan Whitworth and Tim Williamson (eds.), Uganda’s Economic Reforms: Insider Accounts. Oxford University Press, Oxford.
Davey, K. 1974. Taxing a Peasant Society: The Example of Graduated Tax in East Africa. Charles Knight and Co., London.
Deininger, Klaus. 2003. “Does cost of schooling affect enrollment by the poor? Universal primary education in Uganda.” Economics of Education Review, Vol. 22, No.3, pp. 291-305.
Fjeldstad, Odd-Helge and Rakner, Lise. 2003. Taxation and tax reforms in developing countries: Illustrations from sub-Saharan Africa. Christian Michelsen Institute (CMI), Development Studies and Human Rights, Bergen.
The History of Resource Mobilization
and Social Spending in Uganda Marianne S. Ulriksen and Mesharch W. Katusiimeh
29
Foster, Mick and Mijumbi, Peter. 2002. How, When and Why does Poverty get Budget Priority? Poverty Reduction Strategy and Public Expenditure in Uganda, Overseas Development Institute (ODI) Working Paper 163.
Gingyera-Pinchwa, A.G. 1994. “Soldiers and Politics.” In Oyugi, Walter O. Politics and Administration in East Africa. East Africa Educational Publishers, Nairobi.
Green, ElliotD. 2008. “Decentralization and Conflict in Uganda.” Conflict, Security and Development, Vol. 8, No.4, pp. 427-450.
Guloba, Madina, Nyende Magidu and James Wokadala. 2010. Public spending in the education sector in Uganda: Evidence from program budgeting analysis. Paper submitted to the Global Development Network, June 2010.
Hedger, Edward, Tim Williamson, Tom Muzoora and Justina Stroh. 2010. Sector Budget Support in Practice: Education Sector in Uganda. Report, ODI and Mokoro. URL: www.odi.org.uk/resources/docs/6077.pdf, last accessed on 27 September 2013.
Hickey, Sam. 2013. “Beyond the Poverty Agenda? Insights from the New Politics of Development in Uganda.” World Development, Vol. 43, pp. 194-206.
IDS (Institute of Development Studies). 2002. Social Protection in Uganda: Study to Inform the Development of a Framework for Social Protection in the Context of the Poverty Eradication Action Plan. Report Prepared for the Social Protection Task Force.
ILO. 2010. World Social Security Report 2010/11: Providing Coverage in Times of Crisis and beyond. International Labour Office , Geneva, 2010.
IMF. 2000. HIPC Debt Relief for Uganda Increased to a Total of US$2 Billion: Additional Relief Vital for Uganda's Poverty Reduction Programs. Press Release No. 00/6, February 8, 2000. http://www.imf.org/external/np/sec/pr/2000/pr0006.htm, accessed on 10 January 2014.
Kasekende, Louis A. and Michael Atingi-Ego. 1999. “Uganda’s experience with aid.” Journal of African Economies, Vol. 8, No. 4, pp. 617-649.
Kasekende, Louis A., Micheal Atingi-Eho and Rachel Kaggwa Sebudde. 2004. The African Growth Experience Uganda Country Case Study. African Economic Research Consortium, Working Paper No. 8
Kasente, Deborah, Narathius Asingwire, Firimooni Banugire and Swizen Kyomuhendo. 2002. “Social security systems in Uganda.” Journal of Social Development in Africa, Vol. 17, No. 2, pp. 157-83.
Kivumbi, Geoge W. and Francis Kintu. 2002. “Exemptions and waivers from cost sharing: ineffective safety nets in decentralised districts in Uganda.” Health Policy and Planning, Vol. 17, No. 1(Suppl), pp. 64-71.

UNRISD Working Paper 2014–6
30
Kjaer, Anne Mette and Fred Muhumuza. 2009. The New Poverty Agenda in Uganda, Dansk Institut for Internationale Studier (DIIS) Working Paper 2009, No.14. DIIS, Copenhagen.
Kjaer, Anne Mette and Mesharch W. Katusiimeh. 2012a. Growing but not transforming: Fragmented ruling coalition’s and economic developments in Uganda, Dansk Institut for Internationale Studier (DIIS) Working Paper 2012, No. 7.
Kjaer, Anne Mette and Mesharch W. Katusiimeh. 2012b. “Sustaining Fiscal Decentralization in a neo-patrimonial and aid dependent state: the case of Uganda.” In Benon C. Bashek,. Gerald K. Karyeija and Rose B. Namara (eds.), Public Administration in Uganda: Theory and Practice. Lap Lambert Academic Publishing, Saarbrucken.
Kjaer Anne Mette. 2013. FDI in Extractives in Uganda: linkages and issues for the local economy. Paper to be presented at the African Studies Association Annual meeting, November 21-24, 2013.
Kutesa, Florence, Ishmael, Magona, Maris Wanyera and James Wokadala. 2006. Uganda: A Decade of Budget Reform and Poverty Reduction. OECD Journal on Budgeting. Volume 6, No. 2.
Lucas, Henry and Augustus Nuwagaba. 1999. Household coping strategies in response to the introduction of user charges for social service: A case study on health in Uganda. Working Paper 86, IDS. http://www.gsdrc.org/go/display&type=Document&id=1704, accessed on 23 July 2013.
Mamdani, Mahmood 1976. Politics and class formation in Uganda. Heinemann educational publishers, Nairobi.
Matovu, John M., Evarist Twimukye, Albert Musisi and Sebastian Levine. 2011. Assessing Development Strategies to Achieve the MDGs in the Republic of Uganda. United Nations Department for Social and Economic Affairs, March 2011.
MGLSD (Ministry of Gender Labour and Social Development). 2012. Uganda Social Protection Public Expenditure Review. Kampala.
Ministry of Health. 2012. Uganda Health System Assessment 2011. Health Systems 20/20 project, Abt Associates Inc. and Makerere University School of Public Health, Kampala, Uganda.
Mudduli, M. 2001. Uganda’s Poverty Eradication Action Plan. National Sustainable Development Strategy Principles Tested. Paper presented at the International Forum on National Sustainable Development Strategies, Accra Ghana 7-9 November 2001.
Muwanga, Lawrence. 2011. Adequacy of Tax Revenue and the National Budget Deficit in Uganda before and after the Tax Reforms. Dissertation submitted to school of post graduate studies for the award of the master of Arts in Economics of Makerere University. Kampala, Uganda.
Mwenda, Andrew and Roger Tangri. 2005. “Patronage politics, donor reforms, and regime consolidation in Uganda”, African affairs, Vol. 104, No. 416, pp. 449-467.

The History of Resource Mobilization
and Social Spending in Uganda Marianne S. Ulriksen and Mesharch W. Katusiimeh
31
Mwenda, Andrew. 2006. “Redefining Uganda’s budget priorities: A Critique of the 2006/07 Budget.” Advocates Coalition for Development and Environment (ACODE) Policy Briefing Paper, No. 17, 2006.
Nabyonga, J., M. Desmet, H. Karamagi, P.Y. Kadama, F.G. Omaswa and O. Walker. 2005. “Abolition of cost-sharing is pro-poor: evidence from Uganda.” Health Policy and Planning, Vol. 20, No. 2, pp. 100-108.
Nishimura, Mikiko, Takashi Yamano and Yuichi Sasaoka. 2008. “Impacts of the universal primary education policy on educational attainment and private costs in rural Uganda.” International Journal of Educational Development, Vol. 28, No.2, pp. 161-175.
Okidi, John, Sarah Sewanyana, Lawrence Bategeka and Fred Muhumuza. 2005. Growth Strategies and Conditions for Pro poor growth: Uganda’s experience. Economic Policy Research Centre, Kampala.
Okuonzi, Sam A. 2004. “Learning from failed health reform in Uganda.” Education and Debate, Vol. 329, pp. 1173-75.
Oonyu, Joseph. 2012. Count down to 2015: Is Uganda on Track? Assessment of Progress to Attainment of EFA Goals in Uganda. Report prepared for Uganda National Commission for UNESCO.
OREA 2009. Managing Oil Revenue in Uganda: A Policy Note. OREA Knowledge Series: No. 1. Country and Regional Department, East African Development Bank.
Ouma, Stephen D. 1995. “The Role of Social Protection in the Socioeconomic Development of Uganda.” Journal of Social Development in Africa, Vol. 10, No. 2, pp. 5-12.
Penny, Alan, Michael Ward, Tony Read and Hazel. Bines. 2008. “Education sector reform: The Ugandan experience.” International Journal of Educational Development, Vol. 28, No.3, pp. 268-285.
Reinikka, Ritva and Jakob Svensson. 2003. Working for God? Evaluating Service Delivery of Religious Not for Profit Health Care Providers in Uganda. The World Bank Development Research Group.
Reinikka, Ritva and Jakob Svensson. 2004. “Local Capture: Evidence from a Central Government Transfer Program in Uganda.” The Quarterly Journal of Economics, Vol. 119, No. 2, pp. 679-705.
Reinikka, Ritva and Jakob Svensson. 2005. “Fighting Corruption to Improve Schooling: Evidence from a Newspaper Campaign in Uganda.” Journal of the European Economic Association, Vol. 3, No. 2/3, pp. 259-267.
RoU (Republic of Uganda). 2010. National Development Plan: 2010/11—2014/15. Government of Uganda, April 2010.
Robinson, M. 2011. “The Political Economy of Governance Reforms in Uganda”. Commonwealth and Comparative Politics, Vol. 45, No. 4, pp. 452-474.
UNRISD Working Paper 2014–6
32
Ruzindana, Augustine. 2013. “Neglect of education and agriculture is a Disaster.” Daily Monitor, 26 August 2013.
Rwakabamba, Morrison and Daniel Lukwago. 2013.” Farmers in Uganda’s Oil Economy: Deal or no Deal! Agency for Transformation: Kampala. Scenarios for Danger and Redemption: It’s a Choice.” Agency for Transformation, Kampala. http://www.agencyft.org/wp-content/uploads/2013/06/Publication-Farmers-in-Ugandas-oil-Economy-Deal-or-no-Deal.pdf, accessed on 2 December 2014.
SEATINI (The Southern and Eastern African Trade, Information and Negotiations Institute). 2010. Towards Taxation for Development: Challenges and Opportunities; The Case of Uganda. SEATINI-UGANDA. November, 2010.
Ssegnbooba, Freddie. 2004. “Uganda’s minimum health care package: Rationing within the minimum?” Health Policy and Development, Vol. 2, No. 1, pp. XX
Stasavage, David. 2005. “Democracy and Education Spending in Africa.” American Journal of Political Science, Vol. 49, No. 2, pp. 343-358.
Stierman, Elizabeth, Freddie Ssengooba, and Sara Bennett. 2013. “Aid Alignment: A Longer Term Lens on Trends in Development Assistance for Health in Uganda.” Globalization and Health, Vol. 9, No. 7, pp.1-11.
Tangri, Roger and Andrew Mwenda. 2013. The Politics of Elite Corruption in Africa. Routledge, London.
Tangri, Roger and Andrew Mwenda. 2008. “Elite Corruption and Politics in Uganda.” Commonwealth and Comparative Politics, Vol. 46, No. 2, pp. 177-194.
Therkildsen, Ole. 2004. Autonomous Tax Administration in Sub-Saharan Africa: The Case of Uganda Revenue Authority, mimeo.
Uganda Debt Network. 2009. Civil Society Statement on the call for improved service delivery of Universal Primary Education and Primary HealthCare in Uganda. Presented to the Parliamentary Committee on Social Services, 8th December, 2009.
WHO. 2013. Health financing, WHO data. http://apps.who.int/gho/data/node.main.75, accessed on 25 July 2013.
Williamson, Tim and Sudharshan Canagarajah. 2003. “Is There a Place for Virtual Poverty Funds in Pro-Poor Public Spending Reform? Lessons from Uganda’s PAF.” Development Policy Review, Vol. 21, No. 4, pp. 449-480.
Xu, Ke, David Evans, Patrick Kadama, Juliet Nabyonga, Peter Ogwal, Pamela Nabukhonzo and Ann Aguilar. 2006. “Understanding the impact of eliminating user fees: Utilization and catastrophic health expenditures in Uganda.” Social Science and Medicine, Vol. 62, No.4, pp. 866-876.
Yates, Jenny, Ros Cooper and Jeremy Holland. 2006. “Social protection and health: Experiences in Uganda.” Development Policy Review, Vol. 24, No. 3, pp. 339-356.