The High-Shear, Low-CAPE SHERB parameter and its evaluation
64
The High-Shear, Low-CAPE SHERB parameter and its evaluation Keith D. Sherburn Department of Marine, Earth, and Atmospheric Sciences North Carolina State University Presented by: Seth Binau CR Southeast SOO Group Meeting August 31 2016
Transcript of The High-Shear, Low-CAPE SHERB parameter and its evaluation
The High-Shear, Low-CAPE SHERB parameter and its evaluation
Keith D. Sherburn Department of Marine, Earth, and Atmospheric Sciences
North Carolina State University
Presented by: Seth Binau
CR Southeast SOO Group Meeting August 31 2016
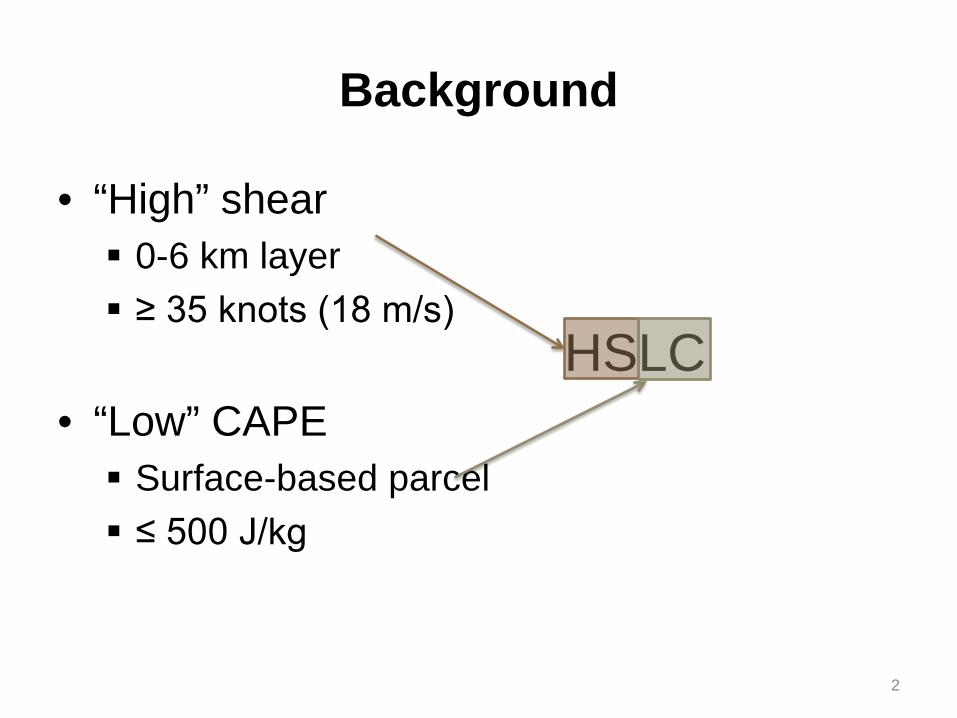
Background
• “High” shear 0-6 km layer ≥ 35 knots (18 m/s)
• “Low” CAPE Surface-based parcel ≤ 500 J/kg
HSLC
2

• High-shear, low-CAPE (HSLC) environments: second
“key subclass” of severe weather (Schneider et al. 2006)
• Over half of significant or violent tornadoes (EF2+)
associated with HSLC
• Relatively high number of missed events and false alarms
• Few operational or modeling studies
3
Background

High-Shear, Low-CAPE (HSLC) Timeline
1990 2000 2010
“Midget supercell”
Single-Doppler study of mini-
supercell
“Broken-S” signature
Case studies and climatologies
SPC Environmental
Studies Modeling studies
Forecast challenges
Weak CAPE tornadoes
CSTAR HSLC I
CSTAR HSLC II
Year includes literature related to HSLC

Early Literature (1990s)
• Shallow convection can produce tornadoes (Davies 1990)
• Tropical environments
are HSLC (McCaul 1993); modeling studies produce mini-supercells (McCaul and Weisman 1996)
• Mesocyclone ~3 km deep, echo tops ~6 km (Kennedy et al. 1993)
McCaul and Weisman (1996) Kennedy et al. (1993)

Increasing Awareness (early 2000s)
• “Broken-S” signature introduced (McAvoy et al. 2000)
• Rapid tornadogenesis and other operational considerations (Cope 2004)
• Lightning rare in HSLC events due to lack of instability in mixed phase region (van den Broeke et al. 2005)
McAvoy et al. (2000)
van den Broeke et al. (2005)
Credit Jason Davis

Paradigm Shift (Late 2000s)
• Tornado watch skill lower in HSLC environments (Dean and Schneider 2008, 2012)
• “Effective” parameters
designed for low-topped covection (Thompson et al. 2007)
• Low CAPE (defined as MLCAPE ≤ 500 J kg-1) tornadoes plentiful (Guyer and Dean 2010)
Dean and Schneider (2008, 2012)
“The [effective bulk shear] normalizes the shear values for shallow and very
tall storms, allowing more realistic assessments of these storm profiles.”
Thompson et al. (2007)
Schneider et al. (2006)
“Two key subclasses of United States severe weather environments associated
with strong deep layer shear, one with large MLCAPE predominantly in the central United States, and another with small
MLCAPE [≤ 1000 J kg-1] primarily in the Southeast emerge
from this analysis.” Guyer and Dean (2010)

Operational Challenges (2010s)
• Shallow, transient tornadic vortices (Davis and Parker 2014*)
• High percentage of cool season and overnight severe (Sherburn and Parker 2014*)
Davis and Parker (2014) Sherburn and Parker (2014)
*Low CAPE defined as SBCAPE ≤ 500 J kg-1

Background
Storm Prediction Center (SPC)
9

Background
Storm Prediction Center (SPC)
10

Background
Storm Prediction Center (SPC)
11

Background
Storm Prediction Center (SPC)
12

Background
Storm Prediction Center (SPC) 13

Background • Difficult to forecast • Often cool season or
nocturnal • Challenging warning
operations • Compressed
convection • Fast storm motions • Transient structures • Little to no lightning
Top: 2003-2009 tornadoes with MLCAPE < 500 J/kg Bottom: Same, but EF2 and greater
Guyer and Dean (2010)
14

Background
Brotzge et al. (2011) 15

Background
• Current forecasting tools inadequately represent risk in low CAPE environments
Guyer and Dean (2010) 16
Conventional threshold

Verification Data
• All HSLC significant severe reports and nulls across contiguous U.S. between 2006-2011 2517 HSLC Significant Severe Reports (21% of
all) 302 tornadoes, 1579 wind reports, 636 hail reports
1316 HSLC Nulls • Also SPC Mesoanalysis • Source of HSLC climatology • Includes development dataset
17
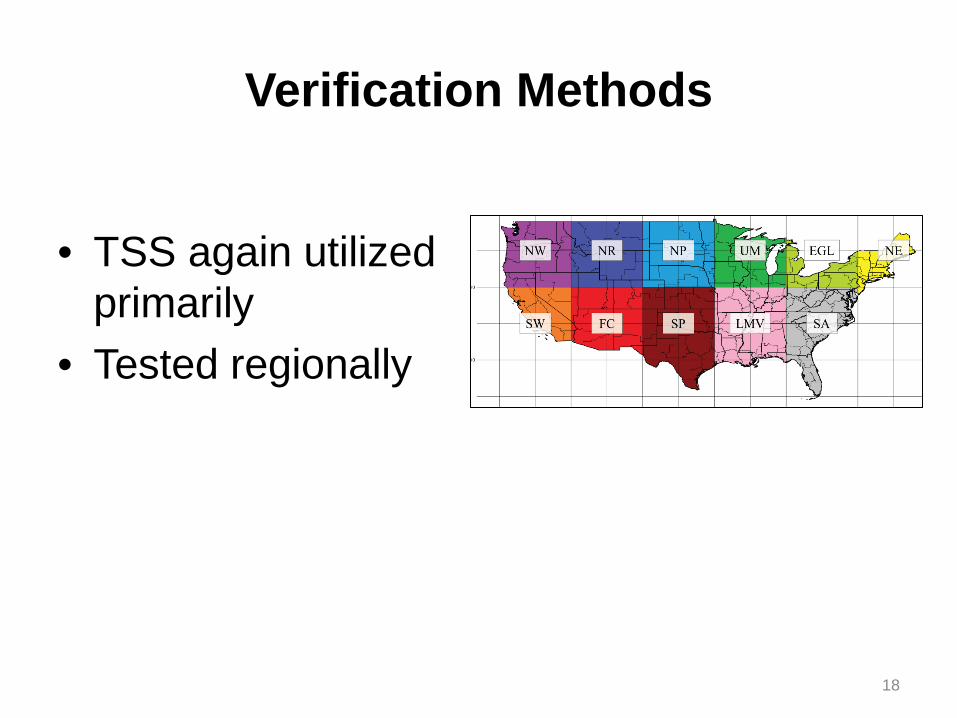
Verification Methods
• TSS again utilized primarily
• Tested regionally
18

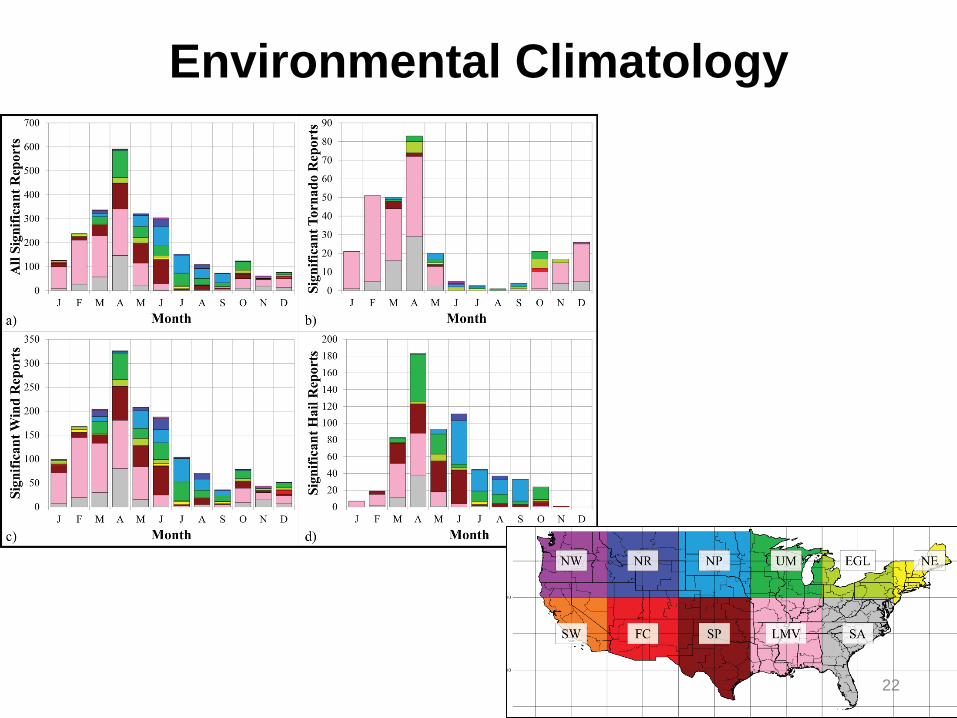
Environmental Climatology
• HSLC reports occur in nearly every CWA
• Transition from tornado/wind threat
in SE/MS Valley to wind/hail threat in Plains/Midwest
Total number of 2006-2011 HSLC significant severe reports: 2517
All significant severe
Significant tornadoes
Significant winds
Significant hail 19

Environmental Climatology
0
50
100
150
200
250
300
350
0 1 2 3 4 5 6 7 8 9 10 11 12 13 14 15 16 17 18 19 20 21 22 23
Tota
lNum
ber
ofR
epor
ts a
ndN
ulls
Local Solar Hour
HailWindsTornadoesNulls
20

Environmental Climatology
0
100
200
300
400
500
600
700
800
900
J F M A M J J A S O N D
Tota
lNum
ber
ofR
epor
ts a
ndN
ulls
Month
HailWindTornadoesNulls
21
Environmental Climatology
22

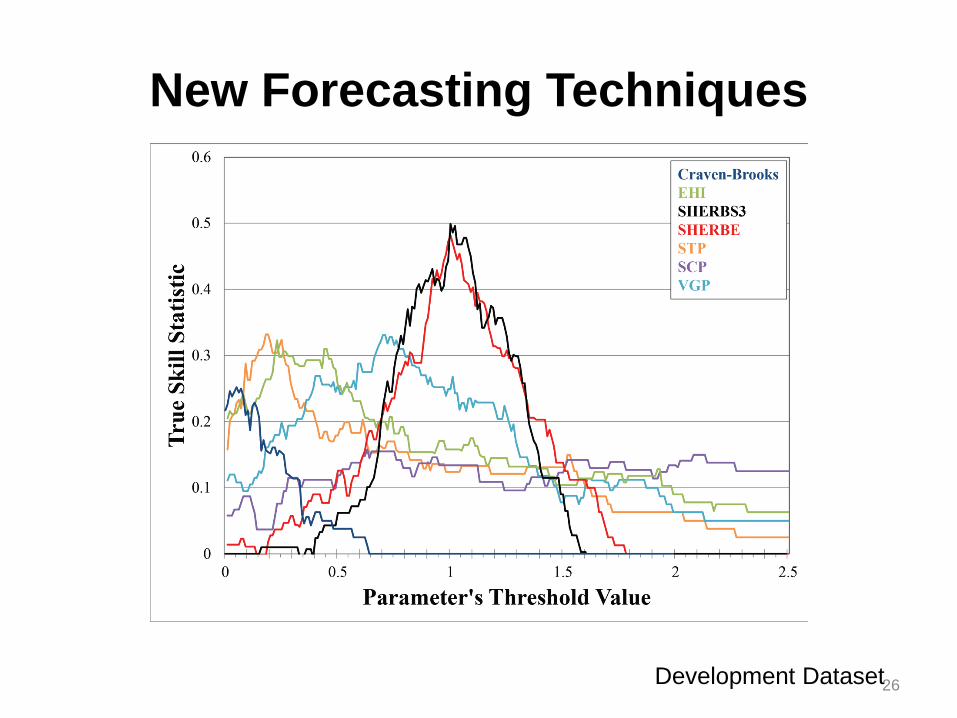
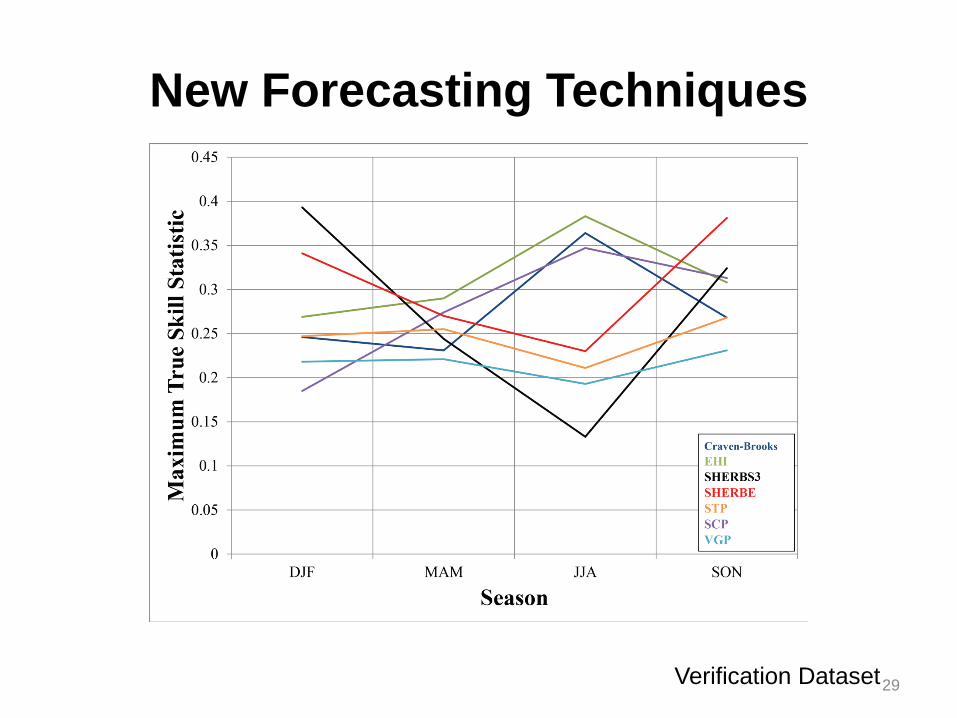
New Forecasting Techniques
• Why not use conventional composite parameters? CAPE
• How to approach creation of new parameters? Statistical, eyes wide open approach Focus on detecting favorable environments,
not forecasting convection
23

New Forecasting Techniques
• Product of low- and mid-level lapse rates and wind/shear magnitudes most skillful
• Why lapse rates? • Which wind/shear
magnitudes?
24
Launched approximately half an hour prior to significant wind event

SEVERE HAZARDS IN ENVIRONMENTS WITH REDUCED BUOYANCY PARAMETER
(0-3 KM SHEAR VERSION): SHERBS3 = (0-3 km shear magnitude / 26 m s-1) * (0-3 km lapse rate / 5.2 K km-1) * (700-500 mb lapse rate / 5.6 K km-1)
(EFFECTIVE SHEAR VERSION): SHERBE = (Effective shear magnitude / 27 m s-1) * (0-3 km lapse rate / 5.2 K km-1) * (700-500 mb lapse rate / 5.6 K km-1)
New Forecasting Techniques
25
New Forecasting Techniques
Development Dataset 26

New Forecasting Techniques
Verification Dataset 27

New Forecasting Techniques
Verification Dataset 28
New Forecasting Techniques
Verification Dataset 29
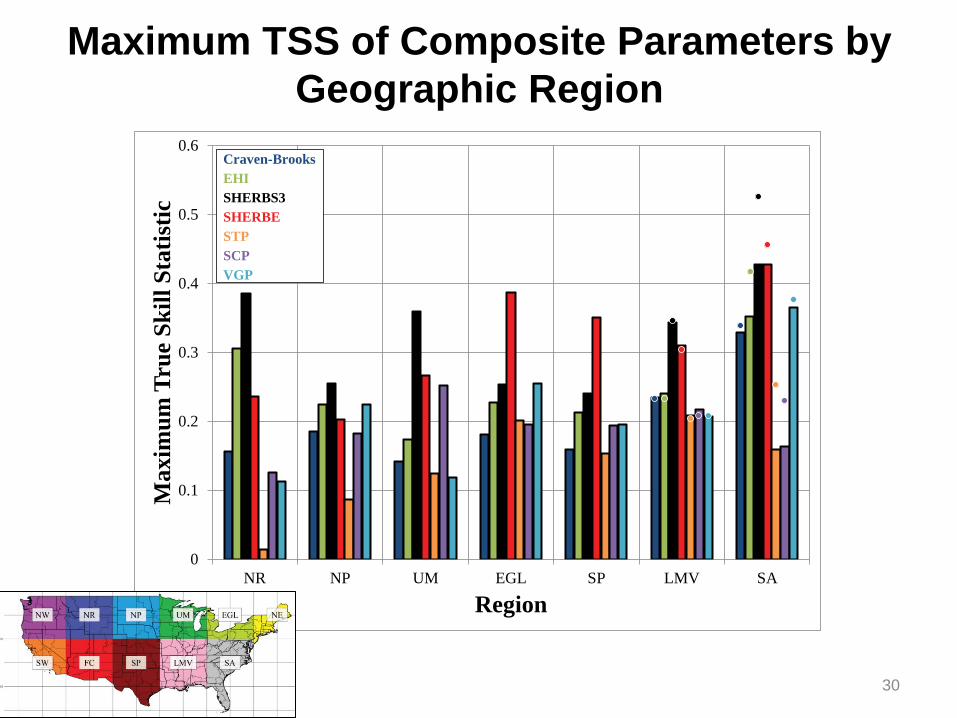
0
0.1
0.2
0.3
0.4
0.5
0.6
NR NP UM EGL SP LMV SA
Max
imum
True
Skill
Stat
istic
Region
Craven-BrooksEHISHERBS3SHERBESTPSCPVGP
30
Maximum TSS of Composite Parameters by Geographic Region

SHERBS3 Availability for Forecasters • Real-time SHERB plots from NC State Real-time RAP – http://storms.meas.ncsu.edu/users/mdparker/rap Real-time NAM – http://storms.meas.ncsu.edu/users/mdparker/nam Real-time GFS – http://storms.meas.ncsu.edu/users/mdparker/gfs • SPC SHERB mesoscale analysis plots Nationwide SHERBS3 – http://www.spc.noaa.gov/exper/mesoanalysis/s19/sherb3/sherb3.gif Nationwide SHERBE – http://www.spc.noaa.gov/exper/mesoanalysis/s19/sherbe/sherbe.gif • SHERB is expected to be added to Bufkit in an upcoming release
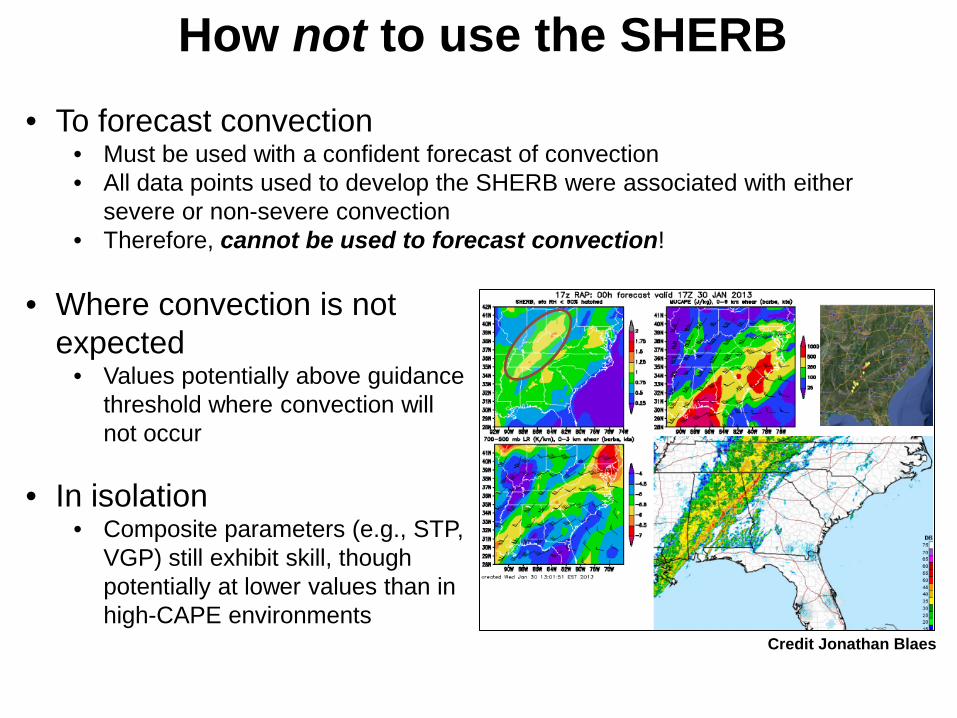
How not to use the SHERB • To forecast convection
• Must be used with a confident forecast of convection • All data points used to develop the SHERB were associated with either
severe or non-severe convection • Therefore, cannot be used to forecast convection!
• Where convection is not
expected • Values potentially above guidance
threshold where convection will not occur
• In isolation
• Composite parameters (e.g., STP, VGP) still exhibit skill, though potentially at lower values than in high-CAPE environments
Credit Jonathan Blaes

Summary
• HSLC significant severe reports can occur in multiple regimes, and may occur at all times of the year across nearly entire U.S.
• SHERBS3 and/or SHERBE improves the forecasting skill in HSLC environments
• SHERBE is best overall parameter, regardless of environment, discriminating between significant severe reports and nulls
33

Primary Conclusions
• A product of lapse rates and shear is especially useful for identifying potentially severe HSLC environments
• The SHERBE is the best composite parameter in Southern Region at discriminating between significant severe reports and nulls, regardless of environment.
34
Additional Questions/Comments? [email protected]
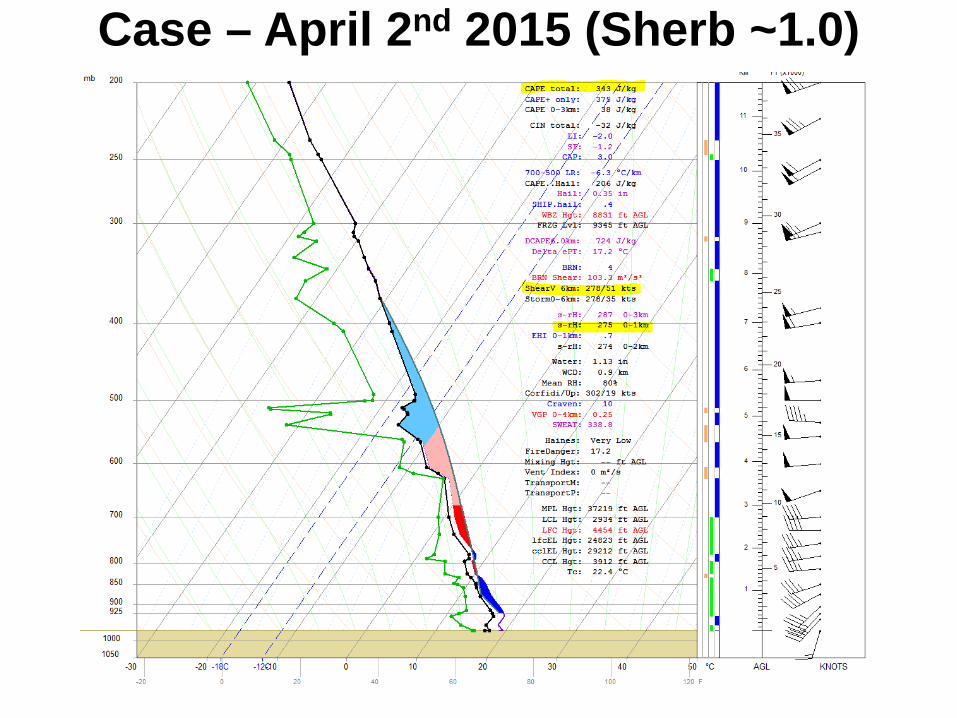
Case – April 2nd 2015 (Sherb ~1.0)

TDAY Z/SRM Loops

Oct 28 2015 NAM4km 850mb Winds (F21)

Oct 28 2015 NCAR Ensemble 850mb Winds (F21)

Oct 28 2015 NAM Fcst Sndg at KCMH

Oct 28 2015 ILN Sndg – Null (SHERB 0.51)

Jan 2012 – SHERB >1

Evolution of QLCS Mesovortex

Evolution of QLCS Mesovortex
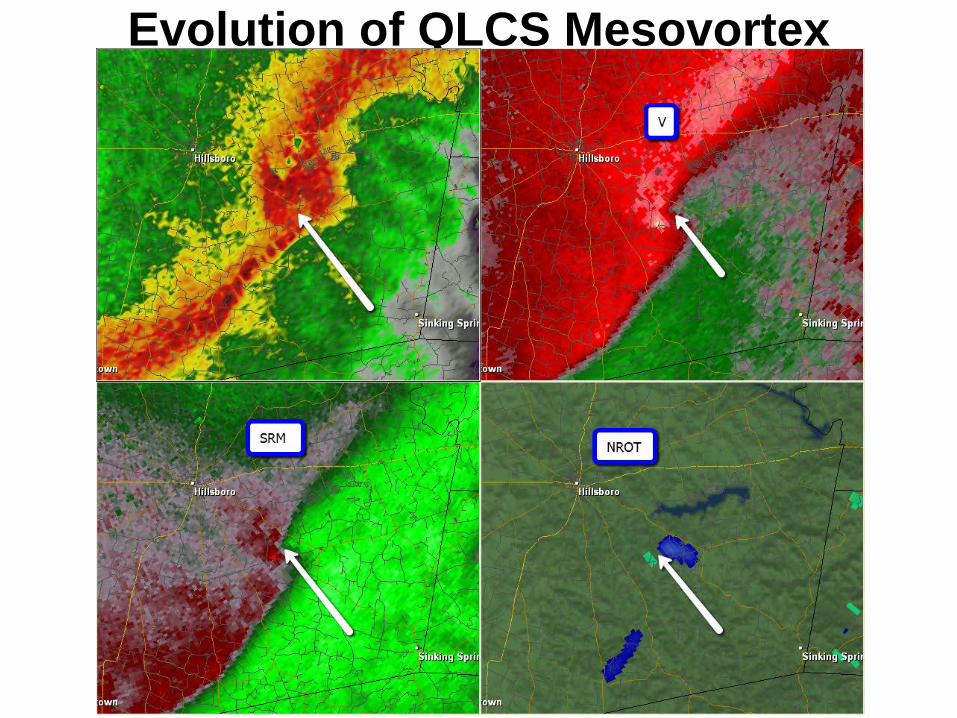
Evolution of QLCS Mesovortex
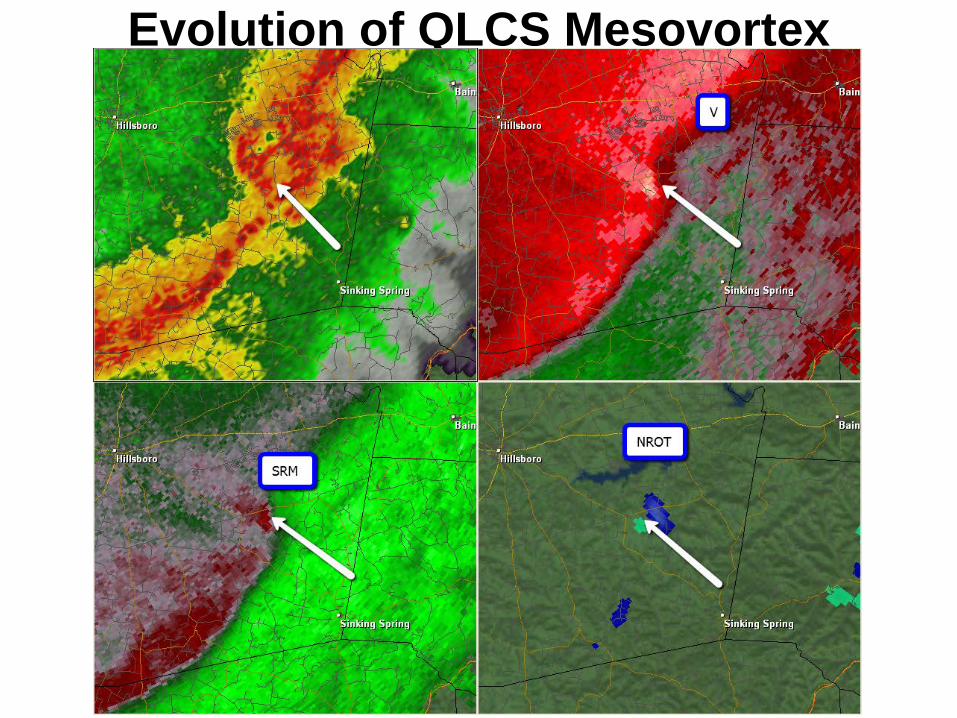
Evolution of QLCS Mesovortex

Evolution of QLCS Mesovortex

Halloween 2013 – Analogs at F72
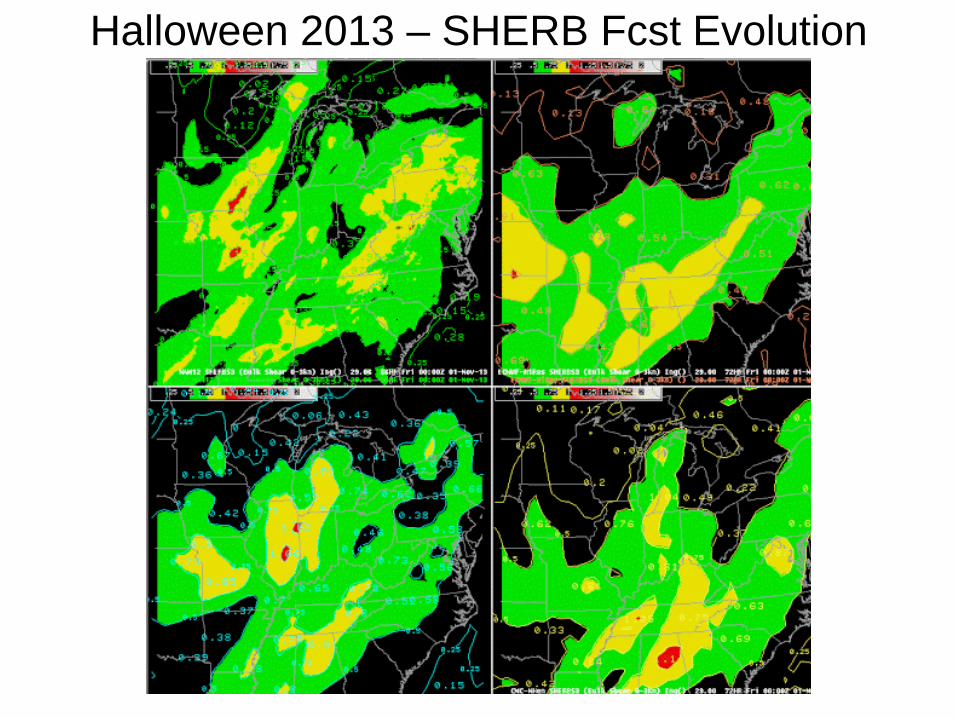
Halloween 2013 – SHERB Fcst Evolution

Scary Trick or Treat Sounding

Halloween 2013 – Storm Reports

Dec 23 2015 – NAM F39

Dec 23 2015 – SREF F39/F45

Dec 23 2015 – NAM F39 (Cntl TN)
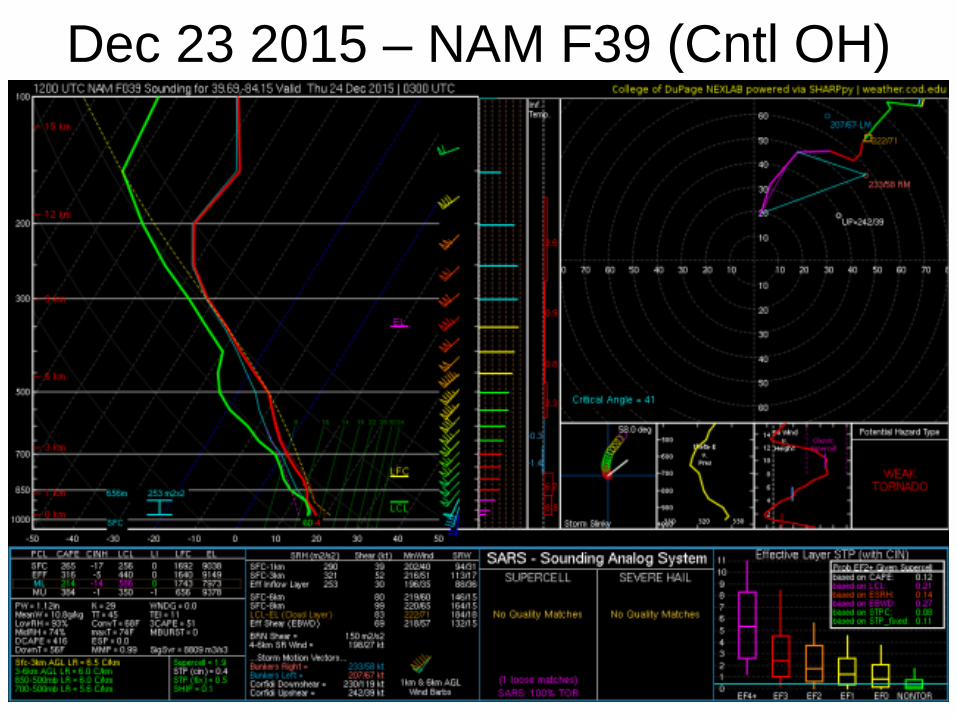
Dec 23 2015 – NAM F39 (Cntl OH)

DEC 23 2015

Nov 6th 2015 SWODY2

Nov 6th KILN Reflectivity

Nov 6th 2015 TCVG SRM
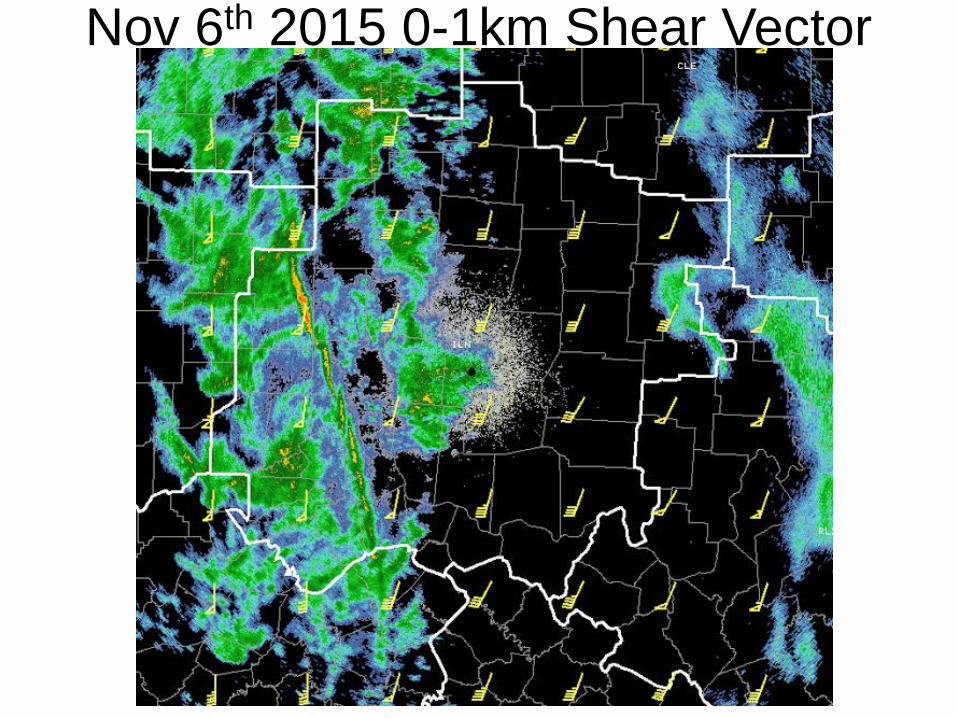
Nov 6th 2015 0-1km Shear Vector

Jun. 23, 2016: 2am – 3am
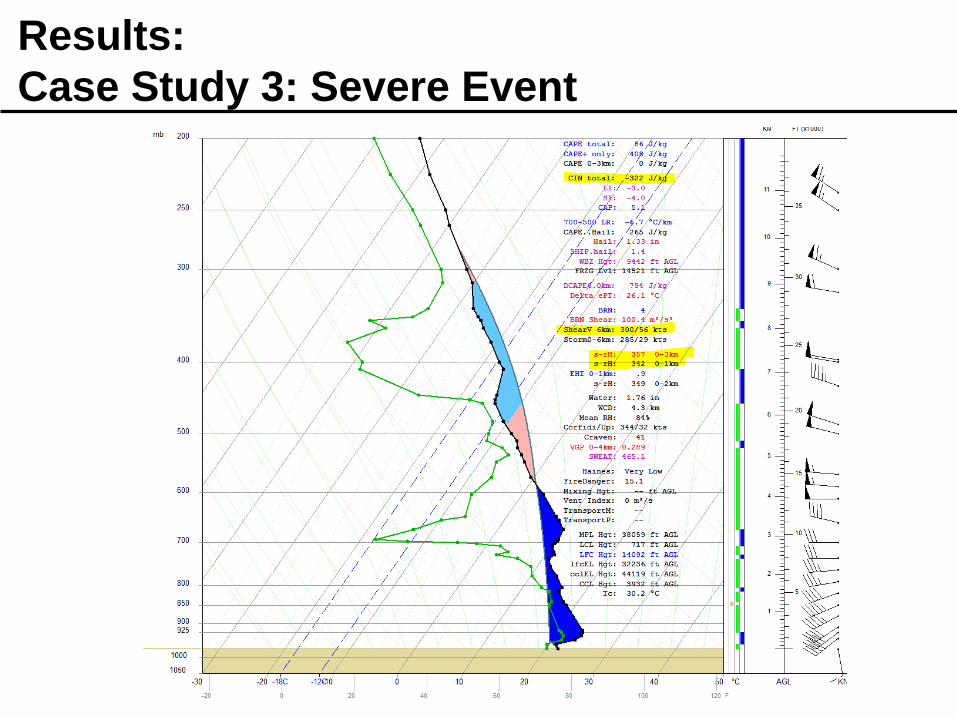
Results: Case Study 3: Severe Event
Results: Case Study 3: Severe Event

Jun. 23, 2016: 2am – 3am
Results: Case Study 3: Severe Event

Jun. 23, 2016: 2am – 3am
Results: Case Study 3: Severe Event

Jun. 23, 2016: 2am – 3am