The Hidden Component in Census-Derived Migration Data: Assessing its Size and Distribution
9
Demography, Vol. 27, No.1, February 1990 The Hidden Component in Census-Derived Migration Data: Assessing Its Size and Distribution Beryl Nicholson Centre for Scandinavian Studies, 12 Lavender Gardens, Newcastle upon Tyne NE2 3DE, England Comparison of Norwegian "linked" decennial census data with statistics compiled from 10 years' migration registrations showed that the amount of movement omitted by census data was considerable. This hidden movement was of a similar order at every administrative level, but only when total movement was considered. There was wide variation between regions, migration directions, and streams. In some cases census data misrepresented the direction of net movement. Available evidence suggests that these patterns are not confined to Norway, raising the possibility that research findings based on census-derived migration data may merely be artifacts of the data. Migration data derived from censuses and surveys that obtain information on place of residence at a previous date are known to be less comprehensive in their coverage of move- ment than those based on records of all moves, which are produced by systems of migration registration. Beyond that, little attention is given to any further deficiencies there might be in census-derived data. Of course, they might be so minor as not to affect the validity of research findings. Yet we do not know whether they are or not, for apart from limited investigations that have indicated the volume of movement that goes unrecorded in the census (e.g., Courgeau, 1979, pp. 1-29; Rees, 1977, pp. 247-272), no substantial research has been done on this question. The Present State of Knowledge A certain amount of information about the degree of adequacy of census data can be inferred from the limitations imposed by the method of compilation. We already know that census data omit some types of movement, notably repeated movement, which would be recorded by a system of continuous registration. We can deduce that an age, and probably also a sex, bias will result from the factors that render those moves hidden. What we do not know is the proportion of movement that is omitted-though indi- cations are that it is considerable (DaVanzo & Morrison, 1981, p. 93)--the degree of variation between one area and one migration stream and another, and the nature and extent of bias in the data. To investigate these questions, one needs parallel sets of data from the census and registration, and these are rarely available. When registration data exist, there is no reason to include retrospective questions on residence in the census. Only when data similar to those produced by the census have been obtained for other reasons can they be compared with registration data. This article attempts to clarify some of the methodological problems inherent in using census-derived data to measure migration on the basis of one such com- parison. Copyright © 1990 Population Association of America III
-
Upload
beryl-nicholson -
Category
Documents
-
view
213 -
download
1
Transcript of The Hidden Component in Census-Derived Migration Data: Assessing its Size and Distribution

Demography, Vol. 27, No.1, February 1990
The Hidden Component in Census-Derived MigrationData: Assessing Its Size and Distribution
Beryl NicholsonCentre for Scandinavian Studies, 12 LavenderGardens, Newcastle upon TyneNE2 3DE, England
Comparison of Norwegian "linked" decennial census data with statistics compiledfrom 10 years' migration registrations showed that the amount of movement omittedby census data was considerable. This hidden movement was of a similar order atevery administrative level, but only when total movement was considered. There waswide variation between regions, migration directions, and streams. In some casescensus data misrepresented the direction of net movement. Available evidence suggeststhat these patterns are not confined to Norway, raising the possibility that researchfindings based on census-derived migration data may merely be artifacts of the data.
Migration data derived from censuses and surveys that obtain information on place ofresidence at a previous date are known to be less comprehensive in their coverage of movement than those based on records of all moves, which are produced by systems of migrationregistration. Beyond that, little attention is given to any further deficiencies there might bein census-derived data. Of course, they might be so minor as not to affect the validity ofresearch findings. Yet we do not know whether they are or not, for apart from limitedinvestigations that have indicated the volume of movement that goes unrecorded in thecensus (e.g., Courgeau, 1979, pp. 1-29; Rees, 1977, pp. 247-272), no substantial researchhas been done on this question.
The Present State of Knowledge
A certain amount of information about the degree of adequacy of census data can beinferred from the limitations imposed by the method of compilation. We already know thatcensus data omit some types of movement, notably repeated movement, which would berecorded by a system of continuous registration. We can deduce that an age, and probablyalso a sex, bias will result from the factors that render those moves hidden.
What we do not know is the proportion of movement that is omitted-though indications are that it is considerable (DaVanzo & Morrison, 1981, p. 93)--the degree of variationbetween one area and one migration stream and another, and the nature and extent of biasin the data.
To investigate these questions, one needs parallel sets of data from the census andregistration, and these are rarely available. When registration data exist, there is no reasonto include retrospective questions on residence in the census. Only when data similar tothose produced by the census have been obtained for other reasons can they be comparedwith registration data. This article attempts to clarify some of the methodological problemsinherent in using census-derived data to measure migration on the basis of one such comparison.
Copyright © 1990 Population Association of America
III
112 Demography, Vol. 27, No.1, February 1990
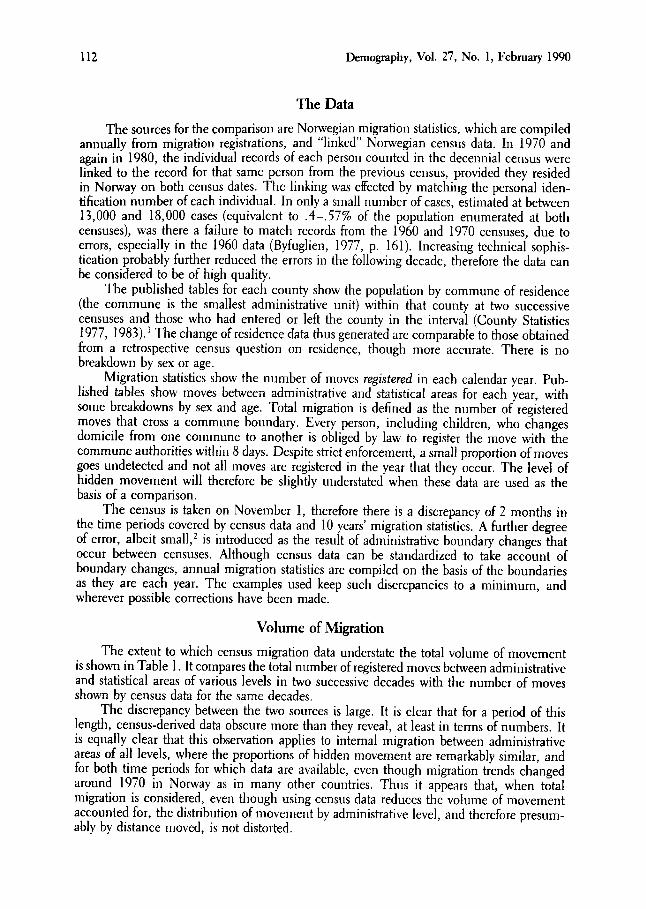
The Data
The sources for the comparison are Norwegian migration statistics, which are compiledannually from migration registrations, and "linked" Norwegian census data. In 1970 andagain in 1980, the individual records of each person counted in the decennial census werelinked to the record for that same person from the previous census, provided they residedin Norway on both census dates. The linking was effected by matching the personal identification number of each individual. In only a small number of cases, estimated at between13,000 and 18,000 cases (equivalent to .4-.57% of the population enumerated at bothcensuses), was there a failure to match records from the 1960 and 1970 censuses, due toerrors, especially in the 1960 data (Byfuglien, 1977, p. 161). Increasing technical sophistication probably further reduced the errors in the following decade, therefore the data canbe considered to be of high quality.
The published tables for each county show the population by commune of residence(the commune is the smallest administrative unit) within that county at two successivecensuses and those who had entered or left the county in the interval (County Statistics1977, 1983).1The change of residence data thus generated are comparable to those obtainedfrom a retrospective census question on residence, though more accurate. There is nobreakdown by sex or age.
Migration statistics show the number of moves registered in each calendar year. Published tables show moves between administrative and statistical areas for each year, withsome breakdowns by sex and age. Total migration is defined as the number of registeredmoves that cross a commune boundary. Every person, including children, who changesdomicile from one commune to another is obliged by law to register the move with thecommune authorities within 8 days. Despite strict enforcement, a small proportion of movesgoes undetected and not all moves are registered in the year that they occur. The level ofhidden movement will therefore be slightly understated when these data are used as thebasis of a comparison.
The census is taken on November 1, therefore there is a discrepancy of 2 months inthe time periods covered by census data and 10 years' migration statistics. A further degreeof error, albeit small.? is introduced as the result of administrative boundary changes thatoccur between censuses. Although census data can be standardized to take account ofboundary changes, annual migration statistics are compiled on the basis of the boundariesas they are each year. The examples used keep such discrepancies to a minimum, andwherever possible corrections have been made.
Volume of Migration
The extent to which census migration data understate the total volume of movementis shown in Table 1. It compares the total number of registered moves between administrativeand statistical areas of various levels in two successive decades with the number of movesshown by census data for the same decades.
The discrepancy between the two sources is large. It is clear that for a period of thislength, census-derived data obscure more than they reveal, at least in terms of numbers. Itis equally clear that this observation applies to internal migration between administrativeareas of all levels, where the proportions of hidden movement are remarkably similar, andfor both time periods for which data are available, even though migration trends changedaround 1970 in Norway as in many other countries. Thus it appears that, when totalmigration is considered, even though using census data reduces the volume of movementaccounted for, the distribution of movement by administrative level, and therefore presumably by distance moved, is not distorted.

The Hidden Component in Census-Derived Migration Data
Table 1. Levels of Migration According to Data Source and Statistical Level,1961-1970 and 1971-1980
113
Statistical unit Registration (a) Census (b) Ratio (a:b)
1961-1970
Intercommune 1,653,381' 602,451 2.74Intercounty 890,134 323,117 2.75Interregion 487,432 173,970 2.76Between communes, within counties 763,247 279,334 2.73Between counties, within regions 402,702 149,147 2.70
1971-1980
Intercommune 1,840,156 675,026 2.73Inter-trade district 1,376,718 514,714 2.67Intercounty 969,956 354,610" 2.73Between communes, within trade districts 463,438 160,312 2.89Between trade districts, within counties 406,762 160,104 2.54
Note: A list of statistical publications cited with complete references to the sources of data is available from the author.Sources: Census 1980 (1986); County Statistics (1977, 1983); District Statistics (1984); Migration Statistics (19721982); 0stby (1975, p. 29).
'See note 1." Total moved to each county. The sum of out-movers from counties was 157 less according to the published tables.
Within-Nation Variation
It does not necessarily follow, however, that the extent to which census data understatemigration will be the same in all parts of a given country or in all types of area. The availableevidence indicates that they do not.
In Table 2 the level of registered movement is compared with the level of movementshown by census data for each county and for communes within each county grouped bytype. Communes are divided into nine categories on the basis of their economic structure,as defined by the sectors in which their inhabitants are employed, population density, anddegree of centrality (Stordahl 1983, pp. 65-67). The purpose of the table is to demonstrate,as far as possible with the data available, the extent to which hidden movement varies, notto explain it. That is a separate task.
The comparison is expressedas a ratio of registered to census-derived moves. The higherthe ratio, the greater is the proportion of hidden moves. It is evident from the differencesbetween ratios for intercounty and intracounty movement that the similarity of ratios forshorter and longer distance moves in the nation as a whole is not found in all its constituentparts. The variation between counties is greater still, and between communes (for whichexchange within the same and with other counties is included), yet greater. The lowestvalue shown, 2.01 (type 3 in Telemark), indicates that almost half of the moves registeredwere also evident in the census data. The highest ratio, 3.56(type 1 in Finnmark), indicatesthat census data accounted for only slightly more than a quarter (28.1 %) of the movesregistered over 10 years. This compares with the ratio for all communes, 2.73; that is,overall, 36.5% of registered moves were included in the census data.
The table shows that there isgreater variation between counties than between communesof different economic structure and degree of centrality. The highest ratios are found inthose counties that experience the highest net out-migration, but there is no equivalentcorrespondence between counties with the highest net in-migration and low ratios. Thusone cannot conclude that the level of net loss is necessarily related to the level of hidden

- -40-T
able
2.R
atio
ofR
egis
tere
dto
Cen
sus-
Der
ived
Mov
esby
Cou
nty
and
Com
mun
eT
ype,
1971
-198
0
Com
mun
ety
peT
otal
Cou
nty
12
34
56
78
9T
otal
Intr
acou
nty
Inte
rcou
nty
0st
fold
-2.
172.
492.
29-
2.64
2.79
2.53
-2.
602.
592.
60A
kers
hus
-2.
462.
36-
-2.
492.
74-
-2.
792.
892.
67O
slo
--
--
--
2.70
--
2.70
-2.
70H
edm
ark
2.44
2.36
2.47
--
2.62
-2.
66-
2.53
2.61
2.47
Opp
land
2.79
2.67
2.49
--
2.69
2.39
2.88
2.88
2.69
2.60
2.74
Bus
keru
d2.
572.
272.
58-
-2.
662.
902.
542.
902.
732.
732.
73V
estfo
ld-
2.39
2.64
--
2.68
-2.
82-
2.71
2.79
2.62
Tel
emar
k2.
662.
582.
01-
2.45
2.71
-2.
703.
132.
632.
632.
63A
ust-
Agd
er2.
702.
692.
54-
2.69
2.80
2.60
2.92
2.82
2.83
3.08
2.63
Ves
t-A
gder
2.62
2.62
2.84
--
2.68
2.83
2.68
-2.
742.
702.
77R
ogal
and
2.51
2.36
2.91
2.59
2.53
2.34
3.06
2.77
-2.
852.
852.
76H
orda
land
2.95
2.52
2.30
2.60
2.97
2.30
3.00
2.76
2.66
2.68
2.55
2.83
0 '"S
ogn
ogF
jord
ane
2.54
2.74
-2.
732.
34-
-3.
222.
992.
722.
492.
743
Mer
eog
Rom
sdal
2.43
2.69
-2.
752.
86-
-2.
86-
2.82
2.82
2.82
~se
r-T
r0nd
elag
2.41
2.58
2.59
2.65
--
2.82
-2.
682.
702.
522.
86"t
:l
Nor
d-T
rend
elag
2.56
2.76
2.62
2.60
2.82
2.75
2.72
2.63
2.77
:r-
--
~
Nor
dlan
d2.
583.
54-
2.63
2.56
--
2.81
2.75
2.72
2.58
2.83
~T
rom
s2.
832.
73-
2.74
--
-2.
883.
132.
922.
633.
10F
innm
ark
3.56
--
3.53
3.16
--
3.11
3.36
3.13
3.08
3.22
N ."T
otal
2.63
2.63
2.70
2.88
2.68
2.66
2.77
2.80
2.89
2.73
2.56
2.74
Z 9N
ote:
The
com
mun
ety
pes
are
1,ag
ricul
tura
lco
mm
unes
;2,
nonc
entr
al,
mix
edag
ricul
tura
l,an
dm
anuf
actu
ring
com
mun
es;
3,ce
ntra
l,m
ixed
agric
ultu
ral,
and
man
ufac
turin
g-
com
mun
es;
4,fis
hing
com
mun
es;
5,no
ncen
tral
man
ufac
turin
gco
mm
unes
;6,
cent
ral
man
ufac
turin
gco
mm
unes
;7,
very
cent
ral,
mix
ed-s
ervi
ce,
and
man
ufac
turin
gco
mm
unes
;"'
l8,
rem
aini
ngm
ixed
-ser
vice
and
man
ufac
turin
gco
mm
unes
;9,
othe
rco
mm
unes
.'"C'"
Sou
rces
:C
ount
yS
tatis
tics
(197
3-19
74,
1983
);D
istr
ict
Sta
tistic
s(1
984)
;M
igra
tion
Sta
tistic
s(1
972-
1982
).... =Il' ..::! - 8
The Hidden Component in Census-Derived Migration Data 115
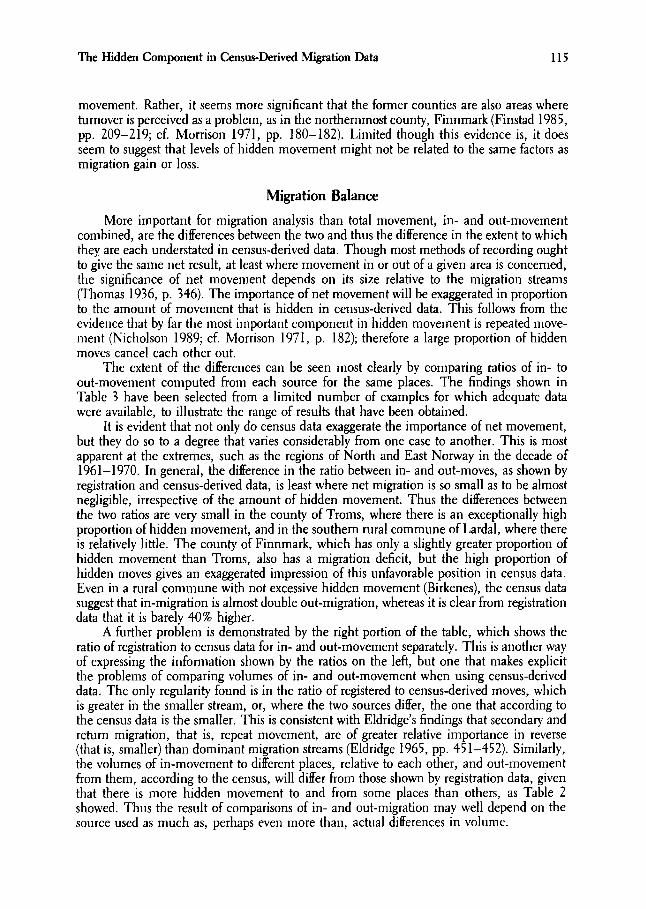
movement. Rather, it seems more significant that the former counties are also areas whereturnover is perceived as a problem, as in the northernmost county, Finnmark (Finstad 1985,pp. 209-219; cf. Morrison 1971, pp. 180-182). Limited though this evidence is, it doesseem to suggest that levels of hidden movement might not be related to the same factors asmigration gain or loss.
Migration Balance
More important for migration analysis than total movement, in- and out-movementcombined, are the differences between the two and thus the difference in the extent to whichthey are each understated in census-derived data. Though most methods of recording oughtto give the same net result, at least where movement in or out of a given area is concerned,the significance of net movement depends on its size relative to the migration streams(Thomas 1936, p. 346). The importance of net movement will be exaggerated in proportionto the amount of movement that is hidden in census-derived data. This follows from theevidence that by far the most important component in hidden movement is repeated movement (Nicholson 1989; cf. Morrison 1971, p. 182); therefore a large proportion of hiddenmoves cancel each other out.
The extent of the differences can be seen most clearly by comparing ratios of in- toout-movement computed from each source for the same places. The findings shown inTable 3 have been selected from a limited number of examples for which adequate datawere available, to illustrate the range of results that have been obtained.
It is evident that not only do census data exaggerate the importance of net movement,but they do so to a degree that varies considerably from one case to another. This is mostapparent at the extremes, such as the regions of North and East Norway in the decade of1961-1970. In general, the difference in the ratio between in- and out-moves, as shown byregistration and census-derived data, is least where net migration is so small as to be almostnegligible, irrespective of the amount of hidden movement. Thus the differences betweenthe two ratios are very small in the county of Troms, where there is an exceptionally highproportion of hidden movement, and in the southern rural commune of Lardal, where thereis relatively little. The county of Finnmark, which has only a slightly greater proportion ofhidden movement than Troms, also has a migration deficit, but the high proportion ofhidden moves gives an exaggerated impression of this unfavorable position in census data.Even in a rural commune with not excessive hidden movement (Birkenes), the census datasuggest that in-migration is almost double out-migration, whereas it is clear from registrationdata that it is barely 40% higher.
A further problem is demonstrated by the right portion of the table, which shows theratio of registration to census data for in- and out-movement separately. This is another wayof expressing the information shown by the ratios on the left, but one that makes explicitthe problems of comparing volumes of in- and out-movement when using census-deriveddata. The only regularity found is in the ratio of registered to census-derived moves, whichis greater in the smaller stream, or, where the two sources differ, the one that according tothe census data is the smaller. This is consistent with Eldridge's findings that secondary andreturn migration, that is, repeat movement, are of greater relative importance in reverse(that is, smaller) than dominant migration streams (Eldridge 1965, pp. 451-452). Similarly,the volumes of in-movement to different places, relative to each other, and out-movementfrom them, according to the census, will differ from those shown by registration data, giventhat there is more hidden movement to and from some places than others, as Table 2showed. Thus the result of comparisons of in- and out-migration may well depend on thesource used as much as, perhaps even more than, actual differences in volume.
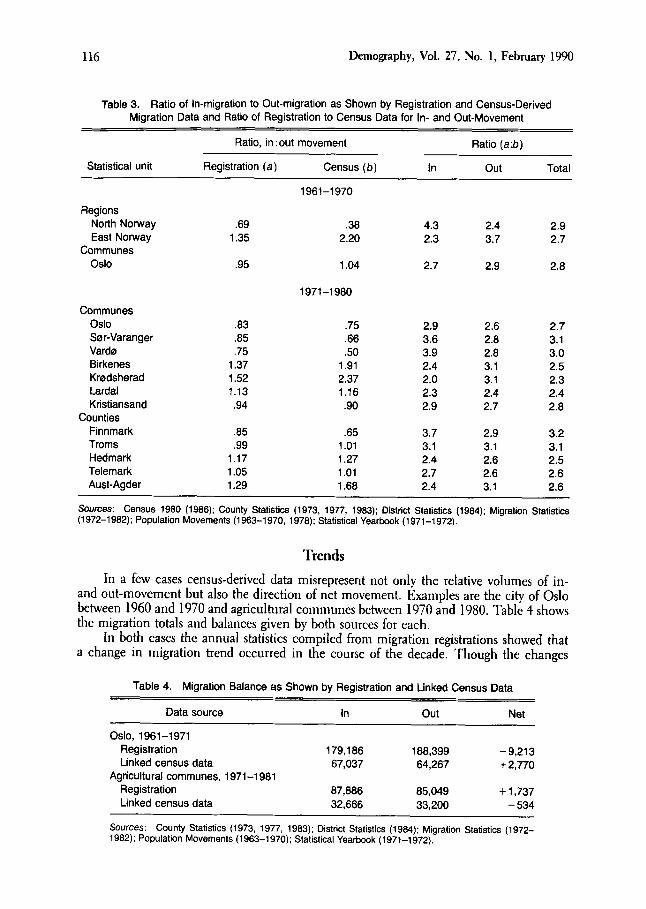
116 Demography, Vol. 27, No.1, February 1990
Table 3. Ratio of In-migration to Out-migration as Shown by Registration and Census-DerivedMigration Data and Ratio of Registration to Census Data for In- and Out-Movement
Ratio, in: out movement Ratio (a:b)
Statistical unit Registration (a) Census (b) In Out Total
1961-1970
RegionsNorth Norway .69 .38 4.3 2.4 2.9East Norway 1.35 2.20 2.3 3.7 2.7
CommunesOslo .95 1.04 2.7 2.9 2.8
1971-1980
CommunesOslo .83 .75 2.9 2.6 2.7Sar-Varanqer .85 .66 3.6 2.8 3.1Varde .75 .50 3.9 2.8 3.0Birkenes 1.37 1.91 2.4 3.1 2.5Kmdsherad 1.52 2.37 2.0 3.1 2.3Lardal 1.13 1.16 2.3 2.4 2.4Kristiansand .94 .90 2.9 2.7 2.8
CountiesFinnmark .85 .65 3.7 2.9 3.2Troms .99 1.01 3.1 3.1 3.1Hedmark 1.17 1.27 2.4 2.6 2.5Telemark 1.05 1.01 2.7 2.6 2.6Aust-Agder 1.29 1.68 2.4 3.1 2.6
Sources: Census 1980 (1986); County Statistics (1973, 1977, 1983); District Statistics (1984); Migration Statistics(1972-1982); Population Movements (1963-1970, 1978); Statistical Yearbook (1971-1972).
Trends
In a few cases census-derived data misrepresent not only the relative volumes of inand out-movement but also the direction of net movement. Examples are the city of Oslobetween 1960 and 1970 and agricultural communes between 1970 and 1980. Table 4 showsthe migration totals and balances given by both sources for each.
In both cases the annual statistics compiled from migration registrations showed thata change in migration trend occurred in the course of the decade. Though the changes
Table 4. Migration Balance as Shown by Registration and Linked Census Data
Data source In Out Net
Oslo, 1961-1971Registration 179,186 188,399 -9,213Linked census data 67,037 64,267 +2,770
Agricultural communes, 1971-1981Registration 87,886 85,049 +1,737Linked census data 32,666 33,200 -534
Sources: County Statistics (1973, 1977, 1983); District Statistics (1984); Migration Statistics (19721982); Population Movements (1963-1970); Statistical Yearbook (1971-1972).
The Hidden Component in Census-Derived Migration Data 117
became immediately evident in registration data, in the census-derived data the opposingtrends within one time period canceled each other out, giving a false impression of continuityand indicating that such changes can remain hidden for several years in census data.
The manner in which change takes place is also subject to distortion in census-deriveddata, as exemplified by the city of Oslo in the 1960s and the 1970s. Linked census datasuggest that there was an abrupt change, whereas registration data for individual years (notshown) show that there was a gradual transition. The data for Oslo in Table 3 also showthat the exaggeration of net relative to gross movement in census-derived data results ina corresponding exaggeration of the degree of change in the trend. Thus it is likely thatthere was a similar exaggeration of the phenomenon of turnaround in counties wheremigration data are derived from the census (cf. Campbell & Garkovich 1984, pp.91-92).
Wider Relevance
Though the findings reported here refer to one particular nation and a relatively shorttime period, research elsewhere demonstrates their general relevance. That hidden movesare unevenly distributed between places and migration streams is a necessary corollary ofMorrison's observation in the United States that "variations in metropolitan mobility ratesare ... the product of repeated movement" (Morrison 1971, p. 182). Likewise Eldridge'sdata suggest that hidden movement is differentially distributed between dominant and reversemigration (Eldridge 1965, pp. 451-452). Rees's comparison of interregional migration inEngland and Wales, where he compared residence 5 years and 1 year prior to the 1971census, also indicates variation in the level of hidden movement between streams and regions(Rees 1977, p. 248).
Nor is the scale of hidden movement identified simply due to the length of the intercensal period, which was longer than that usually covered by retrospective census questions on residence. Data for shorter periods (Courgeau 1979, p. 26; Geschwind 1957,p. 614; Nicholson 1989; Rees 1977, p. 248; Tucker & Urton 1987, p. 267) suggestthat even over 5 years, up to half of the moves that occur do not appear in census data.These findings also show a remarkable consistency in the level of hidden movementbetween counties.
Conclusion
Movement that is recorded by a registration system but is hidden in data derived fromcensuses is clearly no mere "add-on" to all migration streams that can be ignored for mostpractical purposes. Only when the totality of moves within a nation is considered, as inTable 1, are levels of hidden movement similar, irrespective of the size of statistical unit,and thus, apparently, of distance moved. When data are organized by migration direction(in or out) or by individual streams, as they commonly are, or when total movement inparticular areas is considered, levels of hidden movement vary, in some cases considerably.
These variations imply that research findings based on census-derived migration datamay be distorted. This applies to all census data on migration, including net values, thoughit is especially true in the case of individual streams and still more so when consideringsubgroups within streams. Though it has not been dealt with here, the literature on repeatmigration makes it clear that the proportion of hidden movement is likely to vary still morebetween subgroups of the population, such as age groups (Eldridge 1965, pp. 451-452;Reisz 1976, p. 71; Tucker & Urton 1987, p. 267), than for the population as a whole. Itmust be a matter of some importance to seek further clarification of the extent of hiddenmovement in census-derived migration data and the nature of its variation.

118
Notes
Demography, Vol. 27, No. I, February 1990
I In 1980 there were 454 communes, with from 265 (Utsira) to 451,789 (Oslo) inhabitants anda median population of just under 5,000. There are 18 counties plus the city of Oslo, a county in itsown right. The total population of Norway was 4,091,132 (Population 1981, p. 31).
2 In the mid-1960s many commune boundaries were changed. Only data that could be adjustedto allow for the changes have been used for this period. In Table 1 the number of moves betweencommunes from 1961 to 1970 was estimated by dividing the number of moves recorded each year bythe mobility rate (moves per thousand of the median population), then multiplying by a correctedmobility rate for that year. The corrected mobility rate is the mobility rate that the Central StatisticalBureau estimated would have obtained had commune boundaries in the respective years been as theywere on January 1, 1972, when there were 444 communes (0stby 1975, p. 29). The method ofcalculating the corrected mobility rate was not specified.
Acknowledgments
The volume of data drawn on in this article is due in no small measure to the generosity of the NorwegianCentral Statistical Bureau (Statistisk Sentralbyra). I would like to express my appreciation for their cooperation.Without it this article could not have been written. Willis J. Goudy, Daniel Courgeau, Larry Long, and severalanonymous reviewers made valuable comments on earlier drafts.
[Received April 1988. Revised August 1989.]
References
Byfuglien, J. (1977). "Hva forteller folketellingene 1960 og 1970 om befolkningens skifte av bosted i perioden?"Plan og Arbeid, 4, 161-167.
Campbell, R. R., & Garkovich, L. (1984). "Turnaround Migration as an Episode of Collective Behavior." RuralSociology, 49, 89-105.
[Census 1980]. (1986). Folke- og bustadielnng 1980 (Vol. 4). Oslo: Central Bureau of Statistics.[County Statistics]. (1973-1974). Statistisk fylkeshefte 1973 (18 vols.). Oslo: Central Bureau of Statistics.--. (1977). Statistisk fylkeshefte 1977(18 vols.). Oslo: Central Bureau of Statistics.--. (1983). Statistisk fylkeshefte 1983 (18 vols.). Oslo: Central Bureau of Statistics.Courgeau, D. (1979). "Migrants and Migrations." Population Selected Papers No.3. [Translation of Population
(1973), 28, 511- 537.]DaVanzo, J. S., & Morrison, P. A. (1981). "Return and Other Sequences of Migration in the United States."
Demography, 18, 85-101.[District Statistics]. (1984). Nyedistriktstall (for Akershus and Oslo, Hedmark, and Oppland), Oslo: Central Bureau
of Statistics.Eldridge, H. T. (1965). "Primary, Secondary, and Return Migration in the United States, 1955-60." Demography,
2,444-455.Finstad, N. (ed.). (1985). Flyttingog flyttegrunner-Finnmarksflyttere, Flytting fra Finnmark Prosjektrapport No.
7. Bode: Nordlands Distriktshegskole.Geschwind, H. (1957). "Inrikes omflyttning 1951-1955." Statistisk tidskrift, new ser., 6, 607-614.[Migration Statistics]. (1972-1982). Flyttestatistikk (annual). Oslo: Central Bureau of Statistics.Morrison, P. A. (1971). "Chronic Movers and the Future Redistribution of Population: A Longitudinal Analysis."
Demography, 8, 171-184.Nicholson, B. (1989). "Length of lnter-censal Period and the Scale of Omission in Census Migration Data."
Unpublished manuscript, Centre for Scandinavian Studies, Newcastle upon Tyne, UK.0stby, L. (1975). Flyttingene i norge 1971 og 1949-73, Statistiske Analyser No. 13. Oslo: Statistisk Sentralbyra.[Population]. (1981). Folketallet i kommunene 1980-1981. Oslo: Central Bureau of Statistics.[Population Movements]. (1963-1970). Folkemengdens bevegelse (annual). Oslo: Central Bureau of Statistics.--. (1978). Folkemengdens bevegelse: Oversikt 1971-1975, Statistiske Analyser No. 36. Oslo: Central Bureau
of Statistics.Rees, P. H. (1977). "The Measurement of Migration From Census Data and Other Sources." Environment and
Planning, Ser. A, 9, 247-272.Reisz, B. A. (1976). Flytting og levevilkdr, NIBR Arbeidsrapport 31/76. Oslo: Norsk institutt for by- og region
forskning.

The Hidden Component in Census-Derived Migration Data 119
[Statistical Yearbook]. (1971-1972). Statistisk ilrbok (annual). Oslo: Central Bureau of Statistics.Stordahl, E. (1983). Flyttemenstre: Norge 1971-1974, Sarnfunnsekonomiske Studier 50. Oslo: Statistisk Sentral
byra,Thomas, D. S. (1936). "Internal Migrations in Sweden: A Note on Their Extensiveness as Compared With Net
Migration Gain and Loss." American [oumal of Sociology, 42, 345-357.Tucker, C. J., & Urton, W. L. (1987). "The Frequency of Geographic Mobility: Findings From the National
Health Interview Survey." Demography, 24, 265-270.