THE HETEROGENEOUS PERCEPTION OF TRANSIT SERVICE … · THE HETEROGENEOUS PERCEPTION OF TRANSIT...
27
THE HETEROGENEOUS PERCEPTION OF TRANSIT SERVICE QUALITY by Laura Eboli and Gabriella Mazzulla Scientific Seminar SIDT 2011: “ENERGY, ENVIRONMENT AND INNOVATION IN SUSTAINABLE TRANSPORT SYSTEMS"
-
Upload
phamnguyet -
Category
Documents
-
view
215 -
download
1
Transcript of THE HETEROGENEOUS PERCEPTION OF TRANSIT SERVICE … · THE HETEROGENEOUS PERCEPTION OF TRANSIT...

THE HETEROGENEOUS PERCEPTION
OF TRANSIT SERVICE QUALITY
by Laura Eboli and Gabriella Mazzulla
Scientific Seminar SIDT 2011:
“ENERGY, ENVIRONMENT AND
INNOVATION IN SUSTAINABLE
TRANSPORT SYSTEMS"

Private car and public transport
Demand distribution among transport modes - 2000-2008
Percentages
2000 2001 2002 2003 2004 2005 2006 2007 2008
Walk or bike 25,1 26,9 26,8 25,7 26,0 24,3 22,0 20,5 21,0
Motorized modes 74,9 73,1 73,2 74,3 74,0 75,7 78,0 79,5 79,0
Motorcycle 7,2 7,8 6,1 6,9 7,3 6,2 5,3 5,6 5,7
Private car 80,0 79,3 79,7 79,8 79,0 81,4 83,2 82,3 81,4
Public transport 12,8 12,9 14,2 13,3 13,7 12,4 11,5 12,1 12,9
Total 100,0 100,0 100,0 100,0 100,0 100,0 100,0 100,0 100,0
Source: Isfort (Istituto Superiore di Formazione e Ricerca per i Trasporti, Observatory “Audimob” about mobility.

Impacts on the environment
Road accidents
Noise pollution
Air pollution
Traffic congestion

Transit service quality
Overcrowded bus
Long waiting times at bus stops
Old vehicles

Service quality attributes
Service quality aspect Description Determinants
Service performanceBasic coverage of the service by geography, time, and
mode
path, number of bus stops and distance between bus stops,
location of the bus stops, service frequency, daily service time,
travel time, need for transfers
Service reliability Ability of the transit system to adhere schedulingpunctuality of runs that come on time, regularity of runs that come
on schedule, wait time when transferring
ComfortPhysical comfort regarding vehicles and ambient
conditions
availability of seating on board, smoothness of the bus ride,
comfort of the seats, degree of crowding on bus, comfortable
temperatures on bus, availability of handrails/grab bars,
availability of shelter, benches and illumination at stops
Cleanliness Physical condition of vehicles and facilitiescleanliness of the bus interior, cleanliness of the bus exterior, buses
clean of graffiti, cleanliness of seating, shelters clean of graffiti
Safety
Degree of safety from crime or accidents and the feeling
of security resulting from that and other psychological
factors
safety from crime while riding, safety from crimes at bus stops,
safety related to the behaviour of other persons, safety related to
the bus operation, safety from accidents
FareCharacteristics regarding the monetary cost of journey
by bus
cost of a one-way ride, cost of a transfer, availability of discounted
fares (e.g. students), availability of volume discounts (e.g. monthly
passes), cost of parking at bus stops
InformationAvailability of information pertinent to the planning
and execution of a journey
availability of schedule/maps and announcements on bus,
availability of schedule/maps at bus stops, availability of printed
schedules, availability of information by telephone or internet
Customer careElements needed to make the journey easier and more
pleasant
courtesy/helpfulness of ticket agents, courtesy/knowledge of
conductors/drivers, personnel appearance, ease of purchasing
tickets, ease of paying fare
Environmental impactsEffects on the environment resulting from transit in
terms of pollution, infrastructure and natural resources
emissions, noise, visual pollution, vibration, dust and dirt, odour,
waste, effect of vibrations on road, capacity demand, disruption,
energy, space
Transit service quality

The reasons of
heterogeneity
in passengers’
perceptions
Different attitudes of the users towards the
use of transit services
Qualitative nature of some service aspects
User social background
Passengers’ heterogeneity

Discrete choice models
jjnInformatio
jFarejsCleanlinesjCrowding
jStopjyReliabilitjFrequencyj
nInformatio
FaresCleanlinesCrowding
StopyReliabilitFrequencyU
)
(
jnnj XXXU )...( 2211
Service quality measure:
General utility function:

Different ways
for accounting
for passengers’
heterogeneity
Recognising that the underlying distribution
of preferences is continuous
Mixed Logit models (ML)
Introducing some socio-demographic
characteristics as attributes in the utility
functions
Multinomial Logit models (MNL)
Considering individual behaviour
depending on latent heterogeneity that
varies with unobserved factors
Latent Class models (LCM)
Passengers’ heterogeneity

The proposed research work
Summary
1Literature review of the studies analysing heterogeneity in bus
passengers’ perceptions about service quality factors
2 Experimental context
3 Proposed Logit models: MNL, ML, LCM
4 Discussions of the results and conclusions

Literature study Methodology Findings
Prioni, P. and Hensher, D.A. (2000)
Measuring service quality in scheduled bus
services. Journal of Public Transportation,
3(2), 51-74.
Hensher, D.A.; Prioni, P. A service quality
index for a area-wide contract performance
assessment regime. J Transport Econ Policy
2002, vol 36(1), 93-113.
An SP experiment was proposed to the passengers of some
private bus operators in New South Wales (Australia).
In this experiment the interviewed users made a choice
between the bus service currently used by the interviewed
person and some alternative services characterized by some
service quality attributes.
The choice data were used to calibrate an MNL model.
The authors introduced in the models some service quality
aspects such as reliability, frequency, walking distance to the
bus stops, travel time, comfort on board, safety, and so on.
Heterogeneity among users was considered by introducing
socio-economic characteristics such as personal income, age,
gender and car availability.
The authors found that individuals on higher incomes
and of more years were more likely to prefer the
levels of service offered by the existing trip than by
the alternative packages.
What this suggests is that as individuals age and
increase their income, they see existing service quality
as increasingly satisfying their requirements for service
quality.
Alternatively it is the younger and those on lower
incomes that see a greater need for improved service
quality.
Car availability was not statistically significant.
Service quality analysis based on discrete choice modelling
Heterogeneity by introducing socio-economic characteristics in the MNL models

Literature study Methodology Findings
dell’Olio L, Ibeas A, Cecìn, P. 2010a. The
quality of service desired by public transport
users. Transport Policy 18(1): 217-227.
Different groups of users as a function of the socio-economic
characteristics are considered.
The work evaluates how bus users perceive the quality of their
public transport service.
The perception of quality is shown to change with the
category of user.
The variables with greatest weight are: reliability of
service (27.6%), waiting time (23.8%) and comfort
(17.1%).
dell’Olio L, Ibeas A, Cecìn P. 2010b.
Modelling user perception of bus transit
quality. Transport Policy 17: 388-397.
The analysis is carried out with different categories of users
and potential users (those people not currently using public
transport).
Waiting time, cleanliness and comfort are shown to be
the public transport variables that users most valued,
but the degree to which they are valued varies
according to the category of user.
Variables such as driver kindness, bus occupancy and
journey time are generally given less weight.
The first two attributes vary little by user category,
but some variability appears for journey time.
For potential users the more important variables when
defining expected quality from public transport are
waiting time, journey time and above all, level of
occupancy.
Heterogeneity by considering different groups of users
Service quality analysis based on discrete choice modelling
Literature study Methodology Findings
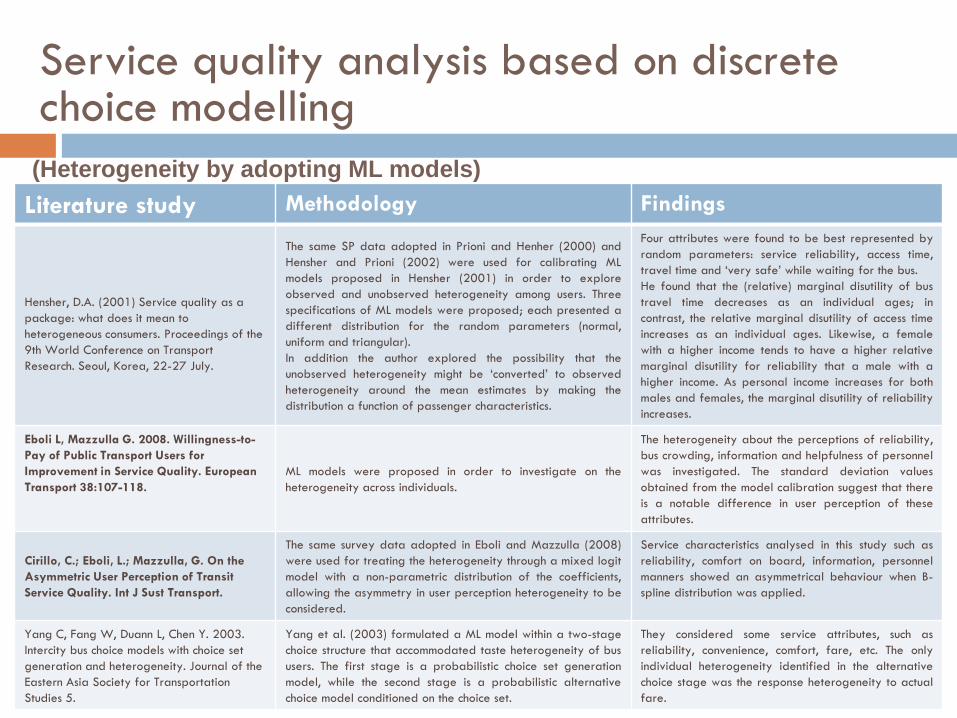
Hensher, D.A. (2001) Service quality as a
package: what does it mean to
heterogeneous consumers. Proceedings of the
9th World Conference on Transport
Research. Seoul, Korea, 22-27 July.
The same SP data adopted in Prioni and Henher (2000) and
Hensher and Prioni (2002) were used for calibrating ML
models proposed in Hensher (2001) in order to explore
observed and unobserved heterogeneity among users. Three
specifications of ML models were proposed; each presented a
different distribution for the random parameters (normal,
uniform and triangular).
In addition the author explored the possibility that the
unobserved heterogeneity might be ‘converted’ to observed
heterogeneity around the mean estimates by making the
distribution a function of passenger characteristics.
Four attributes were found to be best represented by
random parameters: service reliability, access time,
travel time and ‘very safe’ while waiting for the bus.
He found that the (relative) marginal disutility of bus
travel time decreases as an individual ages; in
contrast, the relative marginal disutility of access time
increases as an individual ages. Likewise, a female
with a higher income tends to have a higher relative
marginal disutility for reliability that a male with a
higher income. As personal income increases for both
males and females, the marginal disutility of reliability
increases.
Eboli L, Mazzulla G. 2008. Willingness-to-
Pay of Public Transport Users for
Improvement in Service Quality. European
Transport 38:107-118.
ML models were proposed in order to investigate on the
heterogeneity across individuals.
The heterogeneity about the perceptions of reliability,
bus crowding, information and helpfulness of personnel
was investigated. The standard deviation values
obtained from the model calibration suggest that there
is a notable difference in user perception of these
attributes.
Cirillo, C.; Eboli, L.; Mazzulla, G. On the
Asymmetric User Perception of Transit
Service Quality. Int J Sust Transport.
The same survey data adopted in Eboli and Mazzulla (2008)
were used for treating the heterogeneity through a mixed logit
model with a non-parametric distribution of the coefficients,
allowing the asymmetry in user perception heterogeneity to be
considered.
Service characteristics analysed in this study such as
reliability, comfort on board, information, personnel
manners showed an asymmetrical behaviour when B-
spline distribution was applied.
Yang C, Fang W, Duann L, Chen Y. 2003.
Intercity bus choice models with choice set
generation and heterogeneity. Journal of the
Eastern Asia Society for Transportation
Studies 5.
Yang et al. (2003) formulated a ML model within a two-stage
choice structure that accommodated taste heterogeneity of bus
users. The first stage is a probabilistic choice set generation
model, while the second stage is a probabilistic alternative
choice model conditioned on the choice set.
They considered some service attributes, such as
reliability, convenience, comfort, fare, etc. The only
individual heterogeneity identified in the alternative
choice stage was the response heterogeneity to actual
fare.
(Heterogeneity by adopting ML models)
Service quality analysis based on discrete choice modelling

The experimental context
Urban bus service
1. Covered distance 11 km
2. Number of stops 19
3. Daily service time 17 hour (from 7.30 a.m. till 12.30 p.m.)
4. Service frequency2 runs/hour in peak hours (7.30-8.30 a.m.;
11a.m.-2 p.m.; 6-9 p.m.) 1 run/hour (no peak hours)
5. Ticket cost
(one-way)0.77 cents
6. Daily passengers 8,000
The transit services analysed

The experimental context
Socio-economic characteristic Results
1. Sex 52% of public transport users are women
2. Age
11% are over 24 years old, 43% are under 20 years old, and the
most numerous group is formed of users aged between 21 and 24
representing 46% of the total
3. Driving license 83% have a driving license
4. Car ownership92% do not have their own car, therefore they have to use public
transport
5. Incomethe most representative group belongs to a middle income level,
while only 15% of people belongs to an upper income class
The sample (320 university students)

The experimental contextThe SP experiment
Service quality attributes Levels of variation
Walking distance to bus stop same as now (1); 10 minutes more (0) measured in minutes
Service frequency every 15 minutes (1); same as now (0)
Schedule reliability on time (1); late (0)
Bus stop facilities bus shelter, seats and lighting (1); no shelter, no seats, no lighting (0)
Bus crowding No overcrowded (1); overcrowded (0)
Cleanliness of interior clean enough (1); not clean enough (0)
Fare 25% more than the current fare (1); same as now (0) measured in Euros
Information at the bus stoptimetable, map, announcement of delays (1); no timetable, no map, no
announcement (0)
Personnel attitude very friendly (1); very unfriendly (0)

The experimental contextThe SP exercise
Attributes Current service Service bus A Service bus B
Walking distance to
the bus stopsame as now 10 minutes more same as now
Frequency same as now same as now every 15 minutes
Reliability on time late late
Bus stop facilitiesno shelter, no seats, no
lighting
Bus shelter, seats and
lighting
no shelter, no seats, no
lighting
Bus crowding overcrowded overcrowded no overcrowded
Cleanliness clean enough clean enough not clean enough
Fare same as now same as now25% more than the
current fare
Informationno timetable, no map, no
announcement of delays
timetable, map,
announcement of delays
no timetable, no map, no
announcement of delays
Transit personnel
attitudevery friendly very friendly very unfriendly

ModelsMathematical formulation
Multinomial Logit Model:
jjPerjInfjFare
jCleanjCrowjStopjReljFreqjWTimeij
PerInfFare
CleanCrowStopRelFreqWTimeU
)
(
j
iji
iji
ijx
xP
exp
exp

ModelsResults
Variable est. (t-stat) est. (t-stat)
Walking distance to bus stop -0.147 (-8.5) -0.098 (-4.1)
Service frequency 2.693 (11.4) 2.645 (11.2)
Schedule reliability 1.411 (9.2) 1.226 (7.7)
Bus stop facilities 0.623 (4.0) 0.562 (3.7)
Bus crowding 0.905 (4.8) 0.619 (3.3)
Cleanliness of interior 0.909 (6.3) 0.748 (5.0)
Fare -8.549 (-8.4) -5.349 (-4.0)
Information at bus stops 0.561 (3.6) 0.535 (3.5)
Personnel attitude 0.515 (3.6) 0.420 (2.9)
Gender 0.314 (1.7)
Car Availability 0.432 (2.0)
Log-likelihood at zero -695.421 -695.421
Log-likelihood (final) -456.56 -457.22
R-squared 0.357 0.343
Multinomial Logit Model:

ModelsResults
MNL Gender
Female Male
Variable est. (t-stat) est. (t-stat)
Walking distance to bus stop -0.156 (-6.6) -0.132 (-5.2)
Service frequency 2.584 (8.3) 2.794 (7.9)
Schedule reliability 1.256 (5.7) 1.502 (7.1)
Bus stop facilities 0.452 (2.1) 0.823 (3.5)
Bus crowding 0.897 (3.4) 0.984 (3.7)
Cleanliness of interior 0.984 (4.7) 0.903 (4.4)
Fare -8.576 (-6.4) -7.910 (-5.3)
Information at bus stops 0.831 (3.9) 0.307 (1.3)
Personnel attitude 0.560 (2.9) 0.580 (2.7)
Log-likelihood at zero -369.134 -333.978
Log-likelihood (final) -238.624 -220.769
R-squared 0.354 0.339
n. obs. 336 304
Multinomial Logit Model:

ModelsResults
MNL Income
High income Medium income Low income
Variable est. (t-stat) est. (t-stat) est. (t-stat)
Walking distance to bus stop -0.072 (-1.5) -0.179 (-6.1) -0.132 (-5.3)
Service frequency 3.226 (4.9) 3.184 (8.4) 2.281 (6.4)
Schedule reliability 2.002 (4.7) 1.896 (7.0) 0.899 (4.0)
Bus stop facilities 0.381 (n.s.) 0.816 (3.2) 0.645 (2.7)
Bus crowding 1.159 (2.2) 1.006 (3.0) 0.904 (3.5)
Cleanliness of interior 1.553 (3.6) 0.626 (2.7) 1.034 (4.8)
Fare -6.354 (-2.2) -8.999 (-5.4) -7.997 (-5.5)
Information at bus stops 1.279 (2.6) 0.483 (2.0) 0.444 (1.9)
Personnel attitude 0.335 (0.8) 1.131 (4.7) 0.206 (n.s)
Log-likelihood at zero -107.664 -321.893 -274.653
Log-likelihood (final) -68.022 -179.450 -202.103
R-squared 0.368 0.442 0.264
n. obs. 98 293 250
Multinomial Logit Model:

ModelsMathematical formulation
Mixed Logit Model:
jjPerjCrowjStop
jInfjFarejCleanjReljFreqjWTimeij
PerCrowStop
InfFareCleanRelFreqWTimeU
)(
)(
Y
kj
k
iksj
s
sij
l
ij
ij
ij
xx
dgP
,
)(exp
exp

ModelsResults
Variable est. (t-stat)
Walking distance to bus stop m. -0.191 (-6.7)
Service frequency m. 3.963 (7.4)
Schedule reliability m. 2.128 (6.9)
Bus stop facilities m. 0.833 (3.4)
s.d. 1.109 (1.3)
Bus crowding m. 1.377 (4.2)
s.d. 1.559 (2.5)
Cleanliness of interior 1.357 (5.1)
Fare m. -11.476 (-6.9)
Information at bus stops m. 0.786 (3.4)
Personnel attitude m. 0.907 (3.3)
s.d. 2.359 (4.0)
Log-likelihood at zero -695.421
Log-likelihood (final) -447.107
R-squared 0.357
Mixed Logit Model:
From -0.276 to 1.942;
positive for 77% of users, negative for 23%
From -0.182 to 2.936;
positive for 81% of users, negative for 19%
From -1.452 to 3.266;
positive for 65% of users, negative for 35%

ModelsMathematical formulation
Latent Class Model:
jjPerjInfjFare
jCleanjCrowjStopjReljFreqjWTimeij
PerInfFare
CleanCrowStopRelFreqWTimeU
)
(
111
1111111
jjPerjInfjFare
jCleanjCrowjStopjReljFreqjWTimeij
PerInfFare
CleanCrowStopRelFreqWTimeU
)
(
222
2222222
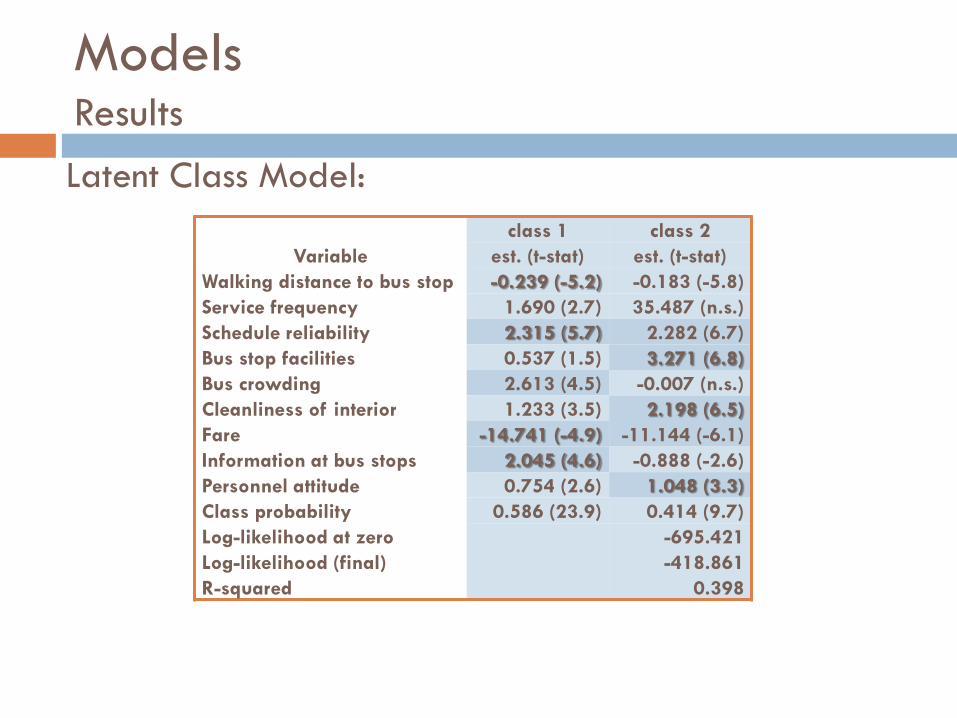
ModelsResults
class 1 class 2
Variable est. (t-stat) est. (t-stat)
Walking distance to bus stop -0.239 (-5.2) -0.183 (-5.8)
Service frequency 1.690 (2.7) 35.487 (n.s.)
Schedule reliability 2.315 (5.7) 2.282 (6.7)
Bus stop facilities 0.537 (1.5) 3.271 (6.8)
Bus crowding 2.613 (4.5) -0.007 (n.s.)
Cleanliness of interior 1.233 (3.5) 2.198 (6.5)
Fare -14.741 (-4.9) -11.144 (-6.1)
Information at bus stops 2.045 (4.6) -0.888 (-2.6)
Personnel attitude 0.754 (2.6) 1.048 (3.3)
Class probability 0.586 (23.9) 0.414 (9.7)
Log-likelihood at zero -695.421
-418.861
0.398
Log-likelihood (final)
R-squared
Latent Class Model:

Conclusions
1
Gender and car availability influence users’ choices of the bus services.
We found users’ heterogeneity linked to gender and income.
We found users’ taste heterogeneity for the attributes linked to bus stop facilities,
bus crowding, and personnel attitude, which are more qualitative service aspects
There is a class of users who give more importance to the attributes that more
properly describe a bus service (localization of the stops, punctuality, fare,
information), and a class of users who mostly consider the qualitative characteristics
(stop facilities, cleanliness, personnel)
2
Each of the proposed models explains the heterogeneity of users’ perceptions from
different perspectives.
Considering different groups of users provides information about the differences of
perceptions in terms of belonging to classes such as male or female, classes of income.
Introducing random coefficients (in ML models) provides information about differences
of perceptions user by user based on users’ different tastes and attitudes towards
service aspects.
Latent Class Models provide information about the differences of perceptions in terms
of belonging to classes of users which are unobservable, differently from the
predefined classes based on gender, income, etc.

THE HETEROGENEOUS PERCEPTION
OF TRANSIT SERVICE QUALITY
by Laura Eboli and Gabriella Mazzulla
Scientific Seminar SIDT 2011:
“ENERGY, ENVIRONMENT AND
INNOVATION IN SUSTAINABLE
TRANSPORT SYSTEMS"

Main publications of the authors about
transit service quality
Eboli, L. and Mazzulla, G. (2010) How to capture the passengers’ point of view on a transit service through rating and
choice options, Transport Review, 30(4), pp. 435-450, Taylor and Francis, London, UK.
5
6
7
8
9
Eboli L., Mazzulla G. (2009), An ordinal logistic regression model for analysing airport passenger satisfaction,
Euromed Journal of Business, 4(1), pp. 40-57, Emerald, Bradford, UK.
Eboli L., Mazzulla G. (2008), An SP Experiment for Measuring Service Quality in Public Transport,
Transportation Planning and Technology, 31(5), pp. 509-523, Taylor & Francis, London, UK.
Eboli L., Mazzulla G. (2008), Willingness-to-Pay of Public Transport Users for Improvement in Service Quality,
European Transport, International Journal of Transport Economics, Engineering and Law, 38, pp. 107-118, ISTIEE, Trieste.
Eboli L., Mazzulla G. (2007), Service Quality Attributes Affecting Customer Satisfaction for Bus Transit,
Journal of Public Transportation, 10(3), pp. 21-34, Center for Urban Transportation Research (CUTR), Tampa, Florida.
Eboli L., Mazzulla G. (2009), A New Customer Satisfaction Index for Evaluating Transit Service Quality,
Journal of Public Transportation, 12(3), pp. 21-37, Center for Urban Transportation Research (CUTR), Tampa, Florida.
3Cirillo C., Eboli L., Mazzulla G. (2011), On the Asymmetric User Perception of Transit Service Quality,
International Journal of Sustainable Transportation, 5(4), pp.216-232, Taylor & Francis, London, UK.
4
1Eboli, L. and Mazzulla, G. (2011) Transit Passenger Perceptions: Face-to-Face Versus Web-based Survey,
Journal of the Transportation Research Forum, Transportation Research Forum, 50(1), pp.19-36, Fargo, North Dakota, USA.
Eboli L., Mazzulla G. (2011), A methodology for evaluating transit service quality based on subjective and objective
measures from the passenger’s point of view, Transport Policy, 18(1), pp.172-181, Elsevier, Amsterdam.2
10 Eboli L., Mazzulla G. (2007), Behavioural and non-behavioural models for customer satisfaction measure,
International Journal of Management Cases, 9(3/4), pp. 129-139, Access Press UK, Lancashire, UK.