The health of our catchments > a Victorian report card · CLPR Centre for Land Protection Research...
120
The health of our catchments > a Victorian report card
Transcript of The health of our catchments > a Victorian report card · CLPR Centre for Land Protection Research...

The health of our catchments> a Victorian report card

ii
ABS Australian Bureau of Statistics
Ag Vic Agriculture Victoria division of DNRE
ANZECC Australia and New Zealand Environment Conservation Council
AUSRIVAS Australian Rivers Assessment System
BE Bulk (water) Entitlements
CaLP Act Catchment and Land Protection Act 1994
CaW Catchment and Water division of DNRE
CLPR Centre for Land Protection Research
CMA Catchment Management Authority
DNRE and NRE Department of Natural Resources and Environment
DOI Department of Infrastructure
EPA Environment Protection Authority
EVC Ecological Vegetation Classes
GIS Geographic Information Systems
GVP Gross value of production
ICM Integrated Catchment Management
In prep In preparation
ISC Index of Stream Condition
kL Kilolitre = 1000 litres (or 1 cubic metre)
MDBC Murray Darling Basin Commission
ML Megalitre = 1,000,000 litres (or 1,000 cubic metres). The approximate amount of water contained in one 50-metre Olympic sized swimming pool.
N/A Not applicable
NAP Commonwealth/State Joint National Action Plan for Salinity, Water Quality and Biodiversity
NGO Non-government organisations
NHT and NHT II The Commonwealth Natural Heritage Trust and the Natural Heritage Trust Stage Two
NLWRA National Land and Water Resources Audit
PFF Parks, Flora and Fauna division of DNRE
Port Phillip CaLP Board Port Phillip Catchment and Land Protection Board
RCS Regional Catchment Strategy
SEPP WoV State Environment Protection Policy, Waters of Victoria
SLA Statistical Local Area
SOE State of the Environment Report
VCMC Victorian Catchment Management Council
VGS Victorian Government Solicitor
VRHS Victorian River Health Strategy
The health of our catchments > a Victorian report card
ABBREVIATIONS
This publication may be of assistance to you but the State of Victoria and
its employees do not guarantee that the publication is without flaw of any
kind or is wholly appropriate for your particular purpose and therefore
disclaims all liability for any error, loss or other consequence that may arise
from you relying on any information in this publication.
© The State of Victoria, Victorian Catchment Management Council, 2002
ISBN 0 7311 0955 4

iii
The Victorian Catchment Management Council and its predecessor, the Catchment andLand Protection Council, have a statutory responsibility to report to the Governmentevery five years on the condition and management of the State’s land and waterresources. This is its second report. The first report, Know your Catchments (1997),provided a benchmark for some of the indicators and stimulated a major project toestablish a comprehensive suite of indicators to inform the Government on the conditionand management of land and water resources and the related social and economic baseof our catchments.
The Council has been greatly assisted in this task by staff of the Centre for LandProtection Research, Department of Natural Resources and Environment, theEnvironment Protection Authority and other agencies. The Council has also drawn onthe impressive body of work undertaken by the National Land and Water ResourcesAudit and other Federal and State data collection and analyses.
Healthy catchments provide both urban and rural Victorians with a wide range ofservices necessary to sustain life. Among other things these services include water qualityand quantity, salinity mitigation, carbon sequestration and food. Maintenance ofbiodiversity and ecosystem function underpin all of these services.
This is a report on the health of the ten catchment regions in Victoria and the ability ofthose catchments to continue to provide life-sustaining services to a growing andincreasingly urbanised population. Our analysis is based on best available scientific,social and economic data and has been informed by the national and internationaldebate on sustainable development. The Council can report that, while much of ourland, water and biodiversity resources are stressed, significant effort at the State andregional level has been expended in developing and implementing a range of strategiesand plans to alleviate this stress.
The Council also reports that, while some stresses can be alleviated by a process ofcontinuous improvement and best practice, some issues will require a different approachto land and water management if, as outlined in the ‘Growing Victoria Together’ policy,we are to promote sustainable development of the State while protecting theenvironment for future generations.
The Council encourages those involved in natural resource management and policydevelopment to use the information in this report and information publicly available onthe web to better inform decision-making and improve management responses.
Christine Forster
Chairperson
Victorian Catchment Management Council
October 2002
The health of our catchments > a Victorian report card
FOREWORD
iv
The health of our catchments > a Victorian report card
CONTENTS
> Abbreviations ii
> Foreword iii
> Contents iv
> Executive summary vi
> Victorian catchment management 1
1. Introduction 3
1.1 Background 3
1.2 Biodiversity, ecosystems and natural resource condition 3
1.3 Resource management 4
1.4 Report structure 6
2. Knowledge Management 7
2.1 Adaptive management and the importance of knowledge 7
2.2 Knowledge generation 7
2.3 Knowledge synthesis 8
2.4 Knowledge exchange 9
3. Reporting on Catchment Indicators 10
3.1 Background to the indicators 10
3.2 Assessing indicator condition and trends 11
3.3 Assessing management responses to indicator condition 11
3.4 Theme 1 – Changing socio-economic landscapes 12
3.5 Theme 2 – Biodiversity 26
3.6 Theme 3 – Rivers, wetlands and estuaries 32
3.7 Theme 4 – Managing water resources 50
3.8 Theme 5 – Managing land 62
3.9 Theme 6 – Managing pest plants and animals 74
3.10 Theme 7 – Greenhouse gas emissions and climate change 80
3.11 Theme 8 – Community attitudes and involvement in natural resource management 86

v
4. Overall Results and Future Issues for Natural Resource Condition and Management 92
4.1 Overview of indicator condition and trend results 92
4.2 Overview of statewide management responses 93
4.3 Overview of regional management responses 94
4.4 Are we making a difference? 95
4.5 Looking ahead to an uncertain 2050 95
5. A 2020 Vision for Condition and Management 103
5.1 A VCMC vision 103
5.2 The case for supporting the vision with ecosystem services 104
5.3 Are there activities upon which we can build? 106
6. Reaching the 2020 Vision – Next Steps 108
6.1 Some key considerations for sustainable resource management 108
6.2 Next steps 109
6.3 Conclusion 110
Bibliography 111
Acknowledgements 113
The health of our catchments > a Victorian report card
CONTENTS

vi
The report finds that Victoria is the most densely settled state inAustralia; a result of geography, climate and soldier settlementprograms after two world wars. As a consequence, our naturalresources are under pressure, and in many cases will not bepassed on to the next generation in good condition. TheGovernment has in place many strategies, plans and programs toencourage sustainable use of resources. If given adequateresources, most of these will make a significant impact on thehealth of our catchments.
Under current resourcing and management paradigms ourefforts to protect and sustainably manage natural capital are notkeeping pace with the breadth of degradation symptomsdepreciating the natural capital base. One of the key hindrancesto community and government efforts in this area is knowledge.In compiling this report we have found it difficult to answerquestions on the condition of the State’s resource base.
New knowledge is helping and we have made great strides in thelast five years. This knowledge coupled with experience andefforts over the past two decades tell us much about what weneed to do. It is clear that current ‘best management practices’will not be enough to ensure sustainable use of the land andwater in many parts of the State. Major change will need to bemade in the management of many areas to offset the impact ofissues such as dryland salinity and soil acidity. If we are toprotect and enhance the natural capital of the State,revolutionary change is required in the way we manage much ofVictoria's landscape. The ‘continue as we are’ scenario will notensure a long-term economic and environmental future foragriculture in Victoria.
Current trends for resource condition across Victoria do notreflect the definition of sustainability offered in this report. Toreach a level of sustainability a comprehensive new approach isrequired. The range of strategic documents developed by theState to manage specific degradation issues is impressive.However, we are lacking a coherent system for setting prioritiesand allocating resources between individual managementprograms at State level.
The next step must focus on designing catchments and thelandscape for future sustainability. The planning time frame forsuch an activity will need to be long-term, probably 30-50 years,to allow the community to adapt and adopt new ideas andmanagement paradigms.
The ability to make hard long-term decisions would be greatlyenhanced through the development of an integrated catchmentmanagement strategy across the State.
In the long run, it is cheaper to manage our natural resourcesproperly than to pay the exorbitant repair bill we areaccumulating; prevention is always cheaper.
The health of our catchments > a Victorian report card
EXECUTIVE SUMMARY
Every five years the Victorian Catchment Management Councilis required by the Catchment and Land Protection Act 1994 toreport to Parliament through the Minister for Environment andConservation on the condition and management of Victoria'scatchments. This report is based on a series of establishedindicators and compiled from a range of available information.

1
The Victorian Government is committed to the integratedmanagement of catchments as one of the best ways to deliver asustainable Victoria. In Victoria, the concept of integratedcatchment management (ICM) underpins sustainablemanagement of land and water resources and contributes tobiodiversity management.
Victoria has a strong integrated catchment management systemestablished under the Catchment and Land Protection Act 1994(‘the CaLP Act’). Under the CaLP Act, Victoria is divided into10 catchment regions (see Figure 1). A Catchment ManagementAuthority (CMA) is established to provide strategic direction ineach catchment region.
Under the CaLP Act and the Water Act 1989, CMAs haveresponsibility for coordinating and advising on strategic resourcemanagement priorities at a regional level. In an operationalsense, CMAs have direct responsibility for waterwaymanagement, floodplain management and rural drainage.
At a statewide level the framework also includes the VictorianCatchment Management Council (VCMC). The VCMC is theState Government’s peak advisory body on catchmentmanagement. The Council is uniquely placed to take a long-term independent view of catchment management across theState.
Goals and Outcomes of Catchment Management
To effectively implement integrated catchment management(ICM) as a tool for ecologically sustainable development, it isessential to clearly identify the goals and desired outcomes forthe management of land, water and biodiversity resources. InVictoria the primary goal of catchment management is:
To ensure the ecologically sustainable development of our natural resource-based industries, the protection of land and water resources and the conservation of natural and cultural heritage.1
The Victorian framework for catchment management has beendeveloped to achieve:
> community involvement in and commitment to natural resource management
> ecologically sustainable development of natural resource-based industries
> maintenance and improvement in the quality of water and condition of rivers
> prevention and reversal of land degradation
> conservation and protection of the diversity and extent of natural ecosystems
> minimisation of damage to public and private assets from flooding and erosion
> minimisation of the economic and environmental impacts of pest plants and animals.
The health of our catchments > a Victorian report card
Figure 1. Victoria’s Catchment Management Authority Regions.Source: CaW, NRE.
VICTORIAN CATCHMENT MANAGEMENT

2
To achieve these outcomes, Victoria has six principles thatgovern the way catchment management is implementedthroughout the State. They are:
1. Ecologically Sustainable Development
Victoria’s whole-of-catchment approach to natural resourcemanagement seeks to deliver social, economic andenvironmental outcomes for the community and reduce ourecological footprint.
2. Community Empowerment
Catchment management is a partnership between communityand Government. Planning and implementation of naturalresource management programs should maximise opportunitiesfor community engagement.
3. Integrated Management
Management of natural resources should recognise the linkagesbetween land and water and that the management of onecomponent can impact on the other.
4. Targeted Investment
Government and community need to ensure that resources aretargeted to address priorities and deliver maximum on-groundbenefits.
5. Accountability
Those making decisions on natural resource managementshould be clearly accountable to Government and thecommunity, both in a financial sense and for biophysicaloutcomes. Performance assessment, monitoring and review arekey elements of the Framework and provide the process tounderstand if biophysical condition is improving andmanagement activities are effective.
6. Administrative Efficiency
To maximise on-ground results catchment managementstructures should facilitate more efficient procedures andpractices.1
Internationally, the CMA approach taken by Victoria to themanagement of the environment is recognised as one of the keyelements in the new paradigm of integrated natural resourcemanagement.
In Growing Victoria Together 2, the Victorian Government makesa commitment to build on the strong foundation of the CMAsystem. This Government commitment is welcome. Itreinforces the importance of the partnership approach betweengovernment, community and industry that is fundamental toensure sustainable management of Victoria’s natural resourcesnow and into the future.
The health of our catchments > a Victorian report card

3
1.1 Background
The Victorian Catchment Management Council (VCMC) wasestablished in 1997, taking over from the previous Catchmentand Land Protection Council.
Under the Catchment and Land Protection Act 1994, one of thekey statutory roles of Council is to provide a five-yearly report toState Parliament on the condition and management of land andwater resources in Victoria. The Report of 2002 constitutes thesecond effort in assessing the condition of Victoria’s land andwater resources.
Know Your Catchments
The first report, Know Your Catchments was produced in 1997by the previous Catchment and Land Protection Council withthe support of Catchment and Water Division, NRE and theEPA Victoria.
The 1997 Report highlighted that while much monitoring wasbeing conducted, information harvesting, storage andinterpretation were uncoordinated. This made it difficult tocollect and present data in a clear, consistent statewide format.Along with identified information gaps the process highlighted alack of consistent on-going priorities and commitment tomonitoring against agreed indicators with targets for condition.3
The Catchment Condition Indicators Project
The gaps and difficulties uncovered in developing Know YourCatchments initiated a Natural Heritage Trust (NHT) fundedproject involving the VCMC, CMAs, NRE and the EPA. TheResource Assessment and Monitoring (RAM) Group workedover four years to develop agreed statewide indicators to enableconsistent future reporting on catchment condition.
The Catchment Condition Indicator project was completed in2001 by the RAM Group. The Catchment Condition Indicatorsform the framework upon which this report is based.
Stakeholder and public access to the information generated bythe catchment indicators is available. In December 2001 theMinister for Conservation and Environment launched theCatchment Condition Indicators Online website. The web-based format has allowed interrogation of the information at arange of scales including:
> State
> Catchment Management Authority region
> Local Government Area
> Bioregion
> River basin.
Information on the indicators, including condition and trends,is available through the Victorian Catchment Indicators Online(VCIO) web site - (www.nre.vic.gov.au/vcio). Access to dataand map-based products will also be made available throughinfrastructure created under the Regional Data Net project.This will enable wider access to NRE’s corporate data libraryand eventually provide online map development capabilities.3
1.2 Biodiversity, ecosystems and naturalresource condition
Biodiversity, ecosystems and natural resource condition areinextricably linked. The term biodiversity refers to the variety oflife forms, microorganisms, plants, animals, the genes theycontain and the web of life they collectively form.4 Theinteractions occurring between the physical environment,nutrient cycles, water cycles, plants and animals are all functionsof natural ecosystems.
The term "ecosystem services" has been coined to describe theprocesses and conditions by which natural ecosystems sustainand fulfil human life.5 Services such as clean air, water cyclingand purification, nutrient cycling, soil formation, biomassproduction, waste disposal, crop pollination, provision of foodand minerals, and the maintenance of genetic diversity resultfrom functioning ecosystems.
Ecosystems are the Earth's primary producers, solar-powered factories that yield the most basic natural resources and services at an efficiency and cost unmatchedby any current technology.6
World Resources Institute, 2000
One clear reason for seeking solutions to maintain naturalecosystems and environmental assets is to protect the range ofservices and benefits provided to humans from nature and itscomponents.5
The health of our catchments > a Victorian report card
INTRODUCTION
ONE

4
Understanding the benefits from complex interrelationshipswithin ecosystems can be a difficult message to explain.Ultimately, healthy and resilient ecosystems are responsible forproducing a range of natural resources (sometimes termednatural capital) that benefit the entire community. Whileservices such as air and clean water are easily recognised theyhave often been taken for granted and undervalued.
These non-market and often unmeasured ecosystem servicesunderpin basic needs and health and are as important to humanwellbeing as measures of consumption and economic growth.7
In an attempt to benchmark the contribution ofecosystems at a world scale, Costanza et al estimated thevalue of ecosystem services to be in the range of $16-54trillion (US) per year, with an average of $33 trillionoffered. At the same period the global gross nationalproduct was $18 trillion (US) per year.8
Harvesting the natural resources provided by ecosystemssupports our economies, provides employment and every yearcontributes to people’s health, with millions visiting outdoorregions to relax. CSIRO has estimated the value of ecosystemservices in Australia to be worth $1327 billion each year.9
Previously, ecosystem services were assumed to be endlesslyrenewable.5 There is now clear evidence that the current use ofsome environmental assets is resulting in accelerated degradationof the asset base. This will significantly reduce benefits availableto future generations.7
Although plentiful, natural resources are finite and need to bemanaged accordingly. For example, when the use of water isproperly assessed there is no excess capacity. The water thatmany people think is simply flowing away unused is supportingecosystems that provide an enormous range of services.7
Finding the balance between environment and development willbe an ongoing long-term process of education, consultation,negotiation and trade-offs.5
It is increasingly recognised that the health and well being ofcommunities is linked to healthy ecosystems and sustainablemanagement of natural resources. Managing sustainably meansmanaging natural resources to service current needs and desireswhile ensuring that future generations have access to the sameecological, economic, social and cultural opportunities fromthese finite resources.10
Ecosystem function is of primary importance in sustainingspecies and the interactions between species and naturalprocesses. Continued degradation of ecosystems and decline inbiodiversity undermines Australia’s natural capital base, reducingfuture opportunities for rural and urban communities.
1.3 Resource management
Historic management of resources
In biodiversity terms, Australia is a mega-diverse continentproviding habitat for a range ecosystems and species. For over40,000 years humans have been harvesting knowledge,spirituality, energy and basic resources from these ecosystems.Ecosystems are never static. The Aboriginal use of fire facilitatedmany changes in ecosystems and landscape appearance.
Using the services provided by ecosystems, Aborigines formedcomplex economic, social and spiritual relationships with theAustralian landscape. This relationship, nowadays sometimestermed ‘caring for country’, sustained Aboriginal Nations forthousands of years.
The principles of understanding, value and respect for theservices and structure of natural ecosystems inherent in ‘caringfor country’ are, in different ways, gaining acceptance within thebroader Australian community and industry sectors.
Recent management of natural resources
In recent history, the use of natural resources in Australia hasoften been based on an unsustainable management paradigm –although this has not always been recognised. For nearly 200years European farm management methods have been employed,significantly transforming landscapes. This is especially evident inintensely settled and farmed States such as Victoria.
These farming methods were actively encouraged byGovernments for one and half centuries and were fundamentalto the economic and social development of the State and nation.We now recognise that, although practised in good faith,European management methods have resulted in longer-termlosses and degradation of Victoria’s natural capital base.11
Victorian farming must continue, but the methods employedneed to reflect the inherent ability of the landscape to producegoods without accentuating longer-term environmentaldegradation. In other words land use and management mustalign with land capability.
In 2002 the agriculture sector is responsible for 11 per cent of Victoria’s gross state product, and 33 per cent of all State exports. The production, processing and marketing of food employs 205,000 people, or 9.7 per centof total Victorian employment. In rural and regional Victoria, the sector accounts for 21 per cent of all jobs.12
Bruce Kefford, Executive Director Agriculture Division, NRE 2002
The unplanned growth of modern cities and the consumeraspirations of successive generations of Australians are steadilyrunning down our natural capital and affecting ecosystemhealth. It is important to understand that almost everything wedo and every choice we make has an environmental impact.
Minimising negative impacts should be a short-term goal in thetransition to developing and employing the knowledge andtechnology required to remove negative impacts.
The health of our catchments > a Victorian report card

5
The Council of Australian Governments, when announcing the National Action Plan for Salinity, Water Quality and Biodiversity, estimated the total cost of land and water degradation at $3.5 billion annually.13
Rehabilitation and protection initiatives
Governments, individuals, communities and industriesresponsible for managing natural resources now recognise theneed to protect the health of Australian ecosystems. State andCommonwealth Governments since the 1940s have beenlegislating and investing to protect and rehabilitateenvironmental systems and assets.11 Some notable recentexamples include:
> Landcare, which began in Victoria with the first group action in 1986, has subsequently spread across the nation. Nationally, there are over 2000 groups of individual land managers collectively tackling local degradation issues and striving for increased farm production through sustainable use of resources.
> Over the past two-years, the State Government has invested $10 million in Landcare. For 2002/03, $4.8 million has been committed to local projects through CatchmentManagement Authorities.14
> The Commonwealth Natural Heritage Trust program from 1997 to 2001 invested $200 million across Victoria to protect ecosystems and address the causes of degradation symptoms threatening natural resources.15
> Since 1990 the Victorian State Government has invested $257 million on salinity management activities.16
> Local Governments across Australia spent more than $2.1 billion on environment related activities in 1998-99. $1.8 billion of this was spent on water and solid waste management with the balance on activities related to biodiversity management. 17
> In 2001, the Commonwealth and the Victorian State Government agreed to jointly spend $1.4 billion over the next seven years through a National Action Plan (NAP) to combat dryland salinity, water quality and biodiversity decline in six priority catchments across Victoria.
> The Commonwealth Government have also announced a continuation of the Natural Heritage Trust (NHT 2) program. The regional component indicative budget will beworth around $50 million to 2005.15
Monitoring and evaluation
The above initiatives and partnerships are vital to protecting andenhancing ecosystems and the natural resource capital theyproduce. A clear part of these initiatives will be condition andperformance evaluation. In any industry, monitoring,evaluation, reporting and review maintain a significant part ofany investment cycle.
Monitoring condition consists of three things:
> keeping a continual record of certain parameters/indicators
> advising whether they are being maintained within prescribed limits
> warning if undesirable changes occur.
Monitoring requires regular data assessment and feedbacksystems to respond to the monitoring results.18
Victoria has a long history of addressing threats to sustainabilityand ecosystem health. Despite being nationally considered aninformation-rich State, there is much about the workings ofVictoria’s ecosystems, intervention opportunities and impactsthat remains to be explored.
Changes made today may not achieve desired outcomes for 50to 100 years. Due to a limited information base it has taken150 years to recognise and understand degradation issues such asbiodiversity decline and dryland salinity. No doubt clues wereavailable for some time but without a systematic process formonitoring and reporting, it was difficult to determine trendsand present clear arguments for early intervention.
In a recent survey of the global environment, the Economistmagazine offered the following observations: “The WorldResources Institute, World Bank and the United Nations intheir joint publication – ‘People and Ecosystems’ recently soughtto gauge the condition of ecosystems. Surveying best availabledata the report reached two conclusions:
1. That ecosystems are fraying from the impact of human activity, and
2. Ecosystems in future will be less able than in the past to deliver the goods and services humans depend upon – pointing to unsustainability.
In reaching the above conclusions, the report clearly stated itwas difficult to know what would be truly sustainable as muchof the knowledge required to make such an assessment isincomplete or missing altogether.”19
Our knowledge of ecosystems has increased dramatically, but it has simply not kept pace with our ability to alter them.6
World Resources Institute, 2000
At a national level a Commonwealth Performance Audit reportconducted in 2001 on the Natural Heritage Trust programnoted: “that an absence of baseline data on environmentalcondition was a major constraint on measuring and reportingon changes and trends in natural resource management and theenvironment.”20
One of the first efforts to benchmark the environmentalcondition of Victoria occurred in 1991 with publication of theState of the Environment (SOE) Report. It noted there was apaucity of monitoring information and data on landdegradation, despite over five decades of awareness andgovernment on-ground activity.11
The health of our catchments > a Victorian report card

6
The Know Your Catchments report of 1997 also outlined gaps inthe co-ordination, collection, storage and presentation of data.Both the SOE and the Know Your Catchments reports werelimited by a lack of consistent, agreed condition indicators thatprovided benchmarks upon which to measure environmentaltrends and assess performance.
In 1993 and again in 2001, the Auditor General of Victoriaconducted a review of the appropriateness of action taken withinthe State Salinity Management Program. Amongst manypositive findings in the 2001 report the Auditor General noted:"…the State does not have a comprehensive evaluation program,nor a comprehensive set of objectives or performance indicatorscovering the productive capacity, environmental quality andsocial well being of salt affected areas, as recommended in our1993 report."16
The above examples outline a real need for improvement inmonitoring, evaluation and performance reporting at a global,national and State level.
Businessmen always say, ‘what matters gets measured.’ It is astonishing that governments have been making sweeping decisions on environmental policy for decades without baseline data.19
The Economist Magazine, 2002
One of the great challenges for resource managers is to engagegovernment and the community into committing investmentnow, for environmental outcomes that will benefit generationsnot yet born.19 This requires courageous decision-making bycommunity and political leaders. This is especially the case forinvestment allocation to areas such as monitoring, evaluationand research which, in a political sense, can lack the panache ofon-ground activity.
In these turbulent times, politicians cannot allow the desire for popular support today to sway them from making responsible choices for tomorrow.21
Mikhail Gorbachev 2002
Monitoring and performance reporting is fundamental toeducating and engaging the community. Continued researchunderpinned by consistent monitoring, evaluation and reportinghelps review, support and validate investment decisions, slowlyproviding the information necessary for selecting appropriateintervention activities. Victoria has much to gain by ensuringmonitoring of environmental condition and evaluation ofperformance occurs in a consistent framework on a long-termbasis.
The Catchment Condition Report of 2002 reports on conditionand management of land and water resources using 32catchment condition indicators. It assesses condition andtrends, outlining current and historically persistent gaps inknowledge, management and process associated withmonitoring, evaluation and reporting. The Report also exploresthe relationship and progress of management activity inresponding to indicator condition and trends.
1.4 Report structure
The information provided by this report involves the followingstructure:
> Chapter 2 outlines discussion on knowledge management and the current gaps, needs and opportunities.
> Chapter 3 presents the 32 Catchment Condition Indicators used in this report. This involves a brief discussion on indicators and there use before following on to the eight themes and 32 indicators. The eight theme headings are:
- Changing socio-economic landscapes
- Biodiversity
- Rivers, wetlands and estuaries
- Managing Water
- Managing Land
- Pest plants and animals
- Greenhouse and climate change
- Community attitudes and involvement in natural resource management.
Each of the themes introduces the range of related indicators.The 32 indicators are assessed in terms of condition status, trendand management responses.
> Chapter 4 provides an overall assessment of condition and management and addresses the question of whether we are making a difference. This section also explores some likely outcomes for catchment condition if we continue current management responses and activities through to the year 2050.
> Chapter 5 presents discussion on a preferred management and condition vision for the State in 2020, introducing some potential management options available to reach the vision.
> Chapter 6 overviews what is required to reach the VCMC vision for the condition and management of the State’s natural resources.
The health of our catchments > a Victorian report card
7
2.1 Adaptive management and the importanceof knowledge
Victoria's Catchment Management Framework relies on anadaptive management approach with Regional CatchmentStrategies reviewed and renewed every five years. Adaptivemanagement is an integrated, multidisciplinary method fornatural resource management.22 It is adaptive, because itacknowledges that the natural resources being managed willalways change and our management approaches must reflectthese changes. In this way, adaptive management is a way toachieve objectives, but also a means of learning more about theresource system being managed.23
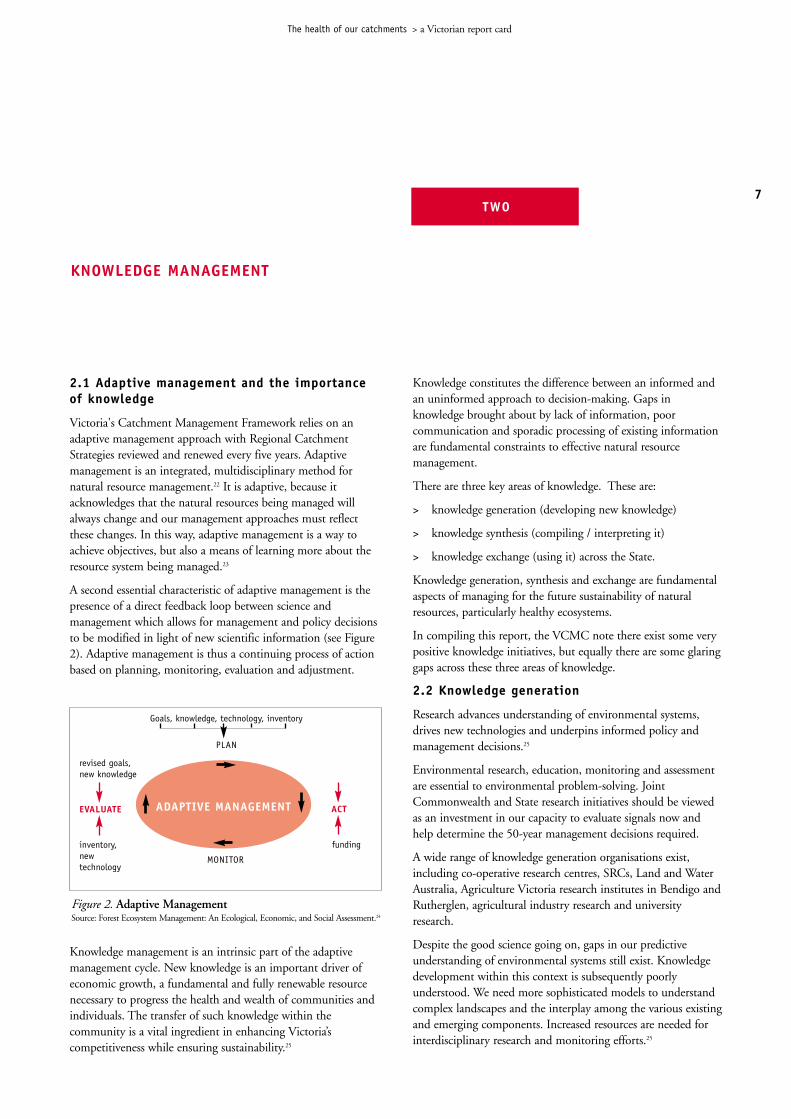
A second essential characteristic of adaptive management is thepresence of a direct feedback loop between science andmanagement which allows for management and policy decisionsto be modified in light of new scientific information (see Figure2). Adaptive management is thus a continuing process of actionbased on planning, monitoring, evaluation and adjustment.
Knowledge management is an intrinsic part of the adaptivemanagement cycle. New knowledge is an important driver ofeconomic growth, a fundamental and fully renewable resourcenecessary to progress the health and wealth of communities andindividuals. The transfer of such knowledge within thecommunity is a vital ingredient in enhancing Victoria’scompetitiveness while ensuring sustainability.25
Knowledge constitutes the difference between an informed andan uninformed approach to decision-making. Gaps inknowledge brought about by lack of information, poorcommunication and sporadic processing of existing informationare fundamental constraints to effective natural resourcemanagement.
There are three key areas of knowledge. These are:
> knowledge generation (developing new knowledge)
> knowledge synthesis (compiling / interpreting it)
> knowledge exchange (using it) across the State.
Knowledge generation, synthesis and exchange are fundamentalaspects of managing for the future sustainability of naturalresources, particularly healthy ecosystems.
In compiling this report, the VCMC note there exist some verypositive knowledge initiatives, but equally there are some glaringgaps across these three areas of knowledge.
2.2 Knowledge generation
Research advances understanding of environmental systems,drives new technologies and underpins informed policy andmanagement decisions.25
Environmental research, education, monitoring and assessmentare essential to environmental problem-solving. JointCommonwealth and State research initiatives should be viewedas an investment in our capacity to evaluate signals now andhelp determine the 50-year management decisions required.
A wide range of knowledge generation organisations exist,including co-operative research centres, SRCs, Land and WaterAustralia, Agriculture Victoria research institutes in Bendigo andRutherglen, agricultural industry research and universityresearch.
Despite the good science going on, gaps in our predictiveunderstanding of environmental systems still exist. Knowledgedevelopment within this context is subsequently poorlyunderstood. We need more sophisticated models to understandcomplex landscapes and the interplay among the various existingand emerging components. Increased resources are needed forinterdisciplinary research and monitoring efforts.25
The health of our catchments > a Victorian report card
Figure 2. Adaptive ManagementSource: Forest Ecosystem Management: An Ecological, Economic, and Social Assessment.24
Goals, knowledge, technology, inventory
PLAN
ADAPTIVE MANAGEMENT
MONITOR
revised goals,new knowledge
EVALUATE
inventory,newtechnology
ACT
funding
KNOWLEDGE MANAGEMENT
TWO

8
In particular, any ideas regarding a market-based approach forecosystem services will require a sound understanding ofprocesses to derive a ‘currency’ for trading and assign a value tothat currency.
Other specific research areas in need of enhancement includeagricultural production systems, decision support tools, andstrategic environmental technologies. We are also lackingspecific information and understanding about the biologicalprocesses that underpin soil health.
A long-term commitment to knowledge generation research,monitoring and evaluation is required.25
The catchment indicators are largely newly developed andspecific knowledge generation needs abound. There remainsignificant topics not addressed including:
> Estuarine condition
> Wetlands condition
> Floodplain management and condition
> Native vegetation condition
> Dryland salinity.
Similarly, some of the current indicators are not able to providethe type of information required to assess if the condition ofresources is improving or declining. Further development isrequired for indicators on biodiversity, soils, greenhouse, andwater management.
Many of the current indicators suffer from a lack of correlationbetween data collection and time. Spatially, data can beprovided readily but it remains difficult to report on indicatorsbased on time (e.g. trends in the last year). This limits theusefulness of the indicators to CMAs reporting annually oncatchment condition.
Limited by knowledge and resourcing, the indicators present asegmented, issues based approach to knowledge generation,synthesis and exchange.
No State-agreed process exists for monitoring and reporting oncatchment condition at a holistic catchment or ecosystem scale.Addressing this problem will be challenging. Implementingecosystem management approaches is limited, not simply by alack of data on ecosystems and how they function, but also by alack of knowledge on how to sensibly apply existingknowledge.26
2.3 Knowledge synthesis
A number of monitoring and evaluation programs exist aroundthe State at various community and organisational interface levels.
A positive example is the Victorian Water Resources DataWarehouse and the State Water Quality Monitoring andAssessment Committee which combine information and skillsacross a rage of organisations and community groups includingMelbourne Water, the EPA, water authorities, NRE andWaterwatch community monitoring.
This synthesis of water quality data collection, interpretation,communication and extension is the most comprehensiveprocesses of all the natural resource management data sets in thestate.
Despite this glowing example, the VCMC still had troublepulling best available information together on water quality.This problem was inherent in synthesising information for allthe indicators. There is no statewide process for collecting,interpreting and updating natural resource management data.
Generally the information is held across NRE and associateddivisions by individuals. The Catchment Indicators projectassigned a patron to each indicator. The VCMC receivedabsolute cooperation from all the patrons. Unfortunately, theindicator patrons had to provide or review information as anadditional task rather than a core function. The synthesis ofinformation is still not identified as a priority across the State.
A clear consistent process for providing and synthesisingknowledge is required. Most importantly responsibility forcoordinating a State approach needs to be considered a priorityand appropriately resourced. A basic framework now existsthrough the Catchment Indicators and this activity should beexpanded. The issue of cyclical and ongoing funding for datacollection also needs to be addressed.
As part of knowledge synthesis it is important to continuallydevelop, review and assess our information data sets. There arefour main stages in the evolution of an information set, namely:
(1) definition of the standard
(2) design of the monitoring strategy
(3) deployment of the monitoring program
(4) acquisition of the information set.
Addition of a fifth stage (review) turns the above process into alife cycle. The review stage needs to accommodate bothchanged requirements (driven by variance in the system understudy or new information needs) and opportunities forefficiency gain (ie. new technology).
Evaluation of an information set against the above lifecycle canbe useful in identifying its maturity. Additionally, thecompleteness, quality and accessibility of the information needsto be reviewed.
With respect to the indicators used in this report few aresupported by mature infrastructure. In some instances,condition can be assessed against a predetermined benchmark.Trends and performance on the other hand were often difficultto assess. In many instances information has not been gatheredlong enough or in an appropriate form to produce trends.
No indicators possess clear outcomes or targets as goals ofimproved condition. This makes it difficult to assessperformance and results of management activities.
Clear performance measures and targets are required for eachindicator. These targets need to be time constrained and
The health of our catchments > a Victorian report card

9
supported by on-going monitoring of activities to ascertain therelationship of an activity and its impact on improvingcondition.
To date, the indicators have not been employed by thecatchment management authorities as a basis for regionalreporting on condition. Further work is required to develop aprocess for reporting based on indicators that link to the variousmanagement strategies and programs operating at regional, Stateand national level.
This is partly being addressed through the NAP Program. TheNAP is further encouraging regions to set targets andperformance measures to drive activity and support clearevaluation and reporting.
2.4 Knowledge exchange
At a broad level the Regional Data Net (an initiative of NRECatchment & Water division) is an attempt to provide aprogram style approach to the provision of informationinfrastructure and support for monitoring and knowledgeexchange. At the next level down, the catchment indicator, aprogram approach is generally lacking.
In almost all the areas of information acquisition andmanagement, the current environment is characterised by short-term project based investment. Project objectives are usually notaligned with:
> collection of information to meet standards required forbroader use; and
> effective information management and quality assurance.
The lack of a program approach to the collection of theindicators undermines the development of a rational andcoordinated approach to integrated monitoring. The result ishigher costs, less information and impairment in our ability tointerpret information and understand the changingenvironment.
As noted, significant effort has been required to pull togetherthe information for each of the catchment condition indicators.The intention of the catchment indicators web site is to makesuch knowledge available.
Currently, the indicators web site is incomplete, with fewindicators displaying full data. Although there is a clear processand commitment from Catchment and Water division to updatethe information in the short-term, a long-term commitmentacross NRE is required to ensure an on-going schedule of datacollection, interpretation and updating on the web site.
Regional communities have a partnership role alongsidegovernment in managing natural resources. Due to thechanging and complex nature of environmental systemscommunities need to be equipped with an equivalent knowledgeresource to manage natural resource management issues.
A key pre-requisite for empowering communities to developmanagement scenarios for a sustainable future is access toquality data.27
In addition to the need for community knowledge exchange,there are a number of existing reporting needs at a State andregional level. These include:
> SOE reporting
> RCS monitoring-evaluation programs
> Coastal Strategy development monitoring – evaluation andreporting
> NRE reporting – CaW, AgVic, PFF and Forests
> Local government reporting
> CMA Annual reporting
> VCMC annual and five yearly reporting to State Parliament
> State Water Quality and Assessment Committee annual report card
> Specific program reporting for pest management, the NAP and the NHT II.
As noted earlier, there is no responsible body or process forfacilitating reporting arrangements, avoiding duplication, crosssharing information, providing consistency and quality control,and communicating natural resource management informationto the community.
Clear opportunities and potential efficiencies exist in:
> coordinating the operation and process of data management
> coordinating data collection and information sharing
> coordinating use of data, especially in evaluation andreporting
> coordinating access to data and quality control
> coordinating communication of the data to the generalpublic to inform engagement processes and decision-making.
The institutional arrangements and resourcing requirements tofacilitate this coordination requires further discussion.
The health of our catchments > a Victorian report card
10
3.1 Background to the indicators
Environmental indicators are being developed both at thenational and State level. At a national level, solid progress hasbeen made since the first SOE report, Australia: State of theEnvironment 1996 (State of Environment Advisory Council1996). This has included the development of a suite ofenvironmental indicators through Environment Australia, thecompletion of the National Land and Water Resources Audit(NLWRA), and the release of Australia: State of the Environment2001.
Victoria has contributed significantly to national programs suchas State of Environment Reporting (SOER), the National Landand Water Resources Audit (NLWRA), and the performancereporting requirements of the NHT, NAP and MDBC.
It is important to recognise that although the national andVictorian reporting programs appear similar, there is littleduplication in effort. Much of the Commonwealth effort hasbeen directed at aggregating and interpreting data provided bythe State, with less involvement in data creation.
The idea of a project to develop Catchment Indicators for theState was initiated in 1995/96 but did not begin until 1998.
In this report the VCMC use 27 indicators (of the original 30developed) and have created five additional indicators. Theserelate to community awareness, Landcare participation,estuaries, greenhouse emissions and climate change.
Since 1998 around 260 people have been involved inconsultation on the development of the 30 original CatchmentCondition Indicators. For each indicator a methodology wasdeveloped detailing:
> definition and rationale for the indicator
> relevant data sources and collection procedures for theindicator
> methods of data storage for the indicator
> methods of data analysis and interpretation for the indicator
> reporting products and protocols
> clearly defined responsibilities and funding arrangements.3
The indicators were developed to:
> identify the condition of land and water resources, allowingcomparison between a measurement and a conditionbenchmark
> assess the current trends in condition and management andthe impacts on the resource base
> provide a basis upon which to evaluate the performance ofnatural resource management programs
> provide feedback to planning cycles and support policydevelopment.3
The majority of the indicators have been developed to reflect onthe impact of NRE and CMA resource management programs.To do this indicators need to be sensitive to change over short-term periods (3-5 years) and link to programs with a clear causeand effect relationship between program activity and subsequentimpact.3
Due to the complex nature and long time frames associated withmost environmental issues, some of the indicators will notprovide relevant short-term information. Instead the value willbe in interpreting information over a 20-30 year time frame.
As noted in Chapter 2, currently few of the indicators haveperformance measures and targets, nor are they clearly linked orimbedded in the range of NRE or CMA programs. Finally, theindicators have not been developed for aggregation to provide aclear overall assessment of catchment condition.
Developing the indicators has required compromise betweenwhat is possible and desirable. There are many components ofthe indicators that could be improved but the current list at leastprovides a base from which improvements can be made.3
Victoria is placed as well or better than any other State in thecountry to systematically tackle long-term monitoring andevaluation of natural resource condition.
The health of our catchments > a Victorian report card
REPORTING ON CATCHMENT INDICATORS
THREE

This document represents our current best effort to report oncondition. Making a jump from individual indicator conditionassessment to a collective condition assessment at a whole ofcatchment or ecosystem level is a task undermined byinformation deficiencies and has not been attempted in thisreport.
More appropriate indicators that better holistically displaycatchment or ecosystem condition are required. In this reportthe VCMC, where possible, make an assessment of thecondition and management responses for each individualindicator at a State and regional level.
Attempting to assess condition and management responses in2002 provides a benchmark for future reports on condition. Asfurther research, monitoring and evaluation takes place andperformance measures are developed, reporting accurately oncondition will improve dramatically.
3.2 Assessing indicator condition and trends
At a State and CMA region level, condition and trendassessment is based on collected information and interpretationof data supporting each indicator. Condition assessment andappropriate text on extent, impact and condition trend of theindicator is provided where available.
For each indicator the VCMC assessment of condition ispresented through the following colour legend:
Similarly, presentation of trends at a State and regional level isoffered through the following symbol legend.
The above legends appear on the bottom left hand page of eachindicator double page spread.
3.3 Assessing management responses toindicator condition
This chapter also attempts to review the management responsefor the 32 individual indicators at State and regional level.
At a State level brief discussion is provided on the managementresponse to each indicator. For CMA regions a snapshot reviewof appropriate existing or soon to be released management plansis provided.
The legend of S, Pm, C, and me is used to introduce answers tothe following questions on management responses at both theState and regional level:
11
= This symbol describes if a State strategy (OR regional action plan), of relevance to the indicator, existsor is in preparation.
= This symbol outlines if the above Strategy/Plan contains clear performance measures and targets.
= This symbol describes if the above Strategy/Plan is supported by a State/regional commitment to an implementation program with resourcing.
= This symbol outlines if the Strategy/Plan contains a clear process for monitoring and evaluation.
In assessing management responses within CMA regions, theVCMC is not implying CMA responsibility for implementingmanagement responses to all of the indicators. The CMAs havespecific defined implementation responsibilities for waterwaymanagement, floodplains and rural drainage.
Associated natural resource management issues are coordinatedthrough the CMAs strategic planning role and the regionalcatchment strategies. The Regional Catchment Strategies willinclude many natural resource management issues for whichCMAs have no direct responsibility in an implementation orresource distribution sense.
The assessment of regional management responses should not beinterpreted as an assessment of CMA performance. It is asnapshot of current activity at a regional level between a range ofstakeholders.
Quality of data
Development of the suite of indicators only concluded recentlyin 2001. Over the last five years the information collected andinterpreted has varied. Some indicators have significanthistorical information upon which to base condition and trendanalysis. Other indicators have a very limited information base.
The VCMC condition and trend assessment will, in someinstances, be hampered by a lack of data or inconclusive, short-term information. Therefore, for each condition indicator asimple analysis of the quality of data supporting the assessmentwill be provided. This information confidence rating will be asimple traffic-light representation where:
A Green symbol represents good consistent data collection and interpretation (>5 years) on condition and trends;
An Orange symbol represents some consistent data collection and interpretation (<5 years) on either condition or trend but not both;
A Red symbol represents poor or limited data collection and interpretation.
To assist readers, the legend associated with State and regionalmanagement responses (S, Pm, C, and me) and the informationconfidence rating is represented at the start of each of the eightindicator themes.
The health of our catchments > a Victorian report card
Trend Legend
POSITIVE
NEGATIVE
STABLE
UNKNOWN
▲
▼
?
S
me
C
Pm
❉
❉
❉
Condition Legend
OPTIMAL
GOOD
MODERATE
POOR

The health of our catchments > a Victorian report card
12
The importance of agriculture in rural landscape
What happens on and to Victoria’s farms is of crucialimportance for all Victorians concerned about natural resourcemanagement policy. Approximately 85 per cent of Victoria’sprivately owned land is nominally used for agriculturalproduction. Agriculture uses 77 per cent of the State’s waterresources. Over half the native vegetation on private land isconsidered to be representative of threatened ecologicalcommunities. The Victorian agricultural sector plays a pivotalrole in the economic health of regional communities andindividual land managers. Changes in the structure of Victoria’sagricultural sector will change the way we manage Victoria’snatural resource base. Understanding the changes occurring inthe agricultural sector will help predict potential negativeimpacts and identify opportunities for improving managementof the resource base.
Indicators:
> Gross Value of Production (At the time of printing the dataavailable under the indicator ‘Gross Value of Production’required additional analysis and interpretation. This couldnot be completed in the timeframe of this document.)
> Net Farm Worth
> Percentage of private land used for agriculture
Continued cost-price squeeze on agriculture
Agriculture as a business is characterised by a long-term declinein the terms of trade. Increases in agricultural productiongenerally occur faster than the capacity of the market’swillingness to pay for those increases in production. As a result,the long-term real price of most agricultural commodities falls.In the past fifty years the ratio of ‘prices paid’ to ‘prices received’by Australian farmers has fallen by seventy per cent, though thisfall has been obscured by major fluctuations. The response ofagricultural industries has been to improve productivity, often byadopting new methods of farming that require an increase in thescale of the business. Over recent years the annual productivitygrowth for the farm sector has been 2.1 per cent per annum. Inaggregate, this rate of productivity growth has been sufficient tokeep ahead of the decline in terms of trade over the past 20years.
Like the terms of trade, productivity growth does not occur at asteady rate, nor is it evenly shared across the agricultural sector.Nationally, the specialist cropping sector has achieved annualproductivity increases of 3.6 per cent. At the other end of thespectrum, the nation’s sheep industries have achieved annualincreases of 0.6 per cent.28 Productivity increases are also muchmore likely to be captured by the financially largest ten totwenty per cent of farms.29 Finally, neither farm size nor farmindustry are evenly spread across the landscape. Regions with thegreatest numbers of small farms and grazing farms will be far lesslikely to keep pace with the compression of the terms of trade.
3.4 theme 1 CHANGING SOCIO-ECONOMIC LANDSCAPES

The health of our catchments > a Victorian report card
13
Indicator:
> Percentage of farm land managed by financially large farm businesses.
The changing balance of farm and urban population
The counterpoint of increased productivity in agriculturalindustries is a decline in the number of farms and farmers. Thenumber of Australian farms has halved in the past 40 years.While the farmer population has been declining, the non-farmpopulation of Australia has been steadily increasing. The resulthas been an accelerating decline in the relative contribution offarming to the total Victorian and Australian population. In1920 there were 20 Victorians for every farm in the State. By1970, the ratio had risen to 50:1. Today the ratio is over 175:1.By 2021, this ratio may reach 400:1
Indicator:
> Percentage of workforce employed in farming.
Changing social values
An outcome of the increasing urbanisation of Victoria is anincreased demand for environmental and amenity services fromland and water in competition with demand for productionfrom land and water. This trend can be seen in increasedsupport for environmental initiatives such as the increasingrestrictions upon previously existing rights to clear land or themore recent return of water to the Snowy River. These pressuresoperate not just through government intervention, but alsothrough the land market, and it is the land market that has thegreatest impact upon the competitiveness of agriculturalindustries.
Increased demand for land as a place of residence will oftenincrease the market value of land. This increased value reducesthe capacity of agricultural enterprises to purchase land andimprove productivity. In the long run this will lead to aninevitable and continuing decline in competitiveness.
Indicators:
> Ratio of value of agricultural land to value of agricultural produce.
> Community concern for environmental values – indicator under development and not included in this report.
A diverging social landscape
The capacity of Victorian farms to maintain long-termcompetitiveness in international markets will vary according togeographic location. This will create a number of diverginglandscape trajectories. In the broadacre cropping districts wherethere is little amenity competition for land, farm businesses willcontinue to increase in size and decrease in number. In areaswhere agriculture finds it difficult to compete with other landusers, agricultural businesses will follow one of two paths:intensification or gradual decline.
The intensification of agriculture will be evident as an increasingproportion of the value of agricultural production coming froma decreasing area of land. The gradual decline of agriculture insome areas will be evidenced by an increasing age of farmersand/or a decline in the proportion of full-time farmers. A rangeof other indicators is planned and under development, but hasnot been completed in time for this report.
Indicators:
> Median age of farmers
> Area producing 80 per cent of farm total profit – indicator under development.
> Value of agricultural production at full equity – indicator under development.
> Gross margin per megalitre of irrigation water applied – indicator under development.
> Proportion of full-time farmers – indicator under development.
VCMC Report Card Assessment of Socio-economic conditionand trends.
Due to the type of indicator information available in the socio-economic theme it was not seen as appropriate to attemptcondition and trend assessment using the format developed forthis document. General trends are described in the text wherepossible and appropriate.
Management response assessment legend
The legend of S, Pm, C, and me is used to introduce discussion onmanagement responses at both the State and regional level:
= This symbol describes if a State strategy (or regional action plan),of relevance to the indicator, exists or is in preparation.
= This symbol outlines if the above Strategy/Plan contains clear performance measures and targets.
= This symbol describes if the above Strategy/Plan is supported by a State/regional commitment to an implementation program with resourcing.
= This symbol outlines if the Strategy/Plan contains a clear process for monitoring and evaluation.
Quality of data legend
A Green symbol represents good consistent data collection and interpretation (>5 years) on condition and trends;
An Orange symbol represents some consistent data collection and interpretation (<5 years) on either condition or trend but not both;
A Red symbol represents poor or limited data collection and interpretation.
S
me
C
Pm
❉
❉❉
The legends below apply to all indicators in this theme.
Average Net Farm Worth for Victoria
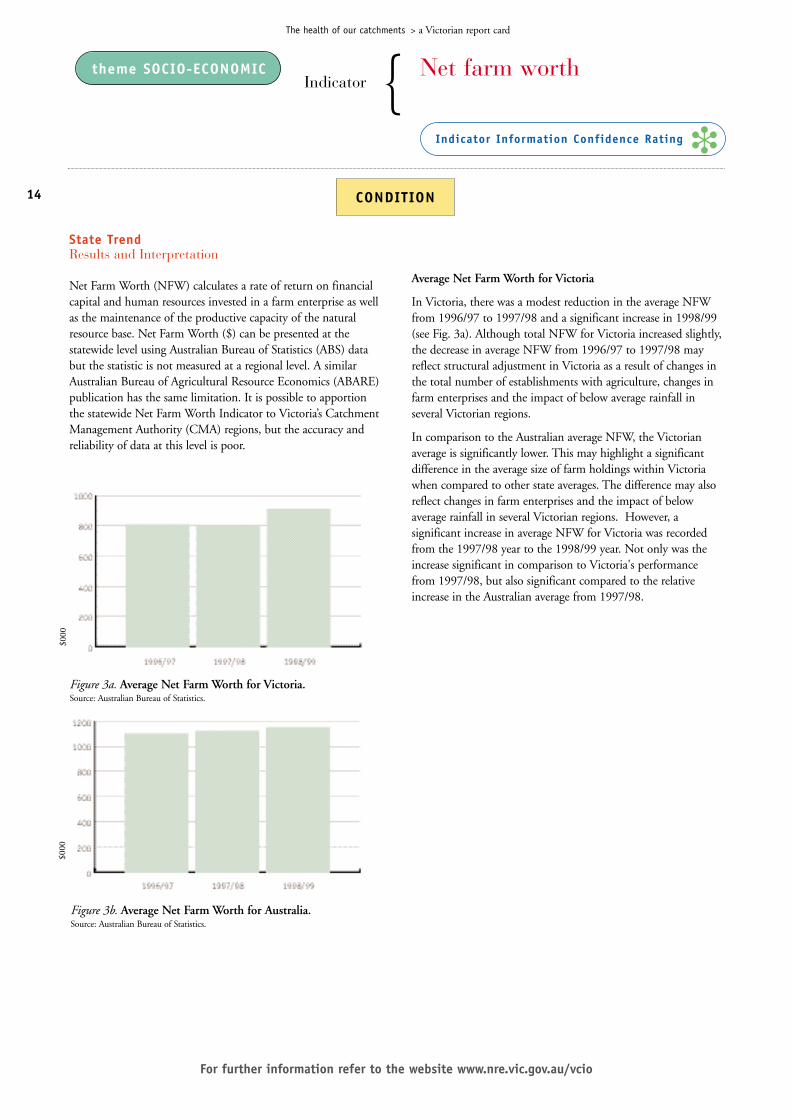
In Victoria, there was a modest reduction in the average NFWfrom 1996/97 to 1997/98 and a significant increase in 1998/99(see Fig. 3a). Although total NFW for Victoria increased slightly,the decrease in average NFW from 1996/97 to 1997/98 mayreflect structural adjustment in Victoria as a result of changes inthe total number of establishments with agriculture, changes infarm enterprises and the impact of below average rainfall inseveral Victorian regions.
In comparison to the Australian average NFW, the Victorianaverage is significantly lower. This may highlight a significantdifference in the average size of farm holdings within Victoriawhen compared to other state averages. The difference may alsoreflect changes in farm enterprises and the impact of belowaverage rainfall in several Victorian regions. However, asignificant increase in average NFW for Victoria was recordedfrom the 1997/98 year to the 1998/99 year. Not only was theincrease significant in comparison to Victoria's performancefrom 1997/98, but also significant compared to the relativeincrease in the Australian average from 1997/98.
theme SOCIO-ECONOMIC Net farm worth
CONDITION
❉Indicator Information Confidence Rating
Indicator {
State TrendResults and Interpretation
Net Farm Worth (NFW) calculates a rate of return on financialcapital and human resources invested in a farm enterprise as wellas the maintenance of the productive capacity of the naturalresource base. Net Farm Worth ($) can be presented at thestatewide level using Australian Bureau of Statistics (ABS) databut the statistic is not measured at a regional level. A similarAustralian Bureau of Agricultural Resource Economics (ABARE)publication has the same limitation. It is possible to apportionthe statewide Net Farm Worth Indicator to Victoria’s CatchmentManagement Authority (CMA) regions, but the accuracy andreliability of data at this level is poor.
14
For further information refer to the website www.nre.vic.gov.au/vcio
The health of our catchments > a Victorian report card
Figure 3a. Average Net Farm Worth for Victoria.Source: Australian Bureau of Statistics.
$000
$000
Figure 3b. Average Net Farm Worth for Australia.Source: Australian Bureau of Statistics.

State Management Response
To date there has been no strategic imperative for a State Agriculture Plan. Industry sectors have tended to produce comprehensive strategic plans and Research andDevelopment (R&D) programs. A range of drivers is pressuring change in the agricultural sector, this is stimulating discussion regarding an overarching vision and strategy for the future of agriculture in Victoria.
Comprehensive performance measures and targets existat the industry level.
There is an extensive range of agriculture related programs that implicate this and other socio-economic indicators.
The Centre for Land Protection Research conductsmuch of the socio-economic research related to NRM,including data interpretation on a project-by-projectbasis. Across the divisions of NRE a range of groups arereviewing socio-economic data.
Regional Case Study
The new FarmBis program which commenced in July 2002, willprovide about $6 million of grants each year for the next threeyears in Victoria to subsidise training for farmers, land managersand wild-catch fishers to improve their self-reliance and abilityto manage change.
The program is jointly funded by the Commonwealth and StateGovernments. Natural resource management training is apriority of the new FarmBis.
Jon Christopher is a dairy farmer near Korumburra in southGippsland. His farming system and production were impactedon significantly after attending the FarmBis-subsidised ‘HealthyFarming Systems’ course. Jon commented, "it’s not just thelearning - being with other farmers, exchanging ideas, problemsand learning informally with each other, are also major benefitsof ongoing education."
The course provides good basic knowledge and gives farmers theconfidence and knowhow to manage change.
Source: Greg Smith Victorian Landcare & Catchment Management, Issue 22, Victoria.
15
The health of our catchments > a Victorian report card
Indicator Definition The Net Farm Worth (NFW) measure is defined as the total value of farm assets less total gross farmindebtedness. Rationale NFW measures the value of land, structures, capital equipment, financial assets and the value of livestock,while accounting for the level of farm debt. Analysing the value of financial capital and human resources of farm enterprises can providea useful insight into the income, expected farm income and how they might relate to the maintenance of the productive capacity of thenatural resource base.
MANAGEMENT RESPONSE
S
me
C
Pm
Regional Management Regional Action orResponse Implementation Plan
Corangamite CMA yes no no yesNorth East CMA yes no no noMallee CMA no no no noNorth Central CMA no no no noPort Phillip CaLP no no no noGoulburn Broken CMA no no no noGlenelg-Hopkins CMA no no no noEast Gippsland CMA no no no noWest Gippsland CMA no no no noWimmera CMA no no no no
meCPm

The health of our catchments > a Victorian report card
State Status
State TrendResults and Interpretation
This indicator shows the total area of farm establishmentsreported to the Australian Bureau of Statistics through the farmcensus as a percentage of the total privately owned or leasedrural land (excluding built-up areas) within each Statistical LocalArea (SLA).
A high percentage indicates a high proportion of rural land isused by farm businesses that produce sufficient gross income toqualify for inclusion within the Australian Agricultural Census.
A low percentage indicates a significant proportion of rural landis not managed as part of a farm business.
Commercial agriculture dominates rural land use in the Mallee,Wimmera and East Gippsland.
Commercial agriculture is less dominant in peri-urban areasaround Melbourne and regional centres of Geelong, Bendigo,Ballarat, Shepparton, the La Trobe Valley and Wangaratta. In
16
For further information refer to the website www.nre.vic.gov.au/vcio
theme SOCIO-ECONOMIC Percentage of private landused for agriculture
CONDITION
❉Indicator Information Confidence Rating
Indicator {
these locations we can conclude that much of the "agricultural"land identified by the Bureau of Rural Sciences land use map isserving an amenity function.
Coastal and hill country locations are transitional, withcommercial agriculture generally being the major land use, butless dominant than in the Mallee or Wimmera. In theselocations, land values are often higher than would be suggestedby the agricultural capacity of the land. This will limit thecapacity of farms in these regions to maintain commercialviability over the longer term.
These differences have implications for land managementprograms. Some sustainable land management practices such asthe sowing of perennial pasture for salinity control will be oflittle relevance to rural land owners who are not motivated bycommercial objectives.
Figure 4. Percentage of rural land managed bycommercial farms.Source: Australian Bureau of Statistics.
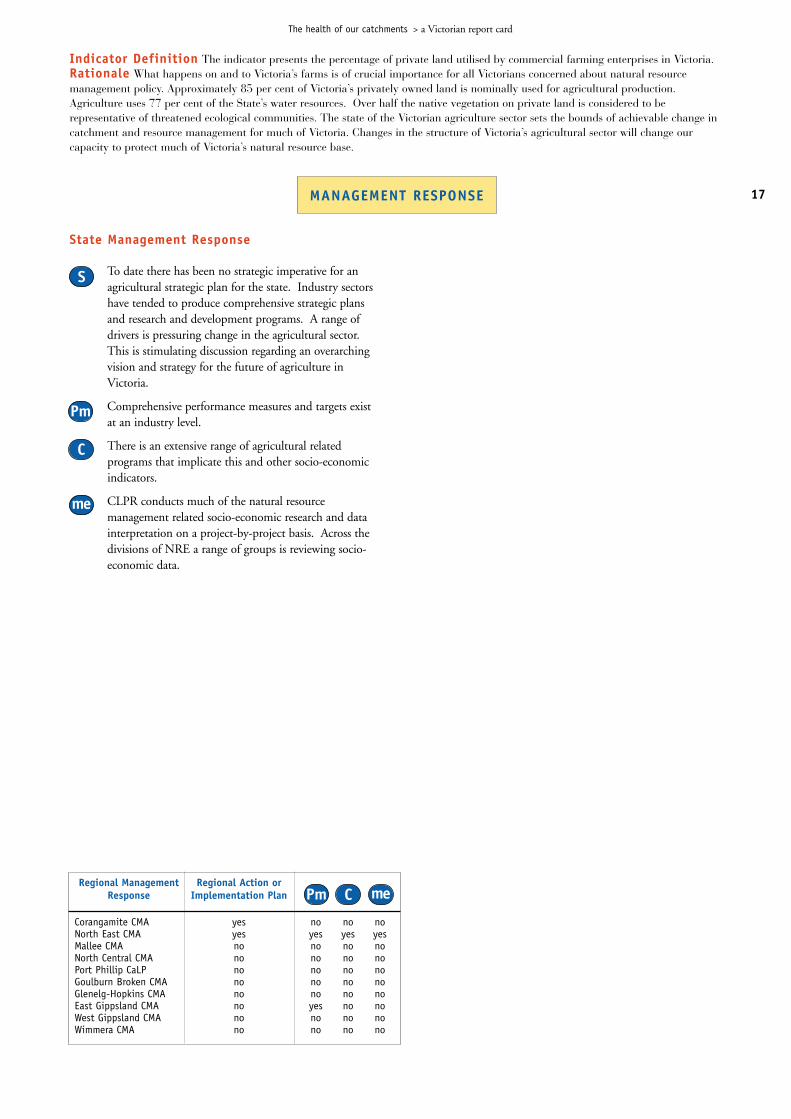
State Management Response
To date there has been no strategic imperative for an agricultural strategic plan for the state. Industry sectors have tended to produce comprehensive strategic plans and research and development programs. A range ofdrivers is pressuring change in the agricultural sector.This is stimulating discussion regarding an overarchingvision and strategy for the future of agriculture inVictoria.
Comprehensive performance measures and targets existat an industry level.
There is an extensive range of agricultural related programs that implicate this and other socio-economic indicators.
CLPR conducts much of the natural resourcemanagement related socio-economic research and datainterpretation on a project-by-project basis. Across thedivisions of NRE a range of groups is reviewing socio-economic data.
17
The health of our catchments > a Victorian report card
Indicator Definition The indicator presents the percentage of private land utilised by commercial farming enterprises in Victoria.Rationale What happens on and to Victoria’s farms is of crucial importance for all Victorians concerned about natural resourcemanagement policy. Approximately 85 per cent of Victoria’s privately owned land is nominally used for agricultural production.Agriculture uses 77 per cent of the State’s water resources. Over half the native vegetation on private land is considered to berepresentative of threatened ecological communities. The state of the Victorian agriculture sector sets the bounds of achievable change incatchment and resource management for much of Victoria. Changes in the structure of Victoria’s agricultural sector will change ourcapacity to protect much of Victoria’s natural resource base.
MANAGEMENT RESPONSE
S
me
C
Pm
Regional Management Regional Action orResponse Implementation Plan
Corangamite CMA yes no no noNorth East CMA yes yes yes yesMallee CMA no no no noNorth Central CMA no no no noPort Phillip CaLP no no no noGoulburn Broken CMA no no no noGlenelg-Hopkins CMA no no no noEast Gippsland CMA no yes no noWest Gippsland CMA no no no noWimmera CMA no no no no
meCPm

State Status
18
For further information refer to the website www.nre.vic.gov.au/vcio
The health of our catchments > a Victorian report card
theme SOCIO-ECONOMIC Percentage of workforceemployed in farming
CONDITION
❉Indicator Information Confidence Rating
Indicator {
State TrendResults and Interpretation
Since the 1950s Victorian society has rapidlytransformed from an agrarian to a non-agrarian society. The number of Victorianfarms has halved since the Second WorldWar. In the same period Victoria’s non-farmpopulation has doubled, fuelled by the post-war baby boom and migration. The result hasbeen an exponential increase in the ratio ofMelbourne residents to farm establishments.The period of greatest transformationoccurred been during the 1970s and 1980s.Figure 5 shows that in 1885 there werearound 5 urban people for every farmestablishment. By 2000 this ratio hadincreased to reach 90 to one. The rate ofincrease in this ratio may slow in the future asa consequence of a slowing in the rate ofpopulation increase. The number of farmestablishments can be expected to continue todecline.
Similar trends are apparent in the ratio of thetotal workforce to agricultural workforce inVictoria. Between 1954 and 1996 this ratioincreased from 10 to 30 (see Figure 6). Theperiod of greatest increase was between 1986and 1996, suggesting this transformation ofour society is far from complete.
Rat
io
Year
Rat
io
Year
Figure 5. Ratio of Melbourne Population to Victorian FarmEstablishmentsSource: Australian Bureau of Statistics.
Figure 6. Ratio of total workforce to agricultural workforce inVictoria 1954-1996Source: Australian Bureau of Statistics.

The health of our catchments > a Victorian report card
State Management Response
To date there has been no strategic imperative for an agricultural strategic plan for the state. Industry sectors have tended to produce comprehensive strategic plans and R&D programs. A range of drivers is pressuring change in the agricultural sector. This is stimulating discussion regarding an overarching vision and strategyfor the future of agriculture in Victoria.
Comprehensive performance measures and targets exist at an industry level.
There is an extensive range of agricultural related programs that implicate this and other socio-economic indicators.
CLPR conducts much of the natural resourcemanagement related socio-economic research and datainterpretation on a project by project basis. Across thedivisions of NRE a range of groups is reviewing socio-economic data.
19
Indicator Definition This indicator portrays the proportion of the workforce employed directly in farming enterprises. It does notportray employment in the food industry or the agricultural service sector. Rationale A decline in the number of farms and farmers isan inevitable outcome of increased productivity achieved by Victoria’s agricultural businesses. This decline, coupled with an increase inthe urban population, has contributed to the long term transformation of Victoria from an agrarian society to a much more complexsociety. In some areas of Victoria, this will provide opportunities for government policy to promote improved land stewardship andecosystem services.
MANAGEMENT RESPONSE
The declining proportion of the workforce employed inagriculture is not just a phenomenon related to the growth ofMelbourne. This decline is apparent in all parts of Victoria andcan be seen in the two snapshots of Victoria’s workforce in 1954and 1996.
S
me
C
Pm
Figure 8. Ratio of agricultural workforce to total workforce inVictoria - 1996Source: Australian Bureau of Statistics.
Figure 7. Ratio of agricultural workforce to total workforce inVictoria - 1954Source: Australian Bureau of Statistics.
Regional Management Regional Action orResponse Implementation Plan
Corangamite CMA no no no noNorth East CMA yes no no noMallee CMA no no no noNorth Central CMA no no no noPort Phillip CaLP no no no noGoulburn Broken CMA no no no noGlenelg-Hopkins CMA no no no noEast Gippsland CMA no no no noWest Gippsland CMA no no no noWimmera CMA no no no no
meCPm

The health of our catchments > a Victorian report card
State Status
good transport links to Melbourne. In these areas, there is littleprospect of broadacre agricultural businesses being able toincrease productivity by purchasing additional farm land.
The ratio of land value to production value is low in thecropping zone and northern irrigation districts. This land holdsa much lower amenity attraction. Farm businesses in these areaswill have less difficulty maintaining productivity as they willexperience less competition for land from outside purchasers.The counterpoint to this is the inevitability of continuedpopulation decline outside major regional centres.
theme SOCIO-ECONOMIC Ratio of value of agriculturalland to value of agriculturalproduction
CONDITION
❉Indicator Information Confidence Rating
Indicator {
20
For further information refer to the website www.nre.vic.gov.au/vcio
State TrendResults and Interpretation
The ratio of land value to production value is measured bycomparing the average land price per hectare with the averageestimated value of agricultural operations (EVAO). Land valuesare higher in comparison to agricultural production aroundmajor population centres and along the spine of the GreatDividing Range.
In the west of the State this is in part a reflection of the lowprice of wool during the early to mid 1990s.
Along the Hume Highway corridor the high ratio is a reflectionof small block sizes and the amenity value of scenic land with
Figure 9. Ratio of land value to productionvalue.Source: Australian Bureau of Statistics.
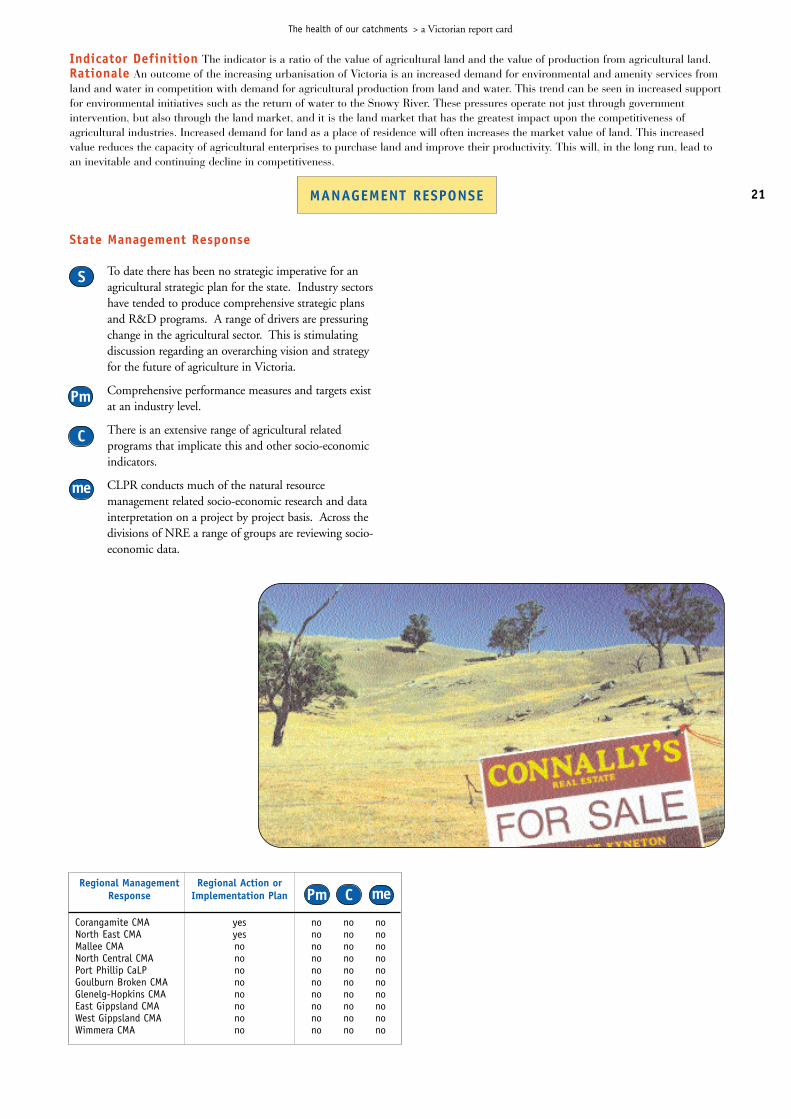
State Management Response
To date there has been no strategic imperative for an agricultural strategic plan for the state. Industry sectors have tended to produce comprehensive strategic plans and R&D programs. A range of drivers are pressuring change in the agricultural sector. This is stimulatingdiscussion regarding an overarching vision and strategyfor the future of agriculture in Victoria.
Comprehensive performance measures and targets existat an industry level.
There is an extensive range of agricultural related programs that implicate this and other socio-economic indicators.
CLPR conducts much of the natural resourcemanagement related socio-economic research and datainterpretation on a project by project basis. Across thedivisions of NRE a range of groups are reviewing socio-economic data.
21
The health of our catchments > a Victorian report card
Indicator Definition The indicator is a ratio of the value of agricultural land and the value of production from agricultural land.Rationale An outcome of the increasing urbanisation of Victoria is an increased demand for environmental and amenity services fromland and water in competition with demand for agricultural production from land and water. This trend can be seen in increased supportfor environmental initiatives such as the return of water to the Snowy River. These pressures operate not just through governmentintervention, but also through the land market, and it is the land market that has the greatest impact upon the competitiveness ofagricultural industries. Increased demand for land as a place of residence will often increases the market value of land. This increasedvalue reduces the capacity of agricultural enterprises to purchase land and improve their productivity. This will, in the long run, lead toan inevitable and continuing decline in competitiveness.
MANAGEMENT RESPONSE
S
me
C
Pm
Regional Management Regional Action orResponse Implementation Plan
Corangamite CMA yes no no noNorth East CMA yes no no noMallee CMA no no no noNorth Central CMA no no no noPort Phillip CaLP no no no noGoulburn Broken CMA no no no noGlenelg-Hopkins CMA no no no noEast Gippsland CMA no no no noWest Gippsland CMA no no no noWimmera CMA no no no no
meCPm

The health of our catchments > a Victorian report card
State TrendResults and Interpretation
There are similarities between the information provided inFigure 10 and that provided on previous maps for indicators onagricultural workforce and value of agricultural land to value ofproduction. This demonstrates a relationship between theviability of broadacre agricultural industries, land values and therelative importance of agriculture to the regional economy.
State Status
22
For further information refer to the website www.nre.vic.gov.au/vcio
theme SOCIO-ECONOMIC Percentage of farm land managedby financially large farms
CONDITION
❉Indicator Information Confidence Rating
Indicator {
Figure 10. Percent of farm land managed by farm businesseswith gross sales greater than $300,000.Source: Australian Bureau of Statistics.

State Management Response
To date there has been no strategic imperative for an agricultural strategic plan for the state. Industry sectors have tended to produce comprehensive strategic plans and R&D programs. A range of drivers is pressuring change in the agricultural sector. This is stimulatingdiscussion regarding an overarching vision and strategyfor the future of agriculture in Victoria.
Comprehensive performance measures and targets existat an industry level.
There is an extensive range of agricultural related programs that implicate this and other socio-economic indicators.
CLPR conducts much of the natural resourcemangement related socio economic research and datainterpretation on a project by project basis. Across thedivisions of NRE a range of groups is reviewing socio-economic data.
23
The health of our catchments > a Victorian report card
Indicator Definition Percentage of farm land managed by financially large farms in Victoria. Rationale Compression offarmers’ terms of trade are an ongoing aspect of most agricultural industries. To remain competitive, farm businesses must generateproductivity increases at a rate that generates sufficient productivity gains to stay ahead of the compression of farmers’ terms of trade.Recent research suggests that only the larger broadacre farms (measured by gross income) are generating these gains. Therefore, smalland medium farms will need to expand to manage the declining terms of trade. In areas with high land value, farm expansion may berestricted by increased capital investment and lower returns. Over the longer term, high land values are likely to lead to the adoption ofintensive agricultural land uses or land retirement from agriculture. This indicator will identify where land use change is likely to occurand will provide government with spatial information to support strategy and policy development.
MANAGEMENT RESPONSE
S
me
C
Pm
Regional Management Regional Action orResponse Implementation Plan
Corangamite CMA no no no noNorth East CMA yes no no noMallee CMA no no no noNorth Central CMA no no no noPort Phillip CaLP no no no noGoulburn Broken CMA no no no noGlenelg-Hopkins CMA no no no noEast Gippsland CMA no no no noWest Gippsland CMA no no no noWimmera CMA no no no no
meCPm
The majority of the farm landscapes of the cropping andirrigation regions of northern Victoria are managed as part offarm businesses with gross sales greater than $300,000 perannum. Businesses in these regions can be expected to generatepositive returns to capital and to be capable of keeping up withthe decline in the agricultural terms of trade. Relatively low landvalues will allow some of these businesses to expand throughpurchase of neighbouring farms. This aggregation will fuelregional population decline.
The farm landscape of many SLAs along the northern slopes ofthe Great Dividing Range is dominated by smaller farms. Thesefarms will be less likely to keep up with the decline in theagricultural terms of trade. They will also be less likely toincrease scale because of the higher relative land values in theseareas. The future for agriculture in these regions will be acombination of intensification of operations on some farms anddecreasing competiveness on others. This is associated with agradual ageing of the farm population in these areas as feweryoung persons enter agriculture due to perceived limitedopportunities.

The health of our catchments > a Victorian report card
State Status
24
For further information refer to the website www.nre.vic.gov.au/vcio
theme SOCIO-ECONOMIC Median age of farmers
CONDITION
❉Indicator Information Confidence Rating
Indicator {
Figure 11. Median farmer age - 1986.Source: Australian Bureau of Statistics.
Figure 12. Median farmer age - 1996.Source: Australian Bureau of Statistics.

State Management Response
To date there has been no strategic imperative for an agricultural strategic plan for the state. Industry sectors have tended to produce comprehensive strategic plans and R&D programs. A range of drivers is pressuring change in the agricultural sector. This is stimulatingdiscussion regarding an overarching vision and strategyfor the future of agriculture in Victoria.
Comprehensive performance measures and targets existat an industry level.
There is an extensive range of agricultural related programs that implicate this and other socio-economic indicators.
CLPR conducts much of the natural resourcemanagement related socio-economic research and datainterpretation on a project by project basis. Across thedivisions of NRE a range of groups is reviewing socio-economic data.
State TrendResults and Interpretation
Between 1986 and 1996 the median age of farmers increased inmost regions of the state. This is an outcome of reducednumbers of younger persons entering agriculture.
Median ages of farmers are highest in those regions with smallerfarms, higher land values and lower proportions of the workforceemployed in agriculture.
There are major questions arising over intergenerational transferand land ownership in these regions during the next twodecades. It is likely that subsequent generations of users of thisland will have different cultural expectations with regard to theland and farming.
Changes in the values and aspirations of the land-owningpopulation may open new options for catchment protection.Some districts may move increasingly towards a form ofretirement farming with a stable aged population of landmanagers. This scenario is most characterised by the beefindustry in the high rainfall zone and in sections of the woolindustry.
25
The health of our catchments > a Victorian report card
Indicator Definition The median age of farmers in Victoria. Rationale The decline in the rate of entry of younger people tofarming and the associated deferral of retirement from farming is expected to lead to an ageing of the farm population. The ageing ofthe farm population has been evident in official statistics Australia since 1981.30 In some regions, increasing median farmer age may be atransitory phase between present land use patterns, and a new land use structure that will develop when the current generation of landmanagers retire from farming.
MANAGEMENT RESPONSE
S
me
C
Pm
Regional Management Regional Action orResponse Implementation Plan
Corangamite CMA yes no no noNorth East CMA yes no no noMallee CMA no no no noNorth Central CMA no no no noPort Phillip CaLP no no no noGoulburn Broken CMA no no no noGlenelg-Hopkins CMA no no no noEast Gippsland CMA no no no noWest Gippsland CMA no no no noWimmera CMA no no no no
meCPm

26
The maintenance of biodiversity is underpinned by healthyecosystem processes and ecologically sustainable catchments.
Know Your Catchments (1997) did not address biodiversitycondition, pressures and trends at any meaningful level.
The pressures on biodiversity result from the fragmentation andcontinued degradation of native vegetation and other habitatsand direct impact on species. Major threatening processeswhich degrade habitat values and impact on the viability ofthreatened species populations include overgrazing, introducedpredators, herbivores, environmental weeds, altered fire andwater regimes, salinity, habitat loss and disturbance.
Based on limited information, current trend analysis indicatesthe continued decline of biodiversity values across much of thelandscape.
The Victorian Catchment Indicators Report, 2001 discussesindicators developed to report on conservation status andcondition of native vegetation classes and native species. Wehave good information on the distribution of these assets acrossmuch of the State. However, data on condition and trends isextremely limited.
We currently have bioregional conservation status for nativevegetation data for in excess of 70 per cent of the State, andmapping of the remainder will be completed by 2004. Theimplementation of the Native Vegetation ManagementFramework means that in the medium-term, trends inconservation status and the contribution of native vegetation tocatchment biodiversity values will result mainly from changes in
condition. Whilst the ‘habitat hectares’ approach will enable usto measure such changes at a site-based level, this approachneeds to be supplemented by additional data to allow themeasurement of ongoing changes in vegetation conditionresulting from threatening process and management changes at alandscape scale. Our current inability to assess native vegetationcondition at a broad-scale is perhaps the biggest gap in ourcurrent knowledge base.
Native species conservation status is assessed at National andState level and trials of bioregional status have been underwayfor the past two years. Changes in the number of threatenedspecies in each status class is a relatively coarse measure ofenvironmental and catchment condition. Information on thesize of a representative sample of threatened (and non-threatened) species populations is required as a useful baselinefor reporting changes in catchment biodiversity condition and isa component of the national framework for monitoring andevaluation. A developmental project is required to establishprotocols and techniques for this indicator.
We need a considerable increase in effort to establish baselinesand commence periodic monitoring of trends in native speciespopulations and habitat quality. Ideally we require across thelandscape assessment of changes in native vegetation and otherhabitat condition which can be linked to land managementpractice.
Baseline population data should be collected for at least allthreatened species considered as bioregional priorities. Withinthis group, monitoring of trends in populations should be
The health of our catchments > a Victorian report card
3.5 theme 2 BIODIVERSITY

27
The health of our catchments > a Victorian report card
Figure 13. Victoria’s Bioregions.Source: NRE GIS Corporate Database.
stratified to species where sensitivity to particular threateningprocesses, and changes in management regime have been, or canbe demonstrated.
We are currently reporting only on the least sensitive andinformative biodiversity indicators that have been identified.Improvement of our capacity to monitor biodiversity in a waywhich will effectively inform management and policy investmentdecisions will require a real commitment to develop thepopulation level, trend, and vegetation condition indicators. It isnot feasible to measure all threatened species populations,therefore a targeted (but nevertheless considerable increase oncurrent monitoring levels) approach is needed.
Methodologies (such as biodiversity action planning andBioregional analysis) are currently being implemented whichmay allow us to identify suitable suites of species andpopulations (and their habitat requirements) as targets forbaseline population monitoring. Further work is proposed todetermine those species with particular sensitivity to catchment-wide threatening processes (salinity and water quality). Similarsubsets of species in each bioregion should be identified for othermajor management issues.
Improved remote sensing (in conjuction with ground truthingthrough refined and vegetation-specific habitat hectareassessments) offers the real possibility of development oflandscape-scale surrogates for vegetation condition.Development of these modelling techniques will allow morethorough understanding of landscape processes and repeatablemeasures of the diffuse degradation that is the source of muchloss of biodiversity and other environmental assets.
Management response assessment legend
The legend of S, Pm, C, and me is used to introduce discussion onmanagement responses at both the State and regional level:
= This symbol describes if a State strategy (or regional action plan),of relevance to the indicator, exists or is in preparation.
= This symbol outlines if the above Strategy/Plan contains clear performance measures and targets.
= This symbol describes if the above Strategy/Plan is supported by a State/regional commitment to an implementation program with resourcing.
= This symbol outlines if the Strategy/Plan contains a clear process for monitoring and evaluation.
Quality of data legend
A Green symbol represents good consistent data collection and interpretation (>5 years) on condition and trends;
An Orange symbol represents some consistent data collection and interpretation (<5 years) on either condition or trend but not both;
A Red symbol represents poor or limited data collection and interpretation.
S
me
C
Pm
❉
❉❉
The legends below apply to all indicators in this theme.

Of the remaining 30 per cent, it is estimated that 7.4 millionhectares are located on public land and approximately 1.1million hectares are found on private land.
According to our most recent statewide assessment Victoria isstill losing an estimated 2,500 hectares of native vegetation peryear.
Data on the current and presumed original extent of EVCs isavailable for the majority of Victoria and this allowsdetermination of conservation status based primarily onhistorical impacts. However, data on short-term changes inextent and condition is very limited and so quantitative trendassessments are not yet possible.
theme BIODIVERSITY Conservation status of nativevegetation types at the stateand bioregional level
CONDITION
❉Indicator Information Confidence Rating
Indicator {
Regional Condition and Trend
Corangamite Port Phillip Wimmera West Gippsland North East
Goulburn Broken Glenelg-Hopkins Mallee East Gippsland North Central
State Condition and Trend
?
▼
?
?
?
?
?
?
? ?
?
Condition Legend
OPTIMAL
GOOD
MODERATE
POOR
Trend Legend
POSITIVE
NEGATIVE
STABLE
UNKNOWN
▲
▼
?
State TrendResults and Interpretation
Loss of extent and condition of native vegetation since Europeansettlement is recognised as the greatest historical impact onnative biodiversity. The consequences of this reduction andfragmentation for species viability and ecological resilience,continue to be expressed and are a major reason for thecontinuing decline in biodiversity.
It is estimated that 70 per cent of Victoria's native vegetationhas been cleared since European settlement, and that thisclearing has impacted in particular on vegetation types(Ecological Vegetation Classes) in the more fertile and/oraccessible landscapes that are suited to pastoral, agricultural orurban use.
28
For further information refer to the website www.nre.vic.gov.au/vcio
The health of our catchments > a Victorian report card
Figure 14. Proportion of remnant tree coverwithin bioregions.Source: NRE GIS Corporate Database

State Management Response
Victoria’s Biodiversity Strategy; Victoria’s Native Vegetation Management – A Framework for Action; Regional Forest Agreements.
Reversal of decline in extent and quality of native vegetation, leading to a net gain with the first target being no net loss by 2001. The present diversity ofspecies and ecological communities and their viability ismaintained or improved across each bioregion. There isno further preventable decline in the viability of any rarespecies or of any rare community. There is an increase inthe viability of threatened species (endangered andvulnerable) and in the extent and quality of threatenedecological communities.
15 per cent of the pre-1750 distribution of each forest ecosystem should be protected; at least 60 per cent ofthe remaining extent of vulnerable forest ecosystemsshould be reserved.
Yes – resources for native vegetation protection and for native revegetation are provided through State and Commonwealth programs like Bushcare, National Action Plan for Salinity and Water Quality, and a range of other incentive schemes.
The conservation status of vegetation types at the bioregional level primarily reflects the net result of historical impacts. These ratings are not expected tochange in the short-term they are therefore suitable forindicating resource condition but not trend. Assessmentof trends requires information on extent and conditionchanges at a finer scale, in both time and space.Information management systems to better record directactivities relating to native vegetation are underdevelopment. However there is currently no regularinventory of native vegetation extent / condition (at anappropriate scale) to measure the net outcome.
Bioregional Conservation Status of Ecological Vegetation Classes
Presumed Extinct Probably no longer present in the bioregion
Endangered < 10% of pre-European extent remains
Vulnerable 10 – 30% pre-European remains
Depleted >30% and up to 50% pre-European extent remains
Least Concern >50% pre-European extent remains
Rare Total range <10,000ha or pre-European extent in bioregion <1,000ha or patch size <100ha
29
The health of our catchments > a Victorian report card
Indicator Definition This indicator describes the current conservation status of Ecological Vegetation Classes (EVCs) at thebioregional level. EVCs are categorised as either Presumed Extinct, Endangered, Vulnerable, Depleted, Rare or Least Concern(conservation status criteria). This indicator also reports on the extent of EVC depletion that has occurred post European settlement. Inaddition this indicator summarises the proportion of EVC being managed within different land tenures as a measure of the likely degreeof protection. Rationale The Flora and Fauna Guarantee Act, 1988, Victorian Biodiversity Strategy (1997), Regional ForestAgreements, Victoria’s Native Vegetation Management – A Framework for Action 2002, Regional Catchment Strategies, Regional NativeVegetation Plans and Action Statements all recognise the need for biodiversity conservation and monitoring across a range of nativevegetation types. These strategies and plans recognise that a ‘whole of landscape’ or ‘tenure blind’ perspective is the most appropriateplanning approach for native vegetation conservation, but also recognise that different strategic emphases and tools will be required fordifferent tenures. It is important to ensure that information regarding the conservation status of native vegetation types is available tocommunity groups and governments, both to guide priorities for protection and investment, and to measure progress resulting from theseinterventions.
S
Pm
Regional Management Regional Action orResponse Implementation Plan
Corangamite CMA yes* In prep yes In prepNorth East CMA yes* In prep yes In prepMallee CMA yes* In prep yes In prepNorth Central CMA yes* In prep yes In prepPort Phillip CaLP yes* In prep yes In prepGoulburn Broken CMA yes* In prep yes In prepGlenelg-Hopkins CMA yes* In prep yes In prepEast Gippsland CMA yes* In prep yes In prepWest Gippsland CMA yes* In prep yes In prepWimmera CMA yes* In prep yes In prep
meCPm
Figure 15. Bioregional Conservation Status of EcologicalVegetation Classes by Catchment Management Authority.Source: Parks Flora and Fauna Division, DNRE 2002.
* Regional Native Vegetation Plans are being finalised following release of Victoria’s NativeVegetation Management – A Framework for Action and Bioregional Action Plans are underdevelopment.
MANAGEMENT RESPONSE
me
C
Table 1. Definition of biological conservation status of EVCs.
Are
a of
CM
A (
%)

State TrendResults and Interpretation
Fauna
Figure 17 shows the statewide conservation status of vertebrateanimal species within Victoria.
793 native vertebrate species (excluding marine fish) have beenrecorded for Victoria.
> 23 (3%) taxa are Extinct in Victoria
> 36 (5%) Critically Endangered
> 52 (7%) Endangered
> 64 (8%) Vulnerable
> 62 (8%) are either near Threatened, or believed to be Threatened, but current data is insufficient to assign a levelof threat.
69 invertebrate taxa have also been identified as Rare,Threatened or Extinct.
Flora
Figure 17 shows the statewide conservation status of plantspecies within Victoria.
There are approximately 4,200 taxa (species subspecies orvarieties) of native flora currently recognised in Victoria.
Of these:
> 48 (1%) are believed to be Extinct in Victoria
> 250 (6%) Endangered
> 471 (11%) Vulnerable
> 789 (19%) Rare
> 306 (7%) are poorly known but believed to fall into one of the Rare or Threatened categories
theme BIODIVERSITY Conservation status of species atthe State and bioregional level
CONDITION
❉Indicator Information Confidence Rating
Indicator {
Regional Condition and Trend
Corangamite Port Phillip Wimmera West Gippsland North East
Goulburn Broken Glenelg-Hopkins Mallee East Gippsland North Central
State Condition and Trend
?
▼
?
?
?
?
?
?
?
?
Condition Legend
OPTIMAL
GOOD
MODERATE
POOR
Trend Legend
POSITIVE
NEGATIVE
STABLE
UNKNOWN
▲
▼
?
State Status
30
For further information refer to the website www.nre.vic.gov.au/vcio
The health of our catchments > a Victorian report cardPr
opor
tion
of t
axa
Figure 16. Victorian Bioregions.Source: NRE GIS Corporate Database.
Figure 17. Conservation Status of Victorian Flora and Fauna.Source: Flora Information System DNRE (May 2002), Threatened Vertebrate Fauna inVictoria - 2000, NRE.
?
The condition legend below relates to the proportion ofspecies that are threatened within each CMA Region.Trend information is not available at the regional level.
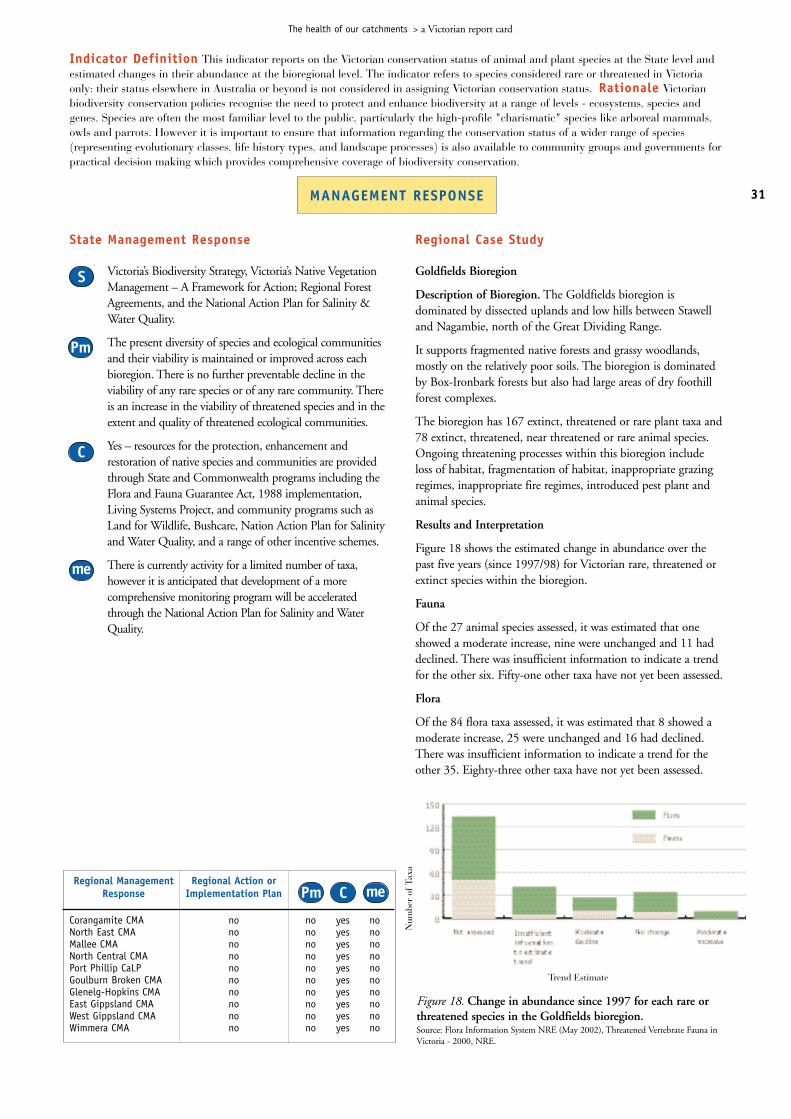
State Management Response
Victoria’s Biodiversity Strategy, Victoria’s Native Vegetation Management – A Framework for Action; Regional Forest Agreements, and the National Action Plan for Salinity & Water Quality.
The present diversity of species and ecological communities and their viability is maintained or improved across each bioregion. There is no further preventable decline in the viability of any rare species or of any rare community. Thereis an increase in the viability of threatened species and in theextent and quality of threatened ecological communities.
Yes – resources for the protection, enhancement and restoration of native species and communities are provided through State and Commonwealth programs including the Flora and Fauna Guarantee Act, 1988 implementation,Living Systems Project, and community programs such asLand for Wildlife, Bushcare, Nation Action Plan for Salinityand Water Quality, and a range of other incentive schemes.
There is currently activity for a limited number of taxa, however it is anticipated that development of a more comprehensive monitoring program will be accelerated through the National Action Plan for Salinity and Water Quality.
Regional Case Study
Goldfields Bioregion
Description of Bioregion. The Goldfields bioregion isdominated by dissected uplands and low hills between Stawelland Nagambie, north of the Great Dividing Range.
It supports fragmented native forests and grassy woodlands,mostly on the relatively poor soils. The bioregion is dominatedby Box-Ironbark forests but also had large areas of dry foothillforest complexes.
The bioregion has 167 extinct, threatened or rare plant taxa and78 extinct, threatened, near threatened or rare animal species.Ongoing threatening processes within this bioregion includeloss of habitat, fragmentation of habitat, inappropriate grazingregimes, inappropriate fire regimes, introduced pest plant andanimal species.
Results and Interpretation
Figure 18 shows the estimated change in abundance over thepast five years (since 1997/98) for Victorian rare, threatened orextinct species within the bioregion.
Fauna
Of the 27 animal species assessed, it was estimated that oneshowed a moderate increase, nine were unchanged and 11 haddeclined. There was insufficient information to indicate a trendfor the other six. Fifty-one other taxa have not yet been assessed.
Flora
Of the 84 flora taxa assessed, it was estimated that 8 showed amoderate increase, 25 were unchanged and 16 had declined.There was insufficient information to indicate a trend for theother 35. Eighty-three other taxa have not yet been assessed.
31
The health of our catchments > a Victorian report card
Indicator Definition This indicator reports on the Victorian conservation status of animal and plant species at the State level andestimated changes in their abundance at the bioregional level. The indicator refers to species considered rare or threatened in Victoriaonly: their status elsewhere in Australia or beyond is not considered in assigning Victorian conservation status. Rationale Victorianbiodiversity conservation policies recognise the need to protect and enhance biodiversity at a range of levels - ecosystems, species andgenes. Species are often the most familiar level to the public, particularly the high-profile "charismatic" species like arboreal mammals,owls and parrots. However it is important to ensure that information regarding the conservation status of a wider range of species(representing evolutionary classes, life history types, and landscape processes) is also available to community groups and governments forpractical decision making which provides comprehensive coverage of biodiversity conservation.
MANAGEMENT RESPONSE
S
me
C
Pm
Regional Management Regional Action orResponse Implementation Plan
Corangamite CMA no no yes noNorth East CMA no no yes noMallee CMA no no yes noNorth Central CMA no no yes noPort Phillip CaLP no no yes noGoulburn Broken CMA no no yes noGlenelg-Hopkins CMA no no yes noEast Gippsland CMA no no yes noWest Gippsland CMA no no yes noWimmera CMA no no yes no
meCPm
Figure 18. Change in abundance since 1997 for each rare orthreatened species in the Goldfields bioregion.Source: Flora Information System NRE (May 2002), Threatened Vertebrate Fauna inVictoria - 2000, NRE.
Num
ber
of T
axa
Trend Estimate

32
Rivers, floodplains, wetlands and estuaries make up only a smallportion of the Victorian landscape, yet their overall significancefor the economy, the ecology and the social fabric of Victoria isimmense. They provide society with a wide range of ecosystemservices. They support biodiversity and natural processes thatpurify water, cycle water, nutrients and sediments, buffercoastlines and mitigate flooding. They provide water fordrinking, irrigation and agriculture and for industry such asacquaculture, and forestry. They also provide focal points forrecreation and tourism and cultural enrichment, especially forindigenous Victorians.
Victoria’s rivers, wetlands and estuaries are in decline. Less than27 per cent of our major rivers are in good or excellentcondition, 35 per cent of our wetlands have been totally lost,and 44 per cent of our estuaries have been significantlymodified. The most serious pressures on rivers, wetlands andestuaries are salinisation, changes to natural water regimes,impacts related to poor land use practices and the potentialimpacts of climate change. Furthermore, these pressuresinteract. For example, reduced flow in rivers exacerbates theimpacts of salinisation and nutrient input.
Salinisation of rivers, wetlands and estuaries is likely to increasesignificantly in coming decades in line with the predictedincrease in the area affected by dryland salinity. Rivers andwetlands are particularly vulnerable as they occur at low pointsin the landscape and often intersect water tables. The impact ofchanged water regimes on aquatic ecosystems has beensignificant and the status of many aquatic-dependent species willcontinue to deteriorate unless there are significant improvementsin water regime management. Many species that depend onregular flooding to breed have become threatened in recentyears.
Poor land use practices still contribute to nutrient enrichment ofaquatic ecosystems and cause damage to wetland and riparianvegetation and in-stream habitat. Coastal wetlands often providenatural buffering to storms and high tides. However they are atrisk as sea levels rise and climate events become more extreme aspredicted under the greenhouse effect. Estuaries are vulnerableboth to the upstream effects of salinisation, reduced flows andnutrient enrichment as well as changes in marine processesdriven by global warming.
These pressures and impacts also have economic and socialcosts. The degradation in environmental condition andsubsequent poor water quality can restrict the range of economicand recreation activities dependant on healthy rivers. As well,the demand for water from these activities will continue to growand needs to be balanced against the environmental condition ifriver, wetland and estuary health is to be maintained orimproved. Climate change is also likely to affect rainfall andimpact on the water resources available for consumptive uses.
River condition is monitored by the Index of Stream Condition(ISC) which was developed as an integrated measure of rivercondition and will be important to benchmarking, settingmanagement objectives and targets, and assessing the long-termeffectiveness of river management programs.
The ISC was developed using the best available science. As ourunderstanding of river processes and management responsesincreases the ISC will require regular review and updating. Thiswill allow the ISC to reflect advances in scientific understandingto provide the most useful measure of stream condition toregional communities for planning and assessment. Oneimmediate area is requirement for the hydrology component totake into account advances in environmental flows.
The health of our catchments > a Victorian report card
3.6 theme 3 RIVERS, WETLANDS AND ESTUARIES
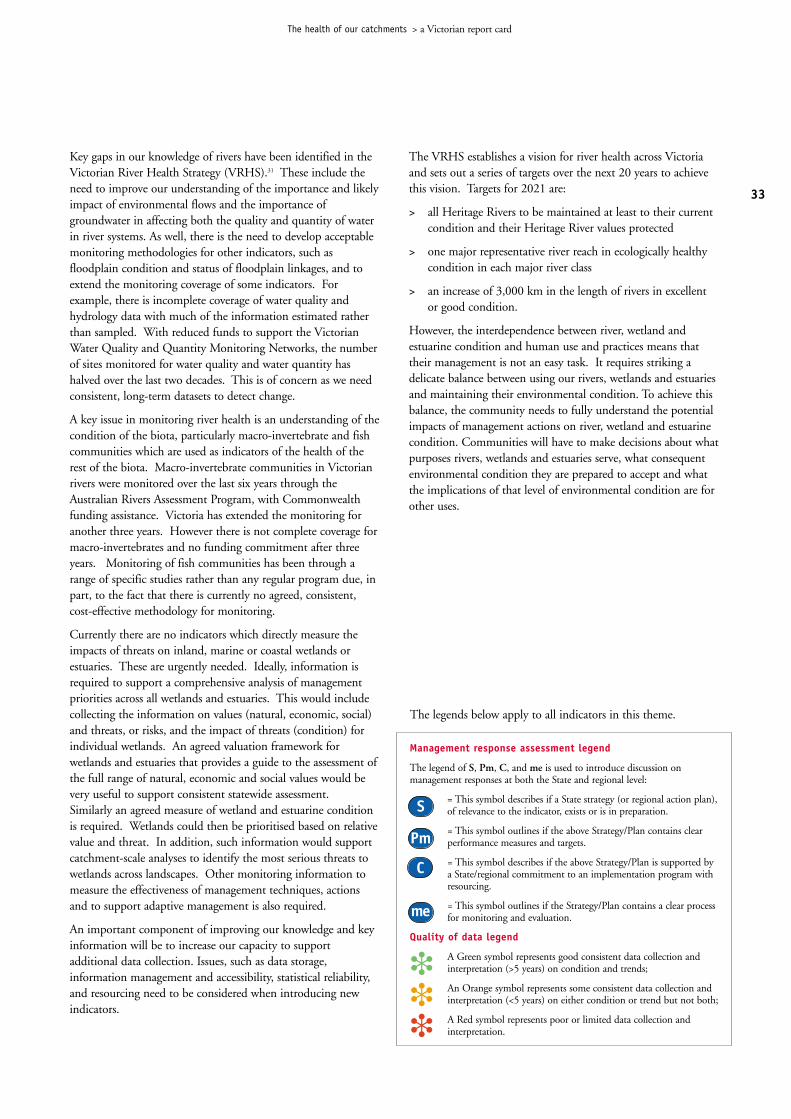
33
Key gaps in our knowledge of rivers have been identified in theVictorian River Health Strategy (VRHS).31 These include theneed to improve our understanding of the importance and likelyimpact of environmental flows and the importance ofgroundwater in affecting both the quality and quantity of waterin river systems. As well, there is the need to develop acceptablemonitoring methodologies for other indicators, such asfloodplain condition and status of floodplain linkages, and toextend the monitoring coverage of some indicators. Forexample, there is incomplete coverage of water quality andhydrology data with much of the information estimated ratherthan sampled. With reduced funds to support the VictorianWater Quality and Quantity Monitoring Networks, the numberof sites monitored for water quality and water quantity hashalved over the last two decades. This is of concern as we needconsistent, long-term datasets to detect change.
A key issue in monitoring river health is an understanding of thecondition of the biota, particularly macro-invertebrate and fishcommunities which are used as indicators of the health of therest of the biota. Macro-invertebrate communities in Victorianrivers were monitored over the last six years through theAustralian Rivers Assessment Program, with Commonwealthfunding assistance. Victoria has extended the monitoring foranother three years. However there is not complete coverage formacro-invertebrates and no funding commitment after threeyears. Monitoring of fish communities has been through arange of specific studies rather than any regular program due, inpart, to the fact that there is currently no agreed, consistent,cost-effective methodology for monitoring.
Currently there are no indicators which directly measure theimpacts of threats on inland, marine or coastal wetlands orestuaries. These are urgently needed. Ideally, information isrequired to support a comprehensive analysis of managementpriorities across all wetlands and estuaries. This would includecollecting the information on values (natural, economic, social)and threats, or risks, and the impact of threats (condition) forindividual wetlands. An agreed valuation framework forwetlands and estuaries that provides a guide to the assessment ofthe full range of natural, economic and social values would bevery useful to support consistent statewide assessment.Similarly an agreed measure of wetland and estuarine conditionis required. Wetlands could then be prioritised based on relativevalue and threat. In addition, such information would supportcatchment-scale analyses to identify the most serious threats towetlands across landscapes. Other monitoring information tomeasure the effectiveness of management techniques, actionsand to support adaptive management is also required.
An important component of improving our knowledge and keyinformation will be to increase our capacity to supportadditional data collection. Issues, such as data storage,information management and accessibility, statistical reliability,and resourcing need to be considered when introducing newindicators.
The health of our catchments > a Victorian report card
Management response assessment legend
The legend of S, Pm, C, and me is used to introduce discussion onmanagement responses at both the State and regional level:
= This symbol describes if a State strategy (or regional action plan),of relevance to the indicator, exists or is in preparation.
= This symbol outlines if the above Strategy/Plan contains clear performance measures and targets.
= This symbol describes if the above Strategy/Plan is supported by a State/regional commitment to an implementation program with resourcing.
= This symbol outlines if the Strategy/Plan contains a clear process for monitoring and evaluation.
Quality of data legend
A Green symbol represents good consistent data collection and interpretation (>5 years) on condition and trends;
An Orange symbol represents some consistent data collection and interpretation (<5 years) on either condition or trend but not both;
A Red symbol represents poor or limited data collection and interpretation.
S
me
C
Pm
❉
❉❉
The legends below apply to all indicators in this theme.
The VRHS establishes a vision for river health across Victoriaand sets out a series of targets over the next 20 years to achievethis vision. Targets for 2021 are:
> all Heritage Rivers to be maintained at least to their current condition and their Heritage River values protected
> one major representative river reach in ecologically healthy condition in each major river class
> an increase of 3,000 km in the length of rivers in excellentor good condition.
However, the interdependence between river, wetland andestuarine condition and human use and practices means thattheir management is not an easy task. It requires striking adelicate balance between using our rivers, wetlands and estuariesand maintaining their environmental condition. To achieve thisbalance, the community needs to fully understand the potentialimpacts of management actions on river, wetland and estuarinecondition. Communities will have to make decisions about whatpurposes rivers, wetlands and estuaries serve, what consequentenvironmental condition they are prepared to accept and whatthe implications of that level of environmental condition are forother uses.

State TrendResults and Interpretation
In the first benchmarking exercise,undertaken in 1999, 950 reachesrepresenting 18,000 km of Victoria’smajor streams and their tributaries wereassessed. ISC benchmarking is to beundertaken every five years by theCatchment Management Authorities inpartnership with NRE.
22 per cent of river length is in good orexcellent condition. Of these, themajority are in the south east of theState, with the basins of the EastGippsland, Snowy, Tambo, Mitchell,Thomson and South Gippsland rivershaving more than 51 per cent of theirstream length in excellent condition.
34 per cent of major rivers and streamsare in poor or very poor condition. TheISC has only been completed once andso this information provides only abenchmark. No trend informationexists at this stage. This informationwill be available after the next ISC iscompleted in 2004.
theme RIVERS, WETLANDSAND ESTUARIES
Index of stream condition
CONDITION
❉Indicator Information Confidence Rating
Indicator {
Regional Condition and Trend
Corangamite Port Phillip Wimmera West Gippsland North East
Goulburn Broken Glenelg-Hopkins Mallee East Gippsland North Central
State Condition and Trend
Condition Legend
OPTIMAL
GOOD
MODERATE
POOR
Trend Legend
POSITIVE
NEGATIVE
STABLE
UNKNOWN
▲
▼
?
1-Upper Murray River, 2-Kiewa River, 3-Ovens River, 4-Broken River, 5-Goulburn River,6-Campaspe River, 7-Loddon River, 8-Avoca River, 14-Mallee, 15-Wimmera-AvonRivers, 21-East Gippsland, 22-Snowy River, 23-Tambo River, 24-Mitchell River, 25-Thomson River, 26-Latrobe River, 27-South Gippsland, 28-Bunyip River, 29-Yarra River, 30-Maribynong River, 31-Werribee River, 32-Moorabool River, 33-Barwon River, 34-Lake Corangamite, 35-Otway Coast, 36-Hopkins River, 37-Portland Coast, 38-GlenelgRiver, 39-Millicent Coast.
Basin numbers designated by the Australian Water Resources Council. Numbering ofVictorian basins is not consecutive.
State Status
34
For further information refer to the website www.nre.vic.gov.au/vcio
The health of our catchments > a Victorian report card
Figure 19. Stream length in excellent or good condition.Source: Victorian River Health Strategy31 (Melbourne metropolitan area not included).

State Management Response
Victorian River Health Strategy (VRHS).31
The VRHS is an overarching framework. The performance measures and targets will be developed by CMAs in their Regional River Health Strategies.
Commitment exists at state (NRE) and regional levelthrough the CMA Regional River Health Strategies.
CMAs in partnership with NRE will report on stream condition in their regions every five years using theIndex of Stream Condition. NRE will review the Indexof Stream Condition prior to each five-year assessmentto ensure information collected is relevant and that thereis long-term integrity of the data.
35
The health of our catchments > a Victorian report card
Indicator Definition The Index of Stream Condition (ISC) is an integrated measure of the overall state of a stream reach, based onthe assessment of five component sub-indices – hydrology, water quality, physical form, riparian zone, and aquatic life. It is a measure ofa stream's change from natural or ideal conditions. Rationale It is a Government objective to improve the condition of Victorianwaterways to provide for the social, economic and environmental needs of current and future generations. To achieve this objective, weneed to monitor trends in stream condition. This will flag problems and identify where more detailed waterway investigations arerequired. The Index of Stream Condition was developed as an integrated indicator to provide a measure of overall stream condition.There are a number of initiatives and ongoing programs aimed at managing one or more aspects of stream condition. The ISC will enablethe assessment of the overall long-term effectiveness of an integrated river health management program.
MANAGEMENT RESPONSE
S
me
C
Pm
Regional Management Regional Action orResponse Implementation Plan
Corangamite CMA yes 2003 yes yesNorth East CMA yes In prep In prep In prepMallee CMA yes yes yes yesNorth Central CMA yes yes yes yesPort Phillip CaLP yes In prep In prep In prepGoulburn Broken CMA yes yes yes yesGlenelg-Hopkins CMA yes yes yes yesEast Gippsland CMA yes yes yes yesWest Gippsland CMA yes In prep In prep In prepWimmera CMA In prep In prep In prep In prep
meCPm
Figure 20. Percentage of stream length classified in each streamcondition class for Victorian catchments.Source: Victorian River Health Strategy31.
9%
25%
44%
15%
7%
%

State TrendResults and Interpretation
The Bulk Entitlement Conversion Program has been successfulin obtaining an improvement in environmental flows acrossVictoria.
In those systems where increased environmental flows weresought, approximately 10 per cent resulted in a fullenvironmental flow outcome, 73 per cent resulted in a partialenvironmental flow improvement and in 17 per cent of sites noimprovement was negotiated.
Although 17 per cent of sites did not result in anyenvironmental flow improvement, the Bulk EntitlementConversion Program has capped consumptive water use and willlimit the future decline in environmental flows.
Approximately 74 per cent of the total number of water supplysystems now have Bulk Entitlements. This constitutes 83 percent of the State’s total surface water resources.
There are three SFMPs presently operating. The Gellibrandand Merri SFMPs have resulted in increased environmentalflows, while the Upper Latrobe SFMP has confirmed that theexisting level of diversions is consistent with maintaining theenvironmental health of the river.
This report offers a benchmark for bulk entitlements. Theindicator will be assessed every five years from 2000, thereforeno State trend and condition data is available at this stage.
Environmental flows
CONDITION
❉Indicator Information Confidence Rating
Indicator {
Regional Condition and Trend
Corangamite Port Phillip Wimmera West Gippsland North East
Goulburn Broken Glenelg-Hopkins Mallee East Gippsland North Central
State Condition and Trend
Condition Legend
OPTIMAL
GOOD
MODERATE
POOR
Trend Legend
POSITIVE
NEGATIVE
STABLE
UNKNOWN
▲
▼
?
State Status
36
For further information refer to the website www.nre.vic.gov.au/vcio
The health of our catchments > a Victorian report cardN
umbe
r of
bul
k en
title
men
ts
River Basin
Figure 21. Statewide improvement in environmental flowsachieved through the bulk water entitlements conversionprocess.Source: CaW, NRE.
Figure 22. Improvements in environmental flows achievedthrough the bulk water entitlements conversion process byriver basin.Source: CaW, NRE.
17%
10%
73%
?
? ?
? ?
?
?
? ?
? ?
theme RIVERS, WETLANDSAND ESTUARIES
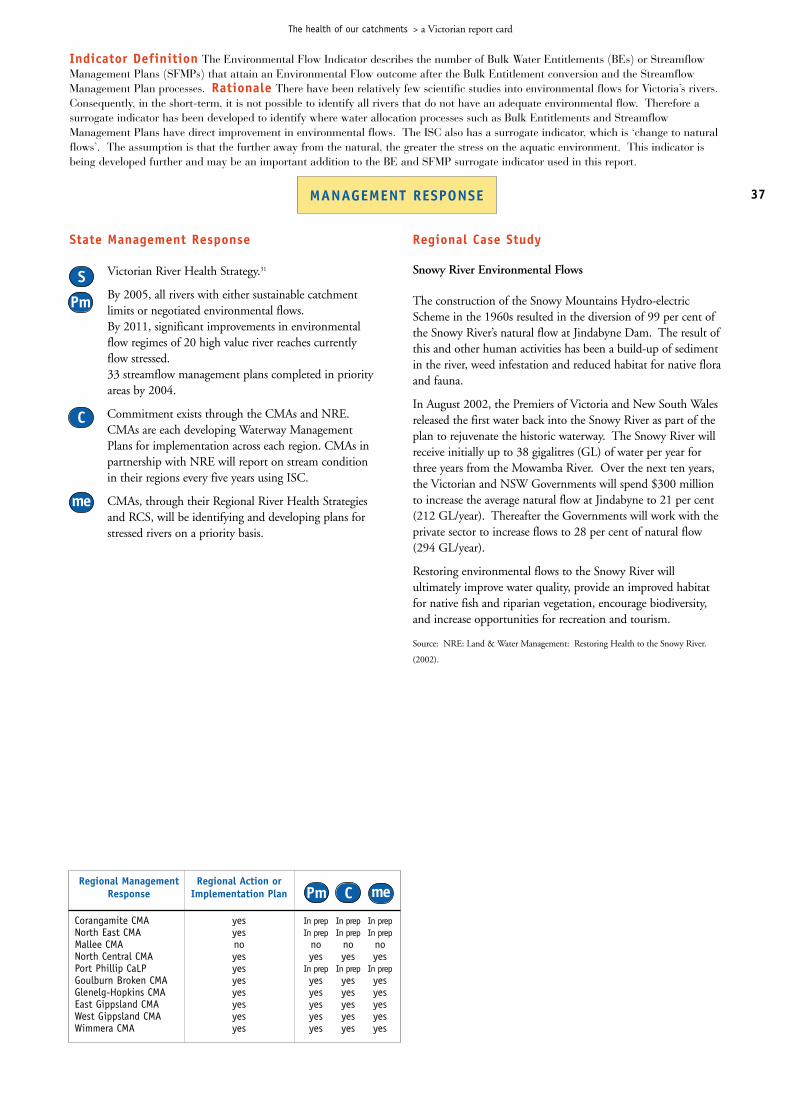
State Management Response
Victorian River Health Strategy.31
By 2005, all rivers with either sustainable catchment limits or negotiated environmental flows. By 2011, significant improvements in environmental flow regimes of 20 high value river reaches currently flow stressed.33 streamflow management plans completed in priority areas by 2004.
Commitment exists through the CMAs and NRE.CMAs are each developing Waterway ManagementPlans for implementation across each region. CMAs inpartnership with NRE will report on stream condition in their regions every five years using ISC.
CMAs, through their Regional River Health Strategies and RCS, will be identifying and developing plans for stressed rivers on a priority basis.
Regional Case Study
Snowy River Environmental Flows
The construction of the Snowy Mountains Hydro-electricScheme in the 1960s resulted in the diversion of 99 per cent ofthe Snowy River’s natural flow at Jindabyne Dam. The result ofthis and other human activities has been a build-up of sedimentin the river, weed infestation and reduced habitat for native floraand fauna.
In August 2002, the Premiers of Victoria and New South Walesreleased the first water back into the Snowy River as part of theplan to rejuvenate the historic waterway. The Snowy River willreceive initially up to 38 gigalitres (GL) of water per year forthree years from the Mowamba River. Over the next ten years,the Victorian and NSW Governments will spend $300 millionto increase the average natural flow at Jindabyne to 21 per cent(212 GL/year). Thereafter the Governments will work with theprivate sector to increase flows to 28 per cent of natural flow(294 GL/year).
Restoring environmental flows to the Snowy River willultimately improve water quality, provide an improved habitatfor native fish and riparian vegetation, encourage biodiversity,and increase opportunities for recreation and tourism.
Source: NRE: Land & Water Management: Restoring Health to the Snowy River.
(2002).
37
The health of our catchments > a Victorian report card
MANAGEMENT RESPONSE
S
me
C
Pm
Regional Management Regional Action orResponse Implementation Plan
Corangamite CMA yes In prep In prep In prepNorth East CMA yes In prep In prep In prepMallee CMA no no no noNorth Central CMA yes yes yes yesPort Phillip CaLP yes In prep In prep In prepGoulburn Broken CMA yes yes yes yesGlenelg-Hopkins CMA yes yes yes yesEast Gippsland CMA yes yes yes yesWest Gippsland CMA yes yes yes yesWimmera CMA yes yes yes yes
meCPm
Indicator Definition The Environmental Flow Indicator describes the number of Bulk Water Entitlements (BEs) or StreamflowManagement Plans (SFMPs) that attain an Environmental Flow outcome after the Bulk Entitlement conversion and the StreamflowManagement Plan processes. Rationale There have been relatively few scientific studies into environmental flows for Victoria’s rivers.Consequently, in the short-term, it is not possible to identify all rivers that do not have an adequate environmental flow. Therefore asurrogate indicator has been developed to identify where water allocation processes such as Bulk Entitlements and StreamflowManagement Plans have direct improvement in environmental flows. The ISC also has a surrogate indicator, which is ‘change to naturalflows’. The assumption is that the further away from the natural, the greater the stress on the aquatic environment. This indicator isbeing developed further and may be an important addition to the BE and SFMP surrogate indicator used in this report.

The health of our catchments > a Victorian report card
State Status
For further information refer to the website www.nre.vic.gov.au/vcio
38
State TrendResults and Interpretation
pH is an emerging issue that regions are beginning to addressthrough a broadening of Water Quality Strategies and NutrientManagement Plans. Significant pH changes can limit fishspawning, reduce macro-invertebrate numbers and mobilisetoxicity of pollutants at low pH.
pH has the strongest statewide trend shown for all water qualityparameters.
There is a decreasing trend throughout Victoria, with theexception of the East Gippsland CMA region and the northernareas of the North Central CMA region.
This decreasing trend was shown to be strongest in theGoulburn Broken and North East CMA regions.
The magnitude of most pH trends in the East and WestGippsland CMA regions was small relative to the rest of thestate. Due to the dry nature of north-western Victoria, there wereonly a small number of stations analysed in the Mallee andWimmera CMA regions.
Water quality pH
CONDITION
❉Indicator Information Confidence Rating
Indicator {
Regional Condition and Trend
Corangamite Port Phillip Wimmera West Gippsland North East
Goulburn Broken Glenelg-Hopkins Mallee East Gippsland North Central
▼
▼
▼
n/a ▼
▼
Condition Legend
OPTIMAL
GOOD
MODERATE
POOR
Trend Legend
Increasing
Decreasing
STABLE
UNKNOWN
▲
▼
?
Figure 23. Condition and trend in pHwithin CMA regions.Source: Victorian Water Resources Data Warehouse
Good = <10% of samples exceeded guideline values
Fair = 10-25% of samples exceeded guideline values
Poor = >25% of samples exceeded guideline values
Guideline: Guidelines vary in some regions depending onexpected natural conditions. Guidelines used were SEPPWaters of Victoria and schedules. Where SEPP was notavailable, default ANZECC Water Quality Guidelines areused.
Figure 24. Proportion of water monitoring sites in eachcondition and trend category for Victoria - pH.Source: Victorian Water Resources Data Warehouse.
theme RIVERS, WETLANDSAND ESTUARIES

The health of our catchments > a Victorian report card
39
State Management Response
Victorian River Health Strategy.31
By 2011, 95 per cent of all highland and all lowland monitoring sites will meet SEPP objectives. Achieving this objective may be difficult as the reason for reducing pH is unkown.
Commitment exists at State (NRE) and regional levelthrough the CMA Regional River Health Strategiesimplemented across each region. The CMA Strategieswill be supported by Water Quality and NutrientManagement Action Plans.
CMAs in partnership with NRE will report on stream condition in their regions every five years using theIndex of Stream Condition. The Victorian WaterResources Data Warehouse keeps up to date informationon water quality indicators.
Regional Case Study
Corangamite CMA
The Corangamite CMA is made up of four major catchmentsincluding the Otway Coast, Lake Corangamite, Barwon andMoorabool Rivers.
A large proportion of monitoring stations show a zero trend forpH in the Corangamite CMA region, the remaining monitoringstations show a decreasing (more acid) trend in pH, nomonitoring stations were found to have an increasing (morealkaline) trend in pH.
The Moorabool River catchment, the upper Barwon River,eastern coastline and Gellibrand River in the Otway Coast, allexhibited decreasing trends for pH.
The Leigh River and lower Barwon River, Woady Yalloak Riversand other rivers along the Otway Coast all exhibited zero trends.
Indicator Definition This indicator documents condition, change and trend in median monthly stream pH (acidity) at 108sampling sites within Victoria. Rationale pH is an important water quality parameter that is currently used by national water qualityguidelines, National State of the Environment reporting, Catchment Management Authorities and Water Authorities. Measuringconcentrations of this parameter helps establish the condition and trend of water quality in streams at the regional and statewide level. Itis important to establish long-term trends as this will flag where problems may arise and enable stream water quality targets to be set forspecific river basins and streams. Long-term aspirational targets set through the State Environment Protection Policy, Waters of Victoriaand medium-term resource condition targets will be set through regional Water Quality, Nutrient and Salinity Management Plans.
MANAGEMENT RESPONSE
S
me
C
Pm
Regional Management Regional Action orResponse Implementation Plan
Corangamite CMA yes In prep yes yesNorth East CMA yes no no noMallee CMANorth Central CMA no no no noPort Phillip CaLP yes & In prep In prep In prep In prepGoulburn Broken CMA yes yes yes yesGlenelg-Hopkins CMA no no no noEast Gippsland CMA yes & In prep In prep In prep In prepWest Gippsland CMA yes In prep In prep In prepWimmera CMA yes yes yes yes
meCPmFigure 25. Condition and trend in pH for the Corangamiteregion.Source: Victorian Water Resources Data Warehouse 2001.
For pH, Figure 24 indicates that 92 per cent of Victorian waterquality monitoring sites are considered to be in good condition,while 5 per cent are in fair condition and 3 per cent in poorcondition.
Overall, 27 per cent of water quality monitoring sites haveregistered decreasing or acidifying trend in pH.
Of further concern is the fact that 24 per cent of sites thatremain in good condition now show decreasing trend for pH.
The CMA-based condition and trend assessment provided hasbeen determined by the VCMC. This has been achieved byaggregating the results of compliance monitoring against SEPPand ANZECC water quality guidelines in each region.

State TrendResults and Interpretation
For total phosphorus there were too few data sets to drawsubstantial conclusions regarding trends across the state. Fortotal phosphorus, the majority of trends were zero directionalwith a scattering of decreasing and increasing trends.
Generally, decreasing trends are found in the north of the stateand increasing trends in the south.
It should be noted that some of the non-zero trends wererelatively substantial (eg. an increasing trend of 109 µ/L/yr inthe Port Phillip region).
Nutrients were not recorded for the Wimmera and Malleeregions.
Water quality Stream Phosphorus
CONDITION
❉Indicator Information Confidence Rating
Indicator {
Regional Condition and Trend
Corangamite Port Phillip Wimmera West Gippsland North East
Goulburn Broken Glenelg-Hopkins Mallee East Gippsland North Central
▼
▼
n/a
Condition Legend
OPTIMAL
GOOD
MODERATE
POOR
Trend Legend
Increasing
Decreasing
STABLE
UNKNOWN
▲
▼
?
State Status
40
For further information refer to the websites www.nre.vic.gov.au/vcio and www.vicwaterdata.net
The health of our catchments > a Victorian report card
▼
▼ ▼
Good = <5% of samples exceeded guideline values
Fair = 5-15% of samples exceeded guideline values
Poor = >15% of samples exceeded guideline values
Guideline: Guidelines vary in some regionsdepending on expected natural conditions.Guidelines used were SEPP Waters of Victoria andschedules. Where SEPP was not available, defaultANZECC Water Quality Guidelines were used.
Figure 26. Condition and trend in totalPhosphorus.Source: Victorian Water Resources Data Warehouse.
Figure 27. Proportion of water monitoring sites in eachcondition and trend category for Victoria - Phosphorus.Source: Victorian Water Resources Data Warehouse.
theme RIVERS, WETLANDSAND ESTUARIES

State Management Response
Victorian River Health Strategy (VRHS)31 and the Nutrient Management Strategy for Victorian Inland Waters.
The VRHS suggests that by 2011, 95 percent of all highland and all lowland monitoring sites will meet SEPP objectives.
Commitment exists at State (NRE) and regional levelthrough the CMA Regional River Health Strategiesimplemented across each region. The CMA Strategieswill be supported by Water Quality and NutrientManagement Action Plans.
CMAs in partnership with NRE will report on stream condition in their regions every five years using theIndex of Stream Condition. The Victorian WaterResources Data Warehouse keeps up-to-date informationon water quality indicators.
Regional Case Study
Wimmera Stormwater Quality
Five local governments and two Catchment ManagementAuthorities are working together to clean up urban drains.Wimmera and North Central CMAs are working with HorshamRural City Council and Hindmarsh, Yarriambiack, WestWimmera and Northern Grampians shires in a joint effort toimprove stormwater quality.
Special interest groups such as Waterwatch, river improvementcommittees and Little Desert Fringe waste management groupare also involved in the project. It is the only regional project ofits kind in the state. Other municipalities are doing similarprojects in isolation.
The project involves surveys of urban stormwater systemsthroughout the municipalities and the impact of these systemson rivers, lakes and wetlands. The project is part of a statewideVictorian Stormwater Action Program.
The Wimmera project will result in a plan that meets stateaccreditation guidelines. The final plan will recommend regionaland local activities that improve urban stormwater quality. TheWimmera project is the only one in the state approaching urbanstormwater issues on a regional scale.
For more information contact the Wimmera Catchment Management
Authority.
41
The health of our catchments > a Victorian report card
Indicator Definition This indicator documents condition, change and trend in median monthly stream Total Phosphorus at 108sampling sites within Victoria. Rationale Phosphorus is an important water quality parameter that is currently used by nationalwater quality guidelines, National State of the Environment reporting, Catchment Management Authorities and Water Authorities.Measuring concentrations of this parameter enables us to establish the condition and trend of water quality in streams at the regional andstatewide level. It is important to establish long-term trends as this will flag where problems may arise and enable stream water qualitytargets to be set for specific river basins and streams. Long-term aspirational targets set through the State Environment Protection Policy,Waters of Victoria and medium term resource condition targets will be set through regional Water Quality, Nutrient and SalinityManagement Plans.
MANAGEMENT RESPONSE
S
me
C
Pm
Regional Management Regional Action orResponse Implementation Plan
Corangamite CMA yes In prep yes yesNorth East CMA yes yes yes yesMallee CMA yes yes yes yesNorth Central CMA yes yes yes yesPort Phillip CaLP yes & In prep In prep In prep In prepGoulburn Broken CMA yes yes yes yesGlenelg-Hopkins CMA yes yes yes yesEast Gippsland CMA yes & In prep In prep In prep In prepWest Gippsland CMA yes In prep In prep In prepWimmera CMA yes yes yes yes
meCPm
For phosphorus, Figure 27 indicates that 43 per cent ofVictorian water quality monitoring sites are considered to be inpoor condition and 22 per cent are in fair condition.
Only 35 per cent of water quality monitoring sites areconsidered to be in good condition.
Overall, 51 per cent of water quality monitoring sites haveregistered an increasing trend in phosphorus.
The CMA-based condition and trend assessment provided hasbeen determined by the VCMC. This has been achieved byaggregating the results of compliance monitoring against SEPPand ANZECC water quality guidelines in each region.

The health of our catchments > a Victorian report card
For further information refer to the websites www.nre.vic.gov.au/vcio and www.vicwaterdata.net
42
State Status
Water quality Electrical conductivity
CONDITION
❉Indicator Information Confidence Rating
Indicator {
Regional Condition and Trend
Corangamite Port Phillip Wimmera West Gippsland North East
Goulburn Broken Glenelg-Hopkins Mallee East Gippsland North Central
▼
n/a
Condition Legend
OPTIMAL
GOOD
MODERATE
POOR
Trend Legend
Increasing
Decreasing
STABLE
UNKNOWN
▲
▼
?
Good = <5% of samples exceeded guideline values
Fair = 5-15% of samples exceeded guideline values
Poor = >15% of samples exceeded guideline values
Guideline: Guidelines vary in some regionsdepending on expected natural conditions.Guidelines used were SEPP Waters of Victoria andschedules. Where SEPP was not available, defaultANZECC Water Quality Guidelines were used.
Figure 28. Condition and trend in EC.Source: VictorianWater Resources Data Warehouse.
State TrendResults and Interpretation
Electrical conductivity did not have any consistent statewidetrend.
Decreasing trends were common in the southern central regionof the State (Port Phillip CALP and Corangamite CMAregions).
Conversely, in the western and northwestern regions (NorthCentral, Wimmera and Glenelg CMA regions), the trends werepredominantly for increasing electrical conductivity.
In the eastern half of the State, the trends were predominantlystable.
There was insufficient data to determine regional trends for theMallee CMA region.
Figure 29. Proportion of water monitoring sites in eachcondition and trend category for Victoria - ElectricalConductivity.Source: Victorian Water Resources Data Warehouse.
theme RIVERS, WETLANDSAND ESTUARIES

The health of our catchments > a Victorian report card
43
State Management Response
The Victorian River Health Strategy (VRHS)31 and the Victorian Salinity Management Framework.32
The VRHS suggests that by 2011, 95 percent of all highland and all lowland monitoring sites will meet SEPP objectives.
Commitment exists at State (NRE) and regional levelthrough the CMA Regional River Health Strategiesimplemented across each region. The CMA Strategieswill be supported by Water Quality and NutrientManagement Action Plans.
CMAs in partnership with NRE will report on stream condition in their regions every five years using theIndex of Stream Condition. The Victorian WaterResources Data Warehouse keeps up to date informationon water quality indicators.
Regional Case Study
Glenelg-Hopkins CMA EC trends
The Glenelg-Hopkins CMA is made up of the Glenelg,Hopkins and Portland Coast catchments.
Large increasing trends in electrical conductivity occurred alongthe Hopkins River.
Small but significant increasing trends also occurred along thePortland Coast.
There is generally a decreasing trend in electrical conductivity inthe Glenelg and Wannon Rivers.
Indicator Definition This indicator documents condition, change and trend in median monthly stream Electrical Conductivity(EC) at 108 sampling sites within Victoria. Rationale Electrical conductivity (EC) is an important water quality parameter that iscurrently used by national water quality guidelines, National State of the Environment reporting, Catchment Management Authoritiesand Water Authorities. Measuring concentrations of this parameter enables us to establish the condition and trend of water quality instreams at the regional and statewide level. It is important to establish long-term trends as this will flag where problems may arise andenable stream water quality targets to be set for specific river basins and streams. Long-term aspirational targets set through the StateEnvironment Protection Policy, Waters of Victoria and medium-term resource condition targets will be set through regional WaterQuality, Nutrient and Salinity Management Plans.
MANAGEMENT RESPONSE
S
me
C
Pm
Regional Management Regional Action orResponse Implementation Plan
Corangamite CMA yes In prep yes yesNorth East CMA yes no yes yesMallee CMA yes yes yes yesNorth Central CMA yes no no noPort Phillip CaLP yes & In prep In prep In prep In prepGoulburn Broken CMA yes yes yes yesGlenelgHopkins CMA no no no noEast Gippsland CMA yes & In prep In prep In prep In prepWest Gippsland CMA yes yes yes yesWimmera CMA yes no no no
meCPm
Figure 30. Condition and trend in electrical conductivity in theGlenelg-Hopkins CMA region.Source: VictorianWater Resources Data Warehouse.
For electrical conductivity, Figure 29 indicates that 61 per centof Victorian water quality monitoring sites are considered to bein good condition, while 20 per cent are in fair condition and19 per cent in poor condition.
Importantly, 60 per cent of the sites in good condition showeither a steady or declining trend for electrical conductivity.
Overall, only nine per cent of water quality monitoring siteshave registered an increasing trend in electrical conductivity.
The CMA-based condition and trend assessment provided hasbeen determined by the Victorian Catchment ManagementCouncil. This has been achieved by aggregating the results ofcompliance monitoring against State Environment ProtectionPolicy and Australia and New Zealand EnvironmentConservation Council water quality guidelines in each region.

The health of our catchments > a Victorian report card
For further information refer to the website www.nre.vic.gov.au/vcio
44
State Status
Water quality Nitrogen
CONDITION
❉Indicator Information Confidence Rating
Indicator {
Regional Condition and Trend
Corangamite Port Phillip Wimmera West Gippsland North East
Goulburn Broken Glenelg-Hopkins Mallee East Gippsland North Central
▼
n/a
Condition Legend
OPTIMAL
GOOD
MODERATE
POOR
Trend Legend
Increasing
Decreasing
STABLE
UNKNOWN
▲
▼
?
State TrendResults and Interpretation
For total nitrogen there were too few data sets to drawsubstantial conclusions regarding trends across the State.
The regions for which nutrients were monitored tended toexhibit trends of decreasing total nitrogen levels of smallmagnitude, particularly in the eastern half of the State.
Corangamite CMA region had two stations with large increasesand the Glenelg-Hopkins CMA region had a small increase intotal nitrogen levels overall.
Nutrients were not recorded for the Wimmera and Malleeregions.
▼ ▼ ▼
▼
▼
▼
▼
Good = <5% of samples exceeded guideline values
Fair = 5-15% of samples exceeded guideline values
Poor = >15% of samples exceeded guideline values
Guideline: Guidelines vary in some regionsdepending on expected natural conditions.Guidelines used were SEPP Waters of Victoria andschedules. Where SEPP was not available, defaultANZECC Water Quality Guidelines are used.
Figure 31. Condition and trend in Nitrogen.Source: Victorian Water Resources Data Warehouse.
Figure 32. Proportion of water monitoring sites in eachcondition and trend category for Victoria - Nitrogen.Source: Victorian Water Resources Data Warehouse.
theme RIVERS, WETLANDSAND ESTUARIES

The health of our catchments > a Victorian report card
45
State Management Response
The Victorian River Health Strategy (VRHS) 31
The VRHS suggests that by 2011, 95 percent of all highland and all lowland monitoring sites will meet SEPP objectives.
Commitment exists at State (NRE) and regional level through the CMA Regional River Health Strategies implemented across each region. The CMA Strategies will be supported by Water Quality and Nutrient Management Action Plans.
CMAs in partnership with NRE will report on stream condition in their regions every five years using the Index of Stream Condition. The Victorian WaterResources Data Warehouse keeps up to date informationon water quality indicators.
Regional Case Study
Port Phillip Region - Melbourne Water Stream FrontageManagement Program achieves high success
The 2001/02 Stream Frontage Management program has beenfinalised with outstanding results. Overall, the program, whichcovers the majority of the Western Port and Yarra catchments,saw over 100km of fencing construction and 112,225 plantsprovided. In addition $190,000 was spent on weedmanagement, $24,000 on minor stabilisation works, $11,000on provision of alternate stock watering and $ 29,000 on arange of support services to the landowners. The increase ineffort from 2001/02 program was substantial with 339landowners being engaged this year.
A feature of the program this year was the initiation of offersinto the Lower Mornington Peninsula as part of the price risecommitments. The program in this area achieved a slowerresponse than had been hoped, with a shortfall against theambitious targets. Of the $200,000 allocated for grants intothis area only $151,507 was distributed. Encouragingly, this rateof uptake in the initiating year is higher than that previouslyexperienced for start up in new catchments.
Other features of the program this year included a partnershipwith Gipps Dairy to target water quality improvements fromdairy farms adjoining stream systems, and the support of theAmcor Corridors of Green program with an additional $93,000for projects with Councils along urban waterway frontages. Theoverall expenditure for 2001/02 was $1.4 million.
Indicator Definition This indicator documents condition, change and trend in median monthly stream Total Nitrogen at 108sampling sites within Victoria. Rationale Nitrogen is an important water quality parameter that is currently used by national waterquality guidelines, National State of the Environment reporting, Catchment Management Authorities and Water Authorities. Measuringconcentrations of this parameter enables us to establish the condition and trend of water quality in streams at the regional and statewidelevel. It is important to establish long-term trends as this will flag where problems may arise and enable stream water quality targets tobe set for specific river basins and streams. These targets can then be included in Salinity Management Plans (SMPs), StateEnvironment Protection Policies (SEPPs), Water Quality Strategies and Nutrient Management Plans.
MANAGEMENT RESPONSE
S
me
C
Pm
Regional Management Regional Action orResponse Implementation Plan
Corangamite CMA yes In prep yes yesNorth East CMA yes yes yes yesMallee CMA yes yes yes yesNorth Central CMA yes yes yes yesPort Phillip CaLP yes & In prep In prep In prep In prepGoulburn Broken CMA yes yes yes yesGlenelg-Hopkins CMA yes yes yes yesEast Gippsland CMA yes & In prep In prep In prep In prepWest Gippsland CMA yes In prep yes yesWimmera CMA yes yes yes yes
meCPm
For nitrogen, Figure 32 indicates that 60 per cent of Victorianwater quality monitoring sites are considered to be in poorcondition, while 29 per cent are in good condition and 11 percent in fair condition.
Overall, 46 per cent of water quality monitoring sites haveregistered an increasing trend for nitrogen.
Of some concern is the fact that 8 per cent of sites rated in goodcondition, and 8 per cent of sites rated in fair condition show anincreasing trend for nitrogen.
The CMA-based condition and trend assessment provided onpage 44 has been determined by the VCMC. This has beenachieved by aggregating the results of compliance monitoringagainst SEPP and ANZECC water quality guidelines in eachregion.

The health of our catchments > a Victorian report card
For further information refer to the websites www.nre.vic.gov.au/vcio and www.vicwaterdata.net
46
State TrendResults and Interpretation
Statewide patterns were not readily evident for turbidity withapproximately equal numbers of increasing and decreasingtrends.
Generally, the east and north east of the State (North East andEast Gippsland CMA regions) exhibited stable turbidity levels(zero directional trends).
The northern central areas of the State (Goulburn Broken andnorthern North Central CMA regions) exhibited a pattern ofincreasing turbidity, strongest in the Goulburn Broken CMAregion.
The southern and western areas of the State (particularlyWimmera and West Gippsland) generally exhibited trends ofstable or decreasing turbidity.
State Status
Water quality Median stream turbidity
CONDITION
❉Indicator Information Confidence Rating
Indicator {
Regional Condition and Trend
Corangamite Port Phillip Wimmera West Gippsland North East
Goulburn Broken Glenelg-Hopkins Mallee East Gippsland North Central
▼
n/a
▼
Condition Legend
OPTIMAL
GOOD
MODERATE
POOR
Trend Legend
Increasing
Decreasing
STABLE
UNKNOWN
▲
▼
?
Good = <5% of samples exceeded guideline values
Fair = 5-15% of samples exceeded guideline values
Poor = >15% of samples exceeded guideline values
Guideline: Guidelines vary in some regionsdepending on expected natural conditions.Guidelines used were SEPP Waters of Victoria andschedules. Where SEPP was not available, defaultANZECC Water Quality Guidelines were used.
Figure 33. Condition and trend in Turbidity.Source: Victorian Water Resources Data Warehouse.
Figure 34. Proportion of water monitoring sites in eachcondition and trend category for Victoria - Turbidity.Source: Victorian Water Resources Data Warehouse.
theme RIVERS, WETLANDSAND ESTUARIES

The health of our catchments > a Victorian report card
47
State Management Response
The Victorian River Health Strategy (VRHS).31
The VRHS suggests that by 2011, 95 percent of all highland and all lowland monitoring sites will meet SEPP objectives.
Commitment exists at State (NRE) and regional levelthrough the CMA Regional River Health Strategiesimplemented across each region. The CMA Strategieswill be supported by Water Quality and NutrientManagement Action Plans.
CMAs in partnership with NRE will report on stream condition in their regions every five years using theIndex of Stream Condition. The Victorian WaterResources Data Warehouse keeps up to date informationon water quality indicators.
Regional Case Study
Cardinia Catchment Biolink
The Cardinia Environment Coalition Inc., on behalf of aLandcare network of six groups, has received $159,000 in2001/2002 for the Biolink project. This follows earlier projectswhich received $372,200 from Bushcare over the three yearsfrom 1998/99 to 2000/2001 and $94,000 from the NHTNational Landcare Program for salinity control.
The long-term objective of this project is to establish acontinuous network of streamside native vegetation corridorslinking the Bunyip State Park in the north with the main rivercorridor to the south that leads to Westernport Bay – a Ramsarlisted wetland. To protect remnant streamside vegetation andprovide links between remnants, fencing is being erected. The‘gaps’ between remnants are being revegetated. This will result inenhanced biodiversity and improved water quality and aquatichealth within the streams and less pollutants and sedimentsleaving the catchment. The Coalition encourages communityparticipation through field days, community education andnewsletter distribution.
Significant progress has been made, with up to 50 per cent ofthe stream frontages in some sub-catchments now fenced outand the protected native vegetation being carefully managed in amanner to encourage restoration.
Indicator Definition This indicator documents condition, change and trend in median monthly stream turbidity at 108 samplingsites within Victoria. Rationale Turbidity is an important water quality parameter that is currently used by national water qualityguidelines, National State of the Environment reporting, Catchment Management Authorities and Water Authorities. Measuringconcentrations of this parameter enables us to establish the condition and trend of water quality in streams at the regional and statewidelevel. It is important to establish long-term trends as this will flag where problems may arise and enable stream water quality targets tobe set for specific river basins and streams. Long-term aspirational targets set through the State Environment Protection Policy, Watersof Victoria and medium-term resource condition targets will be set through regional Water Quality, Nutrient and Salinity ManagementPlans.
MANAGEMENT RESPONSE
S
me
C
Pm
Regional Management Regional Action orResponse Implementation Plan
Corangamite CMA yes In prep yes yesNorth East CMA yes yes yes yesMallee CMA yes yes yes yesNorth Central CMA no no no noPort Phillip CaLP yes & In prep In prep In prep In prepGoulburn Broken CMA yes yes yes yesGlenelg-Hopkins CMA no no no noEast Gippsland CMA yes & In prep In prep In prep In prepWest Gippsland CMA yes In prep In prep In prepWimmera CMA yes yes yes yes
meCPm
For turbidity, Figure 34 indicates that 55 per cent of Victorianwater quality monitoring sites are considered to be in faircondition and 43 per cent are in good condition.
Only 2 per cent of water quality monitoring sites are in poorcondition.
Overall, 9 per cent of water quality monitoring sites haveregistered an increasing trend in turbidity, however sites in goodcondition are generally not affected.
The CMA-based condition and trend assessment provided onpage 46 has been determined by the VCMC. This has beenachieved by aggregating the results of compliance monitoringagainst SEPP and ANZECC water quality guidelines in eachregion.

The health of our catchments > a Victorian report card
State Status
The small wave-dominated estuaries common in westernVictoria are at risk from inappropriate land use practices and arein need of targeted management. As many of these estuarieshave ephemeral openings to the coast, and the adjacentcatchment is often steep and predominantly agricultural,nutrients, sediment and toxins can accumulate in these estuaries.
Urbanisation, industry, agriculture, forestry and water diversionsand extractions have resulted in major modifications to manyVictorian estuaries.
Pressures on estuaries will increase with a trend to increasingcoastal development.
Information on condition and trends for estuaries is notavailable.
Source: NLWRA 2002.33
State TrendResults and Interpretation
With the exception of Port Phillip Bay, Gippsland Lakes andWestern Port Bay there is little available data on the condition ofestuaries. Outside the areas mentioned there is no biologicalmonitoring of condition conducted.
Victorian estuaries (approximately 60) vary from small wave-and river-dominated estuaries in the west, to several largeembayments such as Port Phillip Bay and Western Port incentral Victoria, to a network of small wave-dominated estuariesin the east.
The condition of estuaries varies regionally, primarily because ofthe differences in the size and morphology of the surroundingcatchment, and the dominant land use practices. Many of theestuaries in eastern Victoria are located within National Parksand are in near-pristine condition. These are valuableconservation and wilderness areas.
48
For further information refer to the following website www.ozestuaries.org
Estuary condition
CONDITION
❉Indicator Information Confidence Rating
Indicator {
Regional Condition and Trend
Corangamite Port Phillip Wimmera West Gippsland North East
Goulburn Broken Glenelg-Hopkins Mallee East Gippsland North Central
State Condition and Trend
?
?
?
?
?
?
Condition Legend
OPTIMAL
GOOD
MODERATE
POOR
Trend Legend
POSITIVE
NEGATIVE
STABLE
UNKNOWN
▲
▼
?
Cat
egor
y
Number
Figure 35. Victorian Estuary type and condition.Source: NLWRA 2002.33
N/A
N/A
N/A
N/A
N/A
theme RIVERS, WETLANDSAND ESTUARIES

State Management Response
Victorian Coastal Strategy.34
No specific targets for estuaries. The State Strategy provides a framework for Regional Coastal Boards to develop clear local strategies for managing and protecting estuaries.
Clear commitment exists through planning and implementation activities of Regional Coastal Boards and partners such as Parks Victoria and NRE.
Unknown at this stage.
Regional Case Study
Swan Bay Integrated Catchment Management Project.
The Swan Bay community over a number of years had becomeconcerned with the degradation of the bay and catchment.Issues include seagrass loss, degradation of estuaries, poor waterquality, weeds, unsustainable agricultural practices andincreasing urban population.
The project aimed to build on the activities conducted bycommunity organisations but in a more cooperative andcoordinated approach. A three-year action plan was developedwith practical on-ground tasks that address the majorenvironmental and land management issues across thecatchment.
With support of Coast Action/Coastcare ($78,714 funding overthree years) the project has achieved outstanding communitysupport and a number of significant outcomes in a short periodof time including: school education programs highlighting thelink between stormwater and environmental issues, planting andfencing of waterways; fencing and revegetation of saline areascommunity awareness and water quality monitoring of allcatchment creeks and stormwater outlets to Swan Bay.
The strengths of the Swan Bay Integrated CatchmentManagement Project lie in raising community awareness aboutthe values of Swan Bay and links with land use in thecatchment. This has resulted in increased volunteerparticipation, as well as networking across a board range ofgroups to identify, plan and implement integrated approaches tocatchment action.
49
The health of our catchments > a Victorian report card
Indicator Definition This indicator is a qualitative measure of the condition of Victorian estuaries. Rationale Estuaries arevalued for their scenic beauty, recreation opportunities, tourism potential, residential development, fisheries and port facilities. At thelower end of river catchments, estuaries also reflect the general health of the catchment. It is therefore important that estuary conditionbe monitored to enable the impact of catchment-based land use to be assessed. This will enable land and waterway managers to linkestuary management objectives with Regional Catchment Strategies, Nutrient Management Plans and Water Quality Management Plans.
MANAGEMENT RESPONSE
S
me
C
Pm
Regional Management Regional Action orResponse Implementation Plan
Corangamite CMA no no no noNorth East CMA n/aMallee CMA n/aNorth Central CMA n/aPort Phillip CaLP no no no noGoulburn Broken CMA n/aGlenelg-Hopkins CMA yes no no noEast Gippsland CMA yes yes yes yesWest Gippsland CMA yes In prep In prep In prepWimmera CMA n/a
meCPm

50
The water provided by our rivers currently supports apopulation of over 4 million people and enables $5.2 billionworth of food and fibre to be generated from irrigatedagriculture. This development would not have been possiblewithout harnessing rivers to supply both a secure and highquality resource. This has involved the introduction of dams,diversions and other regulating structures to manage streamflow.Unfortunately though, this development has come at a cost tothe ecology of rivers, floodplains and estuaries.
With many of our most important river systems now in decline,what has become most apparent is that the quality of our wateris dependent upon a healthy river ecosystem. Importantly, wemoved to identify those river systems that are reaching, or insome cases, have exceeded the limits of the resource, and arenow attempting to restore environmental flows to maintain theecological health of our rivers. This will be particularlyimportant given that there is continued pressure for rivers to
supply additional water to meet our expanding population andagricultural industries. For example, Victoria is aiming to morethan double production from irrigated agriculture to $12 billionby the year 2010, while urban growth trends in Melbourneindicate that capacity of the current system could be reached inaround 11 years (Water Resources Strategy Committee for theMelbourne Area 2001).
These agricultural targets have been set within the context of theState Government’s goal of reversing the decline in the extentand quality of native vegetation, a cap on water diversions innorthern Victoria that has been implemented by the MDBCMinisterial Council, and a return of 28 per cent of streamflowto the Snowy River. Because of these current controls, and morefundamentally because there is a natural limit to the availabilityof both water and productive agricultural land, the agriculturaltargets will need to be met through more efficient productionmethods, or through changing land and water use to more
The health of our catchments > a Victorian report card
3.7 theme 4 MANAGING WATER RESOURCES

51
productive industries. Whilst there is a cap on water diversionsin the north of the State, further diversions are allowed in thesouth. The construction of large new public irrigation dams insouthern Victoria is very unlikely, but there may be somelimited increase in the total water diverted from unregulatedstreams to meet these agricultural targets.
In Victoria, there is now a realisation that there is likely to beless rather than more water available in the future. Thechallenge will be to manage this finite resource in anenvironmentally responsible way, balancing the needs of currentand future users and the health of the river ecosystem. In manycases the environmental condition of rivers will need to improveif they are to sustain current levels of use. Therefore, themanagement focus for the future will be on the development ofwater markets, improvements in water use efficiency andrestoration of environmental flows. The development of watermarkets and improvements in water use efficiency and water re-use are considered the most important mechanisms to meet ourfuture water use needs. Water markets will enable the transfer ofwater from low-value uses to higher-value uses, while gains inwater use efficiency and re-use will deliver water savings to meetincreased agricultural and urban needs.
To manage future water needs, a water allocation framework hasbeen evolving rapidly to meet Victorian water managementobjectives. The framework is being implemented in thefollowing types of water management systems:
> Regulated systems
> Unregulated systems
> Groundwater systems.
The framework is based on a hierarchy of legal entitlements towater that grant the right of the Crown to control allgroundwater and any water within a waterway. In regulatedsystems with dams or weirs, Bulk Entitlements (BEs) areestablished for both urban and rural water authorities. BEs forrural water authorities also cover the rights held by irrigators inauthority supplied irrigation districts, plus any losses from thesupply system. In unregulated systems, BEs are issued to waterauthorities, while individuals must have a licence issued by theMinister to divert water from a stream. StreamflowManagement Plans (SFMPs) or ‘Management Rules’ are beingdeveloped for unregulated streams on a priority basis.
This water allocation framework has provided the means tomeasure some of our progress in meeting our water managementobjectives. The development of BEs and SFMPs have given usinformation on the volume of water available within a riversystem and the amount of water authorised for consumptive use.We can therefore measure compliance of water authorities withthe specified limits and operating rules. Compliance will also bemeasured from a groundwater perspective, as Permissible AnnualVolumes (PAVs) have been established for groundwaterextraction and metering of groundwater bores will be deliveredthrough groundwater management plans.
In regards to the future, new indicators will be required thatenable us to measure the progress of industry and agriculture inachieving water savings. Without this type of indicator,planning for future urban and rural growth will becomeincreasingly difficult as Victoria’s water supplies become fullycommitted.
The health of our catchments > a Victorian report card
Management response assessment legend
The legend of S, Pm, C, and me is used to introduce discussion onmanagement responses at both the State and regional level:
= This symbol describes if a State strategy (or regional action plan),of relevance to the indicator, exists or is in preparation.
= This symbol outlines if the above Strategy/Plan contains clear performance measures and targets.
= This symbol describes if the above Strategy/Plan is supported by a State/regional commitment to an implementation program with resourcing.
= This symbol outlines if the Strategy/Plan contains a clear process for monitoring and evaluation.
Quality of data legend
A Green symbol represents good consistent data collection and interpretation (>5 years) on condition and trends;
An Orange symbol represents some consistent data collection and interpretation (<5 years) on either condition or trend but not both;
A Red symbol represents poor or limited data collection and interpretation.
S
me
C
Pm
❉
❉❉
The legends below apply to all indicators in this theme.
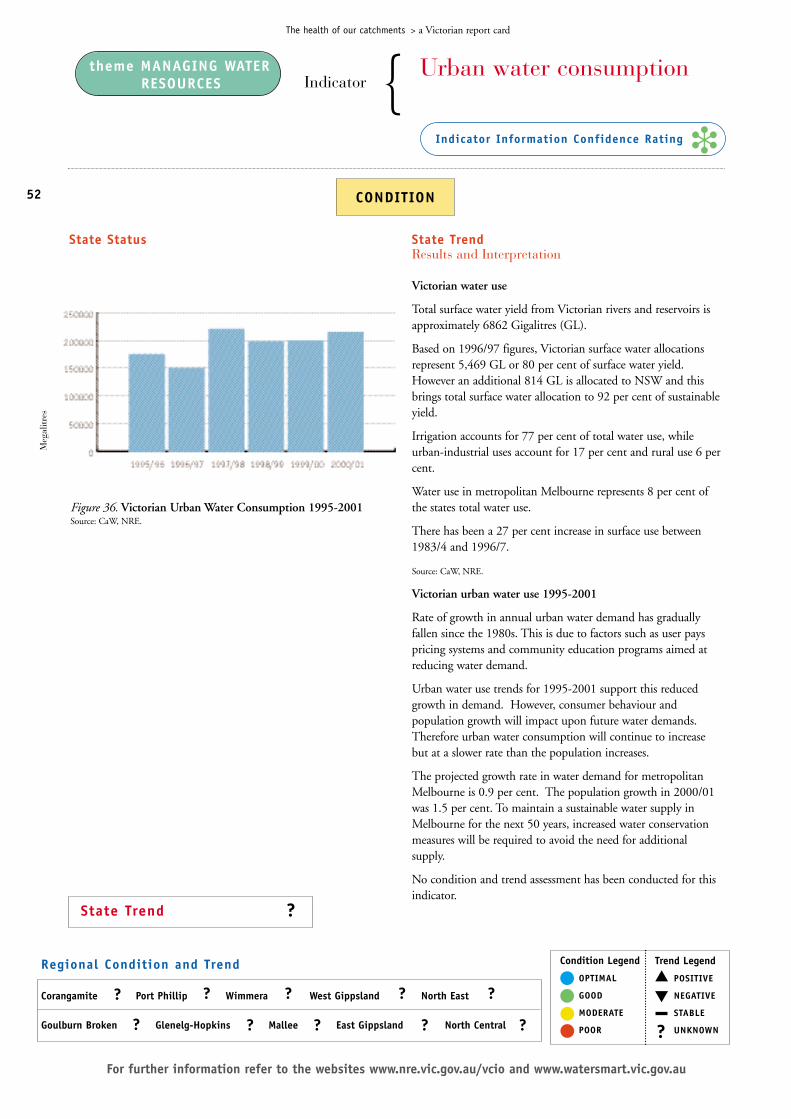
State TrendResults and Interpretation
Victorian water use
Total surface water yield from Victorian rivers and reservoirs isapproximately 6862 Gigalitres (GL).
Based on 1996/97 figures, Victorian surface water allocationsrepresent 5,469 GL or 80 per cent of surface water yield.However an additional 814 GL is allocated to NSW and thisbrings total surface water allocation to 92 per cent of sustainableyield.
Irrigation accounts for 77 per cent of total water use, whileurban-industrial uses account for 17 per cent and rural use 6 percent.
Water use in metropolitan Melbourne represents 8 per cent ofthe states total water use.
There has been a 27 per cent increase in surface use between1983/4 and 1996/7.
Source: CaW, NRE.
Victorian urban water use 1995-2001
Rate of growth in annual urban water demand has graduallyfallen since the 1980s. This is due to factors such as user payspricing systems and community education programs aimed atreducing water demand.
Urban water use trends for 1995-2001 support this reducedgrowth in demand. However, consumer behaviour andpopulation growth will impact upon future water demands.Therefore urban water consumption will continue to increasebut at a slower rate than the population increases.
The projected growth rate in water demand for metropolitanMelbourne is 0.9 per cent. The population growth in 2000/01was 1.5 per cent. To maintain a sustainable water supply inMelbourne for the next 50 years, increased water conservationmeasures will be required to avoid the need for additionalsupply.
No condition and trend assessment has been conducted for thisindicator.
State Status
52
For further information refer to the websites www.nre.vic.gov.au/vcio and www.watersmart.vic.gov.au
The health of our catchments > a Victorian report card
theme MANAGING WATERRESOURCES
Urban water consumption
CONDITION
❉Indicator Information Confidence Rating
Indicator {
Regional Condition and Trend
Corangamite Port Phillip Wimmera West Gippsland North East
Goulburn Broken Glenelg-Hopkins Mallee East Gippsland North Central
State Trend ?
Condition Legend
OPTIMAL
GOOD
MODERATE
POOR
Trend Legend
POSITIVE
NEGATIVE
STABLE
UNKNOWN
▲
▼
?
Figure 36. Victorian Urban Water Consumption 1995-2001Source: CaW, NRE.
Meg
alitr
es
? ? ?
? ? ? ?
? ?
?

State Management Response
There is a range of strategies developed by the various urban water providers. Melbourne has a Water Resources Strategy and all metropolitan water businessesare required to develop water conservation plans annually. All water authorities and water businesses havedrought response plans to manage water shortages.
Performance measures and targets exist in all water business plans. The strategy for Melbourne discusses options and preferred scenarios for consumption savings over the next 50 years.
Clear resourcing and program commitment is displayed through water business corporate plans anually.
Implementation of water conservation plans will be monitored through NRE.
Victorian residential water use 1995-2001
The average annual consumption per household across Victoriain 2001 was 256 kilolitres (kL). Metropolitan Melbourneconsumption per household was 240 kL. In general, annualconsumption per household is between 320 and 250 kL in thenorth and west of Victoria, and between 220 kL and 150 kL inthe south and east of Victoria.
Total residential water consumption has continued to increaseduring the past six years (1995-2001).
53
The health of our catchments > a Victorian report card
Indicator Definition Urban water consumption refers to the total non-irrigation water use from metropolitan Melbourne andregional townships outside Melbourne. Total water use includes residential, commercial, institutional, industrial and unaccounted forwater use within townships. Rationale Urban water consumption fluctuates with seasonal changes, longer-term climatic fluctuationand changing user needs. Given this change, it is important to create secure water supplies and manage changing patterns of water use sothat water resources are used efficiently. Monitoring urban water consumption at the supply district level can help us determine ifresidential or non-residential consumption is growing or falling.
MANAGEMENT RESPONSE
S
me
C
Pm
Figure 38. Victorian non-residential water consumption 1995-2001Source: CaW, NRE.
Meg
alitr
es
Figure 37. Victorian residential water consumption 1995-2001Source: CaW, NRE.
Meg
alitr
es
Regional Management Regional Action orResponse Implementation Plan
Corangamite CMA yes yes yes yesNorth East CMA yes yes yes yesMallee CMA yes yes yes yesNorth Central CMA yes yes yes yesPort Phillip CaLP yes yes yes yesGoulburn Broken CMA yes yes yes yesGlenelg-Hopkins CMA yes yes yes yesEast Gippsland CMA yes yes yes yesWest Gippsland CMA yes yes yes yesWimmera CMA yes yes yes yes
meCPm
Victorian non-residential water use 1995-2001
Non-residential water use includes major manufacturing andcommercial users, hospitals, universities and local governments.Total non-residential water consumption has continued toincrease during the past six years (1995-2001).
Retail water company data suggests that general industrial usersare the most efficient sector with respect to water conservation.

The health of our catchments > a Victorian report card
State Status and TrendResults and Interpretation
As of 2001 the total volume of groundwater allocated for usewas 938,210 megalitres per year. 85 per cent of the allocationoccurs within Groundwater Management Areas, mainly toirrigation agriculture, industry and commercial users.
Groundwater supports 60 urban communities, 45,000 domesticand stock users and 5,000 irrigation, dairy and industrial users.Groundwater also makes an important and significantcontribution to the base flow of Victorian rivers and streams.
Groundwater Management Areas
There are 61 areas across the state identified where groundwateris attractive for future development or where development isalready taking place. 36 of these areas are termed GroundwaterManagement Areas and Permissible Annual Volumes have beenset for allocation. Of the 36 areas with PAVs, 33 have allocationsand use levels that fall below Permissible Annual Volumes (referFigure 39).
Water Supply Protection Areas
Another 25 areas within the state are declared as Water SupplyProtection Areas. In these areas management plans are beingdrafted or have been developed (refer Table 2).
In areas where Groundwater Management Plans exist andmeters are installed annual useage is less than PermissibleAnnual Volume.
Combined petroleum, mine de-watering, and increasedgroundwater use is causing a decline in groundwater levels ofapproximately one metre per year in the Gippsland Basin.Management of this issue is being negotiated by both State andCommonwealth Governments.
theme MANAGING WATERRESOURCES
54
For further information refer to the website www.nre.vic.gov.au/vcio
Groundwater allocation and use
CONDITION
❉Indicator Information Confidence Rating
Indicator {
Figure 39. Groundwater allocation and sustainable yield inGroundwater Management areas.Source: CaW, NRE
Megalitres
Regional Condition and Trend
Corangamite Port Phillip Wimmera West Gippsland North East
Goulburn Broken Glenelg-Hopkins Mallee East Gippsland North Central
State Condition and Trend
Condition Legend
OPTIMAL
GOOD
MODERATE
POOR
Trend Legend
POSITIVE
NEGATIVE
STABLE
UNKNOWN
▲
▼
?
▼
▼
Gro
undw
ater
Man
gem
ent
Are
as
Permissible Annual Volume MLAllocation ML
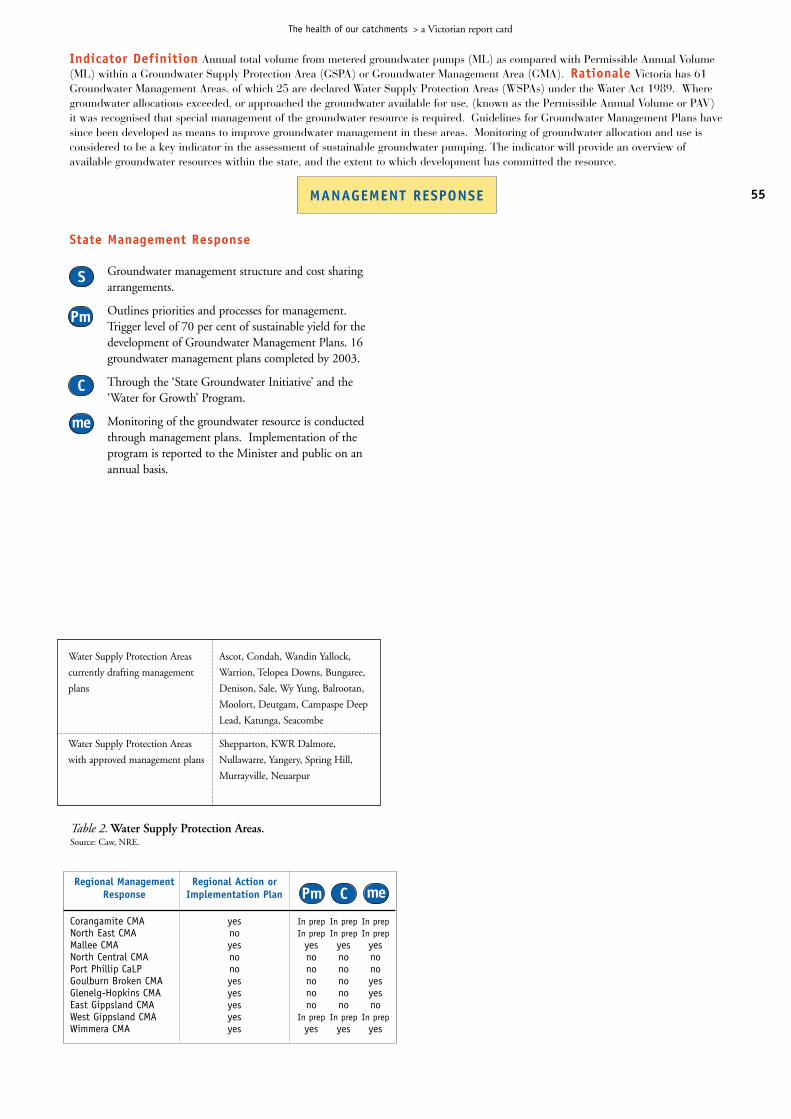
The health of our catchments > a Victorian report card
State Management Response
Groundwater management structure and cost sharing arrangements.
Outlines priorities and processes for management. Trigger level of 70 per cent of sustainable yield for the development of Groundwater Management Plans. 16 groundwater management plans completed by 2003.
Through the ‘State Groundwater Initiative’ and the‘Water for Growth’ Program.
Monitoring of the groundwater resource is conducted through management plans. Implementation of the program is reported to the Minister and public on an annual basis.
55MANAGEMENT RESPONSE
S
me
C
Pm
Indicator Definition Annual total volume from metered groundwater pumps (ML) as compared with Permissible Annual Volume(ML) within a Groundwater Supply Protection Area (GSPA) or Groundwater Management Area (GMA). Rationale Victoria has 61Groundwater Management Areas, of which 25 are declared Water Supply Protection Areas (WSPAs) under the Water Act 1989. Wheregroundwater allocations exceeded, or approached the groundwater available for use, (known as the Permissible Annual Volume or PAV)it was recognised that special management of the groundwater resource is required. Guidelines for Groundwater Management Plans havesince been developed as means to improve groundwater management in these areas. Monitoring of groundwater allocation and use isconsidered to be a key indicator in the assessment of sustainable groundwater pumping. The indicator will provide an overview ofavailable groundwater resources within the state, and the extent to which development has committed the resource.
Regional Management Regional Action orResponse Implementation Plan
Corangamite CMA yes In prep In prep In prepNorth East CMA no In prep In prep In prepMallee CMA yes yes yes yesNorth Central CMA no no no noPort Phillip CaLP no no no noGoulburn Broken CMA yes no no yesGlenelg-Hopkins CMA yes no no yesEast Gippsland CMA yes no no noWest Gippsland CMA yes In prep In prep In prepWimmera CMA yes yes yes yes
meCPm
Water Supply Protection Areas Ascot, Condah, Wandin Yallock,
currently drafting management Warrion, Telopea Downs, Bungaree,
plans Denison, Sale, Wy Yung, Balrootan,
Moolort, Deutgam, Campaspe Deep
Lead, Katunga, Seacombe
Water Supply Protection Areas Shepparton, KWR Dalmore,
with approved management plans Nullawarre, Yangery, Spring Hill,
Murrayville, Neuarpur
Table 2. Water Supply Protection Areas.Source: Caw, NRE.

theme MANAGING WATERRESOURCES
State TrendResults and Interpretation
Bulk Entitlements
Bulk Entitlements (BEs) clearly define existing rights to waterboth in volume and security.
There are 182 water supply systems across Victoria that havebeen identified as requiring a BE (refer Figure 40). To date, BEshave been written for approximately 135 or 74 per cent of thesewater supply systems, however this accounts for 83 per cent ofthe total volume of water (refer Figure 41). Without BEs orlimits to water diversion within a river system, both the riverenvironment and protection for existing users can beundermined.
Streamflow Management Plans
Streamflow Management Plans (SFMPs), provide recommendedoperating rules for managing rivers including the maximum rateof diversion and minimum environmental flow.
As many as 113 SFMPs or improved management rules may berequired for unregulated catchments or streams where diversionsimpact on river health.
The preparation of SFMPs began in 1996, with three SFMPsnow operational and 30 in preparation. SFMPs are currentlybeing developed on a priority basis.
It can take up to three years to develop a SFMP and a furtherthree years before any major change to environmental flows arepossible.
The Bulk Entitlement Conversion Project is an evolving process,with the current focus on setting limits (or caps) to growth inwater diversions for all regulated streams. As BEs are negotiated,the focus will shift towards compliance monitoring. Up to thispoint in time there have only been a small number of non-compliance reports. Over time, as demands for water grow, theincidence of non-compliance is expected to increase. At thisstage no condition and trend assessment can be offered.
Compliance with bulk(water) entitlements
CONDITION
❉Indicator Information Confidence Rating
Indicator {
State Status
56
For further information refer to the website www.nre.vic.gov.au/vcio
The health of our catchments > a Victorian report card
Figure 40. Number of Bulk Entitlements granted.Source: CaW, NRE 2002.
Figure 41. Volume of Bulk Entitlements granted.Source: CaW, NRE 2002.
Meg
alitr
es
State Condition and Trend
Condition Legend
OPTIMAL
GOOD
MODERATE
POOR
Trend Legend
POSITIVE
NEGATIVE
STABLE
UNKNOWN
▲
▼
?
Num
bers
Regional Condition and Trend
Corangamite Port Phillip Wimmera West Gippsland North East
Goulburn Broken Glenelg-Hopkins Mallee East Gippsland North Central
? ? ?
? ? ? ?
? ?
?
?
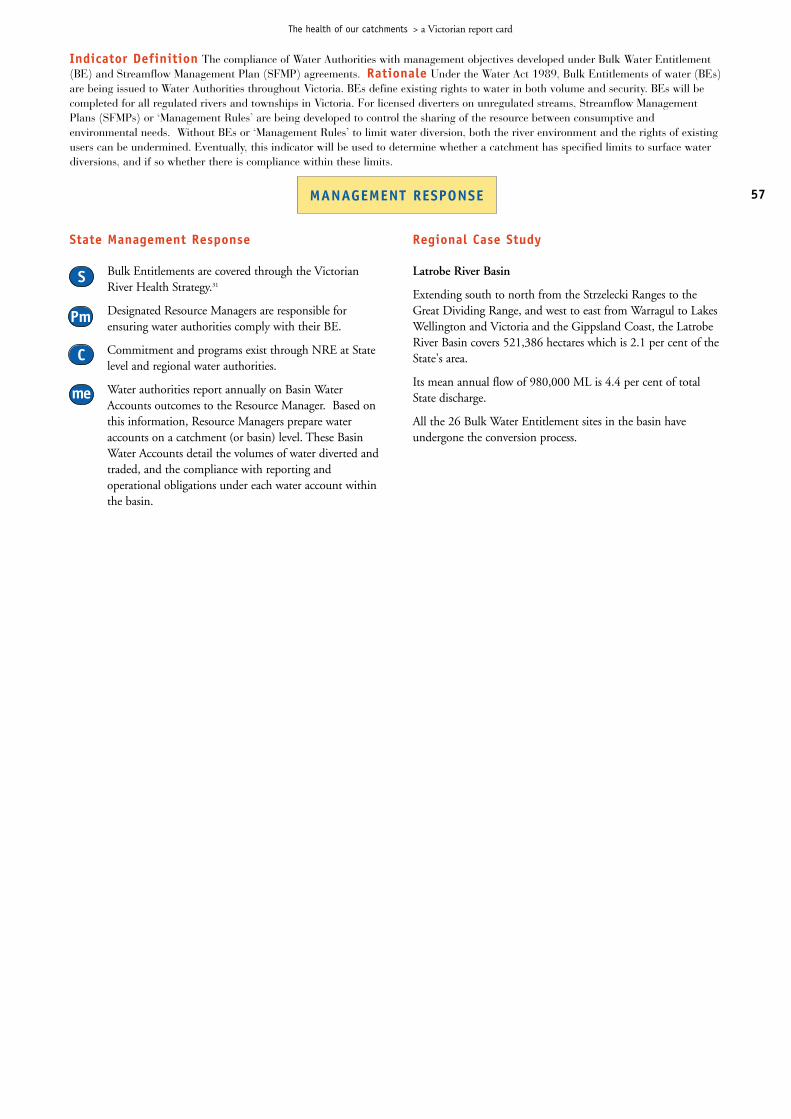
State Management Response
Bulk Entitlements are covered through the Victorian River Health Strategy.31
Designated Resource Managers are responsible for ensuring water authorities comply with their BE.
Commitment and programs exist through NRE at Statelevel and regional water authorities.
Water authorities report annually on Basin WaterAccounts outcomes to the Resource Manager. Based onthis information, Resource Managers prepare wateraccounts on a catchment (or basin) level. These BasinWater Accounts detail the volumes of water diverted andtraded, and the compliance with reporting andoperational obligations under each water account withinthe basin.
Regional Case Study
Latrobe River Basin
Extending south to north from the Strzelecki Ranges to theGreat Dividing Range, and west to east from Warragul to LakesWellington and Victoria and the Gippsland Coast, the LatrobeRiver Basin covers 521,386 hectares which is 2.1 per cent of theState's area.
Its mean annual flow of 980,000 ML is 4.4 per cent of totalState discharge.
All the 26 Bulk Water Entitlement sites in the basin haveundergone the conversion process.
57
The health of our catchments > a Victorian report card
Indicator Definition The compliance of Water Authorities with management objectives developed under Bulk Water Entitlement(BE) and Streamflow Management Plan (SFMP) agreements. Rationale Under the Water Act 1989, Bulk Entitlements of water (BEs)are being issued to Water Authorities throughout Victoria. BEs define existing rights to water in both volume and security. BEs will becompleted for all regulated rivers and townships in Victoria. For licensed diverters on unregulated streams, Streamflow ManagementPlans (SFMPs) or ‘Management Rules’ are being developed to control the sharing of the resource between consumptive andenvironmental needs. Without BEs or ‘Management Rules’ to limit water diversion, both the river environment and the rights of existingusers can be undermined. Eventually, this indicator will be used to determine whether a catchment has specified limits to surface waterdiversions, and if so whether there is compliance within these limits.
MANAGEMENT RESPONSE
S
me
C
Pm

The health of our catchments > a Victorian report card
theme MANAGING WATERRESOURCES
Regional Case Study
Deakin Main Drain Site No. 406704
Description of Drainage CatchmentThis monitoring station monitors flows from the Deakin Main Drainsystem. This system collects drainage from 56,114 ha of land within theCentral Goulburn and Rochester Irrigation Areas. Approximately 50 percent is irrigated. The irrigation component of the catchment ispredominantly flood irrigated dairying and mixed farming. Flows in thedrain originate from surface runoff, groundwater and channel outfalls. It alsoreceives flood water from upstream dryland. The drain flows into the RiverMurray near Echuca.
Results and Interpretation
Dry month drainage flow has consistently dropped in last three years. Thishas been influenced by less irrigation induced rainfall runoff. Reducedirrigation could be due to less available irrigation supplies.
Note that high flood events sometimes last more than one month and givethe indicator a higher reading. This has been corrected where possible.
Barr Creek Main Drain Capels Crossing Site No. 407252
Description of Drainage CatchmentThis monitoring station monitors flows from the Barr Creek drainagesystem. The Barr Creek collects drainage from 60,000 ha of land within theTorrumbarry Irrigation supply system. The Barr Creek drainage catchment ispredominantly flood irrigated dairying and mixed farming. Flows in the BarrCreek originate from groundwater discharge, surface runoff and channeloutfalls. It also receives flood water from upstream dryland and otherirrigation areas within the Loddon catchment. The Barr Creek flows into theRiver Murray and contributes a large salt load. The salt impact on theMurray is controlled by diversion to Lake Tutchewop and also by drainagereuse.
Results and Interpretation
Dry month drainage flow has consistently dropped in the last five years. Thishas been influenced by less irrigation-induced rainfall runoff. Reducedirrigation could be due to less available irrigation supplies. In two of theseyears there has been reduced water availability but not to the extent ofrestrictions in the Goulburn system.
Note that high flood events sometimes last more than one month and givethe indicator a higher reading. This has been corrected where possible.
58
For further information refer to the website www.nre.vic.gov.au/vcio
Irrigation induced drainage flows
CONDITION
❉Indicator Information Confidence Rating
Indicator {
Regional Trend
Corangamite Port Phillip Wimmera West Gippsland North East
Goulburn Broken Glenelg-Hopkins Mallee East Gippsland North Central
State Trend
▼
Condition Legend
OPTIMAL
GOOD
MODERATE
POOR
Trend Legend
POSITIVE
NEGATIVE
STABLE
UNKNOWN
▲
▼
?
Figure 43. Site No. 407252: Barr Creek Main DrainCapels Crossing.Source: CaW, NRE.
Meg
alitr
es
Year
Figure 42. Site No. 406704: Deakin Main Drain.Source: CaW, NRE.
n/a n/a ? n/a?n/a n/a
▼
This indicator provides a regional representation ofdrainage water generated by irrigation from selecteddrainage catchments. Further interpretation andanalysis is required to determine the relationshipbetween drainage flows and water use efficiency.
▼ ▼
Meg
alitr
es
Year
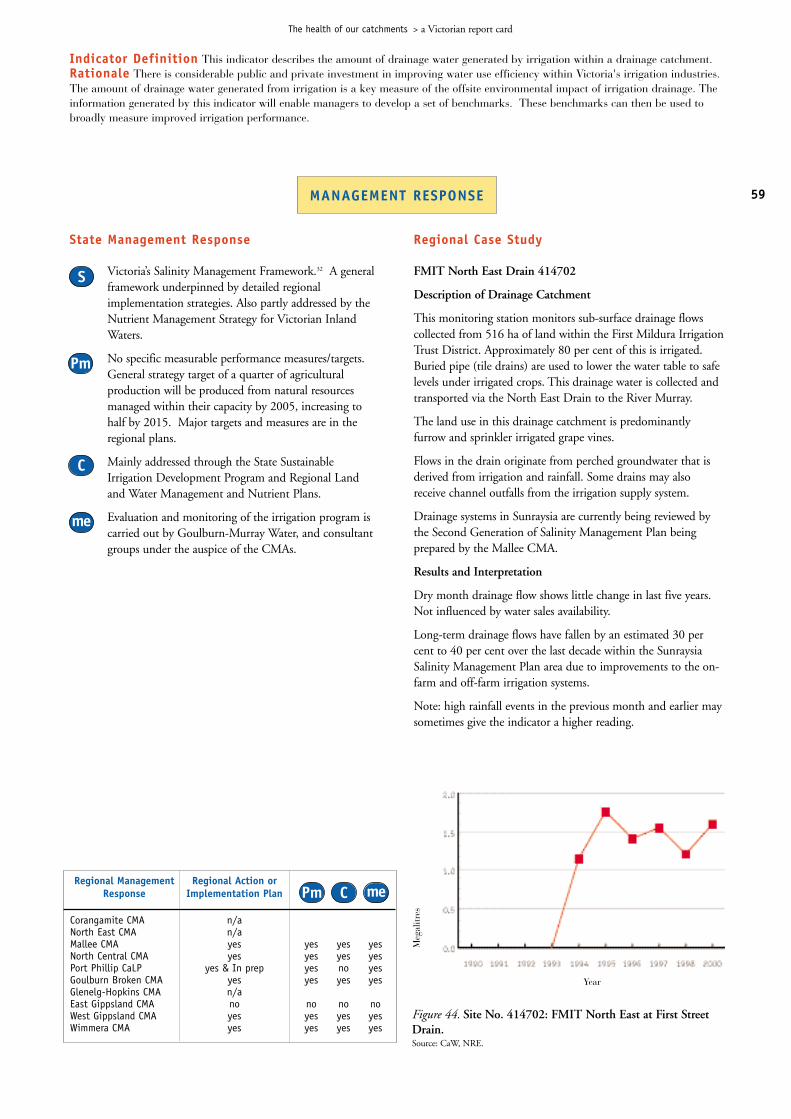
State Management Response
Victoria’s Salinity Management Framework.32 A general framework underpinned by detailed regional implementation strategies. Also partly addressed by the Nutrient Management Strategy for Victorian Inland Waters.
No specific measurable performance measures/targets. General strategy target of a quarter of agricultural production will be produced from natural resources managed within their capacity by 2005, increasing to half by 2015. Major targets and measures are in the regional plans.
Mainly addressed through the State Sustainable Irrigation Development Program and Regional Land and Water Management and Nutrient Plans.
Evaluation and monitoring of the irrigation program is carried out by Goulburn-Murray Water, and consultant groups under the auspice of the CMAs.
S
me
C
Pm
The health of our catchments > a Victorian report card
Regional Case Study
FMIT North East Drain 414702
Description of Drainage Catchment
This monitoring station monitors sub-surface drainage flowscollected from 516 ha of land within the First Mildura IrrigationTrust District. Approximately 80 per cent of this is irrigated.Buried pipe (tile drains) are used to lower the water table to safelevels under irrigated crops. This drainage water is collected andtransported via the North East Drain to the River Murray.
The land use in this drainage catchment is predominantlyfurrow and sprinkler irrigated grape vines.
Flows in the drain originate from perched groundwater that isderived from irrigation and rainfall. Some drains may alsoreceive channel outfalls from the irrigation supply system.
Drainage systems in Sunraysia are currently being reviewed bythe Second Generation of Salinity Management Plan beingprepared by the Mallee CMA.
Results and Interpretation
Dry month drainage flow shows little change in last five years.Not influenced by water sales availability.
Long-term drainage flows have fallen by an estimated 30 percent to 40 per cent over the last decade within the SunraysiaSalinity Management Plan area due to improvements to the on-farm and off-farm irrigation systems.
Note: high rainfall events in the previous month and earlier maysometimes give the indicator a higher reading.
59
Indicator Definition This indicator describes the amount of drainage water generated by irrigation within a drainage catchment.Rationale There is considerable public and private investment in improving water use efficiency within Victoria's irrigation industries.The amount of drainage water generated from irrigation is a key measure of the offsite environmental impact of irrigation drainage. Theinformation generated by this indicator will enable managers to develop a set of benchmarks. These benchmarks can then be used tobroadly measure improved irrigation performance.
MANAGEMENT RESPONSE
Regional Management Regional Action orResponse Implementation Plan
Corangamite CMA n/aNorth East CMA n/aMallee CMA yes yes yes yesNorth Central CMA yes yes yes yesPort Phillip CaLP yes & In prep yes no yesGoulburn Broken CMA yes yes yes yesGlenelg-Hopkins CMA n/aEast Gippsland CMA no no no noWest Gippsland CMA yes yes yes yesWimmera CMA yes yes yes yes
meCPm
Figure 44. Site No. 414702: FMIT North East at First StreetDrain.Source: CaW, NRE.
Meg
alitr
es
Year

theme MANAGING WATERRESOURCES
Regional Case Study
Shepparton Irrigation Area
The Shepparton Irrigation Region Landand Water Management Plan has beenimplementing surface drainage schemesin several major catchments.
More than 44,500 ha of land has beenprotected by drainage installed in thelast five years.
It is estimated that a further 241,510 hastill requires drainage in the SheppartonIrrigation Region Land and WaterManagement Plan area. This does notinclude groundwater pumping for sub-surface drainage control.
The trend is the change in the amountof land protected from waterloggingand rising saline watertables.
60
For further information refer to the website www.nre.vic.gov.au/vcio
The health of our catchments > a Victorian report card
Irrigation area requiringdrainage
CONDITION
❉Indicator Information Confidence Rating
Indicator {
State Trend
▼Shepparton Irrigation Area Estimated area
requiring drainage
supply system drainage system total area (ha) 1995 (ha) 2000 (ha)Rochester Lockington 20440 5400 3620Rochester Barmawm 11570 1740 1550Rochester Wharparilla 9470 9470 3290Rochester Campaspe 11180 7400 7400Rochester Strathallan 9240 4360 4360Central Goulburn Deakin 46230 21210 19320Central Goulburn Corop Lakes 48620 38850 34450Central Goulburn Tongala 14930 2160 2160Central Goulburn Mosquito 45990 34120 24200Central Goulburn Coram 7100 1660 1660Central Goulburn Wyuna 22750 14340 12910Central Goulburn Rodney 17230 10680 4200Central Goulburn Coomboona 15360 8900 6870Central Goulburn Ardmona 9420 5730 3330Central Goulburn Toolamba 8740 4410 1470Shepparton South Kialla 17100 5970 4930Shepparton South Shepparton 9800 540 540Shepparton South Tallygaroopna 37100 27500 27300Shepparton South Invergordon 19180 5480 5480Shepparton South Kaarimba 8900 5830 5830Murray Valley Barhma/Nathalia 55200 27340 26940Murray Valley Strathmerton 33630 8310 6510Murray Valley Muckatah 40040 34640 33190
Table 3. Shepparton Irrigation Drainage System.Source: CaW, NRE.
Condition Legend
OPTIMAL
GOOD
MODERATE
POOR
Trend Legend
POSITIVE
NEGATIVE
STABLE
UNKNOWN
▲
▼
?
Regional Trend
Corangamite Port Phillip Wimmera West Gippsland North East
Goulburn Broken Glenelg-Hopkins Mallee East Gippsland North Central
n/a n/a ? n/a?n/a n/a
▼▼ ▼

The health of our catchments > a Victorian report card
Regional Case Study
Loddon Catchment
A review of irrigation drainage strategies is currently underwayfor the Loddon catchment (North Central CMA). It covers theKerang-Swan Hill, Tragowel Plains, Torrumbarry East OfLoddon and Boort West of Loddon Land and WaterManagement Plans.
Large areas of community surface drainage were completed inthe early 1990's, especially in the Tragowel Plains Land andWater Management Plan area.
Construction of new drains in Koondrook-Murrabit is plannedto occur shortly. Other areas are awaiting the development ofan integrated drainage strategy, currently in preparation.
61
Indicator Definition This indicator describes the total area of land within an irrigation supply system that requires access tosurface or sub-surface drainage. Rationale Surface and sub-surface drainage schemes are required to protect irrigated agriculture,natural assets and public infrastructure from waterlogging and rising saline watertables. Government, community and industry have putconsiderable effort into the development of salinity, water quality and nutrient management plans to overcome these issues. To supportthis investment, it is important that we evaluate the effectiveness of current drainage schemes, identify areas in need of further drainage,and monitor the impact of changing land use on existing or proposed drainage schemes.
MANAGEMENT RESPONSE
Loddon Catchment Estimated area requiring drainage
supply system drainage system total area (ha) 1990 (ha) 1995 (ha) 2000 (ha)
Pyramid Boort West of 89,000 34,600 31,600 31,000Boort Loddon
Pyramid inc Tragowel Plains 120,000 80,000 21,400 20,000Boort
Torrumbarry Torrumbarry 130,000 20,000 20,000 20,000East of Loddon
Torrumbarry Kerang Swan 110,000 31,500 31,000 31,000Hill
Table 4. Loddon Catchment and Drainage Systems.Source: CaW, NRE.
State Management Response
Victoria’s Salinity Management Framework. A general framework underpinned by detailed regional implementation strategies. Also partly addressed by the Nutrient Management Strategy for Victorian Inland Waters.
No specific measurable performance measures/targets. General strategy target of a quarter of agricultural production will be produced from natural resources managed within their capacity by 2005, increasing to half by 2015. Major targets and measures are in the regional plans.
Mainly addressed through the State Sustainable Irrigation Development Program and Regional Land and Water Management and Nutrient Plans.
Evaluation and monitoring of the irrigation program is carried out by Goulburn-Murray Water, and consultant groups under the auspice of the CMAs.
S
me
C
Pm
Regional Management Regional Action orResponse Implementation Plan
Corangamite CMA n/aNorth East CMA no no no noMallee CMA yes yes yes yesNorth Central CMA yes yes yes yesPort Phillip CaLP yes & In prep yes no yesGoulburn Broken CMA yes yes yes yesGlenelg-Hopkins CMA n/aEast Gippsland CMA no no no noWest Gippsland CMA yes yes yes yesWimmera CMA yes yes yes yes
meCPm
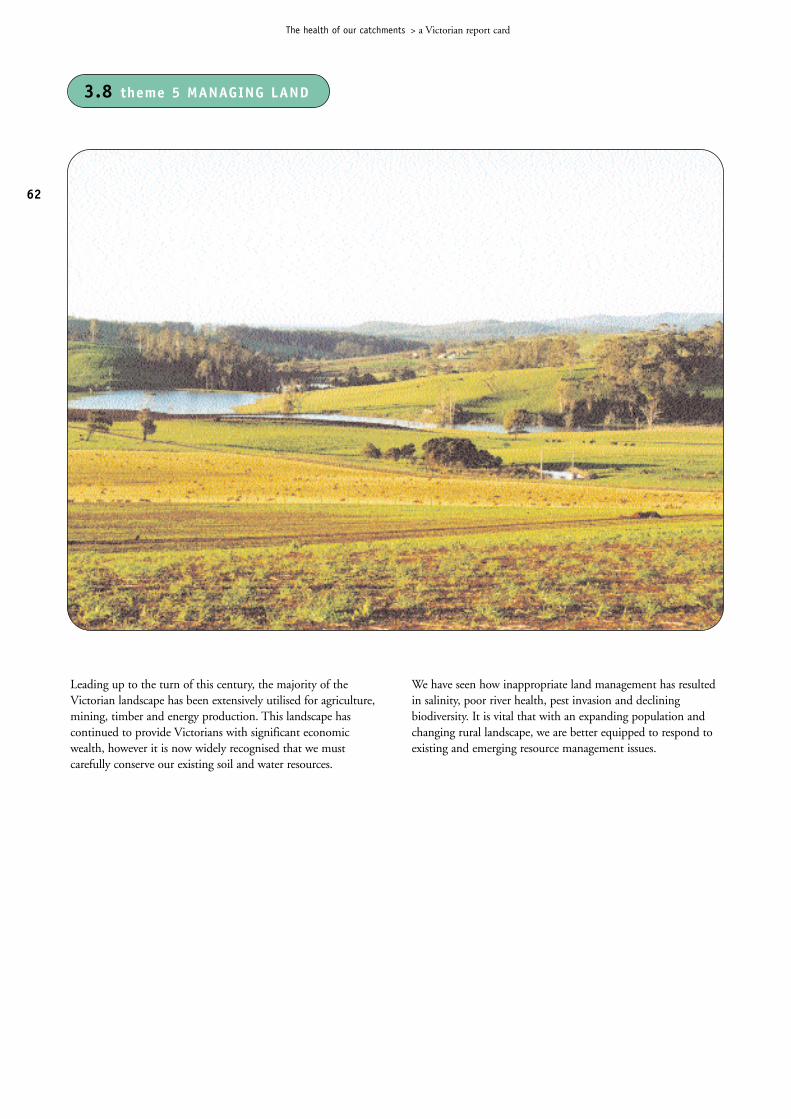
62
Leading up to the turn of this century, the majority of theVictorian landscape has been extensively utilised for agriculture,mining, timber and energy production. This landscape hascontinued to provide Victorians with significant economicwealth, however it is now widely recognised that we mustcarefully conserve our existing soil and water resources.
We have seen how inappropriate land management has resultedin salinity, poor river health, pest invasion and decliningbiodiversity. It is vital that with an expanding population andchanging rural landscape, we are better equipped to respond toexisting and emerging resource management issues.
The health of our catchments > a Victorian report card
3.8 theme 5 MANAGING LAND

63
The health of our catchments > a Victorian report card
Management response assessment legend
The legend of S, Pm, C, and me is used to introduce discussion onmanagement responses at both the State and regional level:
= This symbol describes if a State strategy (or regional action plan),of relevance to the indicator, exists or is in preparation.
= This symbol outlines if the above Strategy/Plan contains clear performance measures and targets.
= This symbol describes if the above Strategy/Plan is supported by a State/regional commitment to an implementation program with resourcing.
= This symbol outlines if the Strategy/Plan contains a clear process for monitoring and evaluation.
Quality of data legend
A Green symbol represents good consistent data collection and interpretation (>5 years) on condition and trends;
An Orange symbol represents some consistent data collection and interpretation (<5 years) on either condition or trend but not both;
A Red symbol represents poor or limited data collection and interpretation.
S
me
C
Pm
❉
❉❉
The legends below apply to all indicators in this theme.
In particular, agriculture has doubled the productive capacity ofmany landscapes by adding nutrient and water inputs anddeveloping improved crop varieties. However, in many parts ofthe landscape current agricultural production systems are notsustainable. Even recognised best management practices havenot been successful in controlling excess leakage of water togroundwater systems or minimising soil and nutrient loss torivers and estuaries. In some areas we therefore continue toaccelerate dryland salinity and contribute to declining waterquality off-farm.
Agricultural productivity is at risk. Loss of topsoil, soil nutrientbalance, salinity, soil acidity and soil structure decline are seriousmanagement issues for farmers. Without efforts to manage thenutrient and water balance and control soil loss, the productivecapacity of land will decline. The scale of some issues such assalinity and acidity will involve entire landscapes.
Due to the vast area of land at risk and the potential damage toecosystems, biodiversity and agriculture it will be necessary todevelop and implement new and improved production systems.Government can fast track the development of sustainableproduction systems by providing access to information that willunderpin research, catchment modelling, policy formation,program development, monitoring and evaluation.

State TrendResults and Interpretation
Current salinity risk areas are based on 1:250,000 scale mappingof land affected by dryland salinity and shallow salinewatertables prepared for the Murray Darling Basin SalinityAudit and the National Land and Water Resources Audit.
In Victoria, the current area at risk from dryland salinity is670,000 hectares. Worst case groundwater modelling suggestsup to 3.1 million hectares of privately owned land will beaffected by salinity in 2050.
Between 8 and 18 per cent of the State’s agricultural land ispredicted to be within a high salinity risk category, while 47 percent may fall in the moderate salinity risk category.
Agricultural losses related to salinity are expected to increasefrom approximately $27 million per year to between $77million and $166 million per year in 2050.
High risk areas are concentrated in the Goulburn Broken, NorthCentral, Wimmera, Mallee, Glenelg-Hopkins and CorangamiteCatchment Management Authority (CMA) regions.
The damage resulting from salinity and high watertables oninfrastucture may double by 2050.
Shallow watertables are expected to have a major impact uponwetlands in the North Central, Goulburn Broken, Corangamite,Wimmera and Glenelg-Hopkins CMA regions.
Source: NLWRA 2000.35
State Status
64
For further information refer to the website www.nre.vic.gov.au/vcio
The health of our catchments > a Victorian report card
theme MANAGING LAND Land use impact - drylandsalinity
CONDITION
❉Indicator Information Confidence Rating
Indicator {
Regional Condition and Trend
Corangamite Port Phillip Wimmera West Gippsland North East
Goulburn Broken Glenelg-Hopkins Mallee East Gippsland North Central
State Condition and Trend
▼
▼
▼
▼
▼
▼
▼
▼
▼
▼
Condition Legend
OPTIMAL
GOOD
MODERATE
POOR
Trend Legend
POSITIVE
NEGATIVE
STABLE
UNKNOWN
▲
▼
?
Figure 45. Salinity risk in Victoria - 1998Source: NLWRA 2000.35
Figure 46. Salinity risk in Victoria - 2050Source: NLWRA 2000.35

The health of our catchments > a Victorian report card
65
Indicator Definition The change over time in the area of agricultural land in Victoria at risk from accelerated dryland salinity.Rationale Government and the community have invested heavily in the control and management of dryland salinity throughoutVictoria, however salinity continues to impact upon agricultural production, natural ecosystems and public infrastructure. Monitoringand mapping the spread of dryland salinity is therefore needed to answer the following important questions: What Victorian catchmentshave expanding salinity problems? What is the rate of expansion within Victorian catchments? How effective are our current salinitycontrol options? Government and the community can then use the results of this monitoring to evaluate the effectiveness of policy,programs, and targets negotiated within regional Land and Water Management Plans.
MANAGEMENT RESPONSE
State Management Response
Victoria’s Salinity Management Framework.32
An overarching document setting direction for regional detailed Salinity Management Plans.
By 2015 there will be a real reduction in the environmental and economic impacts of salinity.Complete modelling of land and water salinity levels for all Victorian catchments by 2005.By 2005, critical recharge zones within catchments will be identified with 50 per cent of these critical areasrevegetated by 2015.By 2015 Victoria will have reduced the impact of risinggroundwater on the riverine environment and key wetlands.
Commitment through the $1.4 billion National Action Plan (NAP) for Salinity and Water Quality in the sixpriority CMA regions. Regions currently reviewing their Salinity ManagementPlans (SMPs) through NRE and the CMAs.
Regional monitoring and evaluation to be determinedthrough SMPs. NAP evaluation and monitoring strategyalso being finalised.
S
me
C
Pm
Regional Management Regional Action orResponse Implementation Plan
Corangamite CMA yes yes yes yesNorth East CMA yes yes yes yesMallee CMA yes yes yes yesNorth Central CMA yes yes yes yesPort Phillip CaLP yes yes yes yesGoulburn Broken CMA yes yes yes yesGlenelg-Hopkins CMA yes yes yes yesEast Gippsland CMA no no no noWest Gippsland CMA yes yes yes yesWimmera CMA yes yes yes yes
meCPmFigure 47. Groundwater flow system responsiveness index.Source: Centre for Land Protection Research 2002.
Regional Case Study
Figure 47 indicates areas in Victoria where salinity risk isaccelerated by land management practices. This mapping isderived from the Land Use Impact Model (LUIM).
Within the area where mapping has been completed, 52 percent of agricultural land is currently in the high to very highrisk category as a result of current land management. Nine percent is in the moderate risk category, with 39 per cent in thenegligible to low categories.
The major areas of land at high risk occur north of the divideon the Riverine and Wimmera Plains, where both the inherentpotential for salinity and contributing land managementpractices coincide. There are several smaller areas in theCorangamite and Glenelg regions also in the high and veryhigh risk categories under current land management.
Note: Public land has been excluded. Information for theMallee, Port Phillip and Gippsland areas will become availablein the next couple of years.
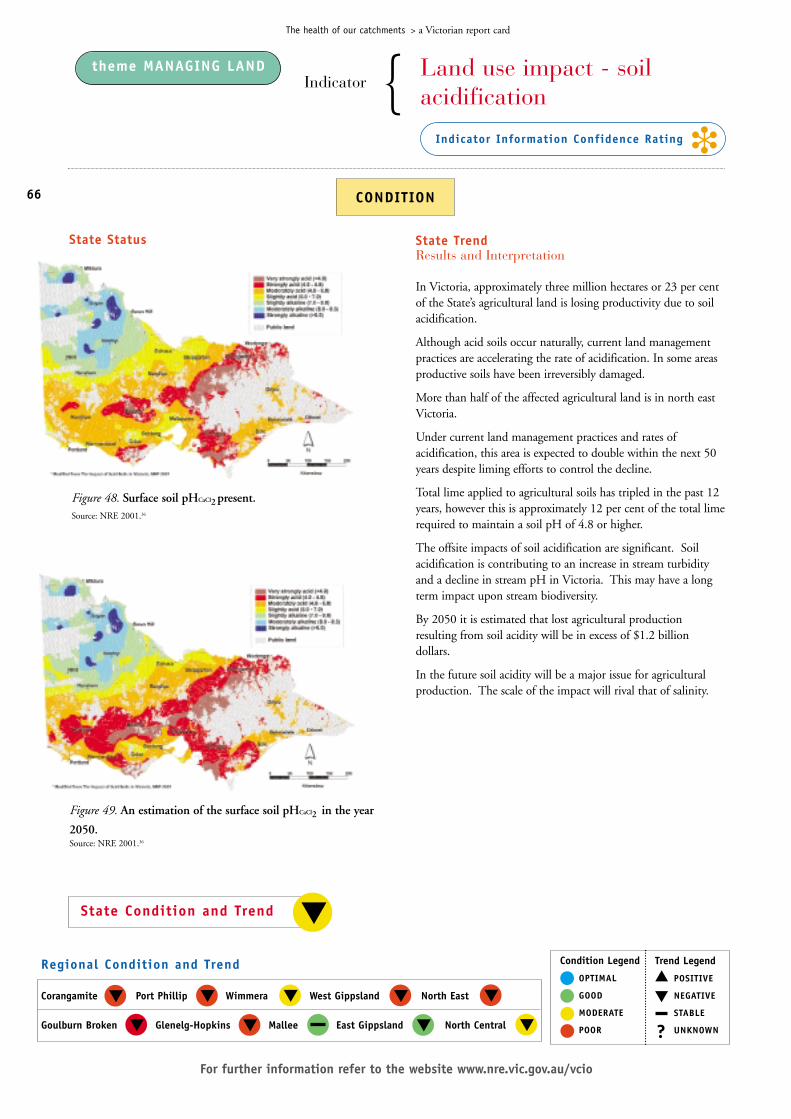
The health of our catchments > a Victorian report card
State Status State TrendResults and Interpretation
In Victoria, approximately three million hectares or 23 per centof the State’s agricultural land is losing productivity due to soilacidification.
Although acid soils occur naturally, current land managementpractices are accelerating the rate of acidification. In some areasproductive soils have been irreversibly damaged.
More than half of the affected agricultural land is in north eastVictoria.
Under current land management practices and rates ofacidification, this area is expected to double within the next 50years despite liming efforts to control the decline.
Total lime applied to agricultural soils has tripled in the past 12years, however this is approximately 12 per cent of the total limerequired to maintain a soil pH of 4.8 or higher.
The offsite impacts of soil acidification are significant. Soilacidification is contributing to an increase in stream turbidityand a decline in stream pH in Victoria. This may have a longterm impact upon stream biodiversity.
By 2050 it is estimated that lost agricultural productionresulting from soil acidity will be in excess of $1.2 billiondollars.
In the future soil acidity will be a major issue for agriculturalproduction. The scale of the impact will rival that of salinity.
66
For further information refer to the website www.nre.vic.gov.au/vcio
theme MANAGING LAND Land use impact - soilacidification
CONDITION
❉Indicator Information Confidence Rating
Indicator {
Regional Condition and Trend
Corangamite Port Phillip Wimmera West Gippsland North East
Goulburn Broken Glenelg-Hopkins Mallee East Gippsland North Central
State Condition and Trend
▼
▼
▼
▼
▼
▼ ▼
▼ ▼
▼
Condition Legend
OPTIMAL
GOOD
MODERATE
POOR
Trend Legend
POSITIVE
NEGATIVE
STABLE
UNKNOWN
▲
▼
?
Figure 49. An estimation of the surface soil pHCaCl2 in the year
2050.Source: NRE 2001.36
Figure 48. Surface soil pHCaCl2 present.Source: NRE 2001.36

Regional Case Study
The health of our catchments > a Victorian report card
67
Indicator Definition The change over time in the area of agricultural land in Victoria at risk from accelerated soil acidity.Rationale Soil acidity is one of a suite of soil health issues that can be influenced by land management practices. The causes of soilacidification are many and varied, however past and present farming systems continue to accelerate the decline in soil pH through nitrateleaching and removal of produce. This indicator will identify where improved land management practices are required. Stakeholders mayalso use this indicator to measure the success of strategies and actions included in the Impact of Acid Soils in Victoria document.
MANAGEMENT RESPONSE
Rainfall Plant species Acidification rate Lime equivalent
High rainfall Lucerne hay high 0.60(annual rainfall > Crop/pasture high 0.35550mm) Grass/Legume high 0.30
Annual pasture medium 0.25Wheat/lupin medium 0.20Perennial pasture medium 0.20Grapes low 0.10Eucalyptus low 0.07Eucalyptus/acacia spp. low 0.04Tobacco low -0.02
Low rainfall Wheat/legume medium 0.15(annual rainfall > Annual pasture low 0.05300mm ) Wheat/pasture low 0.02
Risk rating CMA region
high North EastGoulburn BrokenGlenelg-HopkinsWest GippslandNorth Central (southern portion)Wimmera (southern portion)
medium CorangamitePort PhillipNorth Central (northern portion)Wimmera (northern portion)
low MalleeEast Gippsland
State Management Response
Draft ‘Impact of Acid Soil in Victoria’36 documentreleased in 2001. Awaiting State response.
The draft identifies a range of ways to reduce soil aciditybut contains no measurable targets.
Conducted by Agriculture Victoria research institutes atRutherglen and Bendigo on a project-by-project basis.
No ongoing program. Information collected byAgriculture Victoria research institutes at Rutherglen andBendigo on a project-by-project basis.
S
me
C
Pm
Regional Management Regional Action orResponse Implementation Plan
Corangamite CMA no no no noNorth East CMA yes yes no noMallee CMA n/aNorth Central CMA yes yes no yesPort Phillip CaLP no no no noGoulburn Broken CMA yes yes yes yesGlenelg-Hopkins CMA no no no noEast Gippsland CMA no no no noWest Gippsland CMA no no no noWimmera CMA yes yes yes yes
meCPm
Table 5. Soil acidification risk for each CatchmentManagement Authority region in Victoria.Source: NRE 200131.
Table 6. Acidification rates and annual lime requirements fordifferent farming systems in high and low rainfallenvironments of Victoria.Source: NRE 200131.

The health of our catchments > a Victorian report card
significantly increased in many areas by current landmanagement. This can be attributed to the fact that the landmanagement practices used in the risk assessment occur mainlyin the north west of the State where the risk is reduced by thelow rainfall rate.
Model results are available for the years 1995 and 1997. Due tothe short interval (two years) between the two sets of results,valid trend analysis is not possible. This information will providea baseline for future trend analysis.
State Status
68
For further information refer to the website www.nre.vic.gov.au/vcio
theme MANAGING LAND Land use impact - watererosion
CONDITION
❉Indicator Information Confidence Rating
Indicator {
Regional Condition and Trend
Corangamite Port Phillip Wimmera West Gippsland North East
Goulburn Broken Glenelg-Hopkins Mallee East Gippsland North Central
State Condition and Trend
?
?
?
? ?
?
?
? ?
?
Condition Legend
OPTIMAL
GOOD
MODERATE
POOR
Trend Legend
POSITIVE
NEGATIVE
STABLE
UNKNOWN
▲
▼
?
Figure 50. Inherent risk of water erosion.Source: Centre for Land Protection Research 2002.
State TrendResults and Interpretation
Figure 50 outlines those areas with a high susceptibility to watererosion that face additional risk due to unsustainable landmanagement practices. The map is derived from the Land UseImpact Model (LUIM). Figures on actual area degraded bywater erosion are currently unavailable and thus an indicator ofcurrent condition is derived by identifying the area that ispotentially eroding under current land management conditions.
Figure 50 and 51 can be compared to see the impact landmanagement has in increasing or decreasing the risk of watererosion. At this point in time the risk of water erosion is not
?

State Management Response
There is no Statewide strategy for soil issues and management at this stage. The impact of turbidity and nutrients entering waterways means soil erosion is addressed by many regional water quality and nutrient management plans.
The performance measures and targets exist in regional water quality and nutrient management plans.
Commitment at a regional level through the CMA water quality and nutrient management plans. At a State level the issue is in part addressed through various related strategies but no ongoing soil management program. Most information is developed by AgricultureVictoria research institutes at Bendigo and Rutherglen.
Most information is collected and interpreted by Agriculture Victoria research institutes at Bendigo andRutherglen.
Regional Case Study
Figure 52 indicates the percentage of agricultural land inVictoria at risk from water erosion. Twenty-one per cent ofagricultural land is currently in the high to very high riskcategory as a result of current land management. Two per cent isin the moderate risk category, with 77 per cent in the negligibleto low risk categories under current land management.
The significant areas of land at high and very high risk occurpredominantly in the central and western areas of Victoria,where highly susceptible landscapes and contributing landmanagement practices coincide. These areas of high risk werefound to be relatively small for the State.
The land management practices considered in the riskassessment included conventional tillage, stubble burning andcultivation fallow. If other land management practices were tobe included in the assessment, the risk ratings for the State maychange.
Soil fertility and water quality will continue to be at greater riskwhere land management practices accelerate water erosion.
Note: Public land has been excluded. Results are based on parishareas.
69
The health of our catchments > a Victorian report card
Indicator Definition The change over time in the area of agricultural land in Victoria at risk from accelerated water erosion.Rationale Water erosion is a natural process that is accelerated by land management practices that disturb the soil or leave it bare ofvegetation. Where accelerated water erosion continues to occur, there will be long-term implications for biodiversity, water quality andagricultural productivity. This indicator is useful to land managers as it will identify where inappropriate land management occurs, andwhere improved management practices or a change in land use is required.
MANAGEMENT RESPONSE
Regional Management Regional Action orResponse Implementation Plan
Corangamite CMA no no no noNorth East CMA yes yes yes yesMallee CMA no no no noNorth Central CMA yes yes no yesPort Phillip CaLP no no no noGoulburn Broken CMA yes yes yes yesGlenelg-Hopkins CMA no no no noEast Gippsland CMA yes no no noWest Gippsland CMA no no no noWimmera CMA yes yes yes yes
meCPm
Figure 51. Overall water erosion risk in Victoria.Source: Centre for Land Protection Research 2002.
Figure 52. Percentage of Victoria’s agricultural land at risk ofwater erosion, 1997.Source: Centre for Land Protection Research 2002.
S
me
C
Pm

The health of our catchments > a Victorian report card
management has in increasing or decreasing the risk of winderosion. In some cropping areas in the north west of the state,current land management practices are increasing the likelihoodof wind erosion occurring.
Model results are available for the years 1995 and 1997. Due tothe short interval (two years) between the two sets of results,valid trend analysis is not possible. This information will providea baseline for future trend analysis.
State Status
70
For further information refer to the website www.nre.vic.gov.au/vcio
theme MANAGING LAND Land use impact - winderosion
CONDITION
❉Indicator Information Confidence Rating
Indicator {
Regional Condition and Trend
Corangamite Port Phillip Wimmera West Gippsland North East
Goulburn Broken Glenelg-Hopkins Mallee East Gippsland North Central
State Condition and Trend ?
Condition Legend
OPTIMAL
GOOD
MODERATE
POOR
Trend Legend
POSITIVE
NEGATIVE
STABLE
UNKNOWN
▲
▼
?
Figure 53. Inherent susceptibility to winderosion.Source: Centre for Land Protection Research 2002.
State TrendResults and Interpretation
Figure 53 outlines those areas with a high susceptibility to winderosion. The map is derived from the Land Use Impact Model(LUIM). Figures on actual area degraded by wind erosion arecurrently unavailable and thus an indicator of current conditionis derived by identifying the area that is potentially degradingunder current land management conditions.
Figure 53 and 54 can be compared to see the impact land
?
?
?
?
?
?
?
?
?
?

Figure 55 indicates the percentage of agricultural land inVictoria at risk from wind erosion. Twenty-one per cent ofagricultural land is currently in the high to very high riskcategory as a result of current land management. Two per cent isin the moderate risk category, with 77 per cent in the negligibleto low risk categories under current land management.
Areas of land at risk occur predominantly in the north west ofthe State in the Mallee and Wimmera regions of Victoria whereboth highly susceptible landscapes and contributing landmanagement practices coincide.
The land management practices included in the risk assessmentincluded conventional tillage, stubble burning and cultivationfallow. If other land management practices were to be includedin the assessment, the risk ratings for the State may change.
While not a significant issue for much of the State, wind erosionis of key importance in the north west cropping areas ofVictoria. Soil loss resulting from wind erosion has the potentialto impact significantly upon the future productivity of thisregion.
Note: Public land has been excluded. Results are based on parishareas.
71
The health of our catchments > a Victorian report card
Indicator Definition The change over time in the area of agricultural land in Victoria at risk from accelerated wind erosion.Rationale Wind erosion is a natural process that is accelerated by land management practices that disturb the soil or leave it bare ofvegetation for periods of time. Dust storms have the capacity to create large sand drifts that may cover roads, bury fences and blockwater supply channels and drainage systems. From an agricultural perspective, wind erosion events remove productive topsoils leading todeclining yields. This indicator is useful to land managers as it will identify where inappropriate land management occurs, and whereimproved management practices or a change in land use is required.
MANAGEMENT RESPONSE
Regional Management Regional Action orResponse Implementation Plan
Corangamite CMA no no no noNorth East CMA no no no noMallee CMA no no no noNorth Central CMA yes yes no yesPort Phillip CaLP no no no noGoulburn Broken CMA yes yes yes yesGlenelg-Hopkins CMA no no no noEast Gippsland CMA no no no noWest Gippsland CMA no no no noWimmera CMA yes yes yes yes
meCPm
Figure 54. Overall wind erosion risk in Victoria.Source: Source: Centre for Land Protection Research 2002.
Figure 55. Percentage of Victoria’s agricultural land at risk ofwind erosion, 1997.Source: Source: Centre for Land Protection Research 2002.
State Management Response
There is no Statewide strategy for soil issues and management at this stage. The impact of turbidity and nutrients entering waterways means soil erosion is addressed by many regional water quality and nutrient management plans.
The performance measures and targets exist in regional water quality and nutrient management plans.
Commitment at a regional level through the CMA water quality and nutrient management plans. At a State level the issue is in part addressed through various related strategies but no ongoing soil management program. Most information is developed by AgricultureVictoria research institutes such as Bendigo andRutherglen.
Most information is collected and interprated by Agriculture Victoria research institutes such as Bendigoand Rutherglen.
S
me
C
Pm

Figures 56 and 57 can be compared to see the impact landmanagement has in increasing or decreasing the risk of soilstructure decline. In this case soil structure decline is beingaccelerated across a large proportion of Victoria.
Model results are available for the years 1995 and 1997. Due tothe short interval (two years) between the two sets of results,valid trend analysis is not possible. This information will providea baseline for future trend analysis.
State Status
72
For further information refer to the website www.nre.vic.gov.au/vcio
The health of our catchments > a Victorian report card
theme MANAGING LAND Land use impact - soilstructure decline
CONDITION
❉Indicator Information Confidence Rating
Indicator {
Regional Condition and Trend
Corangamite Port Phillip Wimmera West Gippsland North East
Goulburn Broken Glenelg-Hopkins Mallee East Gippsland North Central
State Condition and Trend ?
Condition Legend
OPTIMAL
GOOD
MODERATE
POOR
Trend Legend
POSITIVE
NEGATIVE
STABLE
UNKNOWN
▲
▼
?
Figure 56. Inherent susceptibility to soilstructure decline.Source: Centre for Land Protection Research 2002.
State TrendResults and Interpretation
Figure 56 outlines those areas with a high susceptibility to soilstructure decline. The map is derived from the Land UseImpact Model (LUIM). Figures on actual area degraded by soilstructure decline are currently unavailable and thus an indicatorof current condition is derived by identifying the area that ispotentially degrading under current land managementconditions.
?
?
?
?
?
?
?
?
?
?
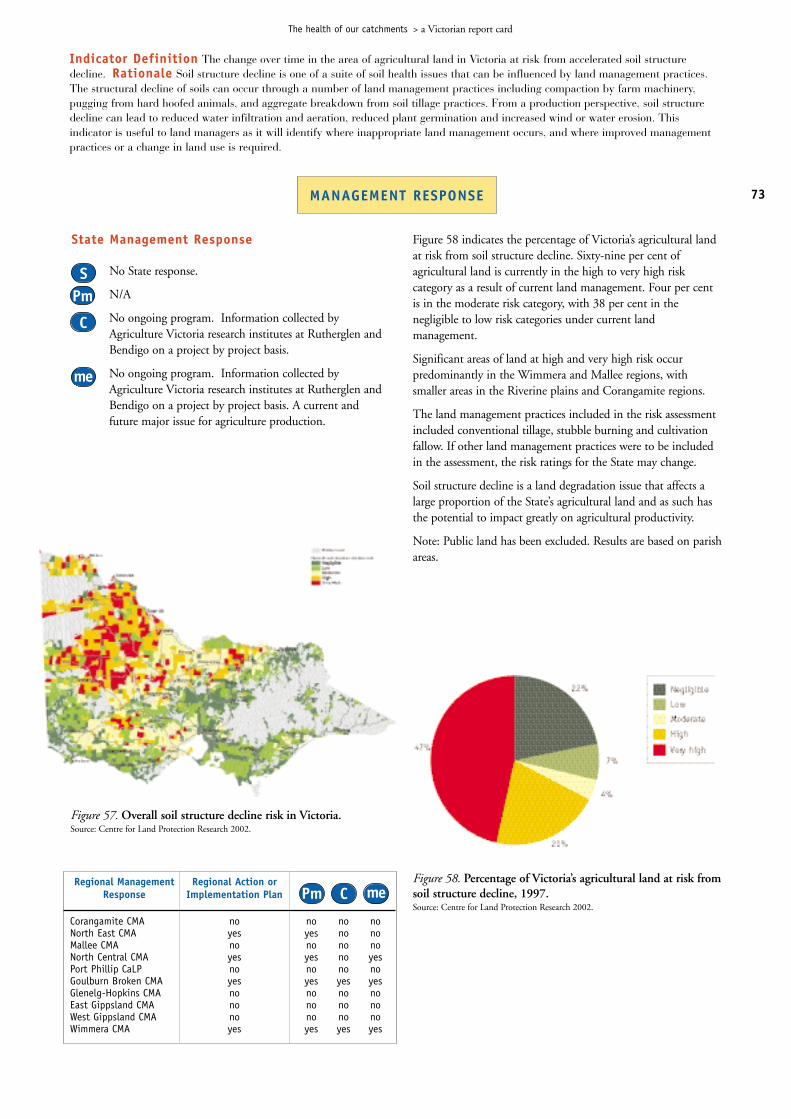
Figure 58 indicates the percentage of Victoria’s agricultural landat risk from soil structure decline. Sixty-nine per cent ofagricultural land is currently in the high to very high riskcategory as a result of current land management. Four per centis in the moderate risk category, with 38 per cent in thenegligible to low risk categories under current landmanagement.
Significant areas of land at high and very high risk occurpredominantly in the Wimmera and Mallee regions, withsmaller areas in the Riverine plains and Corangamite regions.
The land management practices included in the risk assessmentincluded conventional tillage, stubble burning and cultivationfallow. If other land management practices were to be includedin the assessment, the risk ratings for the State may change.
Soil structure decline is a land degradation issue that affects alarge proportion of the State’s agricultural land and as such hasthe potential to impact greatly on agricultural productivity.
Note: Public land has been excluded. Results are based on parishareas.
The health of our catchments > a Victorian report card
73
Indicator Definition The change over time in the area of agricultural land in Victoria at risk from accelerated soil structuredecline. Rationale Soil structure decline is one of a suite of soil health issues that can be influenced by land management practices.The structural decline of soils can occur through a number of land management practices including compaction by farm machinery,pugging from hard hoofed animals, and aggregate breakdown from soil tillage practices. From a production perspective, soil structuredecline can lead to reduced water infiltration and aeration, reduced plant germination and increased wind or water erosion. Thisindicator is useful to land managers as it will identify where inappropriate land management occurs, and where improved managementpractices or a change in land use is required.
MANAGEMENT RESPONSE
State Management Response
No State response.
N/A
No ongoing program. Information collected byAgriculture Victoria research institutes at Rutherglen andBendigo on a project by project basis.
No ongoing program. Information collected byAgriculture Victoria research institutes at Rutherglen andBendigo on a project by project basis. A current andfuture major issue for agriculture production.
S
me
C
Pm
Regional Management Regional Action orResponse Implementation Plan
Corangamite CMA no no no noNorth East CMA yes yes no noMallee CMA no no no noNorth Central CMA yes yes no yesPort Phillip CaLP no no no noGoulburn Broken CMA yes yes yes yesGlenelg-Hopkins CMA no no no noEast Gippsland CMA no no no noWest Gippsland CMA no no no noWimmera CMA yes yes yes yes
meCPm
Figure 57. Overall soil structure decline risk in Victoria.Source: Centre for Land Protection Research 2002.
Figure 58. Percentage of Victoria’s agricultural land at risk fromsoil structure decline, 1997.Source: Centre for Land Protection Research 2002.

The health of our catchments > a Victorian report card
74
The Australian landscape has been changing for millions of yearsin response to climatic, geological and biological factors. SinceEuropean settlement, the scale and rate of change has beenextensive and rapid. Of the 90 species of non-marine mammalsknown to have inhabited Victoria upon European arrival, 23 arenow extinct in the State. Five of these are now totally extinct.Many other species have much-diminished populations anddistributions. More than 1000 species of Victorian plants areeither rare or threatened. Invasion by introduced terrestrial andaquatic animal and weed species has been a significantcomponent of this change.
More than a thousand species of weeds in Victoria have beenestimated to cause hundreds of millions of dollars worth ofdamage annually to Victorian agriculture and aquaculture. Pestanimals also have a significant impact on the value and qualityof the State’s land and water resources. The impact that pestshave on natural ecosystems is significant. Weeds such asblackberry and boneseed and pest animals such as foxes andrabbits have the potential to destroy the biodiversity values ofhighly prized ecosystems. Exotic weed species now comprise 28per cent of Victoria’s flora.
Management of pests is principally the responsibility of eachland and waterway manager. Despite considerable governmentand private sector investment, invasion of terrestrial and aquatic(freshwater and marine) weeds and vertebrate pests, such asrabbits, still represent a major threat to both the productivecapacity of land and water and the integrity of our naturalecosystems.
Rabbits
Rabbits have been estimated to cost Victoria up to $130 millionper annum in lost production. Since the introduction andestablishment of Rabbit Haemorrhagic Disease (RHD), majordeclines in rabbit numbers have occurred (66 per cent to 99 percent) compared to population densities recorded prior to itsoutbreak in 1996. These declines have been maintained throughthe combined effects of coordinated, conventional controlprograms concentrating on the removal of rabbit harbour, andthe movement of RHD and Myxomatosis through rabbitpopulations over time.
Rabbit numbers have fluctuated throughout 2001/02 inconjunction with seasonal conditions and rabbit breeding cycles.High levels of immunity to RHD are being detected at sites
3.9 theme 6 MANAGING PEST PLANTS AND ANIMALS

The health of our catchments > a Victorian report card
75
where populations have been continually challenged by thevirus, but it must be remembered that these populations are atvery low levels compared to pre-RHD. The potential forpopulations to increase where high levels of immunity exist is ofmajor concern and places emphasis on the need forimplementation of other control activities to keep populationslow and minimise rabbit impact.
Nine of the ten Rabbit Action Plans have been released and arebeing implemented across the State.
Complacency by the community and Government is a majorthreat to the ongoing decline of rabbit impact across Victoria.Rabbits have a remarkable history of recovery from the mostlethal poisons and virulent diseases employed against them.Failure in the past by both the community and Government totake advantage over the long-term of the results of these controlshas been a major and costly mistake.
The community and Government must dedicate sufficientresources to maintain gains achieved and extend effective, long-term rabbit management techniques, such as harbourdestruction and fumigation. Unless rabbit control is acceptedas a priority issue and matched with adequate resources, effectiveand long-term control will never be achieved in Victoria.
Weeds
Weeds are a serious threat to primary production andbiodiversity in Victoria. They reduce farm and forestproductivity, displace native species and contribute significantlyto land and water degradation. The most recent estimate putsthe direct cost of weeds to Victorian agriculture at more than$360 million per year. Additional costs are borne by public landmanagers, industry, local government and utility companies.The impact that weeds have on natural ecosystems is significantbut the ways of understanding this impact are still beingdeveloped.
It is not reasonable to expect that weeds will be eradicated froma region or a State where they are well established. Establishedweeds, however, need to be prevented from spreading into othervalued areas at risk to limit their impact. In addition, isolatedinfestations of serious weeds need to be prevented frombecoming established. This is particularly important, as thethreat of new weeds becoming established in Victoria is seriousand increasing.
While considerable effort is being undertaken by thecommunity and Government to manage and prevent the spreadof established weeds, early identification and interventionprovides opportunities to minimise, or even eradicate, specificweeds from the State or a region.
Ongoing vigilance, action and commitment are required fromboth the community and Government for priority weeds.Programs must be thoroughly planned and resourced, ensuringthe ability to undertake immediate action on new incursions inmuch the same way as is used for controlling the release ofexotic diseases into Victoria.
Management response assessment legend
The legend of S, Pm, C, and me is used to introduce discussion onmanagement responses at both the State and regional level:
= This symbol describes if a State strategy (or regional action plan),of relevance to the indicator, exists or is in preparation.
= This symbol outlines if the above Strategy/Plan contains clear performance measures and targets.
= This symbol describes if the above Strategy/Plan is supported by a State/regional commitment to an implementation program with resourcing.
= This symbol outlines if the Strategy/Plan contains a clear process for monitoring and evaluation.
Quality of data legend
A Green symbol represents good consistent data collection and interpretation (>5 years) on condition and trends;
An Orange symbol represents some consistent data collection and interpretation (<5 years) on either condition or trend but not both;
A Red symbol represents poor or limited data collection and interpretation.
S
me
C
Pm
❉
❉❉
The legends below apply to all indicators in this theme.
Additional effort will be required to improve the knowledge ofthe declared weeds in Victoria in relation to their occurrenceand treatment, and improved program evaluation. New plantspecies with pest potential need to be assessed based on riskanalysis assessing both economic and environmental impactsbefore applying resources to major eradication programs. Fornew weeds, priorities need to be established based on thelikelihood of introduction and the threat posed. For establishedweeds, priorities will be developed based on CMA Weed ActionPlans, seven of which are released and being implemented withthe other three being finalised following extensive communityconsultation.
As part of this process, the risks of introduction and spread mustbe communicated to the community so that attitudes andbehaviour are modified, partnerships developed, communityvigilance increased and cooperative mechanisms developed tominimise these risks.
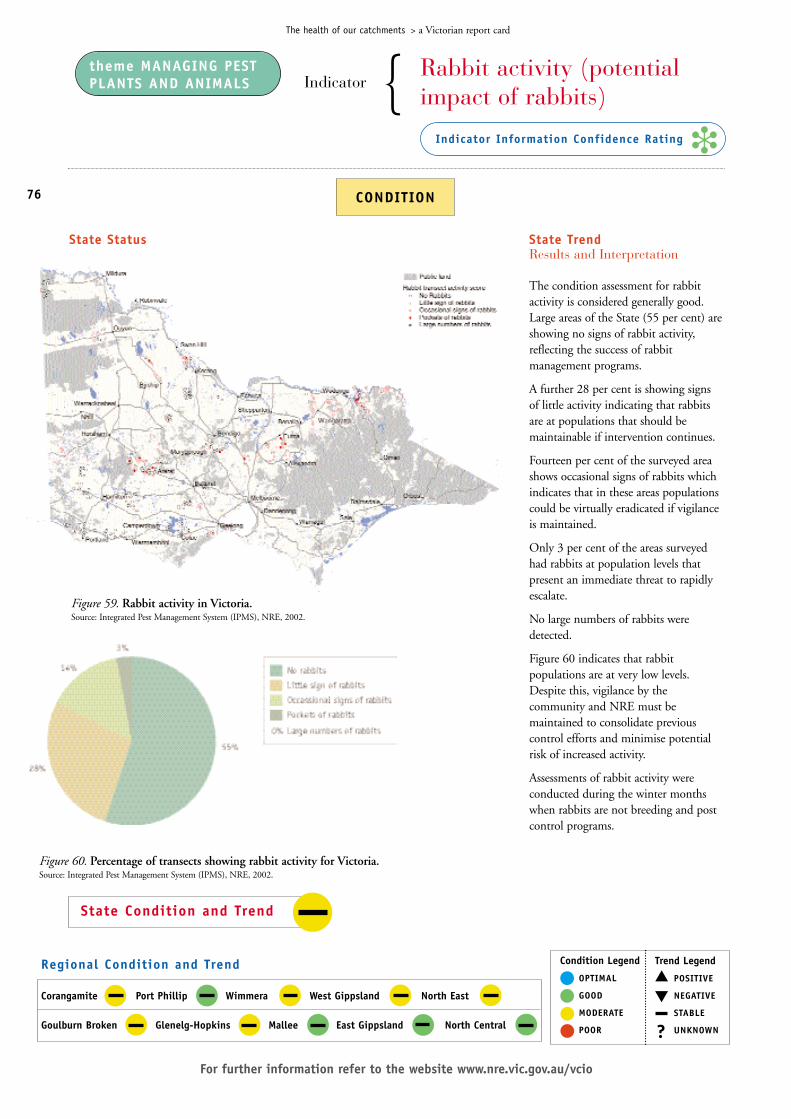
State TrendResults and Interpretation
The condition assessment for rabbitactivity is considered generally good.Large areas of the State (55 per cent) areshowing no signs of rabbit activity,reflecting the success of rabbitmanagement programs.
A further 28 per cent is showing signsof little activity indicating that rabbitsare at populations that should bemaintainable if intervention continues.
Fourteen per cent of the surveyed areashows occasional signs of rabbits whichindicates that in these areas populationscould be virtually eradicated if vigilanceis maintained.
Only 3 per cent of the areas surveyedhad rabbits at population levels thatpresent an immediate threat to rapidlyescalate.
No large numbers of rabbits weredetected.
Figure 60 indicates that rabbitpopulations are at very low levels.Despite this, vigilance by thecommunity and NRE must bemaintained to consolidate previouscontrol efforts and minimise potentialrisk of increased activity.
Assessments of rabbit activity wereconducted during the winter monthswhen rabbits are not breeding and postcontrol programs.
State Status
76
For further information refer to the website www.nre.vic.gov.au/vcio
The health of our catchments > a Victorian report card
theme MANAGING PESTPLANTS AND ANIMALS
Rabbit activity (potentialimpact of rabbits)
CONDITION
❉Indicator Information Confidence Rating
Indicator {
Regional Condition and Trend
Corangamite Port Phillip Wimmera West Gippsland North East
Goulburn Broken Glenelg-Hopkins Mallee East Gippsland North Central
State Condition and Trend
Condition Legend
OPTIMAL
GOOD
MODERATE
POOR
Trend Legend
POSITIVE
NEGATIVE
STABLE
UNKNOWN
▲
▼
?
Figure 60. Percentage of transects showing rabbit activity for Victoria.Source: Integrated Pest Management System (IPMS), NRE, 2002.
Figure 59. Rabbit activity in Victoria.Source: Integrated Pest Management System (IPMS), NRE, 2002.

The health of our catchments > a Victorian report card
Regional Case Study
Rabbit Control
The Black Range is a granite outcrop of hills of some 3,000hectares near Stawell in the Wimmera region of Victoria. Therange is covered with open woodlands incorporating Yellow Box,Yellow Gum, Scent Bark, Long Leaf Box, Red Gum and SwampGum communities.
Overgrazing has seen the richly diverse understorey of the areaseriously depleted. Some native plant species have been lostaltogether, with up to 70 other species under threat. The BlackRange Land Management Group has undertaken an understoreyvegetation restoration program which began in the late 1980s.A critical part of this program is to restore genetic diversity ofunderstorey species.
The first priority has been to protect a number of rare andthreatened species by excluding rabbit grazing. This has beenachieved by erecting rabbit exclusion plots using rabbit-proofnetting. Cuttings and seed have been propagated to reintroducethese plants into areas where they have disappeared.
Intensive and ongoing rabbit control through the Rabbit BusterProgram has been the number one priority of the group. Rabbitnumbers have been reduced by 85 per cent which has resultedin significant regeneration of native plant species andcommunities.
Source: Victorian Rabbit Buster Report and Evaluation Stage 1,(2000).
77
Indicator Definition The Rabbit Activity Indicator describes rabbit abundance and potential for reinfestation. Rationale Rabbits cause significant damage to both human wealth and the natural environment. Figures for Victoria indicate apotential increase in agricultural profits of $133.34 million if the impact of rabbits were removed (NRE, 2000). Regional Rabbit ActionPlans have been developed to combine government and community efforts to control rabbit infestations. However, until recently therehas been no means to determine the overall effectiveness of the Plans and rabbit control programs. Therefore, this indicator has beendesigned to provide feedback to land managers on the risk of re-infestation by rabbits, target areas for rabbit control measures, and theeffectiveness of rabbit control activities.
MANAGEMENT RESPONSE
State Management Response
Victorian Pest Management Framework.37
Rabbit Management Strategy.
Both the above documents set the strategic direction for Rabbit management at a Statewide level. Strategic actions and targets are detailed in the Rabbit Action Plans developed by the CMAs.
Development of Rabbit Action Plans in each CMA region. On-going partnership between local communities, NRE and the CMAs.
NRE regions report back to NRE Head Office quarterlyon the area in each region covered by control programs and the area successfully treated by control programs.
S
me
C
Pm
Regional Management Regional Action orResponse Implementation Plan
Corangamite CMA yes yes yes yesNorth East CMA yes yes yes yesMallee CMA yes yes yes yesNorth Central CMA yes yes yes yesPort Phillip CaLP yes/In prep yes/In prep yes/In prep yes/prep
Goulburn Broken CMA yes yes yes yesGlenelg-Hopkins CMA yes yes yes yesEast Gippsland CMA yes no yes noWest Gippsland CMA yes yes yes yesWimmera CMA yes yes yes yes
meCPm

The health of our catchments > a Victorian report card
State Status
78
For further information refer to the website www.nre.vic.gov.au/vcio
theme MANAGING PESTPLANTS AND ANIMALS
Extent and severity of StateProhibited Weed species.
CONDITION
❉Indicator Information Confidence Rating
Indicator {
Regional Condition and Trend
Corangamite Port Phillip Wimmera West Gippsland North East
Goulburn Broken Glenelg-Hopkins Mallee East Gippsland North Central
State Condition and Trend
Condition Legend
OPTIMAL
GOOD
MODERATE
POOR
Trend Legend
POSITIVE
NEGATIVE
STABLE
UNKNOWN
▲
▼
?
State Prohibited Weed Species
Alligator Weed Alternanthera philoxeroides
Black Knapweed Centaurea nigra
Camelthorn Alhagi maurorum
Ivy-leafed Sida Sida leprosa
Lagarosiphon Lagarosiphon major
Marijuana Cannabis sativa
Mesquite Prosopis spp.
Nodding Thistle Carduus nutans
Parthenium Weed Parthenium hysterophorus
Perennial Ragweed Ambrosia psilostachya
Poverty Weed Iva axillaris
Salvinia Salvinia molesta
Tangled Hypericum Hypericum triquetrifolium
Water Hyacinth Eichhornia crassipes
Other priority weeds:
Ragwort Senecio jacobaea
Serrated tussock Nassella trichotoma
State TrendResults and Interpretation
In Victoria there are fourteen declared State Prohibited Weeds.Of these, the infestation sites of nine species found in the Statehave increased over a five year period since 1997. These speciesare Alligator Weed, Black Knapweed, Camelthorn, Ivy-leaf Sida,Mesquite, Nodding Thistle, Poverty Weed, Salvinia and WaterHyacinth. In addition, considerable effort has been taken byNRE to provide rapid response action against BranchedBroomrape, which is a serious economic weed located in SouthAustralia, but as yet not found in Victoria.
1,066 infestations have been identified and 1,350 hectarestreated through an ongoing program to control new infestations.
Occasional Marijuana findings have been reported to VictoriaPolice for destruction.
There has been a 100 per cent increase in the number ofinfestations since 1997. This is in part due to increased andmore comprehensive surveillance techniques.
Despite an increased number of infestations, condition acrossthe State is considered moderate and trends stable as knowninfestations of Prohibited Weeds are under active management.Control remains a constant challenge as new weeds are emergingall the time.
Figure 61. State Prohibited Weed occurrence.Source: NRE, Integrated Pest Management System (IPMS). Table 7. State Prohibited Weeds.
Source: CaW, NRE.

The health of our catchments > a Victorian report card
Regional Case Study
Alligator Weed
Alligator Weed (Alternanthera philoxeroides) is a serious weed ofwaterways in many parts of the world. It was first discovered inVictoria in 1996. It became apparent soon after that the weedwas being grown as a leafy vegetable predominantly by the SriLankan community, who mistakenly believed it to be thepopular Sri Lankan leafy vegetable Mukunuwenna, or Sessile JoyWeed.
A control program commenced in 1997. All identifiedinfestations were prioritised according to the risk ofnaturalisation, using proximity to waterways, size of theinfestation and land situation as risk factors. Over 800 siteswere treated with herbicide between 1997-2002.
Implementing education and awareness was an important stepin the control process, and providing a replacement vegetablewas the key to public participation. Common joy weed(Alternanthera denticulate) was selected as the replacementvegetable and made available to the Sri Lankan community.
The Alligator weed story is a good example of a community-government partnership to control a serious noxious weed. Itdemonstrates that preventive management can be successfulwhere it has active community involvement and support.
Source: Lalith Gunasekera (Winter 2002) Victorian Landcare & Catchment
Management Magazine, A Case of Mistaken Identity – the Alligator Weed Story. Issue
24, Victoria.
79
Indicator Definition The extent and severity of State Prohibited Weed infestations in Victoria. Rationale On present dayfigures it has been estimated that weeds cost Australia in excess of $3,300 million every year. Weeds also have a significant impact onnatural ecosystems and biodiversity. Internationally, invasive species are recognised as the second most significant threat to naturalecosystems. In Victoria, 16 priority weeds pose a major Statewide threat and strategies have been developed to control these species. This indicator will provide information regarding effectiveness of these strategies in controlling State Prohibited Weeds only. Over time,improved information will be collected on all priority weeds in each region to document progress and evaluate management efforts.
MANAGEMENT RESPONSE
Figure 62. Number of previous infestations (May 1997)eradicated as of May 2002.Source: CaW, NRE.
State Management Response
Victorian Pest Management Framework.37
State Weed Management Strategy.
Both the above documents set the strategic direction for weed management at a Statewide level. Priority actions and targets for control of priority weeds are detailed in Regional Weeds Action Plans, developed by all CMAs.
Development of Weed Action Plans in each CMA region. On-going partnership between local communities, NRE and the CMAs.
NRE regions provide monitoring and evaluation services. Reporting back to NRE Head Office quarterly on the area in each region covered by control programs and the area successfully treated by control programs.
S
me
C
Pm
Regional Management Regional Action orResponse Implementation Plan
Corangamite CMA yes yes yes yesNorth East CMA yes yes yes yesMallee CMA yes yes yes yesNorth Central CMA yes yes yes yesPort Phillip CaLP In prep In prep In prep prep
Goulburn Broken CMA yes yes yes yesGlenelg-Hopkins CMA yes yes yes yesEast Gippsland CMA yes no yes noWest Gippsland CMA yes yes yes yesWimmera CMA yes yes yes yes
meCPm

80
Human activities (e.g. the burning of fossil fuels, land clearing,and the development of more intensive agricultural systems)during the past 200 years have led to an increase in theconcentration of greenhouse gases in the atmosphere. This isresulting in an increase in the amount of heat that is trapped bythe atmosphere - leading to a change in the earth's climate.
The 1990s was the warmest decade and 1998 the warmest yearin instrumental record (since 1861). Climate scientists haveprojected that, over this century, the surface temperature of theearth will increase by 1.4 to 5.8°C and sea levels will rise by0.09 to 0.88 metres. Rainfall patterns are also expected tochange. These changes are expected to have a significant impacton water resources, agricultural systems, coastal areas, nativeflora and fauna, snow cover and human health.
Regional areas have an important part to play in dealing withissue of greenhouse / climate change in three main ways. Firstly,the impacts of a changing climate will need to be planned forand programs developed to assist land-based enterprises andmanagers to adapt to climate change. Secondly, initiatives to
The health of our catchments > a Victorian report card
3.10 theme 7 GREENHOUSE GAS EMISSIONS AND CLIMATE CHANGE

81
minimise the land-based emissions, particularly resulting fromland clearing and agricultural practices, need to be tailored toeach regional area. And thirdly, there is potential to increasecarbon dioxide sequestration by changing agricultural andforestry practices and to reduce emissions from land clearing andsoil disturbance but this potential is not unlimited. Carefullyplanned, revegetation for carbon sequestration in catchments,will not only remove carbon dioxide from the atmosphere butwill contribute to catchment protection, biodiversityenhancement and salinity mitigation.
In order to develop a land management policy framework andinitiatives that encourage the reduction of greenhouse gasemissions, detailed information on sources of emissions andtrends over time is required. Accurate information is requiredon native vegetation clearing, revegetation, and emissions fromagricultural sources, particularly methane from entericfermentation and nitrous oxide from agricultural soils.
To be helpful for policy and program development at thecatchment level, this information needs to be available at a localor regional scale. To enable management prescriptions to bedeveloped for agricultural systems, information about methaneand nitrous oxide emissions at a paddock-scale are required.
There is significant current investment in collecting data ongreenhouse gas emissions from land-based sources. TheCommonwealth Government has recently released data from theNational Carbon Accounting System that shows emissions on aState-by-State basis. For catchment condition reporting it willbe necessary to develop and maintain data bases that present andanalyse similar information on clearing and revegetation at alarger scale.
Investment in the establishment of plantations for carbonsequestration is reliant on high quality and easy-to-use tools toaccurately measure on-site carbon.
Australia is developing tools and information required to tackleclimate change. Work is needed to ensure the requiredinformation on clearing and revegetation is available at the Stateand regional levels and Victoria is investing in this work.Specifically the ability to estimate the carbon content of therange of native vegetation types and plantations in differentclimate zones and land systems, so that remote-sensed vegetationcover information can easily be converted to carbon stock.Similarly we need to develop the ability to project growth ratesof the full range of vegetation classes in terms of carbon, so thatthe future benefit of revegetation for carbon sequestration can beestimated more accurately.
Research into gaining a better understanding of nitrous oxideand methane emissions is just beginning and needs to beextended. Without a more precise knowledge of how and wherethese emissions are generated it is not possible to develop landmanagement policies, prescriptions or guidelines that willmitigate them. For example, our estimation of nitrous oxideemissions is calculated by applying a simple relationship withnitrogen-based fertiliser application. We know that there is no
such simple relationship and that moisture content of soils andanimal wastes are also important variables, but ourunderstanding is insufficient. This situation leads to theunacceptable situation where the only management response wehave is to alter the amount of nitrogen-based fertiliser applied,when there might be additional and more effective responsesrelated to livestock or timing of fertiliser application.
In order to understand the implications of a changing climate, itis important to develop models that predict climate change at asufficiently detailed spatial scale. These climate projections needto become the basis for further detailed studies that interpret theconsequences of an altered climate for catchment conditions,water resource management, agricultural land use, biodiversityresources, and infrastructure needs.
Victoria has invested in a partnership with CSIRO that isdelivering spatially relevant high resolution regional climateprojections for Victoria, and supporting supplementary studiesthat build on this information to better understand implicationsfor alpine systems, selected agricultural commodities, andselected biodiversity resources. This work needs to be extendedon a regional or catchment basis. Of particular priority arestudies to understand future water availability on a catchmentbasis and consequent effects on natural and agro-ecosystems.
The health of our catchments > a Victorian report card
Management response assessment legend
The legend of S, Pm, C, and me is used to introduce discussion onmanagement responses at both the State and regional level:
= This symbol describes if a State strategy (or regional action plan),of relevance to the indicator, exists or is in preparation.
= This symbol outlines if the above Strategy/Plan contains clear performance measures and targets.
= This symbol describes if the above Strategy/Plan is supported by a State/regional commitment to an implementation program with resourcing.
= This symbol outlines if the Strategy/Plan contains a clear process for monitoring and evaluation.
Quality of data legend
A Green symbol represents good consistent data collection and interpretation (>5 years) on condition and trends;
An Orange symbol represents some consistent data collection and interpretation (<5 years) on either condition or trend but not both;
A Red symbol represents poor or limited data collection and interpretation.
S
me
C
Pm
❉
❉❉
The legends below apply to all indicators in this theme.

State Status
Source Megatonnes (Mt) Percentage Change from
CO2-equivalent of total 1990 to 1999
1999 Victorian
emissions Mt CO2 Percentage
–equivalent
Stationary energy 80.9 71.8% 19.5 31.7%
Transport 18.2 16.1% 2.0 12.6%
Fugitive emissions from fuels 3.0 2.7% – 1.5 – 33.4%
Industrial processes 1.6 1.4% – 1.8 – 52.9%
Agriculture 14.2 12.6% – 0.4 – 2.7%
Forestry and other – 11.6 – 10.3% 1.4 – 11.0%
Land clearing 2.5 2.2% – 3.8 – 60.1%
Waste 3.9 3.5% – 0.1 – 1.0%
Total 112.8 100% 15.4 15.9%
The health of our catchments > a Victorian report card
State TrendResults and Interpretation
Victoria's total greenhouse gas emissionsincreased by 15.4 megatonnes or 15.9 percent between 1990 and 1999 – emissionsgrowth was particularly strong over the period1995 to 1999.
Greenhouse gas emissions from the stationaryenergy sector (primarily the production ofelectricity and the use of gas) grew by nearly32 per cent over this period – within thissector, emissions from electricity productionincreased by 18.1 megatonnes (41 per cent).
The stationary energy sector was responsiblefor nearly 72 per cent of Victoria's totalemissions in 1999.
Emissions from transport increased by 12.6per cent from 1990 to 1999.
82
For further information refer to the following websites www.nre.vic.gov.au/vcio www.greenhouse.vic.gov.au
theme GREENHOUSE GASEMISSIONS AND CLIMATE CHANGE
Victorian greenhouse gasemissions
CONDITION
❉Indicator Information Confidence Rating
Indicator {
Regional Condition and Trend
Corangamite Port Phillip Wimmera West Gippsland North East
Goulburn Broken Glenelg-Hopkins Mallee East Gippsland North Central
State Trend ▼
Condition Legend
OPTIMAL
GOOD
MODERATE
POOR
Trend Legend
POSITIVE
NEGATIVE
STABLE
UNKNOWN
▲
▼
?
1990 1995 1999
Stationary energy 61.4 65.4 80.9
Transport 16.2 16.6 18.2
Fugitive emissions 4.5 4.3 3.0
Industrial processes 3.4 1.8 1.6
Agriculture 14.6 14.4 14.2
Forestry and other -13.0 -12.9 -11.6
Land clearing 6.3 3.3 2.5
Waste 4.0 4.3 3.9
Total 97.4 97.2 112.7
Table 8. Victorian greenhouse gas emissions by sector.Source: Victorian Greenhouse Gas Inventory 1999.38
Table 9. Trends in Victorian greenhouse gas emissions by sector- 1990, 1995 and 1999.Source: Victorian Greenhouse Strategy 2002.38
Emissions from the agriculture and waste sectors both declinedmarginally over this period.
Emissions from industrial processes declined significantly – albeitfrom a relatively small base – from 1990 to 1999, falling from 3.4to 1.6 megatonnes – a reduction in emissions of PFCs fromaluminium production was a key reason for this.
The net greenhouse sink provided by the forestry sector declinedfrom 13 megatonnes in 1990 to 11.6 megatonnes in 1999.
Emissions from land clearing declined from 6.3 megatonnes in1990 to 2.5 megatonnes in 1999.
The 1999 National Greenhouse Gas Inventory (NGGI) showed anincrease in Australia's total greenhouse gas emissions of 7.3 per centfrom 1990 to 1999. As noted above, Victoria's emissions growthover this period was 15.9 per cent - consequently, Victoria's shareof total national emissions increased from 19.7 per cent in 1990 to21.3 per cent in 1999.
Regional trend assessment not sourced at time of publishing.
?
?
?
?
?
?
?
?
?
?

The health of our catchments > a Victorian report card
Regional Case Study
North Central CMA has developed a draft action plan titled ‘ARegional Response to Climate Change’. The action plan seeks torespond to climate change by sequestering carbon throughrevegetation activities and changed land use.
Under the Kyoto Protocol (1997) strong consideration has beengiven to carbon sinks. The NCCMA action plan providesguidance on how to establish vegetation that is likely to beeligible as a carbon sink. Attracting investment to fund land usechange and revegetation is essential to meet regional targets forlandscape change. Carbon sinks offer potential investors returnsthrough carbon credits.
A 20-year timeframe is proposed for the revegetation programand an investment of many millions of dollars is required. Theplan considers how best to use the current investment in NAPand NHT2 to promote longer-term investment in carbon sinks.The target audiences for this action plan include investors,landholders, policy makers and NCCMA and NRE staffinvolved in implementing regional native vegetation programs.
Source: ‘A regional response to Climate Change. Land use change and revegetation in
North Central Victoria.’ Draft NCCMA.
83
Indicator Definition This indicator measures the volume and trend in Victorian greenhouse gas emissions by sector. RationaleHuman activity has added to the emission of greenhouse gases. The increase in greenhouse gases is contributing to global warming andclimate change. The Victorian Greenhouse Strategy has been developed to help reduce the level of greenhouse gas emissions. Therefore,the identification and monitoring greenhouse gas emissions will be very important in measuring the success of the Victorian GreenhouseStrategy and measures implemented to reduce emissions.
MANAGEMENT RESPONSE
State Management Response
Victorian Greenhouse Strategy.38
The strategy outlines a vision for 2010 and identifies keyactions to reduce emissions.The combined effect of actions in the strategy willdeliver greenhouse gas emissions savings of between 5and 8.3 megatonnes CO2-equivalent per annum over2008-2012.
The Government has allocated $100 million to climate change programs over the period to 2004.
Will be monitored annually on a financial year basis. Progress report will include trends in Victoria’s greenhouse gas emissions and progress in implementing the actions contained in the strategy.A formal review of the Strategy will occur biennially.
S
me
C
Pm
Regional Management Regional Action orResponse Implementation Plan
Corangamite CMA no no no noNorth East CMA no no no noMallee CMA no no no noNorth Central CMA yes yes yes yesPort Phillip CaLP no no no noGoulburn Broken CMA no yes yes yesGlenelg-Hopkins CMA no no no noEast Gippsland CMA no no yes noWest Gippsland CMA no no no noWimmera CMA no no no no
meCPm
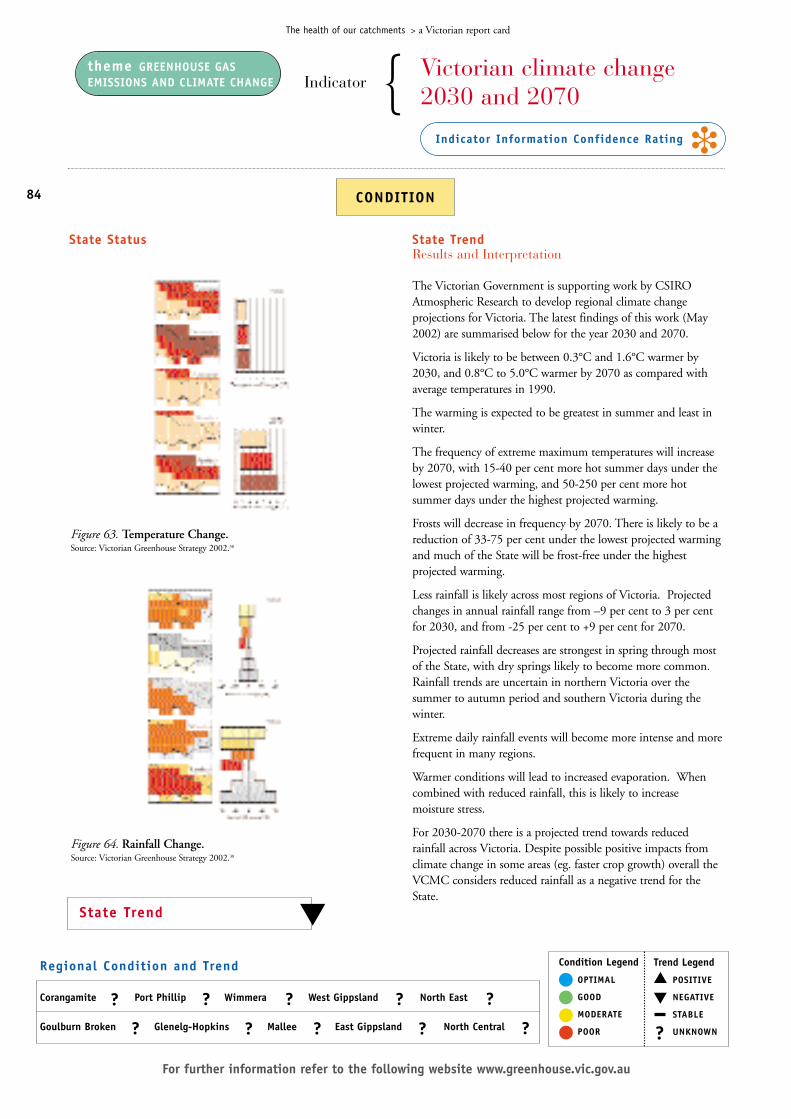
State TrendResults and Interpretation
The Victorian Government is supporting work by CSIROAtmospheric Research to develop regional climate changeprojections for Victoria. The latest findings of this work (May2002) are summarised below for the year 2030 and 2070.
Victoria is likely to be between 0.3°C and 1.6°C warmer by2030, and 0.8°C to 5.0°C warmer by 2070 as compared withaverage temperatures in 1990.
The warming is expected to be greatest in summer and least inwinter.
The frequency of extreme maximum temperatures will increaseby 2070, with 15-40 per cent more hot summer days under thelowest projected warming, and 50-250 per cent more hotsummer days under the highest projected warming.
Frosts will decrease in frequency by 2070. There is likely to be areduction of 33-75 per cent under the lowest projected warmingand much of the State will be frost-free under the highestprojected warming.
Less rainfall is likely across most regions of Victoria. Projectedchanges in annual rainfall range from –9 per cent to 3 per centfor 2030, and from -25 per cent to +9 per cent for 2070.
Projected rainfall decreases are strongest in spring through mostof the State, with dry springs likely to become more common.Rainfall trends are uncertain in northern Victoria over thesummer to autumn period and southern Victoria during thewinter.
Extreme daily rainfall events will become more intense and morefrequent in many regions.
Warmer conditions will lead to increased evaporation. Whencombined with reduced rainfall, this is likely to increasemoisture stress.
For 2030-2070 there is a projected trend towards reducedrainfall across Victoria. Despite possible positive impacts fromclimate change in some areas (eg. faster crop growth) overall theVCMC considers reduced rainfall as a negative trend for theState.
State Status
84
For further information refer to the following website www.greenhouse.vic.gov.au
The health of our catchments > a Victorian report card
theme GREENHOUSE GASEMISSIONS AND CLIMATE CHANGE
Victorian climate change2030 and 2070
CONDITION
❉Indicator Information Confidence Rating
Indicator {
Regional Condition and Trend
Corangamite Port Phillip Wimmera West Gippsland North East
Goulburn Broken Glenelg-Hopkins Mallee East Gippsland North Central
State Trend
?
▼
?
?
?
?
?
?
? ?
?
Condition Legend
OPTIMAL
GOOD
MODERATE
POOR
Trend Legend
POSITIVE
NEGATIVE
STABLE
UNKNOWN
▲
▼
?
Figure 63. Temperature Change.Source: Victorian Greenhouse Strategy 2002.38
Figure 64. Rainfall Change.Source: Victorian Greenhouse Strategy 2002.38

Regional Case Study
Tables 10 and 11 are the results of CSIRO climate modelling.The tables provide a snapshot of predicted temperature changeacross Victoria over the next 70 years.
The health of our catchments > a Victorian report card
85
Indicator Definition The predicted change in temperature and rainfall for Victoria based upon regional climate change.projections. Rationale Changes in rainfall and temperature patterns, and in the frequency of extreme weather events (eg. storms,droughts), could effect water resources, coastal environments, native flora and fauna, agriculture and forestry. It is important thereforethat governments and the community have access to the best possible information on the likely future climate to help plan for and adaptto changing climatic conditions.
MANAGEMENT RESPONSE
State Management Response
Victorian Greenhouse Strategy.38
The strategy outlines a vision for 2010 and identifies keyactions to reduce emissions.The combined effect of actions in the strategy willdeliver greenhouse gas emissions savings of between 5and 8.3 megatonnes CO2-equivalent per annum over2008-2012.
The government has allocated $100 million to climate change programs over the period to 2004.
Will be monitored annually on a financial year basis. Progress report will include trends in Victoria’s greenhouse gas emissions and progress in implementing the actions contained in the strategy.A formal review of the Strategy will occur biennially.
S
me
C
Pm
Site Summer days over 35oCpresent 2030 2070
Ballarat 4 4-7 5-17Donald 12 13-19 15-38Echuca 16 17-25 20-49Hamiliton 6 6-9 7-19Mangalore 11 12-18 14-41Melbourne 8 9-12 10-20Mildura 23 24-33 27-56Omeo 2 2-5 3-20Orbost 5 6-9 7-21Sale 4 5-7 6-16Swan Hill 20 20-30 24-55Tatura 8 9-16 11-41Wangaratta 15 16-25 20-56
Table 10. The average number of summer days over 35oC atVictorian centres for present conditions, 2030 and 2070.Source: Victorian Greenhouse Strategy 2002.38
Site Winter days below 0oCpresent 2030 2070
Ballarat 10 5-8 0-6Donald 7 2-6 0-4Echuca 10 3-8 0-5Hamiliton 8 3-6 0-5Mangalore 13 4-11 0-8Melbourne 1 0-1 0-0Mildura 4 1-3 0-1Omeo 44 29-40 7-35Orbost 3 0-2 0-1Sale 11 4-9 0-7Swan Hill 3 1-2 0-1Tatura 15 6-13 0-9Wangaratta 18 8-15 0-12
Table 11. The average number of winter days below 0oC atVictorian centres for present conditions, 2030 and 2070.Source: Victorian Greenhouse Strategy 2002.38
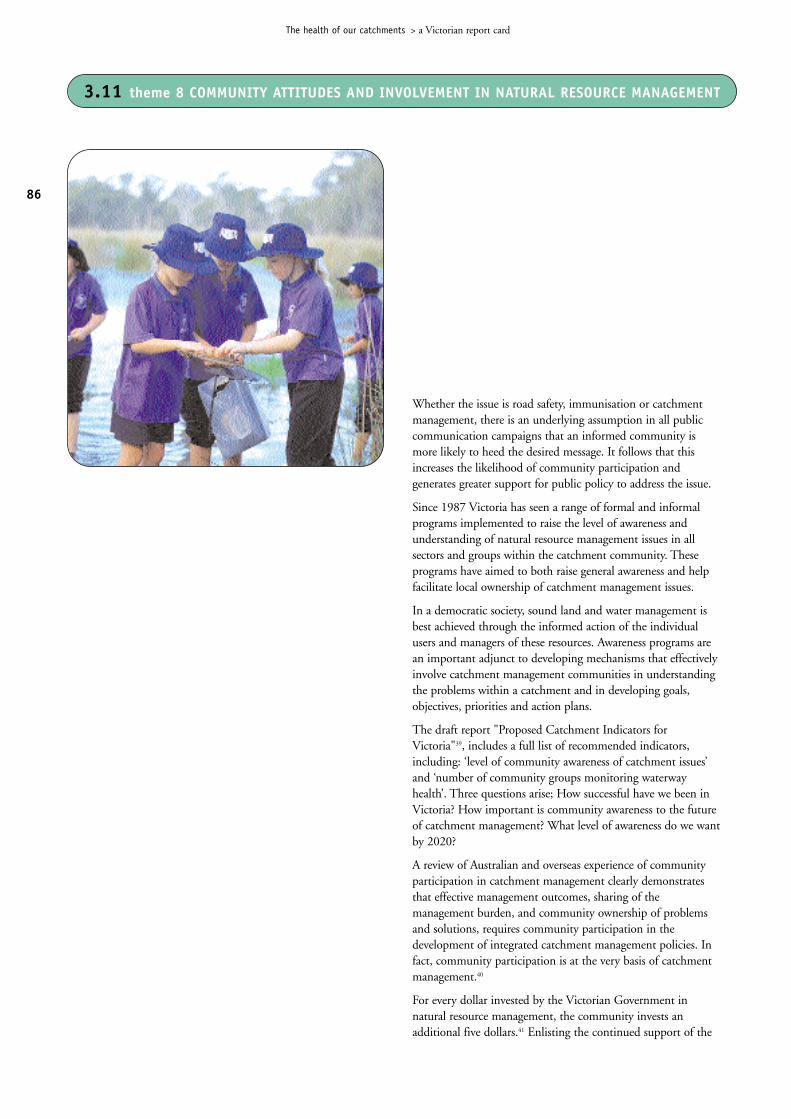
86
Whether the issue is road safety, immunisation or catchmentmanagement, there is an underlying assumption in all publiccommunication campaigns that an informed community ismore likely to heed the desired message. It follows that thisincreases the likelihood of community participation andgenerates greater support for public policy to address the issue.
Since 1987 Victoria has seen a range of formal and informalprograms implemented to raise the level of awareness andunderstanding of natural resource management issues in allsectors and groups within the catchment community. Theseprograms have aimed to both raise general awareness and helpfacilitate local ownership of catchment management issues.
In a democratic society, sound land and water management isbest achieved through the informed action of the individualusers and managers of these resources. Awareness programs arean important adjunct to developing mechanisms that effectivelyinvolve catchment management communities in understandingthe problems within a catchment and in developing goals,objectives, priorities and action plans.
The draft report "Proposed Catchment Indicators forVictoria"39, includes a full list of recommended indicators,including: ‘level of community awareness of catchment issues’and ‘number of community groups monitoring waterwayhealth’. Three questions arise; How successful have we been inVictoria? How important is community awareness to the futureof catchment management? What level of awareness do we wantby 2020?
A review of Australian and overseas experience of communityparticipation in catchment management clearly demonstratesthat effective management outcomes, sharing of themanagement burden, and community ownership of problemsand solutions, requires community participation in thedevelopment of integrated catchment management policies. Infact, community participation is at the very basis of catchmentmanagement.40
For every dollar invested by the Victorian Government innatural resource management, the community invests anadditional five dollars.41 Enlisting the continued support of the
The health of our catchments > a Victorian report card
3.11 theme 8 COMMUNITY ATTITUDES AND INVOLVEMENT IN NATURAL RESOURCE MANAGEMENT

87
community is vital to our collective success, that requires on-going communication and awareness raising. Setting targets andmonitoring progress is core to the task. In 2001 Victoria’sCatchment Management Authorities combined resources toinitiate a survey of community attitudes. 2000 phone interviews(approximately 200 in each CMA region) were conducted inmid-2001. The results provide an important benchmark forpublic awareness about catchment management issues.
Primarily, the survey sought to understand land, water andvegetation management awareness and to determine the level ofawareness of the CMA in the community and how peoplefound out about them. The survey results should be used tounderstand where the best return on investment will be gainedwith communication in future. Such a survey could become aformal evaluation tool, repeated every two to three years, to helpmonitor progress with the communication effort and to providenew data for continuous improvement in communicationcampaigns.
If we are going to use this data to inform policy then we need toknow whether the quality and strategic nature of our statewidecommunication effort is improving and whether this istranslating to improved community awareness andunderstanding of catchment management issues.
Landholders and managers are central to natural resource management issues on private land. The first Landcare group in Australia was established at Winjallock near St Arnaud in central Victoria in 1986. The Landcare program heralded a significant shift in community working with government to reverse land degradation. Landcare is considered the connection between private land managers and public benefit.42
Landcare has significantly contributed to increased awareness ofconservation issues in rural and urban areas and increasedcommunity participation in environmental activities. It has beenidentified as the most important mechanism in the nation forintegrating biodiversity conservation and agriculturalproduction. Landcare represents a significant source of socialcapacity to manage changing circumstances. It is informal, hasthe ability to address its members’ issues and is flexible in itsrange of activities.42
In Victoria, legislative reform was undertaken to support theLandcare approach for more integrated land and water
management and to improve community consultative processes.This led to the Catchment and Land Protection Act 1994 which,following further reform in 1997, resulted in the creation of theCatchment Management Authorities (CMAs). The CMAsconsolidated many existing land and water management,community advisory and service delivery groups.42
The three elements of Landcare are based in the Landcarepartnership, the relationship between the community,government and business. This partnership is the basis ofLandcare’s success and is vital in facing current environmental,social and economic imperatives.42 A large-scale survey assessingthe participation rate of people in Landcare has recently beencompleted for the first time. This benchmarking exercise ispresented as a new indicator in this theme.
The health of our catchments > a Victorian report card
Management response assessment legend
The legend of S, Pm, C, and me is used to introduce discussion onmanagement responses at both the State and regional level:
= This symbol describes if a State strategy (or regional action plan),of relevance to the indicator, exists or is in preparation.
= This symbol outlines if the above Strategy/Plan contains clear performance measures and targets.
= This symbol describes if the above Strategy/Plan is supported by a State/regional commitment to an implementation program with resourcing.
= This symbol outlines if the Strategy/Plan contains a clear process for monitoring and evaluation.
Quality of data legend
A Green symbol represents good consistent data collection and interpretation (>5 years) on condition and trends;
An Orange symbol represents some consistent data collection and interpretation (<5 years) on either condition or trend but not both;
A Red symbol represents poor or limited data collection and interpretation.
S
me
C
Pm
❉
❉❉
The legends below apply to all indicators in this theme.

State Status
Figure 65. Population of CMA regions as percentage of totalVictorian populationSource: Scarlet Consulting Australasia 2001
State TrendResults and Interpretation
Figure 65 shows the distribution of Victoria’s population byCMA region, revealing the scale of the rural/urban divide.
Figure 66 reveals that participation in community monitoringprograms such as Waterwatch continues to increase. Providingthe community with opportunities to participate in naturalresource management is important in raising awareness.
Table 12 shows unprompted awareness of organisations whomanage natural resources.
The data reveals that Landcare and NRE occupy the lion’s shareof the community’s "share of mind". The CMAs rank equalfourth after Local Water Authorities.
In another question interviewees were asked if they had heard oftheir local CMA. By comparison with the 11 per centunprompted awareness, the overall ‘prompted awareness’ ofCMAs is a healthy 54 per cent.
Further analysis of the data reveals that those most likely to beaware of CMAs are farmers, people residing in rural areas(particularly those living on the land), and people aged 30-69years.
Those less likely to be aware of CMAs are townspeople,particularly labourers, tradespersons and people not currently inthe workforce.
Figure 67 reveals that water quality (40%) is clearly consideredto be the leading natural resource issue.
Other important issues include salinity management (19%),protecting waterways and wetlands (16%), and environmentalflows (14%).
This is a benchmarking study only. No condition or trend is yetavailable.
88
For further information refer to the website www.nre.vic.gov.au/vcio
The health of our catchments > a Victorian report card
theme COMMUNITY ATTITUDES Awareness of NRM issues andorganisations
CONDITION
❉Indicator Information Confidence Rating
Indicator {
Regional Condition and Trend
Corangamite Port Phillip Wimmera West Gippsland North East
Goulburn Broken Glenelg-Hopkins Mallee East Gippsland North Central
State Trend
?
?
?
?
? ? ? ?
?
Condition Legend
OPTIMAL
GOOD
MODERATE
POOR
Trend Legend
POSITIVE
NEGATIVE
STABLE
UNKNOWN
▲
▼
?
? ?
Figure 66. Participation in Waterwatch Victoria.Source: Waterwatch Victoria, 2002.

The health of our catchments > a Victorian report card
89
Indicator Definition This indicator will determine the level of awareness in the community of natural resource managementissues and natural resource management organisations. Rationale For every dollar invested by the Victorian Government in naturalresource management, industry and landholders invest an additional five dollars.41 So enlisting the continued support of the communityis vital to our collective success. Raising the awareness of catchment management issues requires an on-going commitment tocommunication. This will involve setting targets and monitoring the progress of our communication strategies. Therefore, the results of astatewide 2001 survey provide an important benchmark for measuring public awareness of catchment management issues and theperformance of natural resource management organisations. Subsequent surveys will be vital to maximising the value of this indicator.
MANAGEMENT RESPONSE
State Management Response
No State response.
Unsure – diffuse sectional targets and measures between organisations.
There is a range of community awareness activities underway across the State. Many CMAs have communication strategies and NRE and its different divisions have communications plans. The NAP office has also developed a communications strategy.
Unsure – Effort at a CMA regional level is probably most comprehensive (and relevant). Little coordination across the state to actually target specific audiences aboutenvironmental issues.
Much of the current activity focuses on communicating with those actually involved in natural resourcemanagement. There is an important niche to be filledcommunicating environmental messages at a state levelto the broader community and other potential partners.
S
me
C
Pm
Regional Management Regional Action orResponse Implementation Plan
Corangamite CMA yes yes yes yesNorth East CMA no no no noMallee CMA yes yes yes yesNorth Central CMA yes In prep In prep In prepPort Phillip CaLP no no no noGoulburn Broken CMA no no no noGlenelg-Hopkins CMA yes yes no noEast Gippsland CMA yes yes no yesWest Gippsland CMA no no no noWimmera CMA yes yes yes yes
meCPm
Regions Landcare DNRE Local CMA Water Local
Water - boards Govt
Authority (unspec)
% % % % % %
Mallee 23 26 6 4 15 6
North East 37 21 10 10 7 10
Wimmera 39 28 10 9 10 10
Glenelg-Hopkins 36 31 11 17 10 11
East Gippsland 30 41 8 27 17 8
West Gippsland 28 29 11 11 15 4
North Central 33 26 13 6 7 8
Goulburn Broken 37 29 29 13 10 10
Corangamite 27 23 15 9 14 13
Port Phillip 4 5 20 - 11 24
Overall Awareness 30 26 16 11 11 10
Table 12. Umprompted awareness of organisations by region.Source: Taylor, Nelson, Sofres & Scarlet Consulting Australasia (2001).43
Regions Water Salinity Protecting Environmental
Quality Management Waterways Flows
& Wetlands
% % %
Mallee 37 44 13 15
North East 45 16 16 16
Wimmera 45 27 20 17
Glenelg-Hopkins 31 20 15 11
East Gippsland 49 8 17 23
West Gippsland 30 8 21 11
North Central 42 29 14 9
Goulburn Broken 36 27 14 14
Corangamite 43 11 3 13
Port Phillip 30 3 13 8
Overall Awareness 40 19 16 14
n=2001
Table 13. The hierarchy of importance of natural resourceissues by region.Source: Taylor, Nelson, Sofres & Scarlet Consulting Australasia (2001).43
Figure 67. Statewide hierarchy of importance of naturalresource issues.Source: Taylor, Nelson, Sofres & Scarlet Consulting Australasia (2001).43
%
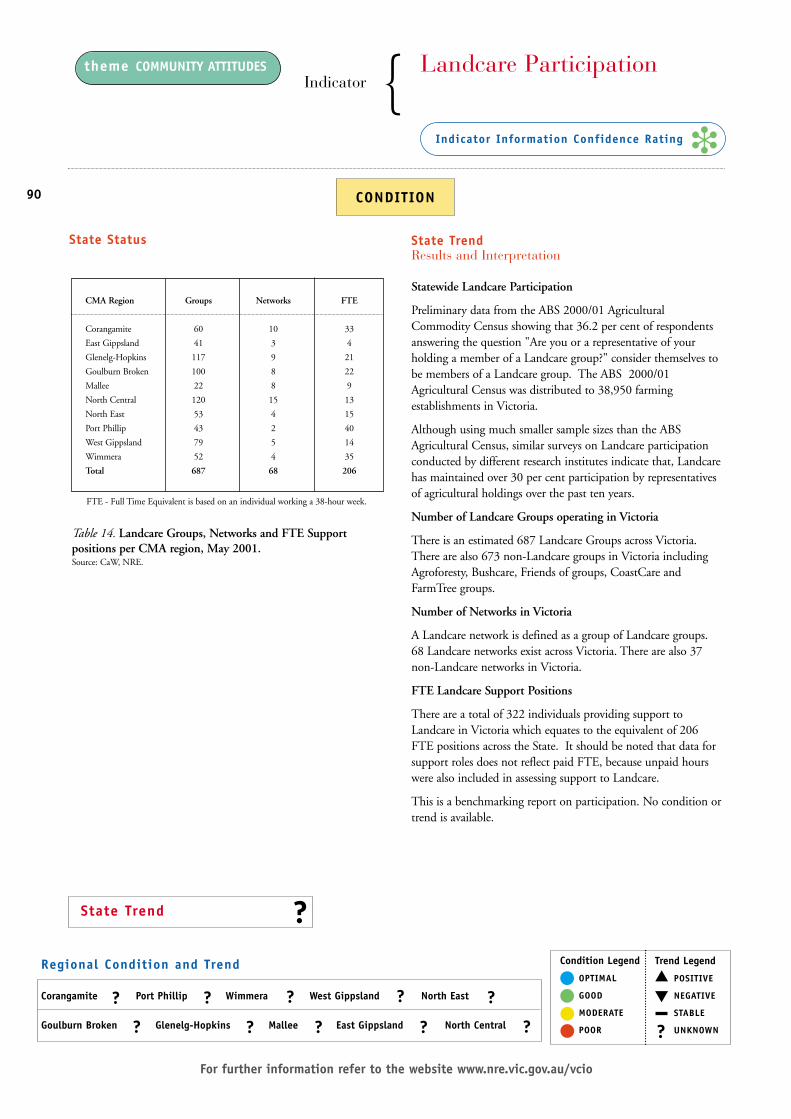
State Status
90
For further information refer to the website www.nre.vic.gov.au/vcio
State TrendResults and Interpretation
Statewide Landcare Participation
Preliminary data from the ABS 2000/01 AgriculturalCommodity Census showing that 36.2 per cent of respondentsanswering the question "Are you or a representative of yourholding a member of a Landcare group?" consider themselves tobe members of a Landcare group. The ABS 2000/01Agricultural Census was distributed to 38,950 farmingestablishments in Victoria.
Although using much smaller sample sizes than the ABSAgricultural Census, similar surveys on Landcare participationconducted by different research institutes indicate that, Landcarehas maintained over 30 per cent participation by representativesof agricultural holdings over the past ten years.
Number of Landcare Groups operating in Victoria
There is an estimated 687 Landcare Groups across Victoria.There are also 673 non-Landcare groups in Victoria includingAgroforesty, Bushcare, Friends of groups, CoastCare andFarmTree groups.
Number of Networks in Victoria
A Landcare network is defined as a group of Landcare groups.68 Landcare networks exist across Victoria. There are also 37non-Landcare networks in Victoria.
FTE Landcare Support Positions
There are a total of 322 individuals providing support toLandcare in Victoria which equates to the equivalent of 206FTE positions across the State. It should be noted that data forsupport roles does not reflect paid FTE, because unpaid hourswere also included in assessing support to Landcare.
This is a benchmarking report on participation. No condition ortrend is available.
theme COMMUNITY ATTITUDES Landcare Participation
CONDITION
❉Indicator Information Confidence Rating
Indicator {
Regional Condition and Trend
Corangamite Port Phillip Wimmera West Gippsland North East
Goulburn Broken Glenelg-Hopkins Mallee East Gippsland North Central
State Trend
?
?
?
?
? ? ? ?
?
Condition Legend
OPTIMAL
GOOD
MODERATE
POOR
Trend Legend
POSITIVE
NEGATIVE
STABLE
UNKNOWN
▲
▼
?
? ?
CMA Region Groups Networks FTE
Corangamite 60 10 33
East Gippsland 41 3 4
Glenelg-Hopkins 117 9 21
Goulburn Broken 100 8 22
Mallee 22 8 9
North Central 120 15 13
North East 53 4 15
Port Phillip 43 2 40
West Gippsland 79 5 14
Wimmera 52 4 35
Total 687 68 206
Table 14. Landcare Groups, Networks and FTE Supportpositions per CMA region, May 2001.Source: CaW, NRE.
FTE - Full Time Equivalent is based on an individual working a 38-hour week.

Regional Case Study
South Gippsland Landcare Network
Key community members representing five Landcare groups in1995 formed the South Gippsland Landcare Network.Motivation for the five groups to form a network came from theLandcare groups’ desire to improve communication about landmanagement issues groups were facing. Today, there are 32Landcare groups from the Westernport (Port Phillip CaLP)region and the West Gippsland CMA region that form theSouth Gippsland Landcare Network. The Network hasapproximately 1,400 members and is managed by communitymembers, maintaining a grassroots approach.
The Network publishes a widely circulated newsletter andemploys 6 staff, including a Landcare Network Coordinator andproject support staff. The Network is successful in continuallyattracting more Landcare groups and together, attracting grantsand corporate sponsorship for implementing regional andstrategic projects. Examples of South Gippsland LandcareNetwork’s primary ongoing activities are the Hills to Ocean(H2O) project and a community pest plants and animal controlproject that promotes community awareness and coordinatedcontrol programs. Partnerships between Local Government andregional resource management agencies are recognised as part ofthe success in contributing to South Gippsland LandcareNetwork’s continued growth and development.
Contact: Joanne Greenwood, [email protected]
Case Study information from Emma Bennett, [email protected]
91
The health of our catchments > a Victorian report card
MANAGEMENT RESPONSE
State Management Response
"Healthy Landscapes – Sustainable Communities: Victorian Action Plan for Second GenerationLandcare"42 launched on 17th May 2002. Establishmentof regional Landcare coordinator positions across allCMA regions. Establishment of a Statewide Landcareposition to provide leadership of the regional Landcarecoordinators.
To be developed through implementation of "Healthy Landscapes – Sustainable Communities".
2002/03 Second Generation Landcare Grants andLandcare Program funded $5.2 million. Additional $1.5million funding for implementation of the VictorianAction Plan for Second Generation Landcare.
Ongoing monitoring and evaluation to be developed in conjunction with implementation of "Healthy Landscapes – Sustainable Communities".
S
me
C
Pm
Regional Management Regional Action ofResponse Implementation Plan
Corangamite CMA yes yes yes yesNorth East CMA yes yes yes yesMallee CMA yes yes yes yesNorth Central CMA yes yes yes yesPort Phillip CaLP yes yes yes yesGoulburn Broken CMA yes yes yes yesGlenelg-Hopkins CMA yes yes yes yesEast Gippsland CMA yes yes yes yesWest Gippsland CMA yes yes yes yesWimmera CMA yes yes yes yes
meCPm
Indicator Definition Landcare participation (Baseline reporting of Landcare data). The Landcare movement encapsulatesnetworks of voluntary community groups, individuals and organisations who are generally concerned about Landcare and subscribe to abroad Landcare ethic. The Victorian State Government provides support to the Landcare community through the Landcare Program andSecond Generation Landcare Grants. Landcare underwent a review by the Ministerially appointed Second Generation LandcareTaskforce at the end of the Decade of Landcare (1990 – 2000). Baseline data on Landcare was collected from CMAs, the ABS andthrough NRE research to inform the Taskforce in developing recommendations for strategic policy directions and actions for Landcareinto the future. Rationale Collection of baseline data on participation of Victorians in Landcare and support for Landcare groups wasconducted in 2001 to inform policy directions outlined in "Healthy Landscapes – Sustainable Communities: Victorian Action Plan forSecond Generation Landcare" and to develop an appropriate indicator for monitoring Landcare in the future.

92
4.1 Overview of indicator condition and trendresults
Theme - Changing socio-economic landscapes
Geography, climate, settlement patterns and policies haveinfluenced the demographics of agriculture. Victoria has asignificantly higher percentage of small farms, both in terms ofarea and gross value of product. There has been a markedchange in the role played by agriculture in the rural landscapewith a continuous deterioration in the terms of trade, theconsequent fall in agricultural employment and the increasingaverage age of farmers. The size of farms, together with the highratio of land value to production, means that it is difficult forfarmers to increase productivity to meet the decline in terms oftrade. In many areas, this pressure coupled with the increasingage of farmers may change traditional inter-generational transferof land ownership.
Theme - Biodiversity
The nature and pattern of European settlement, reflectinggeography and climate, has resulted in clearing of 70 per cent ofnative vegetation. Of the remaining 30 per cent, 1.1 millionhectares are found on private land and we continue to lose some2,500 hectares per annum. 23 native animals and 48 nativeplants are presumed to no longer occur in the State. 152vertebrate species and 721 plant species are consideredendangered or vulnerable. Pressures on biodiversity result fromfragmentation and continued degradation of habitat throughprocesses such as overgrazing, introduced predators, herbivoresand weeds, altered fire and water regimes, salinity, climatechange, habitat disturbance and loss.
The State’s Biodiversity Strategy 1997 and Native VegetationManagement Framework 2002 make a serious attempt to reversethis but, overall, the condition of biodiversity is consideredmoderate to poor. Trends at this stage require further analysis.
Theme - Rivers, Wetlands and Estuaries
The Index of Stream Condition provides an integratedassessment of stream condition and reveals that, while 22 percent of river length is in good to excellent condition, 46 per centof river basins have less than 10 per cent of stream length in
good to excellent condition. In respect of water quality, mostindicators were stable with the strongest trend a decline in pHin the north east of the State. Conductivity increased in thenorth and west of the State and nitrogen increased in waterwayswithin the Corangamite and Glenelg-Hopkins regions. The dryconditions of the past five years have meant that flow has beenminimal in some areas. Estuaries have come under increasingpressure, especially in the west of the State.
Government support of the Victorian River Health Strategy andrelated Streamflow Management and Nutrient Plans address keyissues in rivers, wetlands and will impact on estuaries.Completion of the Bulk Entitlement process and the Water Act(Irrigation Farms Dams) amendment will have a major positiveimpact on protection and enhancement of environmental flows,however further investment will be required to restoreenvironmental flows in some stressed rivers.
Theme - Managing Water Resources
Victoria’s surface water allocation is 92 per cent of sustainableyield and in some areas exceeds sustainable yield, puttingpressure on flows required to maintain ecological integrity.Irrigation accounts for 77 per cent of water use with 8 per centfor urban use in Melbourne. Growth in urban waterconsumption has fallen, but increased conservation measureswill be required to provide a sustainable water supply forprojected urban growth.
Demand for groundwater is increasing as surface water suppliesare fully allocated in many regions. Groundwater SupplyProtection Areas have been established and GroundwaterManagement Plans are being developed under the Water Act1989 to provide for sustainable use.
In regulated systems, under the Water Act, Bulk Entitlementsclearly define existing rights to water and StreamflowManagement Plans are being developed to define rights onunregulated streams. Recent amendments to the Water Actprovide for control of harvesting in the upper catchments.Overall, the management tools are in place to ensure sustainableuse of the State’s water resources but continued support forwater use efficiency measures will be required. Return of flow tothe Snowy River signals the need for similar actions elsewhere inthe State to ensure sustainable water resources management.
The health of our catchments > a Victorian report card
OVERALL RESULTS AND FUTURE ISSUES FOR CONDITION AND MANAGEMENT
FOUR

93
Theme - Managing Land
Dryland salinity continues to pose a real threat to agriculturalland. Between 8 and 18 per cent of agricultural land isconsidered at high risk and 47 per cent is in the moderate riskcategory. Land management practices, including cropping andgrazing, are accelerating salinity processes on agricultural land.The State’s Salinity Management Strategy, 2000 proposes actionsthat require a quantum change in land use. The National ActionPlan for Salinity and Water Quality will strategically addresssalinity where major economic, social and environmental assetsare threatened.
Increasing soil acidity is affecting the productivity of 23 per centof agricultural land and, with current land managementpractices and rates of acidification, the area is expected to doublewithin the next 50 years. Although lime application hasincreased it is still only 12 per cent per annum of that required.
Water erosion threatens susceptible soils and current landmanagement practices are accelerating processes on 21 per centof agricultural land. Soil structure decline and decreasing soilhealth are also evident but insufficient data has been collected tomake any assessment on a Statewide basis. There is a clear needfor an integrated and comprehensive soil management program.
Theme - Managing Pest Plants and Animals
The impact of rabbits has decreased markedly, with 55 per centof the State showing no signs of rabbit activity and only 3 percent with population levels that pose an immediate threat.Although there has been a 100 per cent increase in infestationsof State Prohibited weeds since 1997, these incursions arecurrently under control. In the future, more comprehensivedata is required on other declared noxious weeds to make aninformed assessment of weed condition and managementresponses across the State.
Theme - Greenhouse Gas Emissions and Climate Change
Victoria generated 21.3 per cent of Australia’s emissions in 1999,growing 15.9 per cent in the previous decade. Climate changemodels project temperature increases of between 0.3oC and1.6oC by 2030, with more hot summer days and less rainfallacross the State. Extreme rainfall events will become moreintense and frequent and seasonal changes may impact onrunoff and the sustainable yield of water catchments.
Theme - Community attitudes and participation in naturalresource management
Little comparative data has been collected to estimate trends buta 2001 survey across CMA regions indicated that water qualitywas considered to be the leading NRM issue, followed bysalinity management, protecting waterways, wetlands andenvironmental flows. Unprompted awareness of the CatchmentManagement Authorities was about the same as the local waterboard with prompted awareness at 54 per cent. Those morelikely to be aware of CMAs are farmers or people living in ruralareas and between 30–69 years old.
Preliminary data from the ABS 2000-01 AgriculturalCommodity Census shows that 36.2 per cent of respondentsanswering the question "Are you or a representative of yourholding a member of a Landcare group?" consider themselves tobe members of a Landcare group.
4.2 Overview of the statewide managementresponses
The continued evolution in available information and methodsfor managing environmental systems has led to a series of verypositive initiatives at a State and regional level.
The scale of environmental issues, coupled with clearly finitecommunity and financial resources to address issues, has resultedin the development of a number of strategies and frameworks tosupport decision making, priority setting and efficient, effectiveinvestment.
The State Government, through NRE and the EPA, has focusedsignificant effort over the last five years to develop a range ofstrategies that set priorities and strategic direction for naturalresource management activities at a State and regional level.
The health of our catchments > a Victorian report card

94
More recently completed initiatives include:
> the State Biodiversity Strategy 1997
> the draft SEPP Waters of Victoria 2002
> the Victorian River Health Strategy 2002
> the Victorian Pest Management Framework 2002
> the Victorian Landcare Action Plan 2002
> the Victorian Coastal Strategy 2002
> the Victorian Vegetation Management Framework 2002
> the Victorian Irrigation Farm Dams Legislation 2002.
In all cases documents have been developed to help guideregional programs and activities. Monitoring, evaluation andreporting programs are included, providing a broad frameworkfor linking regional condition reporting processes to Statereporting processes.
Reporting the outcomes of these initiatives requires furthercoordination and a clear commitment to monitoring, evaluationand reporting. This will position Victoria as a leader nationallyin environmental accountability.
The State will be well placed to employ successful managementprograms that adapt and change as knowledge increases,providing unambiguous information to individual landmanagers and the broader community.
The State, with impetus from the National Action Plan forSalinity and Water Quality, is developing evaluation andmonitoring strategies, research and development strategies andimportantly is also looking at social and community capacityissues.
There remain gaps in strategic planning at a State level. Fromthe indicators we can ascertain a weakness in the area of soil andsoil management. The future for our soils does not lookoptimistic and this needs to be addressed at a Statewide level.Over half the world’s biomass is found underground. From abiodiversity and agricultural production perspective soil health isfundamental.
The plethora of information regarding management of resourcesthat will be available over the next five years provides reason foroptimism. There remains a need for an overarchingmanagement strategy for the State that sets clear managementand investment priorities over the long-term.
4.3 Overview of the regional managementresponses
Underpinning resource management decisions at the regionallevel are the Regional Catchment Strategies (RCS). Thesedocuments, compiled and coordinated by the CMAs, based oncommunity input, set the strategic directions and priorities fornatural resource management at the local level.
The RCS documents are generally strategic, but are
underpinned by ‘Action’ or ‘Implementation’ plans with clear onground programs and activities. These supporting plans providethe implementation detail for the efficient and cost effectiveinvestment in resource management at the local level.
The RCS are currently under review with all of the ten CMAregions to have completed their new documents by June 2003.The documents are expected to make clear provisions for on-going investment in environmental monitoring, evaluation andreporting with clear targets and performance measures. Thereare opportunities to strengthen links between regional and Stateevaluation and reporting processes.
The RCS development process represents an extraordinarycollaborative effort between community representatives,government, community groups and other key stakeholders toforge a preferred future for each region. These are localstrategies for local futures.
Increasingly, developing these strategies requires sophisticatedprocesses for consultation, data collection, analysis and prioritysetting. The final RCS documents of 2003 will overshadowprevious efforts to produce a comprehensive blueprint for thesustainable management of resources at the regional level.
One clear area of significant future risk across all regions is soilmanagement. The indicators outline only two regions with asoil management strategy and program. At a local level somegood information on soils and soil processes exists. While someregions will pick up elements of soil management in otherprograms the lack of emphasis generally across Victoria is ofconcern.
Across all regions there are knowledge management issues thatneed to be addressed. These occur at an information needs,information use and information dissemination level. These areimportant issues. Regional communities will require access tothe best available information to work through future prioritysetting, resource use planning and management trade-offs.
The health of our catchments > a Victorian report card

95
4.4 Are we making a difference?
The simple answer is - Yes, but not enough!
Victoria is the most densely settled State in Australia; a result ofgeography, climate and soldier settlement programs after twoworld wars. As a consequence, our natural resources are underpressure and, in many cases, will not be passed on to the nextgeneration in good condition. As outlined earlier in thischapter, the Government has in place many strategies, plans andprograms to encourage sustainable use of resources. Most ofthese, if given adequate resources, will make a significant impacton the health of our catchments.
Under current resourcing and management paradigms ourefforts to protect and sustainably manage natural capital are notkeeping pace with the breadth of degradation symptomsdepreciating the natural capital base. One of the key hindrancesto community and government efforts in this area is knowledge.In compiling this report we have found it difficult to answerquestions on the condition of the State’s resource base. We havea general picture of decline at projected massive scale but canmake few uncontestable quantifiable statements aboutcondition. This situation must improve.
New knowledge is helping and we have made great strides in thelast five years. This knowledge coupled with experience andefforts over the past two decades tell us much about what weneed to do. It is clear that best management practices will notbe enough to ensure sustainable use of the land and water inmany parts of the State. Major change will need to be made inthe management of many areas to ensure ecosystem functioncontinues and offset to the impact of degradation symptomssuch as dryland salinity and soil acidity.
4.5 Looking ahead to an uncertain 2050
The primary goal of catchment management is:
To ensure ecologically sustainable development of our naturalresource based industries, the protection of land and waterresources and the conservation of natural and cultural heritage.1
The National Strategy for Ecologically SustainableDevelopment, signed by the Commonwealth, States andTerritories, articulates the goal of ecologically sustainabledevelopment as:
"Development that improves the total quality of life, both now and in the future, in a way that maintains the ecological processes on which life depends."44
The core principles underpinning this definition are:
> To enhance individual and community well-being andwelfare by following a path of economic development thatsafeguards the welfare of future generations
> To provide for equity within and between generations
> To protect biological diversity and maintain essentialecological processes and life support systems. 44
The remainder of this chapter is dedicated to discussion onissues and trends to the year 2050. Based in part oninformation provided by the indicator reports in Chapter 3, thefollowing discussion looks at some likely key threats and impactsthat will undermine our ability to service the above definition ofecologically sustainable development in Victoria.
Some long-term social / demographic trends
The impact of social, economic and environmental pressuresand opportunities is being played out already, with significantrestructuring occurring across Victoria.
The area of land used for agriculture in Victoria has declined froma peak in the 1940s when 16.7 million hectares was used foragriculture, to 14.2 million hectares (down 15 per cent) by 1986.45
Recent data suggests that the area of farmland in Victoria couldnow be down to 12.7 million hectares, a decline of 24 per centsince the 1940 high point.45 As previously noted, over the lastforty years, the number of farms in Australia has halved, withmedium-sized enterprises recording the greatest decline.Currently farms in the State number around 37,000. 45
The Victorian community is becoming increasingly urban. In1920 there were 20 Victorians for every farm in the state. By1970, the ratio had risen to over 50:1. Today, the ratio is 175:1Victorians for every farm in the State.
The health of our catchments > a Victorian report card

96
Modelling suggests that over the next two decades, the numberof Australian farmers will decline by somewhere between 40 and60 per cent. The potential future adjustment suggests there willbe 400 Victorians for every farm in the State by 2021.46
There will be accelerated depopulation of dryland farming areasover the next 20 years. Many mid-size broadacre farms will beamalgamated into larger enterprises. Technology and marketforces will dictate how large properties can become.
The future landscape will see the further emergence of a smallnumber of large farms responsible for the bulk of farmproduction, and a large number of small farms supported by off-farm income on the periphery of regional centres, Melbourneand along the coast.
Where returns from farming are greatest, such as intensivehorticulture, dryland dairy, irrigation and some cropping areas,younger farmers will be attracted. Young farmers with new ideasand education will be important to future sustainable resourcemanagement. The ABS notes that concern for environmentalissues increases with education.17
In less profitable dryland areas, the age profile is likely to remainat 50 or older. This is important as recent research suggestsolder farmers have difficulty pursuing the adoption of bestmanagement practices.47
The new generation of plans (salinity plans, nutrient plans,biodiversity action plans and vegetation plans) in preparation,are coming to grips with the scale of landscape and social changeunderway. In seeking to address complex interrelateddegradation issues some plans have identified that the extent ofprotection and remediation activities required is beyond thescope of traditional, voluntary group activity.
In areas where depopulation continues, the removal of socialinfrastructure and economic viability will further undermine theability to manage environmental issues through traditional localcommunity efforts alone.
Moving against the above trends, are regional centres likeWodonga, Swan Hill, Shepparton and Mildura. These areashave experienced an increase in population due to improvedproduction and related food processing.
Similarly, coastal and ‘rural amenity’ areas within commutingdistance to Melbourne and major regional centres areexperiencing population growth. Increasingly, these landownersare not agricultural producers in the traditional sense and have ahigh proportion of off-farm income. The influx of new peopleto such areas is raising land prices, reducing the ability oftraditional farmers to expand enterprises and remaincompetitive.
Increasing urbanisation coupled with rural depopulation anddeclining social infrastructure will over time reduce the impactof the rural vote. Ultimately, if such trends continue, this willerode the democratic ability of rural communities to controltheir own futures.
Sustainability – producers and consumers
Increasing urban economic prosperity and lifestyle opportunitiesprovide opportunities and threats to the natural environment.On one hand these consumers have increasing capacity to paythe true cost of sustainable food production, whilst on the otherhand they continue to place pressure on ecosystems andenvironmental assets across the State. Eighty per cent ofVictorians live in or around major urban centres. The linkbetween consumption and waste generated by urban areas andthe impacts on surrounding ecosystems often remainsunrecognised.
Humans have the capacity to transform and use materials atevery level. The disturbance and waste flow from materialextraction, transformation and use has a major environmentalimpact. The World Resources Institute suggests all materialflows have environmental consequences and all environmentalimpacts are related to material flows.10
Material flow assessment (presented in tonnes per person peryear) outlines how resource use (e.g energy, water, produce etc)affects the capacity of the environment to continue to providematerials and absorb waste from them.10
In 1991 Australians, at around 175 tonnes per person per year,had a material intensity flow 90 tonnes more than the UnitedStates, 115 tonnes more than Germany and around 140 tonnesmore than Japan and the Netherlands.10
In the mid 1990s Australia was the second largest producer ofwaste amongst OECD countries. In 1996-97, 212 milliontonnes of solid waste was buried in landfill.17
There will be increasing population and (relative) economicgrowth in major urban centres, with increasing consumptionand waste (material flow) pressures distributed to ruralcommunities and regional ecosystems.
Another measure of environmental impact is ‘Ecological or Eco-footprint’. Eco-footprint describes the impact of a country’sconsumption on the environment by showing the area of landrequired to sustain that lifestyle. The tool has been applied tocountries, corporations and individuals. Generally, the moreelaborate the lifestyle the larger the footprint.17
The health of our catchments > a Victorian report card
97
One estimate suggest Australians, at 7.4 hectares per person,rank fifth highest in the world for area required to support thelifestyle of each person; USA is highest at 9.8 hectares, while theworld average is 2.4 hectares.17 Australians seem to consume farbeyond their earth share.
There are 4.6 million people living in Victoria. If eachindividual requires 7.4 hectares, in total we require 34,040,000hectares of productive land to support our current lifestyle. Theactual size of the State is only 22,755,000 hectares.
The above extrapolation, although laced with contestableassumptions, does however provide a context for consideringhow sustainable our current practices are and the future impacton our natural capital. We are already consuming more than issustainably available and our current trajectory reinforces thistrend.
Some key environmental pressures and trends
The VCMC overview of Chapter 3 outlines that if we continueas we are the future scale of environmental degradation inVictoria is likely to be enormous and increasingly irreversible.
The following discussion offers projections on the future impactacross the State of four current topical issues: salinity, soil acidity,native biodiversity decline and water management.
> Biodiversity
Over 70 per cent of Victoria’s native vegetation has been clearedand 46 species of plants and animals are presumed extinct.Despite being the cornerstone of our natural capital, biodiversityand ecosystem function, fail to be valued by both the generalcommunity and some individual land managers.
There is considerable work to be done to communicate thevalue of biodiversity and ecosystems to society.
Removal of biodiversity and subsequent reduced ecosystemfunction, results in a range of systemic degradation symptoms.
Complex interrelated systems seem more difficult tocommunicate than segmented simplistic analysis of degradationsymptoms. Problems such as weeds, water quality decline, soilfertility decline and dryland salinity are all symptoms resultingfrom biodiversity decline and ecosystem failure.
Continuing reduction in the size, quality and diversity ofremaining habitats and increased habitat fragmentation willfurther reduce ecosystem function.
The future impacts are difficult to model, but a continuingreduction in the diversity of large fauna we currently know andrecognise will be one of the more overt symptoms. The ongoingdecline in species will be extreme. It has been predicted that
Australia will lose half its terrestrial bird species in the nextcentury if the status quo continues. Similar projections arepossible for other fauna.48
Under current management regimes, and in their present extentand condition, all CMA regions, with the exception of EastGippsland will suffer further significant losses by 2050.
In the extensively cleared wheat-sheep zone which coversnearly 20 per cent of Australia about 50 per cent of thebird species will have disappeared by 2050. 49
Dr. Denis Saunders, CSIRO on Radio National Background Briefing 2002
Conversely, as ecosystem processes and landscapes are furthersimplified and become more homogeneous, there will becontinuing population explosions. The most adaptableindigenous fauna species, such as kangaroos, will continue toextend their range and impact.
The impact of declining diversity and ecosystem function oncommonly overlooked insect fauna, non-flowering plants andmicroorganisms is also difficult to predict. It is recognised thatthis ‘unseen’ flora and fauna play a fundamental role inecosystems. For example pollination of crops by insects hasbeen valued at $1.2 billion per year. 49
Ironically, it is not the big and beautiful creatures but theugly and less dramatic ones we need the most.4
Important attempts to protect and enhance ecosystems onpublic land, will limit the utilisation of public resources forindividual benefits. The broader community benefits ofprotecting services provided by threatened ecosystems on publicland often outweigh rudimentary returns provided throughindividual utilisation.
Such efforts to protect public land may result in extra pressureon remaining under-protected areas and /or forests on privateland. Alternative resource sources will be required, supported byproper planning, investment and community education.
More than 60 per cent of native vegetation remaining on privateland is considered to support threatened ecologicalcommunities. Additionally, around 30 per cent of threatenednative species populations occur on private land. Suchremaining ecological communities and systems are currently noteconomically valued, in a market sense, by the broadercommunity.
With market failure some landholders neglect to exerciseappropriate duty of care, as there is little recognised value inremnant biodiversity and ecosystem services. The resultingmanagement regime continues to threaten remnant ecologicalcommunities, biodiversity and ecosystem services.
The health of our catchments > a Victorian report card

> Soil Acidity
Currently up to three million hectares of Victoria’s agriculturalland is estimated to be suffering losses in productivity due to soilacidity. Without additional intervention by 2050, the problemis estimated to extend to six million hectares severely limitingtraditional agricultural production activities. 36
> Water
Increasingly, access to water will be identified by individual landmanagers as the major resource management issue of the next50 years. Already many river reaches across the State areconsidered to be stressed by inadequate environmental flows.
The dominant driver of water demand nationally is irrigatedagriculture. A 1999 study by the Australian Academy ofTechnology Science and Engineering and the Institute ofEngineers, indicated that in the absence of resource constraintsthe water needs of industry nationally, will outstrip wateravailability by 2020-21.52
Urban and industrial uses account for 17 per cent of the State’swater use.53 Under current trends, maximum utilisation of theexisting annual water volume available to Melbourne will bereached in 2012. Other options, involving more conservativewater use and increasing capacity from the current urbansystem, will accommodate utilisation needs until 2060.53
Melbourne sources its water from the Yarra catchment, theThompson catchment (Gippsland) and the Goulburncatchment (north central Victoria). Increases in the urbanpopulation will place further pressure on access to waterresources.
In September 2002, the State Government announced a dryseasons assistance package of $2.6 million dollars for parts of theMallee and northern Victoria. At the same time in Melbourne,daily water consumption was the highest since 1995, despiteurban storages only being 2.6 per cent above the trigger level forwater restrictions.54
Although only accounting for a small percentage of the State’swater use, in the coming decades the consumptive andrecreational needs and aspirations of the city will clash with theneeds of regional Victoria and the environment.
98
> Dryland Salinity
A National Land and Water Audit projection estimates that thearea at risk of becoming severely salt affected in 2050 is around3 million hectares (or 13 per cent of the State).35 Currentlyaround 260,000 hectares are affected.32 The best estimate ofdamage to infrastructure in non-metropolitan Victoria fromsalinity and rising water tables is $12.2 million per year. AcrossAustralia it is estimated at around $100 million.35 Up to 800species of threatened native biodiversity may be affected bysalinity.
The State Government’s Salinity Management Frameworksuggests "research indicates that many best practice agriculturalsystems in the grazing and cropping industries can not reducethe amount of water leaking into the groundwater system incomparison to native vegetation."32
The efforts of government and communities has resulted inaround 86,000 hectares of native vegetation being re-establishedin the last ten years (this figure does not include private forestryefforts).50 Therefore, excluding water bodies, urban areas andpublic land, as a community we have in ten years revegetated 0.6percent of the state at an annual rate of 0.06 per cent per year.
Re-establishment of indigenous vegetation remains a keymanagement tool for dryland salinity. NRE suggests thatagricultural land use will need to change on a massive scale, withrevegetation of over 60 per cent of the landscape in somecatchments.51 The 86,000 hectares currently established servicea range of environmental protection needs, including salinitybut are not dedicated to salinity control alone.
At the re-establishment rate of 0.06 per cent per year, by 2050,2.9 per cent of private land in the State would be re-establishedwith vegetation. As noted the area suffering from severe salinitycould well extend across 13 per cent of Victoria (this does notinclude moderately affected areas).
The health of our catchments > a Victorian report card

99
The urban price for water is based upon a fixed service chargeand a volumetric charge.53 In December 2000, therepresentative charge for consumption of a megalitre of water inMelbourne was $690.55
Seventy-seven per cent of the State’s water is used by theagricultural sector. The price of this water varies considerablyfrom one irrigation region to the next, due in part to differentscales and sophistication of delivery infrastructure. At thehigher end of the spectrum for cost was the Werribee IrrigationDistrict at $111.60 per megalitre (December 2000).55
Discussion regarding urban and rural water prices must takeinto account that urban infrastructure is significantly moresophisticated (with much higher maintenance and replacementcosts) and the quality of water delivered for use is much higher.The comparison above reflects the purchasing power of highervalue water users.
Increasingly, water will be distributed through the market toserve ‘higher value’ uses. The environment and environmentalflows will be included as a higher value use along with highvalue agriculture, recreation and human consumption.Management of the water resource will further correlate surfaceand groundwater as elements of the same hydrologic system.
Scarcity and supply costs will continue to increase prices forwater, further squeezing less profitable sectors and smallerirrigation enterprises. The true value of water will beappropriately reflected by price. Some in the agriculture andwater industry expect the average price of water per megalitre totriple by 2020. In this future scenario, returns from irrigatingbroadacre pasture are unlikely to be competitive.
In the search for efficiencies and more water there will be ageneral move to bigger, more efficient irrigation enterprises. Insome cases this will involve an amalgamation of smallerproperties.
Alternatively, due to investment in previously costly irrigationinfrastructure, the inflated price of smaller properties may limitbuy-up by bigger corporations. This will create pressure for thedevelopment of new irrigation schemes and areas.
As water availability decreases, there will be increasing pressurefrom regional producers to use lower quality water. Whileoffering some short-term relief, there will be significant risks.For example, pumping saline water onto already sodic soilswould quickly accelerate salinity and soil fertility problems.
The availability of water will also be compounded by climatechange. The possibilities of reduced rainfall could significantlyreduce water flow in hydrologic systems, with an increase indrought patterns. A recent report from CSIRO states:
Increased drought occurrence across the State was also simulated by most of the climate models. However, there are strong variations across the models in terms of seasonal dependency. Seven of the nine climate models show increases in drought through the spring-summer period. The drought frequency more than doubles in some simulations.56
Some key economic pressures and trends to 2020
Victoria covers 22,755,000 hectares. Agriculture, at 56 per cent,is the major land use across the State. For this reason those withan eye on resource management often focus on rural landscapes.
In recent years elements of the agricultural sector havecontinued to grow strongly, making a significant economiccontribution to Victoria.
> In 2002, the agricultural sector is responsible for 11 per centof Victoria’s gross State product, and 33 per cent of all Stateexports.12
> The production, processing and marketing of food employs205,000 people, or 9.7 per cent of total Victorianemployment. In rural and regional Victoria, the sectoraccounts for 21 per cent of all jobs.12
> Over the last ten years the value of agriculture productionhas increased from $5.2 billion in 1990 to $6.8 billion in2000.12
> Over the same period, exports have risen from $3 billion to $7.6 billion at an average growth rate of 9.9 per cent.12
Despite these important positive agricultural results there aretwo points worth highlighting. Firstly, over the long-term thesectors generally benefiting are those that have the financialability to adapt and readily access global markets. The benefitsare therefore not spread evenly across agricultural industries andVictorian farms.
Secondly, the economic returns outlined above make noprovision for the accumulating costs associated with thedegradation of natural capital.
In large areas of the State, land use and management does notmatch land capability. Although returns from these areascontribute to positive economic figures, there is an on-goingdetrimental environmental impact. Ultimately, this isdepreciating the natural capital base, limiting opportunities forcurrent and future generations.
The environmental repair bill Australia faces is enormous.The Prime Minister has been told it’s $65 billion and that’sjust to try to fix salinity.49
Radio National Background Briefing, Sept 2002.
The health of our catchments > a Victorian report card

100
As an example of environmental pressures likely to undermine the economic potential of traditional agriculture, we offer the followingdiscussion on the projected extent of dryland salinity and soil acidity.
The current land use map of Victoria (see Figure 68) shows that around 64 per cent of the State is freehold land with agricultureoccupying about 56 per cent of the total area of the State (or 86 per cent of freehold land).
The map provided in Figure 69 is drawn from the National Land and Water Resources Audit35 ‘worst case’ scenario of future salinityrisk in Victoria. The land shown in black on the map is where the watertable is forecast to be 0-2 metres below surface level (areasdeemed to be at severe salinity risk).
Analysis of this area indicates that just under 3.1 million hectares of land would be affected.
Under this scenario the area available for agricultural use is reduced by around 21 per cent, to a total area of 11 million hectares.
The health of our catchments > a Victorian report card
Figure 68. Victorian land use and tenure. Source: NRE
Figure 69. Salinity risk in Victoria 2050. Source: NLWRA, 2000.35

101
The health of our catchments > a Victorian report card
In addition to salinity, acidification is an emerging problem in the Victorian landscape. The map below (Figure 70) displays a projectionof the area at risk of severe acidification to 2050.36
Figure 70. Soil pH risk 2050. Source: NRE.36
Although the above example is a simple extrapolation andunlikely to unfold in this nature, future implications for bothurban and rural communities of employing an unsustainablemanagement paradigm will nevertheless be profound.
Agriculture in the future will provide enormous opportunitiesfor some. Restructuring will continue for others. In addition topressure from depreciating natural capital, three key forcesshaping the future of Victorian agriculture have been identified.These include globalisation, consumer expectations andcommunity concern for the environment.12
Globalisation and international competition have driven a long-term decline in the terms of trade for Australian farm businesses.As noted in Chapter 3, the ratio of prices paid to produce goodscompared with prices received for goods, by Australian farmers,has fallen by seventy per cent over the past 50 years.
The Rural Research Industry and Development Corporationalso notes that quality assurance and environmentalmanagement issues loom large. It maintains that agriculture inAustralia will be under further pressure to: give credence to itsclean and green image; maintain food safety standards;demonstrate compliance with accredited environmentalmanagement systems; and service the environmentalrequirements of supermarkets and other retailers.57
This projection suggests that as much as 5.3 million hectares ofprivate land would be severely acidified by 2050. This wouldaffect 37 per cent of the area available for agriculture in theState.
In considering these worst case scenarios together, with salinityaffecting 21 per cent of the State and acidification affecting 37per cent, the land affected by either or both these degradationissues is estimated to be at least 40 per cent (5,646,000 hectares)of the area available for agriculture in Victoria.
Without remediation the most severely saline or acidiclandscapes will stop production altogether. In other affectedareas, these issues will limit production resulting in significantand ongoing remediation costs.
To provide a context for the impact of degradation problemslike these on the broader population we return again to theecological footprint model.
Applying the national population growth rate for 2000 of 1.3per cent per annum (59,800 pa), by 2050, the State will behome to around 7,590,000 people. If each individual stillrequires 7.4 hectares to support a lifestyle, we will require56,166,000 hectares.
Overlaying a worst case scenario for extent of acidity and salinityover this period, the area of the agricultural landscapeuninhibited by these degradation issues and available to producefood, fibre and ecosystem services will have decreased to8,469,000 hectares.

102
The health of our catchments > a Victorian report card
At the 2002 World Sustainability Conference in Johannesburg,and in discussion with the World Trade Organisation, someEuropean Union countries are arguing that environmentaldegradation is a hidden subsidy on exports. Environmentaltrade embargos, although unlikely, have been discussed.49
I think it’s much closer than a lot of people think. It’ssomething that’s more likely to arise out of the marketthan international trade rules. All it would need is acompany of large size somewhere in the world to say - I’msorry we won’t buy from Australia anymore, simply becausewe do not like the environmental standards you’resetting.49
Dr. Mike Young, CSIRO on Radio National Background Briefing, Sept. 2002.
Analysis undertaken for the National Land and Water ResourcesAudit reveals that 80 per cent of profits at full equity comesfrom only four million hectares - less than one per cent of thearea of land used for agricultural in Australia.58
In Victoria, the main area to fall within this relatively smallwindow of high returns is the Northern Irrigation Region. Theirrigation region only covers around four per cent of the State’sagricultural land, but is responsible for nearly 30 per cent of theState’s gross value of agricultural production.58
Opportunities for growth will remain in those agriculturalsectors that are adaptable, efficient, clean and sustainable, thatcan increase production on a reduced area, using less water.
Other current profitable agricultural enterprises occur in thedairy regions of Gippsland, the Western Districts and parts ofthe cropping area of the Wimmera.58
Analysis of profits generated per hectare of Australianagricultural land per year, reveals that areas of central Victoria,the Mallee and western Wimmera made an annual loss for thefive years up to 1996-97.58
It has been estimated that 50 per cent of the economicallysmallest farms could disappear with a minimal impact onVictoria’s net production.
Economic viability and reduced access to funds limits the abilityof many land managers to change management. A reduced
ability to access funding is likely to intensify. Some of Australia’smajor banks are now seeking clear processes to assessenvironmental risk associated with investment in traditionalagriculture.
In areas currently or projected to suffer from degradation issuessuch as salinity and soil degradation, the bank sector may beincreasingly cautious to lend money.
There is a significant and increasing prosperity gap betweenmany rural and urban Victorians. Despite economic success insome key agricultural industries, the majority of benefits fromrecent national economic growth has manifest itself throughincreasing prosperity of major cities.27
We Australians enjoy tremendous natural advantages. Ourcountry is among the most beautiful and resource rich onthe globe. Currently we are experiencing sustainedeconomic growth. Yet the divisions among us – betweenthe haves and the have nots and the city and the country –give cause for concern.
Sir William Deane, Govenor of Australia, Australia Day Address 2000.27
The gap in understanding between urban and rural areas willwiden due to differing values, aspirations and an imbalance ineconomic and social opportunities.

5.1 A VCMC vision
The VCMC offers the following preferred scenario for 2020.
It begins with a 20-year integrated vision and strategy fornatural resource management across the State.
The strategy provides a clear process of community engagement,education and decision-making. Communication of bestavailable scientific information and research underpins collectivedecision-making. Change has not resulted in reactive decisionsmade under pressure, but instead resulted in personal,community and landscape-scale strategies to grasp opportunities.
In 2020 the State is covered with a mosaic of land uses thatmatch capability. The mosaic includes a mix of intensiveagriculture and land now used for farming ecosystem services,supporting rural lifestyles and nature conservation.
Intensive agriculture is thriving in efficient closed systems attargeted, specially planned sites around the State. Agriculture issustainably servicing local and national needs and demands forproduce in international markets, particularly Asia. There islittle notion of waste in industry, with the waste from oneindustry feeding the resource needs of another.
The continued urbanisation of the State has led to an increasingrecognition that there is a credible threat to ecosystems and theservices they supply. Urban communities recognise the impactof consumer preferences and are paying to protect identifiedenvironmental assets. This manifests itself in payment to ruralVictorians for supplying life-sustaining ecosystem services.19
The provision of ecosystem services by rural landholders is nowa major land use across the State. It is the newest form ofprimary production, underpinning the social and economichealth of the State.
By 2020 the mosaic landscape accommodates a 40 per centcoverage of native vegetation. The 20-year strategy has targetedecosystem and native biodiversity asset protection andrestoration works across all asset types, such as waterways,floodplains, grasslands and woodlands, and in key areas thatpresented the best opportunity to rebuild our rural landscapes.At first, the focus was to protect the best remaining ecosystems.Over the last decade we have been able to broaden rehabilitationefforts to other areas of the landscape.
103
The health of our catchments > a Victorian report card
A 2020 VISION FOR CONDITION AND MANAGEMENT
FIVE
The current and projected scale of environmental degradationissues requires a new Statewide response. While resourcingcurrent strategies and implementation of best managementpractice may make some gains, over the long-term, this isunlikely to result in a sustainable outcome for Victoria. Large-scale changes in land use are vital to the future of rurallandscapes.
As discussed in Chapter 4, change will continue. Pursuing thestatus quo will not prepare communities to minimise negativeimpacts, nor grasp fully the positive opportunities provided bychange. The ‘continue as we are’ scenario will not ensure along-term economic and sustainable future for agriculture inVictoria. Important decisions about the future condition andmanagement of the State’s natural resources are required. A newapproach must be developed and strategically implemented overthe coming decades.

Research and new technologies have evolved new agriculturalindustries based on natural systems that complement moretraditional, high value environmentally and economicallysustainable agricultural pursuits.
The mosaic also includes large amenity and lifestyle areas.Typified by commuters with off-farm income, these newlandscapes also incorporate ecosystem service provision andnature conservation at a smaller scale. The quest for knowledgeand technical innovation has driven many to providetechnology-related services and information to surroundingregional centres and communities.
The growth in ecosystem services is a boon for those with atraditional agricultural history in land management. On-goingrehabilitation and management services are in high demand,providing a range of employment and service opportunities.
Similarly, the amenity and ecosystem services dominatedlandscapes are attracting a variety of interstate, international and(importantly) intrastate urban people for relaxation andrecreation. There is a proliferation of farm stay businesses, bedand breakfast and ecotourism providers across the State.
Key sections of the State are presented as ‘wild’ landscapes fortourism. Victoria, with its smaller size, diversity of climate andtopography, offers tourists an enormous range of ecosystems in arelatively compact area.
Landscape management decisions are supported by a vast andimproved knowledge base. Consequently our approach is morebalanced with more intelligent emphasis on information.
Land and water managers have a high level of appreciation forthe values of aquatic ecosystems and there has been a realreduction in the extent and severity of our soil health issues dueto effective land management programs.
By 2020 there exists actual climate data to validate 30 years ofclimate projections. We are in a position to be significantly moreconfident about future projections. The community ability tounderstand and plan for future climate change is greatlyenhanced by regionally specific and multi-sectoral projections.Funding to plan for and invest in adaptation strategies issignificantly enhanced as a result of greater awareness acrossgovernment and the community.
5.2 The case for supporting the vision withecosystem services
A range of approaches have been employed to engender changein land management practices. Overall, the results have notkept pace with continuing systemic degradation. Past andcurrent measures involve policy, regulations, education,volunteerism, prosecution and incentives.
The advent of the community participation model throughLandcare and subsequently the Catchment ManagementAuthorities has been one of the most positive moves to tackleenvironmental degradation and sustainable resource use over thelast two decades.
The VCMC is keen to see this Landcare and communityinvolvement and cost-sharing ethic further infiltrate the urbancommunity and industry sectors. This can be achieved bydeveloping markets for trading in ecosystem services.
Some suggest that government should take the lead throughstrengthening legislation and enforcement efforts to protect theenvironment. Enforcement and compliance work as tools in apackage. They rarely work as a general mechanism for changingbehaviour.
In most cases, the time, cost, legislative complexity and limitedimpact associated with enforcing regulations is easily outweighedby an approach that builds upon the collective goodwill activityof the community.
Our community cohesion is based on goodwill. The most cost-efficient and most effective paradigm should be to support thisgoodwill, rather than focus attention on regulation andenforcement.
Environmental, economic and social pressures are occurring overlarge areas of the landscape, forcing reappraisal by landowners ofwhat they do and how they do it.
Experience in the water sector indicates that one of the bestways to encourage innovation and moves toward sustainableresource use is to send powerful signals to the community thatthe environment matters. There appears to be few morepowerful signals than price.19
104
The health of our catchments > a Victorian report card

105
The health of our catchments > a Victorian report card
The VCMC advocates an extension of market activity to betterreflect the role that ecosystems play and the benefits provided toall Victorians. Services provided by biodiversity and ecosystemsare not consumer optional extras. We all need air, water,pollution mitigation, filtration, biomass production and geneticdiversity to sustain our health, wealth and wellbeing.
The concept of ‘ecosystem services’ provides a complete changein the way we view and manage the landscape. In addition tosustainable agriculture it provides another option to match thecapability of land with a sustainable and benign use.
We need to become rampant ecological nationalists. 59
Andrew Campbell, Executive Director Land and Water Australia, 2002
Will it work? There are existing examples at a State andnational level of resource management programs using markettrading, auctions, taxes and subsidies. In the Bush TenderAuction Trial in Victoria landowners have entered into contracts(at their own tendered price) with the Government to protectremnant biodiversity on private land. The landowner gets paidfor providing this service and the public get the broader benefitsassociated with protection and enhancement of ecosystemservices.
The North East, Wimmera and the Goulburn Broken CMAshave initiated programs to review opportunities for tradingecosystems and biodiversity services on private land. OtherCMAs are looking at placing themselves to benefit from futurecarbon trading. Other recognised schemes include salt disposalcredits and council rate rebates.
Internationally, the topic is more advanced. Water consumers inNew York City are paying people upstream to manage theirforests and agricultural land better. Paying for bettermanagement upstream turns out to be cheaper than cleaning upwater downstream after it has been fouled.19
It has been estimated that there is an US$8 billion dollar savingto the city of New York every year by sourcing water cleanedand purified through natural ecosystems.
New York, Washinton DC and Florida have all found it cheaperto pay for natural filter beds and wetlands to managecontaminated water, rather than create artificial treatmentplants. This recognition of value has helped lead to a trade inwetland credits in the US.60
The credits are issued by Wetland Mitigation Banks tocompanies who restore wetlands. The credits are then sold onto third parties who wish to modify a wetland somewhere. Todate, credits have been sold for as much as US$250,000 peracre.60
International research conducted by Robert Costanza from theUniversity of Vermont’s Gund Institute for EcologicalEconomics has suggested there is a 100-1 return on investmentin protecting ‘wild’ nature. For an annual investment of US$45billion in nature, society would yield a return of betweenUS$4.4 and US$5.2 trillion in ecosystem services.61

106
Trends indicate that a declining number of farmers will findthemselves responsible for the majority of the State’s biodiversity.Urban aspirations continue to place pressure on resources but,ironically, are increasingly dictating that protecting theenvironment is important. Rural land managers can providethis service if the markets exist and the cost-sharingarrangements recognise the public good being provided byprivate land managers.
Future investment in ecosystem services must involveparticipation across urban and rural communities and the publicand private sectors. The scale of ecosystem degradation andbiodiversity decline is well beyond the capacity and resources ofgovernment alone to tackle.
5.3 Are there activities upon which we canbuild?
There are existing activities that provide opportunities to build apositive future for the condition and management of naturalresources.
> We now have a reasonably good understanding of the broadbiophysical processes taking place across the landscape.Importantly there is increasing awareness by the communityof the need to address degradation issues. There is also anawakening interest within industry and business regardingsustainable development.
> Elements of the agriculture sector are quickly changing. Themost adaptable are moving to position themselves for afuture in sustainable production, using fewer resources andoperating with a reduced environmental impact.
There is a very strong history of community activity andmanagement of natural resources in Victoria. The Landcareprogram, and other community programs such asWaterwatch, and Land for Wildlife have proliferated andprospered. There are enormous opportunities to build onthe activities and strong ethic of the Landcare movement.
The community engagement structure of the CatchmentManagement Authorities derives from Landcare. This basisfor local decision-making will be fundamental to regionalparticipation in determining local futures.
> The tourism sector makes a large contribution to Australia’seconomy. In 1998, spending by domestic tourists totalled$43 billion with international tourist spending $17.3billion. In Victoria, figures for 1996/97 show tourismgenerated $9.4 billion. Over 85 per cent of Japanese and 70per cent of European and American travellers identified thenatural environment as a key element in their traveldecisions.32
The health of our catchments > a Victorian report card
Despite the importance of tourism, there are few privatelandscape areas in Victoria dedicated to servicing thispotential land use.
> Many traditional farmers hold an attachment to the lifestyleof farming that is tangible and intangible. There is a desirein many instances to pass on these lifestyle opportunities tofollowing generations. The 37,000 remaining farm holdingsare responsible for managing 57 per cent of the State.
If a new management scenario can accommodate andstrengthen this intrinsic farmer attachment to the land, anew management paradigm for our landscapes may evolve.
> Similarly, intensification of agricultural systems and retreatof agriculture in some areas will leave significant areas ofcurrent agricultural land producing a small and decreasingproportion of the agricultural output of Victoria.
This may also provide opportunities for policies andinvestment to encourage the production of increased non-agricultural services from this land if these services arecompatible with the basic amenity objectives of thelandowners. There is a role for government and industry inproviding research outcomes that enhance the trend towardsintensification and result in tools that encourage the transferof land from the provision of agricultural to environmentalservices. In doing so accelerating a transition towards greaterenvironmental protection that generally accompanieseconomic growth. 62, 63, 64
> Increasing awareness by the urban population of the finitenature of our natural resources is developing a stronger ethicto protect and enhance natural ecosystems for recreation,tourism and health reasons.
> Work is being done at a State and national level to redressmarket failures and properly value the services provided bynature.
> In business, depreciation is planned for by putting asideprofit to replace assets at a future time. This ‘depreciationallowance’ permits maintenance and replacement of assets.Such careful and planned asset management drives futurebenefits and income.7
Victorians will need to consider developing an ecosystemdepreciation allowance to enable investment in maintainingthe health of natural assets and ecosystems.7

107
> The work conducted by the Bush Tender program inVictoria is groundbreaking and is addressing market failureby helping facilitate a defined value for biodiversity. NREhas done a quick assessment of extending the Bush TenderProgram in its current form across the entire State. In theinitial stages the cost of such activity could be as little as$25-30 million over five years. In comparison to this sumVictorian’s spend around $4 billion on gambling every year.
Markets for environmental goods are not new and Victoriahas a range of examples upon which to draw. Victoria has awell-developed and sophisticated market for water and watertrading. In scarcity, the price messages associated withpurchase is seeing water move to higher value uses.
Similarly, user-pays pricing of water has seen Melbourne’sannual growth in demand for water use drop from aroundthree per cent in the 1980s to under one per cent now.Across the State the future will involve the managed andequitable increase in the price of water over the next 20years.
> Under the new $8 million private plantations blueprint,Victoria’s private forestry estate is projected to treble in sizeto 750,000 hectares by 2020. Appropriately plannedgrowth in private forestry activity provides opportunities forother ecosystem services to help address manyenvironmental issues facing Victoria.
> Finally, planning activities are becoming increasinglysophisticated. As noted, all the CMA regions across theState are redeveloping their Regional Catchment Strategies -the blueprints for resource management in each region.
Victoria has also developed a range of management strategiesand programs. There is scope to build on both the aboveinitiatives at a State level.
The scale of degradation we face in Victoria is large, but so arethe opportunities. Sustainability reform – a package combiningsocial, economic and environmental reform – should be thegrowth industry sector for the 21st century.27
The health of our catchments > a Victorian report card
108
The health of our catchments > a Victorian report card
6.1 Some key considerations for sustainableresource management
The VCMC overview of condition and management hasdemonstrated that to protect and enhance the natural capital ofthe State, revolutionary change is required in the way wemanage much of the Victorian landscape.
Current trends for resource condition across Victoria do notreflect the definition of sustainability offered in Chapter 4. Toreach a level of sustainability a comprehensive new approach isrequired. Increasingly, it is clear that sustainable resourcemanagement relies on a range of interrelated elements.
The State Government of Victoria’s key policy frameworkGrowing Victoria Together2 recognises this. Growing VictoriaTogether outlines the need for economic, social andenvironmental goals to be equally addressed throughgovernment decisions and directions for the future.
Brunckhorst’s conceptual framework of a range of capital assetclasses underpinning environmentally sustainable andprosperous communities provides a structure to realise thesegoals. These asset classes include:
> Natural capital – e.g. nature’s goods and services
> Social capital – social infrastructure e.g. cohesiveness, trust,reciprocity and cooperation of communities
> Human capital – the status of individuals e.g. health,education, skills, knowledge and access to services that fosterthis capital
> Physical capital – e.g. local infrastructure, buildings, roads etc
> Financial capital – money, savings and affordable accessiblecredit.26
The future condition of Victoria’s environment and its naturalcapital is closely linked to the future management decisions,aspirations and trends for social, financial, human, and builtcapital.
People can't change the way they use resources withoutchanging their relations with one another.4
Declines in one area will have flow-on effects to other areas,ultimately undermining community health. One example oftenused is the increasing difficulties farmers face reconciling short-term economic imperatives with long-term environmentalaspirations.
Planning and reporting in the future should address all segmentsof social, human, built, natural and financial capital in the sameframework. There is a need to develop a vision for the future ofrural and regional Victoria. This should encompass a whole-of-government approach to ensure consistent policy messages andbroader understanding of the issues across all government,community and industry sectors.
REACHING THE 2020 VISION ~ NEXT STEPS
SIX
109
The health of our catchments > a Victorian report card
6.2 Next steps
Growing Victoria Together, recognises that Victoria’s system ofwater catchment management is a model being replicatedaround the world.2
The Victorian Government is a leader in natural resourcemanagement, particularly in the devolved responsibility andpartnership approach of the Catchment ManagementAuthorities. Internationally, the CMA approach taken byVictoria is recognised as a key element in fostering integratednatural resource management.
The Australian Federal Government has recognised the valueand strengths of Victoria’s progressive management approach.Through the NHT II and NAP programs, it is activelyencouraging other Australian States to implement similarregional community-based integrated catchment managementsystems.
Through Growing Victoria Together, the Victorian Governmenthas made a commitment to build on the strong foundation ofthe CMA system. Since 1996, CMA regions have developedpriorities to implement transparent, efficient and effectivenatural resource management programs.
Victoria needs a vision for its rural landscape underpinned by astrategy, investment plan and whole-of-governmentimplementation plan. This could be considered aspirational butthere are international examples of more complex and largerscale planning and implementation activities.
For instance, Sweden has set itself the goal of becomingsustainable within one generation (by 2025-30). It hasapproached this goal through legislating 15 environmentalquality objectives that the whole-of-government is working toachieve.
Similarly, the Netherlands have implemented a number of policytools to achieve sustainable development, taken a whole-of-government approach, and worked with industry for sustainabledevelopment beyond government. It has set itself the goal ofbecoming sustainable and in 2001 produced a fourth NationalEnvironmental Policy Plan (NEPP 4). The NEPP 4 clearly setsthe agenda for environmental management to 2030.
In Victoria the government has released a Metropolitan Strategy.Given the impact of urban areas on surrounding ecosystemsthere are clear opportunities to link the implementation of theurban strategy with the development of a rural strategy.
Environmental degradation, economic restructuring and socialchanges are rapidly underway in regional Victoria. This isoccurring without an articulated clear direction for the future orfor the communities which will be affected.
The State’s first generation management plans were aboutengaging people; the second generation plans need to assist inmaking some really tough decisions. Key decisions will berequired on trade-offs between individual benefits andcommunity benefits.
The government is meeting this challenge and has pushedthrough some important changes that will help equitably shareand protect resources for current and future generations. TheIrrigation Farm Dams Legislation is a clear example.
Victoria needs a fundamental shift toward technologies thatemphasise sustainable use of natural resources, avoidenvironmental degradation and commit to rehabilitation of pastdamages.25
A State integrated natural resource management strategy
In future, the focus must be to design catchments andlandscapes for sustainability. The planning timeframe for suchactivities will need to be long-term, probably 20 or even 50years, to allow the community to adapt and adopt new ideasand management paradigms.
Currently NRE Catchment and Water division is undertakingthe first steps in developing a Statewide integrated naturalresource management investment framework. The scope of theframework is still being finalised.
This Project will develop in four stages over the coming twelvemonths. A Review Paper will form the first output of thisProject, and will focus on documenting how such a frameworkis being implemented elsewhere, identifying world best practice,and documenting how Victoria is performing in relation toworld best practice.
The VCMC supports the State Government in this importantinitiative. Ultimately, a Statewide natural resources managementstrategy and its investment plan must be developed on anadaptive management basis and would contain the followingelements:
> A vision for the Victorian landscape in 2050
> A vision for the future of agriculture within that landscape
> Identification of opportunities for the State
> An outline of innovative public/private partnerships toachieve the strategy
> A knowledge management plan, to include research anddevelopment and monitoring, evaluation and performancereview
> Adequate resources from the public and private sector.

110
6.3 Conclusion
In the long run it is clear that Victoria’s natural resource basewill significantly degrade if we continue to impart the samemanagement paradigm across the landscape. It is cheaper toadjust and manage our natural resources properly rather thanpay the exorbitant repair bill we are accumulating.
Victoria is committed to sustainable development, ensuring thateconomic, environmental and social resources are managed insuch a way that they are available equitably for the well-being ofthe next generation. Sustainable management of ourcatchments will require some major changes to ensure that theresources that underpin our successful agriculture sector areprotected for future use.
The health of our catchments > a Victorian report card

111
The health of our catchments > a Victorian report card
1. State of Victoria, Department of Natural Resources and Environment,
(2002) Catchment Management in Victoria - Explaining Victoria’s
Catchment Management Authorities.
2. State of Victoria, Department of Premier and Cabinet (2001) Growing
Victoria Together. Innovative State. Caring Communities.
3. State of Victoria, Department of Natural Resources and Environment
(2001) Victorian catchment indicators 2001: our commitment to reporting
on catchment condition.
4. State of Victoria, Department of Natural Resources and Environment
(2002) Living Systems Resource Kit.
5. Cork, S. and Shelton, D. (2000) Sustainable Environmental Solutions for
Industry and Government. In: Proceedings of the 3rd Queensland
Environmental Conference, May.
6. World Resources Institute (2000) World Resources 2000-2001 summary.
{Online} http://www.wri.org/wr2000/
7. Bennett, J. (2002) Investing in ecosystem health: Using rivers as a case
study. In: Ecological Management and Restoration 3 (2) pp 104-107.
8. Costanza, R. et al, (1997) The value of the world’s ecosystem services and
natural capital. In: Nature (London) 387:253-260.
9. Australian Museum (2000) Ecosystem Services Fact Sheet {Online}
http://www.austmus.gov.au/factsheets/ecosystem_services
10. Yencken, D. and Wilkinson, D. (2000) Resetting the Compass –
Australia’s Journey Towards Sustainability. CSIRO Publishing.
11. Office for the Commissioner of the Environment (1991) Agriculture
and Victoria’s Environment; 1991 State of the Environment Report.
(Government Printer: Melbourne)
12. Kefford, B. (2002) Speech to the Governor of Victoria. Department of
Natural Resources and Environment (unpublished report).
13. Council of Australian Governments, (2000) Council of Australian
Governments Communique. Press release from the Prime Minister’s
Office, Canberra.
14. Costello, M. (2002) Personal communication.
15. Thomas, D. (2002) Personal communication.
16. Auditor General Victoria (2001) Managing Victoria’s growing salinity
problem. Audit No 76 – session 1999-2001. Government Printer
17. Australian Bureau of Statistics (2001) Australia’s Environment: Issues and
Trends 2001. ABS Catalogue No. 4613.0 (Commonwealth of
Australia)
18. Hart, B. (2002) Personal communication.
19. The Economist (2002) A survey of the global environment 364 (8280) pp
51.
20. Commonwealth of Australia (2001) Performance Information
Commonwealth Financial Assistance under the Natural Heritage Trust
Audit Report No.43.
21. Gorbachev, M. (2002). In The Age newspaper Saturday August 24
2002.
22. Gunderson, L.H. (1999) Stepping back: assessing for understanding in
complex systems. In Johnson, K.N., Swanson, F.J., Herring, M. and
Green, S. (eds) Bioregional Assessments: Science at the crossroads of
Management and Policy. Pp. 27-40. Island Press, Washington, D.C.
23. Johnson, B.L. (1999) The role of adaptive management as an operational
approach for resource management agencies. Conservation Ecology
{Online} http://www.consecol.org.vol3/iss2/art8.
24. United States of America, Forest Ecosystem Management Assessment
Team (1993) Forest Ecosystem Management: An Ecological, Economic, and
Social Assessment.
25. National Science Board, Taskforce on the Environment Environmental
Science and Engineering for the 21st Century (2002) The Role of the
National Science Foundation. II. The Larger Context for Environmental
Research, Education, and Scientific Assessment. {Online}
http://www.nsf.gov/nsb/tfe/nsb99133/sec2.htm
26. Brunckhorst, D. (2002) Institutions to sustain ecological and social
systems. In: Ecological Management and Restoration 3 (2) pp 108-116.
27. Krockenberger, M. et al Australian Conservation Foundation (2000)
Natural Advantage – A blueprint for a Sustainable Australia.
28. Ha, A. and Chapman, L. (2000) Productivity growth trends across
Australian broadacre industries. Australian Commodities 7, 334-340.
29. Australasian Agribusiness Services (1997) Financial Performance of
Broadacre Agriculture. (Rural Industries Research and Development
Corporation: Canberra).
30. Ferguson, J. and Simpson, R. (1995) The Australian Rural Labour
Market. (National Farmers' Federation: Canberra) and Garnaut, J. and
Helali, S. (1999) Age profiles of Australian broadacre and dairy farmers.
Australian Farm Surveys Report pp 65-70.
31. State of Victoria, Department of Natural Resources and Environment
(2002) Victorian River Health Strategy.
32. State of Victoria, Department of Natural Resources and Environment
(2000) Victoria’s Salinity Management Framework. Restoring our
Catchments.
33. Commonwealth of Australia (2002) Australian Catchment River and
Estuary Assessment. National Land and Water Resources Audit,
Canberra.
BIBLIOGRAPHY

112
The health of our catchments > a Victorian report card
34. State of Victoria, Victorian Coastal Council (2002) Victorian Coastal
Strategy.
35. Commonwealth of Australia (2000) Australian Dryland Salinity
Assessment. National Land and Water Resources Audit, Canberra.
36. State of Victoria, Department of Natural Resources and Environment
(2001) The Impact of Acid Soil in Victoria.
37. State of Victoria, Department of Natural Resources and Environment
(2002) Victorian Pest Management Framework.
38. State of Victoria, Department of Natural Resources and Environment
(2002) Victorian Greenhouse Strategy.
39. Rendell McGuckian (1998) Proposed Catchment Indicators (unpublished
draft report prepared for the Department of Natural Resources and
Environment).
40. Low Choy, D.C and Davies, R.C (1997) Stakeholder Analysis: The
Forgotten Dimension of Participatory Planning, Environmental Planning
Group, Griffith University (unpublished report).
41. State of Victoria, Department of Natural Resources and Environment
(2001) Submission by the Secretary of the Department to the Auditor
General’s audit of the Victorian Salinity Program. (unpublished report)
42. State of Victoria, Department of Natural Resources and Environment
(2002) Healthy Landscapes – Sustainable Communities. Victoria’s Action
Plan for Second Generation Landcare.
43. Taylor Nelson Sofres (Aust) and Scarlet Consulting Australasia (2001)
CMA Benchmarking of Community Attitudes, Report No. M2741, June
2001
44. Commonwealth of Australia (1992) National Strategy for Ecologically
Sustainable Development. (Australian Government Publishing Service,
ACT.
45. Annett, S. (2002) Victorian Agriculture 1904-2000: Land use change or
transition? Unpublished conference Paper for Rural Land Use Change –
Yes! – but will biodiversity be OK? August 2002.
46. Barr, N. (2002) Social sustainability, triple bottom line, capacity to change
and the future of rural landscapes. Unpublished conference paper for
Getting it Right: Guiding Principles for Natural Resource Management
in the 21st Century. 11-12 March 2002.
47. Case, L. Dr. (2002) La Trobe University. In The Weekly Times,
September 11, 2002.
48. Recher, H. F. and Lim, L. (1999) A review of the current ideas of the
extinction, conservation and management of Australia’s terrestrial vertebrate
fauna. Proceedings of The Ecological Society of Australia. 16: 287-301.
49. Australian Broadcasting Commission (2002) Radio National Background
Briefing Program, Sunday September 8. {Online}
http://www.abc.net.au/rn/talks/bbing/stories/s672088.htm
50. State of Victoria, Department of Natural Resources and Environment
(2002) Victoria’s Native Vegetation Management. A Framework for
Action.
51. State of Victoria, Department of Natural Resources and Environment
(2002) Salinity Management in Victoria: Future Directions.
52. Australian Academy of Technological Science and Engineering (1999)
Water and the Australian Economy.
53. State of Victoria, Water Resources Strategy Committee for the
Melbourne Area (2001) Discussion Starter: Stage 1 in developing a Water
Resources Strategy for the Greater Melbourne Area.
54. The Age Newspaper "News" section September 21, 2002.
55. Parliament of Victoria, Environment and Natural Resources Committee
(2001) Inquiry into the Allocation of Water Resources. (Government
Printer: Victoria)
56. Whetton, P.H. et al (2002) Climate change in Victoria. Climate Impact
Group, CSIRO Atmospheric Research.
57. Gunningham, N. and Sinclair, D. (2002) Environmental Partnerships;
Combining sustainability and commercial advantage in the agricultural
sector. A report for the Rural Industry Research and Development
Corporation, publication No 02/004.
58. National Land and Water Resources Audit (2002) {Online}
http://www.nlwra.gov.au
59. Campbell, A. (2002) Land and Water Australia. In The Weekly Times,
August 7, 2002.
60. The Economist (2002) Volume 364 (8285) pp 65-66.
61. Wakefield, J.R. (2002) Costanza paper in science: Investing in the
environment pays 100-1 return. University of Vermont {Online}
http://www.uvm.edu/news
62. Bimonte, S. (2002) Information access, income distribution, and the
Environmental Kuznets Curve. Ecological Economics 41, pp 145-156.
63. Magnani, E. (2000) The Environmental Kuznets Curve, environmental
protection policy and income distribution. Ecological Economics 32,
pp 431-443.
64. Rutel, T. K. (1998) Is there a forest transition? Deforestation, reforestation
and development. Rural Sociology 63, pp 533-552.
BIBLIOGRAPHY

113
The health of our catchments > a Victorian report card
The Victorian Catchment Management Council wishes to thank the
following people for their contribution to this report. Council takes full
responsibility for the views expressed in this document.
Alex Arbuthnot, VCMC
Aleita Donald, CaW, NRE
Alison Teese, VCMC
Bernie Dunn, Wimmera CMA
Bill O’Kane, Cindy Doherty, Wayne Tennant, Megan McFarlane,
Goulburn Broken CMA
Bill Sharrock, VCMC
Carol Roberts, CaW, NRE
Carsten Nannestad North Central CMA
Chris Barry, East Gippsland CMA
Craig Feurehurt, CLPR
Darren Gladman, Environment Victoria
David Buntine, Port Phillip CALP Board
David Cummings, CaW, NRE
David McKenzie, CaW, NRE
David Parkes, PFF, NRE
Doug Newton, EPA and VCMC Observer
Dr. Martin Barlass, Agriculture Victoria, NRE
Dugal Wallace, State NAP Office
Gill Fry, Colin Dunkley, Glenelg-Hopkins CMA
Gilly Richarson, Tony Overman, Peter Codd, David May, Don Forsyth,
Corangamite CMA
Gordon Walker, CaW, NRE
Graham Quarrel, Caw, NRE
Heather Anderson, PFF, NRE
Ian Mansergh, PFF, NRE
Jane Bateson, Melbourne Water
Jane Prideaux, Billington Prideaux Partnership
Jane Ryan, Waterwatch Victoria, NRE
Joanne Caminiti, West Gippsland CMA
Joanne Greenwood, CaW, NRE
Joanne McNeil, CLPR
John Ginnivan, Goulburn-Murray Water
John Riddiford, Jeoff Taylor, North East CMA
Kerry Regan, CaW, NRE
Kim Lowe, PFF, NRE
Leanne Coughlin, Caw, NRE
Les Walker, CaW, NRE
Mal Brown, Scarlet Consulting
Mark Allaway, Agriculture Victoria, NRE
Martin Bluml, CLPR
Melissa Pouliot, Wimmera CMA
Michael Crawford, Institute Director CLPR
Monica Morgan, VCMC
Neil Barr, CLPR
Nevil Amos, PFF, NRE
Neville Penrose, West Gippsland CMA/NRE
Patricia Geraghty, CaW, NRE
Paul Bennett, CaW, NRE
Paul Sinclair, Environment Victoria
Paul Smith, CaW, NRE
Penny Richards, Port Phillip, NRE
Peter Forbes, State NAP Office
Peter Sutherland, Executive Director CaW, NRE
Phil Dyson, PD&N
Randal Nott, CaW, NRE
Resource Assessment and Monitoring Group
Diana Patterson, Christine Forster, Bob Carraill, Mick Lumb, Barry Hart,
Peter Forbes, Dugal Wallace, Joanne McNiell
Rob Price, Regional Services, Bendigo NRE
Rod Anderson, Victorian Greenhouse Unit, NRE
Rod Taylor, PFF, NRE
Ross Davies, CaW, NRE
Sarah Ewing, VCMC
Shawn Butters, CaW, NRE
Shayne Annett, CaW, NRE
Shirley Diez, Land Stewardship Project Officer, NRE
Stephen Petris, Policy Coordination Group, NRE
Steve Erlandsen, Mallee CMA
Stuart Critchell, CaW, NRE
Stuart Minchin, CaW, NRE
VCMC Catchment Condition Report Sub-Committee
John Russell, Diana Patterson, Barry Hart, Christine Forster
Vera Lubczenko, CaW, NRE
Walter Goodoy, CaW, NRE
Jim Backholer, Regional Services, NRE
Photographs: Scarlet Consulting, Martin Bluml, Waterwatch Victoria.
ACKNOWLEDGEMENTS

114
The health of our catchments > a Victorian report card