The Health Care Landscape Before and After the ACA Bill Evans University of Notre Dame 1.
56
The Health Care Landscape Before and After the ACA Bill Evans University of Notre Dame 1
Transcript of The Health Care Landscape Before and After the ACA Bill Evans University of Notre Dame 1.

The Health Care Landscape Beforeand After the ACA
Bill EvansUniversity of Notre Dame
1

Two Goals
• What are the issues that any health reform proposal must address?
• How did the ACA deal with these issues?
2

What must health care reform address?
• Access
• Cost (both the level and rate of change)
• Medicare
• Tax equity
3

4

5
Percent of Firms Offering Health Insurance
46%
72%
87%95% 98%
0%
20%
40%
60%
80%
100%
3-9 10-24 25-49 50-199 200+
% O
fferin
g In
sura
nce
Firm Size
Percent of Firms Offering Health Insurance

Uninsured Non-Elderly by Work Status of Family Head, 2007
6
Full-year,full-time worker,
66.7%
Full-year,part-
time worker, 6.6%
Part-year, full-time worker, 11.5%
Part-year, part-time
worker, 4.1%
Non-worker, 11.0%

Problems for small firms
• Large firms typically self insure – act as their own insurance company
• Small firms must purchase insurance in the market
• Much higher cost– Do not benefit from large insurance pools– Higher administrative costs– Pay profits– Adverse selection
7

What must health care reform address?
• Access
• Cost (both the level and rate of inflation)
• Medicare
• Tax equity
8

Expenditures on Health Care
• Actual, 2010
• $2.6 trillion on HC
• $8,402 per capita
• 17.9% of GDP
• Projected, 2021
• $4.7 trillion
• $14,102 per capita
• 29.6% of GDP
9

$7,290
$4,763$4,417
$3,895$3,424
$2,992$2,581 $2,581
$0
$2,000
$4,000
$6,000
$8,000
US NOR SWZ CAN IRE UK SPN JPNCountry
Per Capita $ on Health Care, 2007
10
87% more than Canada
143% more than UK
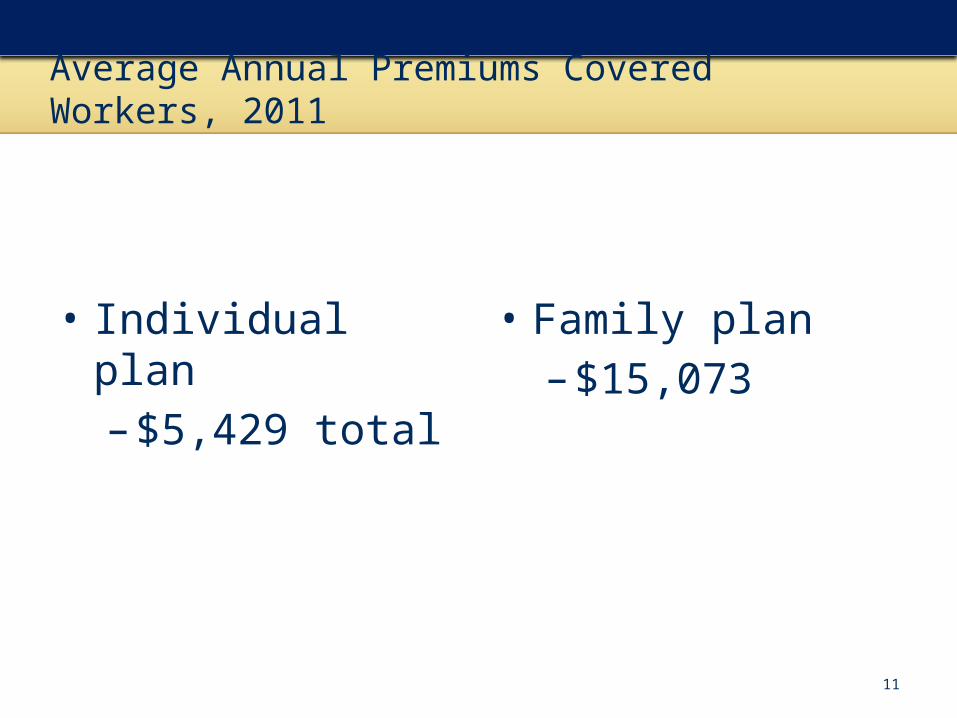
Average Annual Premiums Covered Workers, 2011
• Individual plan–$5,429 total
• Family plan–$15,073
11

12
31% 26%
138%
0%
40%
80%
120%
160%
Overall inflation Mean familyincome
Health insurancepremiums
Pri
ce C
han
ges
Price Changes, 1999 to 2010

Bang per buck??
• US ranks 25 of 29 countries in life expectancy– 4.3 years shorter than Japan (highest)– 2.4 years shorter than Canada
• 24th worst of 28 countries in infant mortality– More than twice the rate of Japan (lowest)– About 30% higher than both Canada and UK
13

Are high expenditures a bad thing??
• A key driver of health care costs is technology• New technologies are effective but expensive• Many technologies NOT available 30 years ago are
commonplace today– MRIs/CT scans, angioplasty, anti-psychotropic drugs,
hip/knee replacements, neo-natal intensive care, treatments for AIDS, statin drugs
• Health care is the ONLY industry where a growing fraction of GDP is considered BAD
14

Medical Successes
• ARVs reduced AIDS mortality by 70%
• NICU’s reduce neonatal mortality among very low birth weights infants by 42%
• Lipitor reduces LDL by 39-60%, reduces all cause mortality by 12%
• 30-day survival rates for heart attack patients admitted to the hospital fell 17% 1995-2006
15

Where would you rather be treated for a disease: US or elsewhere?
16

5-year Cancer Survival Rates
Country Breast(Female)
Cervical(Female)
Colon(Male)
Lung(Male)
Prostate(Male)
Thyroid(Female)
US 82.8 69.0 61.7 12.0 81.2 95.9UK 66.7 62.6 51.0 7.0 44.3 74.4Dnmk. 70.6 64.2 39.2 5.6 41.0 71.7France 80.3 64.1 49.6 8.7 67.6 77.0Swed. 80.6 68.0 51.8 8.8 64.7 83.7Switz. 79.6 67.2 52.3 10.3 71.4 78.0
17

18
4.3%
3.3%
5.4%5.2%
0%
1%
2%
3%
4%
5%
6%
AMI Ischemic stroke
30-Day In Hospital Mortality Rate for Acute Conditions
U.S. OECD
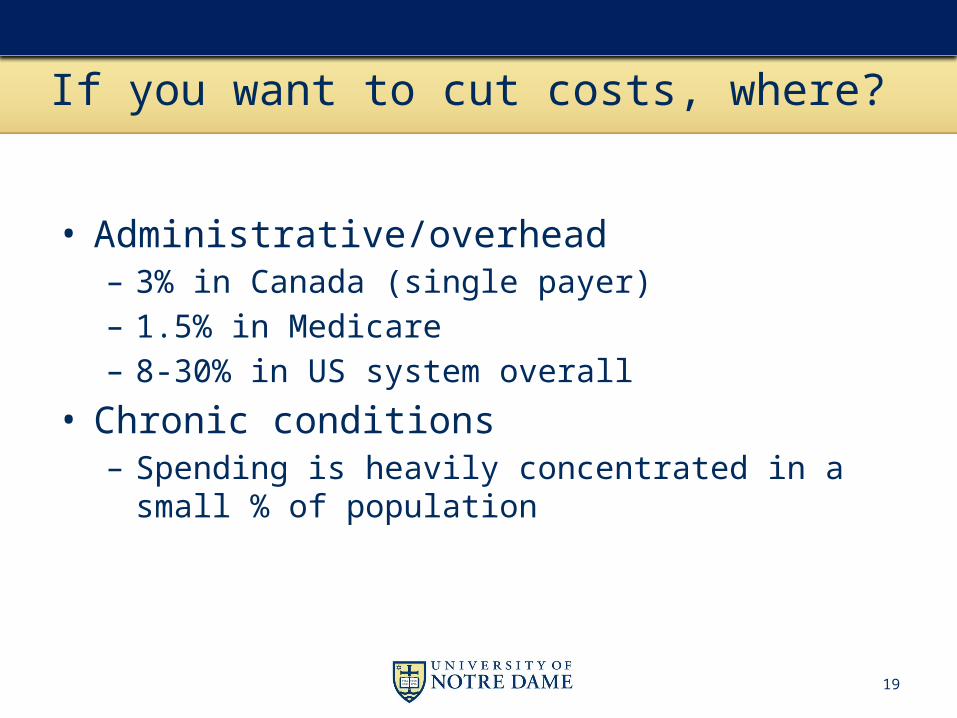
If you want to cut costs, where?
• Administrative/overhead– 3% in Canada (single payer)– 1.5% in Medicare– 8-30% in US system overall
• Chronic conditions– Spending is heavily concentrated in a small % of
population
19

20
Percent of Total Health Care Expenses by Different Percentiles of Population, 2002
22%
49%
64%
80%
97%
0%
20%
40%
60%
80%
100%
1% 5% 10% 20% 50%
Percentiles of population
% o
f to
tal e
xp
en
dit
ure
s

If you want to cut costs, where?
• Administrative/overhead– 3% in Canada (single payer)– 1.5% in Medicare– 8-30% in US system overall
• Chronic conditions– Spending is heavily concentrated in a small % of
population
• Unnecessary/end of life care– ¼ of Medicare $ are in last year of life
21

22
Per Capita Medicare Spending by Hospital Referral Region, 2006
$9,000 to 16,352 (57)8,000 to < 9,000 (79)
7,500 to < 8,000 (53)7,000 to < 7,500 (42)
5,310 to < 7,000 (75)Not Populated

What must health care reform address?
• Access
• Cost (both the level and rate of inflation)
• Medicare
• Tax equity
23

Medicare
• 2010
• 47 million recipients
• $524 bill. exp.
• 3.2% of GDP
• 16% of fed. budget
• 2040
• 87 million recipients
• 6% of GDP
24

Medicare Sources as % of GDP
25
Unfunded portionOf Medicare Will equal 2% ofGDP

Future problems
• Rising costs
• Rising number eligibles
• People are living longer– Older people spend a lot more on health care
• Falling fraction of people to tax
26

27
20.428.4
34.339.7
46.8
62.3
79.287.0
0
20
40
60
80
100
1970 1980 1990 2000 2010 2020 2030 2040
Mill
ions
of P
eopl
e
Year
Medicare Enrollment
28
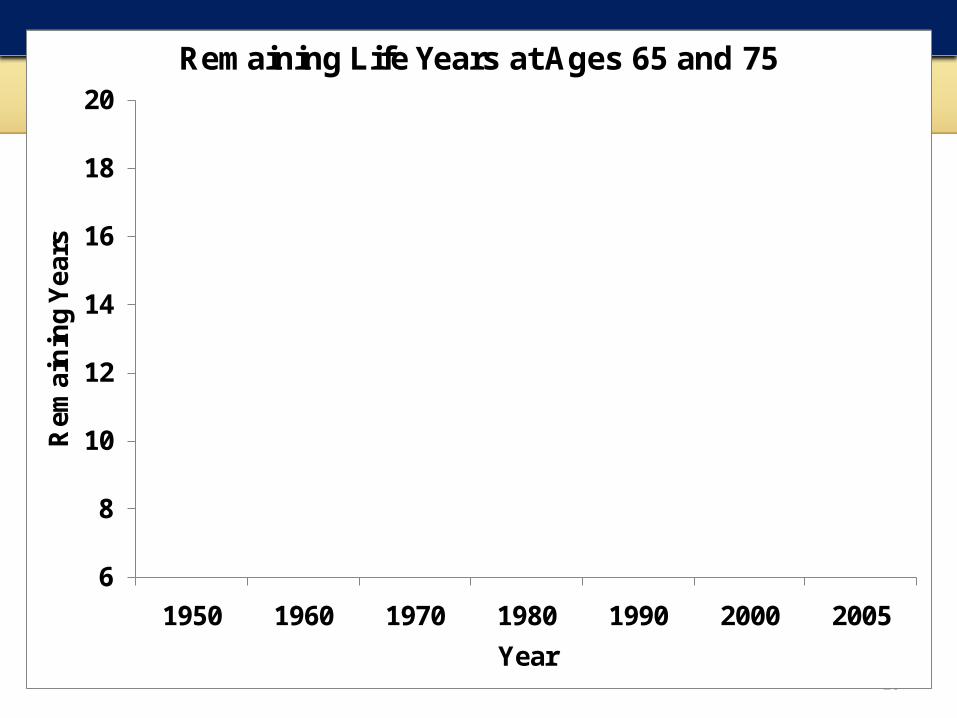
13.9 14.315.2
16.417.2
18.018.7
10.410.9 11.0 11.2 11.3 11.4
12.0
6
8
10
12
14
16
18
20
1950 1960 1970 1980 1990 2000 2005
Rem
ain
ing
Yea
rs
Year
Remaining Life Years at Ages 65 and 75
At age 65
At age 75

29
$2,650 $3,370 $5,210
$7,887
$10,778
$16,389
$25,691
$0
$5,000
$10,000
$15,000
$20,000
$25,000
$30,000
0-18 19-44 45-54 55-65 64-75 75-84 85+
Age group
Per Person Health Care Spending, 2004

30
5.5
4.7 4.5 4.3 4.0
3.22.6 2.5
0
1
2
3
4
5
6
1970 1980 1990 2000 2010 2020 2030 2040
Ratio
Year
Ratio: 20-64 Population/Medicare

What must health care reform address?
• Access
• Cost (both the level and rate of inflation)
• Medicare
• Tax equity
31

Tax Preferred Status of Health Care
• EPHI a tax-free fringe benefit• WW II era program• Greatly reduces costs of HI to consumers– But encourages more generous coverage
• Has encouraged the growth of EPHI– Few had insurance before the benefit– Now 170 million have EPHI
• Helps solve the problem of adverse selection
32
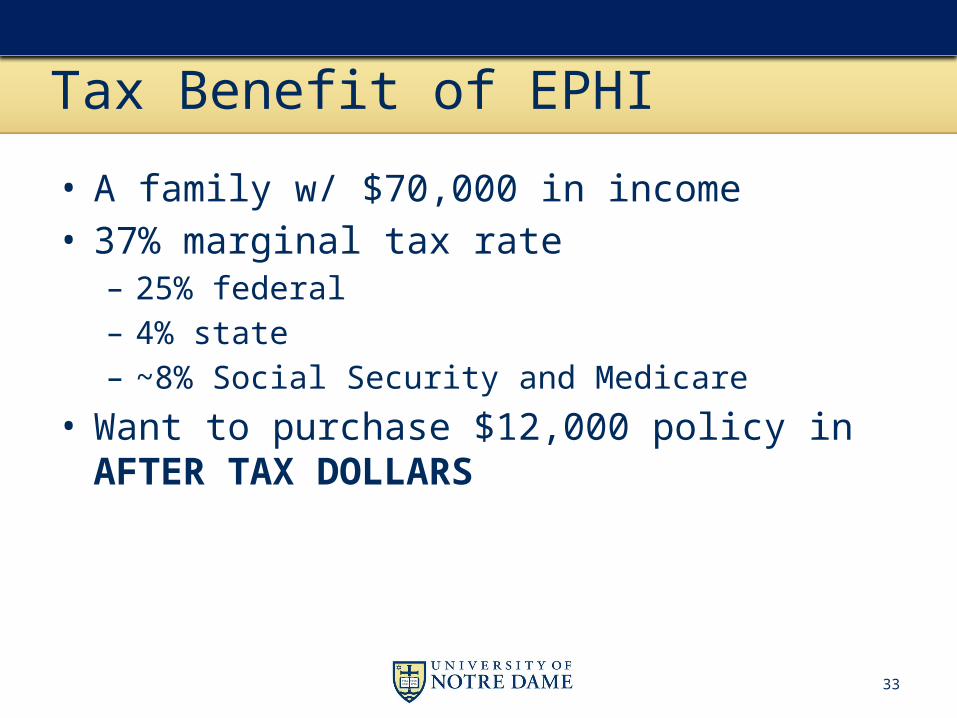
Tax Benefit of EPHI
• A family w/ $70,000 in income• 37% marginal tax rate– 25% federal– 4% state– ~8% Social Security and Medicare
• Want to purchase $12,000 policy in AFTER TAX DOLLARS
33

Without tax advantage:
• Receive $19,047 in income
• Pay 37% or $7,047 in taxes
• $12,000 left over for health insurance
• Net benefit of tax deduction is $7,047
34

Inequalities
• Costs Fed. Govt. $250 billion/year
• Tax break only available to those w/ ins. – More likely high wage workers
• Tax benefit greatest for high income as well– Paying higher marginal rates
• Regressive tax– Benefits are much higher in upper income groups
35

Patient Protection and Affordable Care Act
An outline and some likely outcomes
36
Overview
• Mainly a coverage bill
• Builds out from existing system– Tries to fill in the gaps in coverage
• Large scale insurance industry reform– Community rating– Eliminate pre-existing conditions
37
Coverage expansions achieved through
• Individual mandate (tax of 2.5% of AGI)
• Pay or play -- employer mandates
• Expand Medicaid to include higher income groups
38

Coverage expansion (continued)
• Provide tax credits for the low income in individual market
• Tax credits for small firms to provide insurance
• Establish health insurance exchange where people can purchase group insurance
39
Why is coverage mandatory?
• Insurance industry reform– Community rating– eliminate pre-existing condition clauses
• If adopted under current system– Costs for low risk would rise – they would exit
• Mandatory coverage forces low cost users into the system, helps subsidize high cost users
40

Impact on Uninsured
• Reduce uninsured by 32 mil. in 2019 (60%↓)
• Leaves another 23 mil. uninsured
• Hispanics will be over-represented in the uninsured
41

Balance Sheet – CBO 2010-2019
• What the program buys
• Expand private$ 464
• Expand public $ 434
• Small firm credit $ 37
• Total$ 935
• How it is paid for
• ↑ taxes $ 454• ↓Mcare/caid $
368• Other $ 255• Total $1077
• $142 billion ↓ deficit
42In Billions of $

Does it reduce the deficit?
• $40 billion in savings was due to CLASS act– Long term care programs– Takes in revenues for 6 years before any benefits paid out– Financially not viable and has since been dropped
• Rosie scenario about future Medicare cuts– 27% fee cut set to go into effect in Jan of 2013– Automatic reductions in fees if growth is too high
43

44
Medicare Board of Trustees
“It is important to note that the actual future costs of Medicare are likely to exceed those shown by the current law projections…We recommend that the projections be interpreted as an illustration of the very favorable financial outcomes that would be experienced if the productivity adjustments can be sustained in the long run.”

45
More general point
• It was necessary to do something about the future costs of Medicare
• ACA did attack these costs – but – the savings were then paid out in benefits
• If the concern is the overall fiscal health – we have not improved
What is missing?
Cost controls
46

• Add 32 million people to the market with excellent insurance coverage
• Modest attempt at cost controls– Accountable Care Organizations
• No effort to change supply – Should increase price– Could be a lot worse
• With Medicare/Caid cuts, may discourage some providers from participating in program
47
Winners
• Uninsured– affordable high-quality insurance now available
• Workers at small companies– Now have access to group market– Heavy subsidies for low income
48
• Hospitals/Rx/Medical Technology– Insure 32 million more people– Sicker than average group (holding age constant)– With insurance, they will start to use services– Evidence:
• Stock prices of these firms increased every time bill moved closer to passage
• Market is evaluating the bill as helping suppliers
49
Losers
• Medicare advantage – Frozen reimbursements levels
• Small group market – this portion of market will not exist in a few years
• Workers with high cost plans• Tanning salons• Generic drug manufacturers• State budgets in some states
50

Where is the uncertainty?
• How will Medicare cuts impact providers?• Can ACO’s reduce growth of costs?• What is a qualified plan?• Can exchanges constrain costs?• How many people will get subsidized coverage?– Will not necessarily change who has coverage – but will
change who pays for it
51

52
The end

Pay or play
• Firms w/ >50 employees must offer qualified health insurance or pay $2000 tax/employee
• Tax incentives/credits for small firms to provide insurance
• Language is that firms must pay “fair share”• Economists believe workers pay for insurance in the
form of lower wages• Will firms pay or play?
53

Small Firms
• Small firms not subject to pay/play mandate• Face extremely high cost of providing HI• Workers face much lower wages if they receive HI
from firm• Gov’t now provides high subsidy rate for low-income
uninsured• As a result….
54
• May make sense for small firms with low wage workers to – drop coverage– have workers pick up subsidized insurance via exchange
• Workers would get– Wage hile– Reduced health insurance costs
• Increase federal costs of program
55

56
Age
$
Not Obese
Obese
A
BC
Age1 Age2