The Health and Moral Hazards of No-Fault Insurance · The Health and Moral Hazards of No-Fault...
30
SOUR( The Health and Moral Hazards of No-Fault Insurance Peter Sheldon Contents Introduction by Owen Lippert 3 Executive Summary 7 Introduction 8 Section 1: What is No-Fault Insurance? 9 Section 2: The Insurance Corporation of British Columbia 9 Section 3: Alterations in the Insurance Product Recommended by the Automobile Insurance Review Team 15 Section 4." Why No-Fault is Being Considered in BC 16 Section 5: No-Fault Insurance in Other Jurisdictions 19 Section 6: The Empirical Evidence Related to the Impact of the Introduction ofNo'Fault Insurance 21 References 31 A Law and Markets Project Publication A FRASER INSTITUTE OCCASIONAL PAPER Number 2 www.fraserinstitute.org
Transcript of The Health and Moral Hazards of No-Fault Insurance · The Health and Moral Hazards of No-Fault...

SOUR(The Health and Moral Hazardsof No-Fault Insurance
Peter Sheldon
ContentsIntroduction by Owen Lippert 3Executive Summary 7Introduction 8Section 1: What is No-Fault Insurance? 9Section 2: The Insurance Corporation of British Columbia 9Section 3: Alterations in the Insurance ProductRecommended by the Automobile Insurance Review Team 15Section 4." Why No-Fault is Being Considered in BC 16Section 5: No-Fault Insurance in Other Jurisdictions 19Section 6: The Empirical Evidence Related to the Impactof the Introduction ofNo'Fault Insurance 21References 31
A Law and Markets Project Publication
A FRASER INSTITUTE OCCASIONAL PAPER
Number 2
www.fraserinstitute.org

PUBLIC POLICY SOURCES, NUMBER 2
Introduction: The Health and Moral Hazards of No-Fault Insurance
The siren call of "pure" no-fault automobileinsurance echoes once more in Canada. This
time its seductive strains are heard in British Co-lumbia. The imminent introduction of no-faultinsurance raises familiar questions. "Is no-faultautomobile insurance better than a tort liabilitysystem in containing premium costs, producingfairer awards and reducing injuries?" The quickanswer, based on empirical evidence of no-faultinsurance and economic theory, is that no-faultdoes not deliver the benefits promised; it simplyredistributes the costs which may actually increase.
This paper provides the somewhat longer answerto that question. The Fraser Institute, through itsLaw and Markets project, is pleased to publish thework of first time Institute author, Peter Sheldon,one of Vancouver's up and coming practicingeconomists. This introduction sets the stage forSheldon's detailed analysis. In turn, his work willset the stage for later Institute investigations intothe effect of no-fault insurance should it be intro-duced in British Columbia. This paper builds onthe existing body of work done on automobileinsurance in British Columbia, most notably,Herb Grubel's 1985 book for The Fraser Institute,Focus on the Insurance Corporation of British Colum-bia: Public Monopolies and the Public Interest.
First, here are some quick definitions. A tort liabil-ity system allows automobile injury victims fullaccess to the courts to sue at-fault drivers and/ortheir insurance company for losses, economic orpersonal, beyond what is covered by the insur-ance of either or both parties. A pure no-faultinsurance system does not allow injury victims topursue compensation in the courts. Rather, allbenefits are set by the insurer according to a pre-determined scale. Variations of the no-fault re-gime include add-on insurance that sets a basicamount which injured parties receive whether ornot they were at fault. Most provinces, including
BC, have some form of add-on no-fault insurance.Other mixed no-fault schemes allow victims tosue if they meet either a "verbal threshold," basedon the severity of injuries sustained, or a "mone-tary threshold," based on the cost of care.
The origin of the debate
The origin of the current no-fault debate in BC lieswith the increasing pressure on the finances ofICBC, the public monopoly for automobile insur-ance. BC is a tough market for any insurer; it hasthe highest rates in Canada for both automobileaccidents and car theft. The average cost of injuryclaims is estimated to have nearly doubled from$12,500 in 1985 to $21,404 in 1995. Stolen vehicleclaims have gone from 4,876 in 1986 to 28,000 in1996. In addition, the provincial government hasoff-loaded onto ICBC many of the costs of theMotor Vehicle Branch and of road safety initia-tives, including the controversial photo radar.Not surprisingly, average ICBC premiums haverisen by 155 percent since 1986. Last year, ICBCpredicted that the current liability system wouldforce up premiums by another 40 percent by theyear 2000 if nothing is changed. On the eve of the1996 provincial election, Premier Glen Clarkpromised that, if elected, premiums would notincrease.
In December 1996, the recently elected PremierClark then set up an Automobile Insurance Re-view Team to provide "options" to reduce ICBCcosts while keeping average premiums capped at$975 through the year 2000. In March of this year,it proposed two possible insurance productchanges. The first would modify the current lia-bility system but retain a distinction between at-fault and innocent claimants and allow access tothe courts. However, ICBC would get first crack atany pain and suffering awards through a $35,000
The Fraser Institute ealth and Moral Hazards of No-Fault Insurancewww.fraserinstitute.org

PUBLIC POLICY SOURCES, NUMBER 2
deductible, and it would manage any cost-of-careawards (victims would not control any lump sumaward). The second option, recommended by aCanadian Bar Association committee headed byThomas Allen, Q.C., would create a pure no-faultsystem in which an alternative dispute resolutionprocess would replace access to the courts. ICBCwould guarantee income replacement benefits of100 percent of net income—rather than gross in-come as is currently the practice—to a maximumof $650 per week. However, ICBC would deductany other CPP or Employment Insurance income,and would provide no compensation for pain andsuffering, and only limited amounts for loss offunction.
The government is expected to introduce legisla-tion this Spring.
In preparing public opinion for this controversialstep, the government has directed ICBC's mediacampaign. The message is surprisingly stark.Lawyers—and by extension the courts—are por-trayed as impeding the efficient, equitable, andaffordable resolution of automobile-related per-sonal injuries. The claim is that if the formal legalprocess could be circumvented, then consumerswould pay lower premiums, victims would re-ceive fairer compensation, and ICBC could spendmore on safety measures to reduce the numberand severity of car accidents. In short, ICBC andthe government claim no-fault insurance willbring considerable savings and safer roads.
The evidence on no-faultinsurance
Does the empirical record support ICBC's conten-tions? This is the central question addressed bySheldon in his work. New Zealand adopted thefirst pure no-fault scheme in 1974, followed byAustralia's Northern Territory in 1979. In Canada,limited add-on no-fault insurance schemes havebeen adopted by several Canadian provincesstarting with Saskatchewan in 1946. In 1978, Que-bec was the first North American jurisdiction tomove to a pure no-fault regime. Manitoba fol-lowed suit in 1994, and Saskatchewan in 1995.Ontario introduced no-fault insurance under a"verbal threshold" in 1990, graduated to a pureno-fault system in 1994, then returned to "verbalthreshold" in 1996. Vancouver economist PeterSheldon recently completed a survey of the vari-ous empirical studies about the effects of no-faultinsurance and the results world-wide are consis-tent.1
One of the most controversial issues is the impactof no-fault insurance on the rate of accidents, in-juries, and fatalities. Sheldon discusses two majorempirical studies of Quebec which point out thatsince 1978, both fatal accidents and accidents
ry
leading to injuries have increased. Professor M.Gaudry found in his 1992 study that an estimated6.8 percent increase in fatalities, 26.3 percent in-crease in injuries, and a 11 percent increase inproperty damage can be associated with Quebec'sintroduction of no-fault insurance. In a separateanalysis, Professor R.A. Devlin found similar
Peter Sheldon, "No Fault vs. Tort Insurance Schemes: A Survey of the Empirical Evidence," AssociatedEconomic Consultants Ltd., Vancouver, 1996.
Both studies are summarized in Peter Sheldon, "No Fault Insurance and the Debate in British Columbia,"The Fraser Institute (Forthcoming, May 1997); M. Gaudry, "Measuring the effects of the No Fault 1978Quebec Automobile Insurance Act with the DRAG Model," in G. Dionne (ed.) Contributions to InsuranceEconomics, Boston, MA: Kluwer Academic Publishers, 1992, pp. 471-498; and R.A. Devlin, "Liability versusNo Fault Automobile Insurance Regimes: An Analysis of the Experience in Quebec," in G. Dionne (ed.),Ibid., pp. 499-520..
Health and Moral Hazards of No-Fault Insurance The Fraser Institutewww.fraserinstitute.org
PUBLIC POLICY SOURCES, NUMBER 2
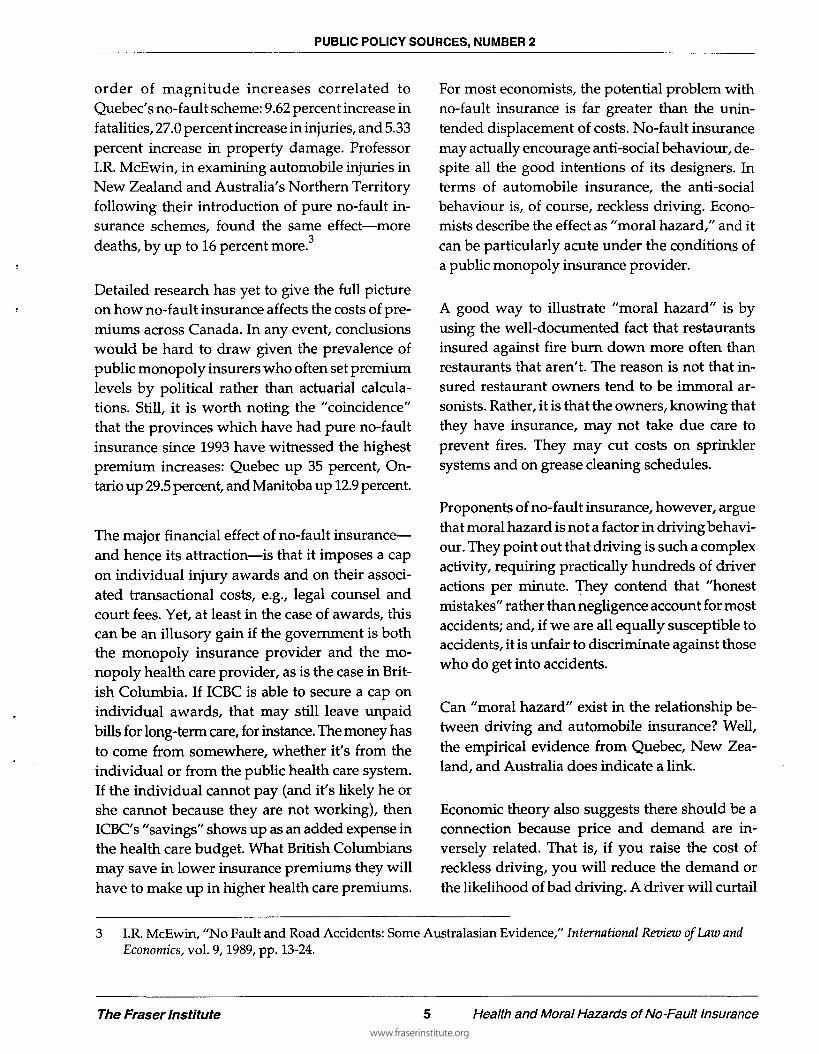
order of magnitude increases correlated toQuebec's no-fault scheme: 9.62 percent increase infatalities, 27.0 percent increase in injuries, and 5.33percent increase in property damage. ProfessorI.R. McEwin, in examining automobile injuries inNew Zealand and Australia's Northern Territoryfollowing their introduction of pure no-fault in-surance schemes, found the same effect—moredeaths, by up to 16 percent more.3
Detailed research has yet to give the full pictureon how no-fault insurance affects the costs of pre-miums across Canada. In any event, conclusionswould be hard to draw given the prevalence ofpublic monopoly insurers who often set premiumlevels by political rather than actuarial calcula-tions. Still, it is worth noting the "coincidence"that the provinces which have had pure no-faultinsurance since 1993 have witnessed the highestpremium increases: Quebec up 35 percent, On-tario up 29.5 percent, and Manitoba up 12.9 percent.
The major financial effect of no-fault insurance—and hence its attraction—is that it imposes a capon individual injury awards and on their associ-ated transactional costs, e.g., legal counsel andcourt fees. Yet, at least in the case of awards, thiscan be an illusory gain if the government is boththe monopoly insurance provider and the mo-nopoly health care provider, as is the case in Brit-ish Columbia. If ICBC is able to secure a cap onindividual awards, that may still leave unpaidbills for long-term care, for instance. The money hasto come from somewhere, whether it's from theindividual or from the public health care system.If the individual cannot pay (and it's likely he orshe cannot because they are not working), thenICBC's "savings" shows up as an added expense inthe health care budget. What British Columbiansmay save in lower insurance premiums they willhave to make up in higher health care premiums.
For most economists, the potential problem withno-fault insurance is far greater than the unin-tended displacement of costs. No-fault insurancemay actually encourage anti-social behaviour, de-spite all the good intentions of its designers. Interms of automobile insurance, the anti-socialbehaviour is, of course, reckless driving. Econo-mists describe the effect as "moral hazard," and itcan be particularly acute under the conditions ofa public monopoly insurance provider.
A good way to illustrate "moral hazard" is byusing the well-documented fact that restaurantsinsured against fire burn down more often thanrestaurants that aren't. The reason is not that in-sured restaurant owners tend to be immoral ar-sonists. Rather, it is that the owners, knowing thatthey have insurance, may not take due care toprevent fires. They may cut costs on sprinklersystems and on grease cleaning schedules.
Proponents of no-fault insurance, however, arguethat moral hazard is not a factor in driving behavi-our. They point out that driving is such a complexactivity, requiring practically hundreds of driveractions per minute. They contend that "honestmistakes" rather than negligence account for mostaccidents; and, if we are all equally susceptible toaccidents, it is unfair to discriminate against thosewho do get into accidents.
Can "moral hazard" exist in the relationship be-tween driving and automobile insurance? Well,the empirical evidence from Quebec, New Zea-land, and Australia does indicate a link.
Economic theory also suggests there should be aconnection because price and demand are in-versely related. That is, if you raise the cost ofreckless driving, you will reduce the demand orthe likelihood of bad driving. A driver will curtail
3 I.R. McEwin, "No Fault and Road Accidents: Some Australasian Evidence," International Review of Law andEconomics, vol. 9,1989, pp. 13-24.
The Fraser Institute Health and Moral Hazards of No-Fault Insurancewww.fraserinstitute.org

PUBLIC POLICY SOURCES, NUMBER 2
the thrill of speeding or the convenience of driv-ing home drunk if he or she knows the cost of anaccident could prove catastrophic.
That some drivers are not constrained by pricedoes not invalidate the existence of moral hazard.In theory, insurance companies adjust for the dis-tribution of drivers on the risk-adverse-to-reck-less axis in their pricing of coverage premiums.They modify how their clients drive by raising thecosts of coverage to a point where it deters anti-social behaviour, yet is still affordable. A well-in-formed insurance market estimates the optimumbalance between risk and premiums by compilinginformation both on the risk characteristics of itsclients and on the likely range of awards paid outwhen accidents do occur.
This is where tort penalties for automobile inju-ries play a vital role in the efficient workings ofthe insurance market. Court awards for economicand personal losses provide a reliable guide to thetrue cost of an injury. The problem with awardsset under a no-fault insurance regime is that theyfail to reflect the complete cost of injuries both toindividuals and to society.
This failure under no-fault insurance to generatecomplete information on costs can, in turn, leadinsurers to under-price premiums which thus, ineffect, subsidizes reckless drivers. This is themoral hazard effect.
In the case of BC, no-fault insurance may add tothe existing risk of an induced moral hazard effect
created by a monopoly insurance provider, ICBC.A monopoly insurance provider, mandated bylaw not to fully differentiate risk in setting pre-mium prices for various client categories, alreadycharges low risk clients too much, and high riskclients too little. (The specifics of the interactionbetween a public monopoly insurance providerand no-fault insurance regime will be investi-gated in later Institute research.)
However long the answer, both experience andtheory suggests that no-fault insurance fails tomeet the grade of equity and efficiency. Awardsto victims are less than the true cost of their inju-ries. Hidden costs are passed on to either the leastable—the victims themselves—or the least sus-pecting—the taxpayer. Bad drivers are subsidizedat the expense of good drivers and, as a result,risky driving is rewarded. As reckless drivers areunchecked, accidents increase, and everyone endsup paying more.
As Sheldon has worked independently, his con-clusions and work do not necessarily reflect theviews of The Fraser Institute and its Directors. TheInstitute does, however, welcome his contribu-tion and hopes that it will shed important light onthis controversial topic. Public responses to thisdocument are welcome and should be addressedto Owen Lippert at The Fraser Institute.
—Owen Lippert
Health and Moral Hazards of No-Fault Insura The Fraser Institutewww.fraserinstitute.org

PUBLIC POLICY SOURCES, NUMBER 2
Executive Summary
This paper examines whether or not auto in-surance reform is appropriate for British Co-
lumbia. In recent months, BC's New DemocraticParty (NDP) government and the Insurance Cor-poration of British Columbia (ICBC), the publicprovider of insurance, have repeatedly claimedthat costs, particularly in terms of settling bodilyinjury claims, have been increasing at a rate overand above what one would anticipate given thegrowth in the number of drivers and the generallevel of inflation.
To substantiate their claims, ICBC contracted theconsulting firm KPMG to conduct a number ofstudies on its behalf. These studies examined thecost history of ICBC, and set out a number ofinsurance product changes that would help alle-viate the financial concerns of the corporation.The product reforms suggested by KPMG wereall variations of no-fault insurance which weredesigned to restrict access to courts and to containthe level of premiums at current levels. Further,Mr. Doug Allen was appointed in late 1996 tohead a commission that would look into autoinsurance reform. The conclusions of this com-mission were twofold.
The first conclusion was that a range of measuresshould be introduced to help reduce the level ofaccidents. Second, in terms of product reform,two options from the KPMG analysis were putforward. One option amounted to a pure no faultscheme, with access to the court system denied.The second option retained access to the courtsbut imposed a heavy deductible on pain and suf-fering awards. Both options increase the benefitscurrently available to at-fault drivers.
This study notes a number of concerns with re-spect to the analysis conducted by KPMG and theAllen Commission. Of primary concern is that thework of KPMG received severe criticism by oppo-
nents of no-fault insurance who claimed thatKPMG did not properly analyze the sources of thecost increases of ICBC, and further, that the costprojections provided by KPMG were based ondata that was not replicable in the absence of datafrom ICBC. Also, a question exists as to the extentof the so-called "financial crisis" at ICBC. More-over, a body of empirical evidence has been pub-lished which suggests that the introduction ofno-fault schemes in other jurisdictions has in-creased the number of accidents and fatalitiesthrough moral hazard effects. This later point wasnot acknowledged by either the Allen Commis-sion nor in any of the KPMG reports.
At the time of writing the NDP government ispondering whether or not to introduce a newinsurance product in BC. A host of possibilitiesexist for reform. In this article's conclusion, addi-tional cost saving measures are suggested, all ofwhich reduce the insurance coverage available toaccident victims. These measures include finingat-fault drivers a flat rate for each accident causedand imposing a significantly smaller deductibleon pain and suffering awards. The calculationsperformed with limited data suggest that a de-ductible of $10,000 on pain and suffering awardswould achieve significant savings for ICBC. Ad-ditionally, scope for additional savings is possiblewith the adoption of alternative dispute resolu-tion procedures, along with a number of ways inwhich ICBC manages its own affairs. The latterinclude better management of investment fundsand improved performance in collecting receiv-ables.
As has been widely acknowledged, including bythe Allen Commission, the only certain way toreduce insurance costs is by reducing the numberof motor vehicle accidents. No-fault insuranceschemes cannot by themselves contain the growthin insurance costs.
The Fraser Institute Health and Moral Hazards of No-Fault Insurance
www.fraserinstitute.org
PUBLIC POLICY SOURCES, NUMBER 2
Introduction
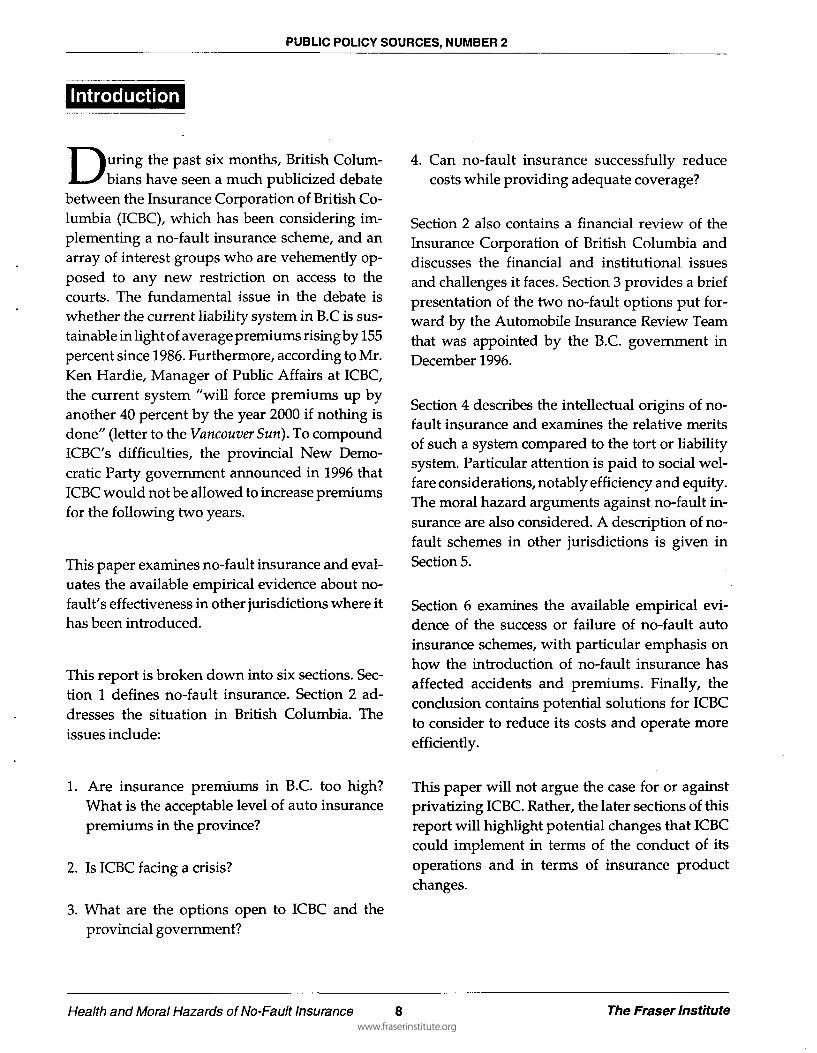
During the past six months, British Colum-bians have seen a much publicized debate
between the Insurance Corporation of British Co-lumbia (ICBC), which has been considering im-plementing a no-fault insurance scheme, and anarray of interest groups who are vehemently op-posed to any new restriction on access to thecourts. The fundamental issue in the debate iswhether the current liability system in B.C is sus-tainable in light of average premiums rising by 155percent since 1986. Furthermore, according to Mr.Ken Hardie, Manager of Public Affairs at ICBC,the current system "will force premiums up byanother 40 percent by the year 2000 if nothing isdone" (letter to the Vancouver Sun). To compoundICBC's difficulties, the provincial New Demo-cratic Party government announced in 1996 thatICBC would not be allowed to increase premiumsfor the following two years.
This paper examines no-fault insurance and eval-uates the available empirical evidence about no-fault's effectiveness in other jurisdictions where ithas been introduced.
This report is broken down into six sections. Sec-tion 1 defines no-fault insurance. Section 2 ad-dresses the situation in British Columbia. Theissues include:
4. Can no-fault insurance successfully reducecosts while providing adequate coverage?
Section 2 also contains a financial review of theInsurance Corporation of British Columbia anddiscusses the financial and institutional issuesand challenges it faces. Section 3 provides a briefpresentation of the two no-fault options put for-ward by the Automobile Insurance Review Teamthat was appointed by the B.C. government inDecember 1996.
Section 4 describes the intellectual origins of no-fault insurance and examines the relative meritsof such a system compared to the tort or liabilitysystem. Particular attention is paid to social wel-fare considerations, notably efficiency and equity.The moral hazard arguments against no-fault in-surance are also considered. A description of no-fault schemes in other jurisdictions is given inSection 5.
Section 6 examines the available empirical evi-dence of the success or failure of no-fault autoinsurance schemes, with particular emphasis onhow the introduction of no-fault insurance hasaffected accidents and premiums. Finally, theconclusion contains potential solutions for ICBCto consider to reduce its costs and operate moreefficiently.
1. Are insurance premiums in B.C. too high?What is the acceptable level of auto insurancepremiums in the province?
2. Is ICBC facing a crisis?
3. What are the options open to ICBC and theprovincial government?
This paper will not argue the case for or againstprivatizing ICBC. Rather, the later sections of thisreport will highlight potential changes that ICBCcould implement in terms of the conduct of itsoperations and in terms of insurance productchanges.
Health and Moral Hazards of No-Fault Insurance The Fraser Institutewww.fraserinstitute.org
PUBLIC POLICY SOURCES, NUMBER 2
Section 1: What is No-Fault Insurance?
A broad spectrum of auto insurance systemsare in place throughout North America and
the rest of the world. The range of systems isbordered by two polar positions. At one extremeis the so-called "pure liability system"; at the otheris a pure no-fault system.
Between the two polar systems lie a host of whatare commonly termed "partial no-fault schemes."Their broad characteristics include a combinationof both the liability (sometimes referred to as tort-based) and no-fault systems.
How do they differ? The pure liability systemallows the innocent victim (the driver who wasnot deemed to be at fault) full and unlimited ac-cess to the courts for the purpose of suing for anylosses, economic or otherwise, that have arisenfrom a traffic accident. On the other hand, in apure no-fault system, victims of auto accidentshave no access to the courts to obtain damages foreconomic and non-economic losses. Instead, allbenefits are determined by a set of predeterminedrules that are put in place by the insurance com-pany.
In addition, many no-fault systems have in placeeither a "verbal threshold" or a "monetary thresh-old." In a verbal threshold system, the right to sueis taken away in all but the most serious cases.Whether or not the injuries are considered seriousdepends on whether they meet some predeter-mined threshold. A verbal threshold may take theform of allowing a victim to sue provided that"dismemberment" or "significant and permanentloss of an important bodily function" has beenestablished. A monetary threshold system estab-lishes a monetary amount that medical costs mustexceed before the victim can pursue a liabilityclaim.
Section 2: The Insurance Corporation of British Columbia
This section will examine the financial perfor-mance of ICBC over the past two decades,
paying particular attention to the pattern of costs,claims, and premiums over this period.
Background
ICBC is a Crown Corporation which was createdby the Corporation of British Columbia Act in1973. It began operating in 1974 as a monopolyprovider of a comprehensive and universal autoinsurance regime for British Columbia. A report
by the Automobile Insurance Review Team citeda number of reasons for ICBC's creation. Manydrivers were said to have difficulty finding insur-ance with adequate coverage. Private insurerswere found not to honour policies after an acci-dent, or charged large premium increases follow-ing an accident. Finally, concerns existed that aportion of the premiums paid in B.C. were fund-ing jobs in insurance headquarters in Ontario.
4 British Columbia Ministry of Finance, Automobile Insurance Review, March 1997.
The Fraser Institute Health and Moral Hazards of No-Fault Insurancewww.fraserinstitute.org

PUBLIC POLICY SOURCES, NUMBER 2
Figure 1: Total ICBC Costs per Policy Written Adjusting for Inflation
800
C 700Si-t-»
i§ 6002b£ 500
IU
400
300
Total Costs Per Insured VehicleAdjusting for Inflation
Average Anpual Compounded Rate of [Growth
1975 to 1986: 2.27%j i i i i
1986 to 1991: 8.82% 11991 to 1995: 0.71%i i i I
1975 1977 1979 1981 1983 1985 1987 1989 1991 1993 19951976 1978 1980 1982 1984 1986 1988 1990 1992 1994
Source: ICBC Annual Reports and BC Stats.
What does ICBC insure?
ICBC is thought to control about 90 percent of theoptional insurance market. The mandatory cov-erage provided by ICBC includes third party lia-bility, underinsured motorist protection, and firstparty liability.
ICBC cost history: 1975 to 1995
Figure 1 shows the pattern of total ICBC costs perpolicy written, after adjusting for the effect ofinflation. Total costs are made up of claims relatedexpenses (costs of administering claims and pay-ments to claimants) and payments, including ad-ministration, road safety, traffic safety initiatives,commissions to insurance agencies, and premiumtaxes paid to government. In 1995, about 85 per-cent of total ICBC expenses were in the form ofpayments related to settling claims. The data sug-gest that generally, costs have increased, with the
largest increases taking place between 1986 and1991. Following 1991, total ICBC costs dipped be-fore showing increases of 2.84 percent in 1994 and4.83 percent in 1995. (Data for 1996 was not avail-able at the time of writing). Analysis of ICBC'sfinancial statements suggests that the corporationmade a net profit in all but three (1992,1993 and1987) of the past 15 years.
Why ICBC costs have risen
Generally, ICBC costs have increased since 1974 ata rate over and above that expected, given theincrease in the number of policies written andgeneral price inflation. Some reasons for this fol-low.
1. A well established link has been identifiedbetween the level of economic activity and dis-tances driven by the average motorist. A grow-ing economy will be reflected in increased
The optional coverage includes increased third party coverage, collision damage, comprehensive andspecified perils (fire, theft and windshield) and loss of use.
Health and Moral Hazards of No-Fault Insurance The Fraser Institutewww.fraserinstitute.org
PUBLIC POLICY SOURCES, NUMBER 2
Figure 2: Total ICBC Costs Per Autoplan Policy and Other EconomicIndicators (1975 = 100)
RON
700
600
500
400
300
200
100
Total Costs Per Autoplan Policy
GDP At Market Prices
Lagged Average Vehicle Prices(One Period)
Health Spending Per Capita
CPI For Vancouver
J L J L
1975 1977 1979 1981 1983 1985 1987 1989 1991 1993 1995
1976 1978 1980 1982 1984 1986 1988 1990 1992 1994
Source: ICBC Annual Reports and BC Stats.
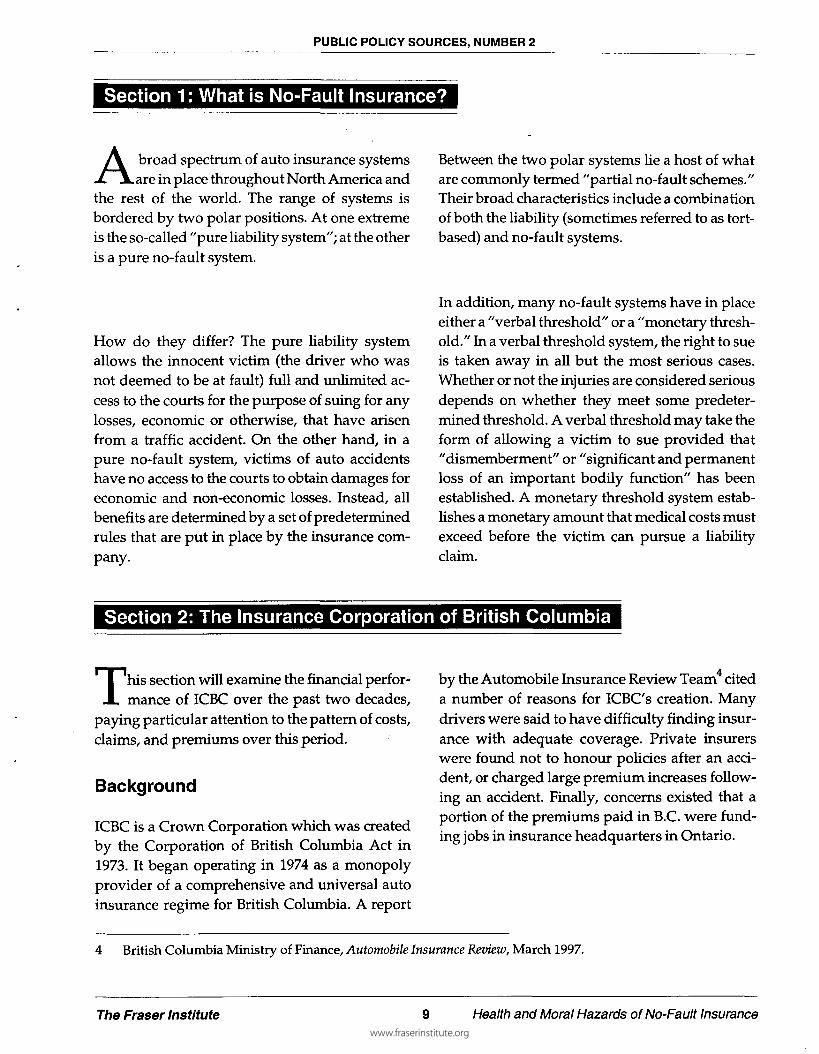
driving activity and, therefore, increases in thenumber of accidents and claims. Moreover, intimes of economic growth, more individualsare likely to be in the labour market, which willadd to the number of claims for wage loss.Another factor has been the increasing partici-pation of women in the labour market. Sincethe absolute number of participants in the lab-our market has increased, wage loss claims willrise faster than if the same number of peopleincreased their hours of work. Figure 2 showsthe close relationship between the ICBC totalcosts per policy written (net of inflation) andBritish Columbia's Gross Domestic Product.
2. One of the major costs facing ICBC is the repairand replacement of motor vehicles. Figure 2uses average vehicle prices as a proxy for aver-age vehicle repair costs. It shows that the in-crease in ICBC total costs has been closelymirrored by increases in average vehicleprices, lagged by one year. The undeniable fact
is that vehicles are being built with increasedsophistication and are far more likely than inthe past to include expensive gadgetry whichis costly to repair and replace.
3. A further factor that increases the costs facingICBC is the price of medical care. Not only hasthe cost of medical treatment increased, but therange of treatments (for head injuries and psy-chological injuries, for example) has increasedduring the past decade. There has also beenincreased recognition of soft tissue injuriesduring the past decade.
4. The level of crime against motor vehicles hasincreased. Stolen vehicle claims in B.C. wereapproximately 28,000 in 1996, compared withjust 4,876 in 1986.
5. The average cost of bodily injury claims hasincreased from about $12,500 in 1985 to $21,404in 1995. This increase is likely attributable to acombination of the factors alluded to in point 3.
6 Based on calculations performed by Gordon Adair of the B.C. Trial Lawyers Association.
The Fraser Institute 11 Health and Moral Hazards of No-Fault Insurancewww.fraserinstitute.org
PUBLIC POLICY SOURCES, NUMBER 2
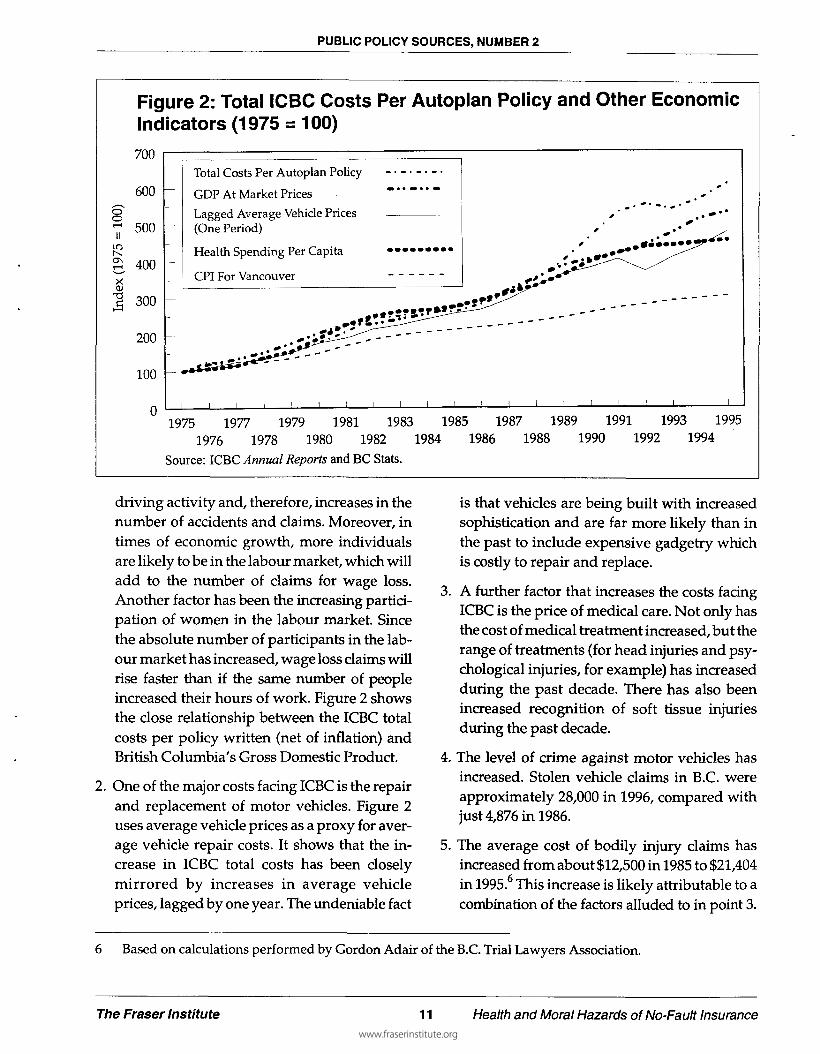
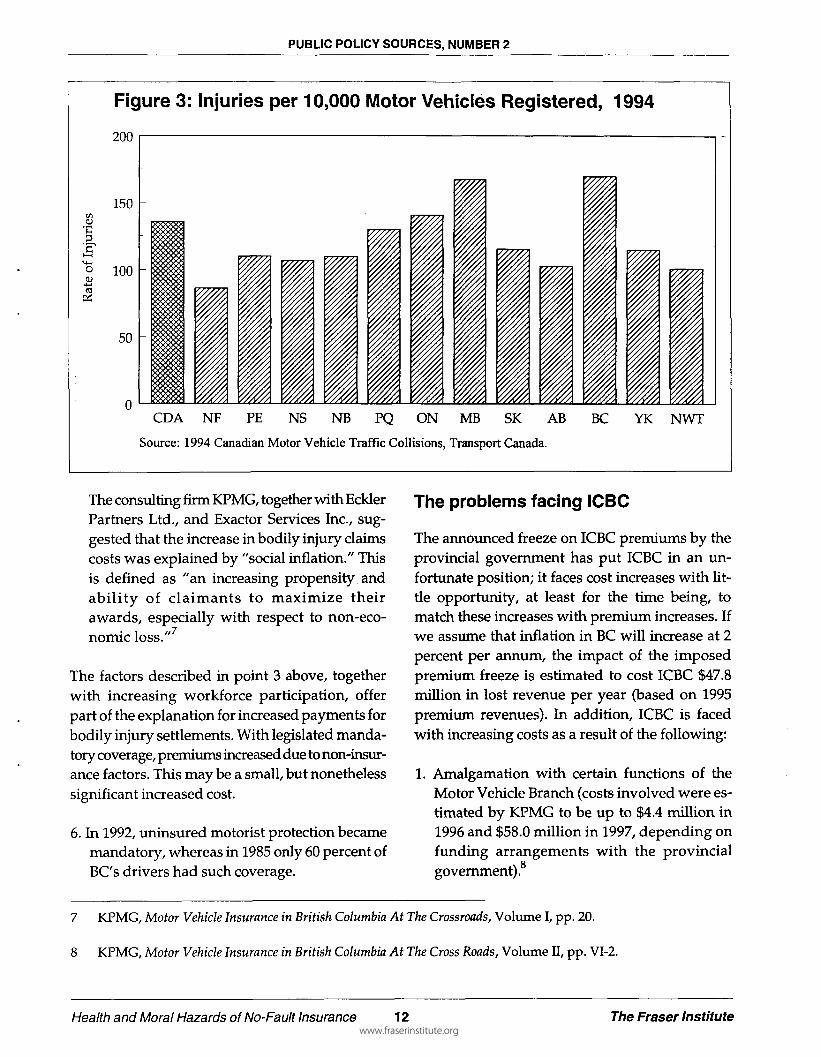
Figure 3: Injuries per 10,000 Motor Vehicles Registered, 1994
enOj
200
150
100
50
CDA NF PE NS NB PQ ON MB SK AB
Source: 1994 Canadian Motor Vehicle Traffic Collisions, Transport Canada.
BC YK NWT
The consulting firm KPMG, together with EcklerPartners Ltd., and Exactor Services Inc., sug-gested that the increase in bodily injury claimscosts was explained by "social inflation." Thisis defined as "an increasing propensity andability of claimants to maximize theirawards, especially with respect to non-eco-nomic loss."
The factors described in point 3 above, togetherwith increasing workforce participation, offerpart of the explanation for increased payments forbodily injury settlements. With legislated manda-tory coverage, premiums increased due to non-insur-ance factors. This may be a small, but nonethelesssignificant increased cost.
6. In 1992, uninsured motorist protection becamemandatory, whereas in 1985 only 60 percent ofBC's drivers had such coverage.
The problems facing ICBC
The announced freeze on ICBC premiums by theprovincial government has put ICBC in an un-fortunate position; it faces cost increases with lit-tle opportunity, at least for the time being, tomatch these increases with premium increases. Ifwe assume that inflation in BC will increase at 2percent per annum, the impact of the imposedpremium freeze is estimated to cost ICBC $47.8million in lost revenue per year (based on 1995premium revenues). In addition, ICBC is facedwith increasing costs as a result of the following:
1. Amalgamation with certain functions of theMotor Vehicle Branch (costs involved were es-timated by KPMG to be up to $4.4 million in1996 and $58.0 million in 1997, depending onfunding arrangements with the provincialgovernment).8
7 KPMG, Motor Vehicle Insurance in British Columbia At The Crossroads, Volume I, pp. 20.
8 KPMG, Motor Vehicle Insurance in British Columbia At The Cross Roads, Volume II, pp. VI-2.
Health and Moral Hazards of No-Fault Insurance 12 The Fraser Institutewww.fraserinstitute.org

PUBLIC POLICY SOURCES, NUMBER 2
2. ICBC has also incurred substantial expendi-tures on photo radar technology and otherroad safety initiatives. According to KPMG,expenditures on photo radar alone are ex-pected to be $43.2 million in 1996, and $33.7million in 1997. Other auto insurance provid-ers in B.C. are not contributing to accident pre-vention programs and safety measures,making for an uneven insurance playing field.
3. Premium taxes paid by ICBC increased from $7million in 1987 to $90 million in 1995. The in-troduction of the Goods and Services Tax(GST) has also put pressure on ICBC finances.
Other problems facing ICBC
1. B.C. has one of the highest motor vehicle casu-alty rates in Canada (see figure 3). In terms ofinjuries per 10,000 motor vehicles registered,B.C. has the worst accident rate in Canada. Interms of fatalities per 10,000 vehicles regis-tered, B.C. is equal to Alberta, and had fewer,proportionately, than the Yukon, Prince Ed-ward Island, Saskatchewan, and Quebec.
2. Data on traffic accidents clearly suggest thatyoung drivers (especially males under age 25)are far more likely to be involved in a collision
Q
than female or older drivers. (This may beattributed to a combination of limited drivingexperience and a higher propensity to drivecarelessly). However, ICBC is not allowed tocharge different premiums based on age, al-though premium discounts are in place forthose with a record of safe driving. In effect,therefore, the drivers in the lower risk classesare subsidizing the high risk drivers. (One canargue that high risk drivers would have moreincentive to drive carefully if higher premiumswere imposed on them early in their drivingcareers than at present.)
3. The emergence of Canadian Direct Insuranceas a direct competitor of ICBC has com-pounded the problems the corporation facesoperating within the constraints of non-dis-criminatory price setting legislation. ICBC willclearly lose good drivers if they are offeredlower premiums and similar coverage else-where. The logical conclusion is that ICBC willbe left with a smaller insurance pool contain-ing relatively more high risk drivers (who willnot get coverage from Canadian Direct Insur-ance), leading to further pressure on premiumlevels to rise.
4. An examination of ICBC's financial statementssuggests that the corporation's level of invest-ment income has been sufficient to offset thelosses that it has incurred in its underwritingcapacity in all but three of the past 11 years. In1995, investment income totalled $315 million,while underwriting losses were $253 million.The average return on investment income wasapproximately 7.4 percent in 1995. The invest-ment portfolio held by ICBC in 1995 amountedto $4.5 billion and was composed of almost 90percent bonds, with equities representing lessthan 5 percent of the value of the investments.The question arises as to whether or not ICBCis able to manage its funds in a manner thatwill maximize returns over the long term. A 1percent increase in the average return on in-vestment in 1995 would have given ICBC in-creased revenues in excess of $40 million.
Is no-fault insurance or majorproduct reform necessary for BC?
ICBC's financial statements suggest that claimscosts will increase at a rate above the level ofinflation, even after adjusting for the number ofinsured vehicles. Taking into account the pre-
Source: 1994 Motor Vehicle Traffic Accidents, Motor Vehicle Branch, Ministry of Transportation andHighways.
The Fraser Institute 13 Health and Moral Hazards of No-Fault Insurancewww.fraserinstitute.org

PUBLIC POLICY SOURCES, NUMBER 2
Table 1: Savings to ICBC from a Reduction in Property Damage, Collisions, Fatalities, andBodily Injuries
Average Cost to Number of Estimated Decrease In the EstimatedICBC in 1995 Claims Settled Number of Claims if Savings to ICBC
in 1995 Accidents or Property for a 1%Damage Incidents Were Reduction in
Reduced by 1% Accidents
Per Property DamageClaim
$2,288 226,009 2,260 $5,170,880
Per Bodily Injury $20,509 38,829 388 $7,963,440
Per Fatality $100,000 405 $405,000
Source: ICBC, "Average costs to ICBC for fatalities, bodily injuries, and property damage accidents." Data isfor 1995. Internal data obtained from ICBC, author's calculations.
mium rate freeze imposed by the NDP govern-ment in 1996, is product reform necessary to safe-guard ICBC's financial viability?
A number of options exist.
Opponents of no-fault insurance suggest thatproduct reform is unnecessary, and that if ICBCneeds to contain costs it should concentrate on thesource of the problem at hand, that is, reducingthe number of motor vehicle accidents. In a reportconducted by the Auto Insurance Review Team,10
a range of accident prevention measures wererecommended, including improved driver train-ing, increased measures to combat drunk driving,graduated licensing, and implementation of acomprehensive traffic and safety education pro-gram within the B.C. school system. Using dataprovided by ICBC, it is estimated that a 1 percentreduction in bodily injuries, fatalities, and prop-erty damage incidents could save at least $13 mil-lion per year. Table 1 gives the details.
In addition, KPMG noted that "significant" butunquantified savings could be gained if ICBC
adopted improved dispute resolution processes,extended centre hours in urban locations, andused non-office based adjusters or estimators.Also, KPMG estimated that ICBC could save asmuch as $22 million in the form of administrativeand efficiency improvements. An internal ICBCstudy also reported that procedures to combatfraud and exaggerated claims could result in sav-ings of between $70 million and $100 million.
Additional estimates of cost savings that ICBCcould make were included in the report of theAutomobile Insurance Review Commission. Inthis document, accident prevention, theft andfraud reduction, and service enhancement changes(in product distribution, moving from lump sumto structured settlements, and using second handparts) were estimated to have the potential ofsaving ICBC $100 million in 1998.
The Automobile Review Commission also esti-mated that ICBC could save money by im-plementing road design alterations. Improvedvehicle design to limit theft and fraud could alsoreduce ICBC's costs.
10 Automobile Insurance Review, March 1997.
Health and Moral Hazards of No-Fault Insurance 14 The Fraser Institutewww.fraserinstitute.org

PUBLIC POLICY SOURCES, NUMBER 2
Section 3: Alterations in the Insurance ProductRecommended by the Automobile Insurance Review Team
The Automobile Insurance Review Teamheaded by Doug Allen Q.C, recommended
the government adopt one of two options as ameans of reducing ICBC's costs while keepingaverage insurance premiums constant at $975through the year 2000.
5. Rehabilitation and medical expenses are to beincreased from $150,000 to no lifetime financiallimit for all accident victims, regardless of fault.
Product Option Two
Product Option One
The first option proposes a measure to alter thecurrent liability system. A distinction remains be-tween the at-fault and innocent claimants, andaccess to the courts is allowed when no settlementarises from mediation or negotiation. However,the following important changes to the currentsystem are proposed:
1. Pain and suffering awards are subject to a de-ductible of $35,000.
2. Wage loss awards are to be tied to net income,not gross income as is currently the case.Awards will also be reduced if the claimantgets compensation from the Canada PensionPlan or Employment Insurance.
3. The provision of cost of care awards is to bemanaged by the insurer, with all persons beingtreated the same, regardless of fault.
4. Benefits for at-fault drivers are to increase to amaximum of $400 per week from the presentmaximum of $300 per week.
The second product option recommended by theAllen Commission is a pure no-fault systemwhich replaces the right of access to the courtswith an alternative dispute resolution process. Nodistinction is made between the at fault claimantand the innocent victim. The main features of thisplan are as follows:
1. Income replacement benefits are set at 100 per-cent of net income to a maximum of $650 perweek.
2. There is no lifetime limit on medical and reha-bilitation care.
3. There is no compensation for pain and suffering,and limited compensation for loss of function.
4. Wage loss awards will be tied to net income,not gross income as is currently the case.Awards will also be reduced if the claimantreceives compensation from the Canada Pen-sion Plan or Employment Insurance.
The Fraser Institute 15 Health and Moral Hazards of No-Fault Insurance
www.fraserinstitute.org

PUBLIC POLICY SOURCES, NUMBER 2
Section 4: Why No-Fault Is Being Considered In British Columbia
The intellectual origin of no-faultinsurance
Supporters of no-fault insurance suggest thatit has a number of advantages over tort liabil-
ity compensation schemes. In response to con-cerns that tort systems were inefficient and unfair,no-fault schemes were considered to offer a num-ber of advantages. As Witt and Urrutia (1983) havenoted, no-fault schemes have the potential to:
1. Provide adequate compensation for economiclosses to any injured accident victims, regard-less of fault.
2. Reduce relative costs or increase relative bene-fits to consumers.
3. Reduce litigation and investigation costs.
4. Improve the predictability of relative loss costsor prices for auto insurers because they wouldhave more information on their potential claims.
Bruce (1984)11 suggested that a number of propo-nents of no-fault insurance schemes believe thehypothesis that the threat of tort action or tortpenalties cannot improve driver behaviour or deterdrivers from causing accidents. They gave a num-ber of reasons for this possibility. First, it is diffi-cult to assess "cause" in many accidents. Second,penalties do not alter driver behaviour and, fi-nally, liability insurance removes the impact oftort penalties from drivers who cause accidents.
Those who believe the hypothesis assert that driv-ing is a complex task, and that drivers are re-
quired to make between 1 and 3 decisions persecond, to monitor 10 or more highway and trafficevents per second, and to undertake 30 to 120driver actions per minute.1 The hypothesis hasbeen refuted by insurance adjusters (see, for ex-ample, Marryot 1968) and by the fact that, asBruce noted, the vast majority of accident casesare settled out of court.
It has been suggested that tort penalties are effec-tively removed for drivers who cause accidentsbecause they are protected from their actions withliability insurance. If true, one might expect driv-ers to exert moral hazard type behaviour, or justplain behave irresponsibly. This suggestion hasbeen eloquently addressed by Bruce (1984), whoessentially showed that "safe driving discounts"allow, in many jurisdictions, significant reduc-tions on premiums relative to the regular premi-ums, and that the penalties for drunk driving andother serious driving offenses are not trivial.
Economic theory indicates that price and quantitydemanded are inversely related. That is, for allother factors held constant, an increase in the priceof driving will cause bad driving to decrease.Conversely, one would probably expect bad driv-ing to increase if the cost of bad driving (the threatof increased premiums or the value of time that anindividual guilty of bad driving would have tospend in attending court or in participating in thelegal system) decreased. Under a no-fault system,therefore, the costs of driving badly will decrease.
Some argue that it is simply not rational for anindividual to drive dangerously. The potential
11 The Deterrent Effects of Automobile Insurance and Tort Law: A Survey of the Empirical Literature. Law andPolicy, January 1984.
12 Platt, F. (1962) "Traffic Safety Research." Madrid: Fourth World Meeting, International Road Federation, October.
Health and Moral Hazards of No-Fault Insurance 16 The Fraser Institute
www.fraserinstitute.org
PUBLIC POLICY SOURCES, NUMBER 2
threat of serious injury or death means that wedrive as well as we can. This is important becauseit suggests that moral hazard does not exist, anddriving behaviour would not change even underthe presence of different driver incentives. Fortu-nately there is evidence that finds that individualswill evaluate the expected loss in well being fromdangerous driving (potential fines, premiums, in-juries, or fatalities, for example) in relation to theexpected gain in well being from dangerous driv-ing (this could be derived from the "thrill" of fastdriving or the satisfaction gained from reachingan appointment on time, for example). In calculat-ing expected gains or losses in satisfaction, oneshould evaluate the value of the gain or loss to-gether with the probability of the event occurring.Platt (1962) estimated that the probability of afatal accident for a 20 minute urban trip as beingin the range of 1:1 million to 1:1.5 million.
Whether one supports the notion of no-fault in-surance depends on a number of critical parame-ters. If one believes that most accidents simplycannot be helped, and are merely the result of an"honest mistake," no-fault insurance, by provid-ing the same compensation to all victims regard-less of fault, is appealing. Not only are allindividuals compensated in the same way, but, intheory at least, costs of settlements can be signifi-cantly reduced if access to the courts is denied andsettlements for economic and non economiclosses are restricted. Moreover, it has been sug-gested that significant savings from a reduction inlawyers fees and from faster processing of claimscan be accrued under a rules-based system. Thesesavings, if realized, can then be used to containthe growth of premiums.
For those of the opinion that auto accidents are inthe main caused by negligence, tort-based insur-ance systems provide the correct incentives for
drivers to take due care and attention. Thosefound to be at fault receive significantly fewerbenefits (in terms of income loss payments, forexample) than the innocent victims who have re-course to the court system to seek payments tofully compensate them for their losses as a resultof the accident.
Transactions costs and adverseselection
In the operation of an insurance market, it is nec-essary to incur certain administrative costs. Con-tracts have to be drawn, buyers and sellers haveto be brought together, and a set of rules andregulations must be written. Other costs are alsoincurred. These include the costs to the seller ofthe insurance contract of assessing the degree ofrisk presented by a potential buyer, or the proba-bility that the event against which the individualis insuring will actually occur.
In the case of auto insurance, there are a numbervariables which may influence the probability ofa car accident occurring. These factors include thedistances driven by the policy holder, and theamount of driving experience of the insured. (Ageis a good proxy for this.)
In addition, the probability of an accident will beinfluenced by a number of factors that are withinthe control of the policy holder, including, forexample, the amount of care taken by the driver,and whether or not the driver decides to drivewithin the posted speed limits.
The problem facing insurance companies be-comes one of efficiently assigning to each policyholder the risk class to which he or she belongs forthe purpose of setting a "fair" premium. Thepractical difficulties of assessing risk for each in-
13 Fair in this context is a technical term which means that, net of administrative costs, payouts on policies areequal to what is paid in premiums.
The Fraser Institute 17 Health and Moral Hazards of No-Fault Insurancewww.fraserinstitute.org

PUBLIC POLICY SOURCES, NUMBER 2
dividual policy holder necessitates insurancecompanies to group policy holders into "riskclasses," which are based on the results of statisti-cal analysis of accident rates for policy holders byfactors such as age and gender. In a competitivemarket, any of the low risk individuals who arefaced with a premium that they feel is inappropri-ate and is above what they are willing to pay to berelieved of their risk will choose not to buy insur-ance from the company, but instead, seek it else-where. If a significant number of low risk driversfollow this behaviour, the insurance companywill be faced with relatively more high risk indi-viduals in their insurance pool, which will lead toincreased premiums, and thus encourage evenmore low risk drivers to leave the pool. This pro-cess is known as adverse selection, in that the aver-age premium, which is unfair to good drivers, willdiscourage them from including themselves inthe insurance pool. Unfortunately then, the peo-ple left in the insurance pool are made up of themost risk averse "low risk" drivers, and the highrisk drivers who will be happy to pay relativelyhigh premiums because they know that there is agreater probability that they will be involved in anaccident.
Moral hazard
With respect to driver behaviour, economists usethe term "moral hazard" to describe the negativeeffect that insurance has on an individual's incen-tives to avoid losses. Moral hazard describes thesituation that arises when insurance has a detri-mental effect on the care an individual takes toprevent loss. In the example of car insurance,moral hazard exists if the purchased insurancelessens an individual's incentives to drive safely.As discussed by Winter (1992), for moral hazardto be present, there are two necessary conditions.First, the insured risk is influenced by the deci-
sions taken by an individual after the insurancecontract is signed. Second, the care and activitylevels of the individual cannot be costlessly spec-ified in the insurance contract and enforced by theinsurer. Clearly, both of these conditions are pres-ent in the automobile insurance industry. Thisleads to the conclusion that driver behaviourwhich reflects moral hazard is possible.
Social welfare implications ofno-fault insurance
From the social welfare standpoint, the centralconsideration boils down to whether net benefitsto society are maximized in a no-fault system or aliability insurance scheme. !14 A£\asalreadybeennoted, supporters of no-fault insurance point tobenefits that can be gained in administeringclaims in a more timely fashion without lawyers.On the other hand, supporters of liability systemspoint out that no-fault insurance systems, by re-moving penalties for those at fault in motor vehi-cle accidents, can lead to increased accidentsbecause of moral hazard concerns. This is seen asimposing additional costs on society over andabove any savings that may be realized throughadministering claims in a rules-based system.When evaluating no-fault schemes, one shouldalso include the impact that thresholds may im-pose on the claims process. Claimants who arenear to the injury threshold may seek advice as tohow they can increase their claim to become eligi-ble for compensation.
Is no-fault insurance fair?
A further consideration in evaluating no-faultand liability-based systems lies in the principal offairness. In particular, are victims of traffic acci-dents treated fairly in a rules-based system?Under a tort system, the driver who was not at
14 R.A. Devlin, (1993), "Automobile Insurance in Ontario: Public Policy and Private Interests," Canadian PublicPolicy, XIX:3, pp. 298-310.
Health and Moral Hazards of No-Fault Insurance 18 The Fraser Institutewww.fraserinstitute.org

PUBLIC POLICY SOURCES, NUMBER 2
fault has the ability to seek compensation throughthe courts if a settlement cannot be reached withthe insurance company through arbitration ormediation. There are several well documentedcircumstances where no-fault schemes have comeunder criticism.15 They include:
1. Payments for loss of enjoyment of life (pain andsuffering) are often reduced severely underno-fault schemes (often through the use ofmonetary or verbal thresholds).
2. Individuals who are seriously injured while infull time education, but do not have any recordof full time, regular employment, are oftentreated as having lost earnings on the basis that
they would have earned an "average" salary.This is the case in Saskatchewan, for example.Therefore, compensation does not reflect earn-ings potential.
3. A person in full time employment earning a netsalary in excess of the set limit on income re-placement benefits will not be compensatedfully for their loss of earnings.
4. Payment under a fixed compensation schememay under compensate individuals who haveirregular work patterns or who are self em-ployed. Recognition of potential earnings ofsomeone in a business that is improving doesnot occur in no-fault schemes.
Section 5: No-Fault Insurance in Other Jurisdictions
Quebec
Quebec was, until recently, the only jurisdictionin North America that had a pure no-fault system.It was introduced in 1978. Quebec, like BritishColumbia, has a government monopoly supplierof auto insurance. As described earlier, this sys-tem has eliminated the right to sue of all victimsof auto accidents. British Columbia, Alberta, andthe Maritime provinces have an add-on no-faultauto insurance system. In British Columbia, allaccident victims (regardless of fault), are entitledto a set of benefits that include the provision of upto $150,000 in medical and rehabilitation ex-penses, and up to $300 per week (or 75 percent ofgross income) as compensation for lost income.The right to sue is "added on" to the no-faultbenefits that all victims receive. Innocent victims
can seek redress through the courts to obtain theirfull wage loss and other payments, including upto $250,000 for "pain and suffering" payments inaddition to compensation for cost of care.
Manitoba and Saskatchewan
Manitoba is the second jurisdiction in NorthAmerica that currently has a pure, no-fault insur-ance system. It was implemented on March 1st,1994. Insurance is provided by a monopoly sup-plier, the Manitoba Public Insurance Corporation.On January 1st, 1995, Saskatchewan GovernmentInsurance, the public provider of auto insurancein Saskatchewan, instituted a no-fault auto insur-ance scheme. The details of this particular schemewill not be surveyed here,16 other than that it isnoted that the scheme includes provisions for re-
15 See Carr (1996), for example.
16 See PIPP, A Personal Injury Plan Update, Volume 1, Issue 1, March 1996, a newsletter about the PersonalInjury Protection Plan introduced by Saskatchewan Government Insurance.
The Fraser Institute 19 Health and Moral Hazards of No-Fault Insurance
www.fraserinstitute.org

PUBLIC POLICY SOURCES, NUMBER 2
habilitation and medical expenses, income replace-ment benefits, death benefits, and permanent im-pairment benefits. In Saskatchewan, the right tosue for losses is limited to special circumstances.
Ontario
Ontario introduced no-fault insurance under averbal threshold no-fault system in 1990 and, in1994, the right to sue for economic loss was com-pletely eliminated. In November 1996, legislativechanges in Ontario were introduced which in-
Table 2: Summary of Changes included in Bill 59 in Ontario
Right to Sue forEconomic Loss
Right to Sue—Pain andSuffering
Income Replacement
Medical, Rehabilitation &Attendant Care
Indexation
Death
Funeral
Bill 164 (BeforeNovember 1st, 1996)
Not allowed
Tort access was onlyallowed to those withvery serious injuries.
Pays up to $1,000 perweek.
Pays up to $1 million tocover medical andrehabilitation expensesand depending on theinjury, $3,000, $6,000 or$10,000 per month forattendant care expenses.
Included
Based on deceasedperson's income, thisbenefit pays a minimumof $50,000 to a maximumof $200,000 to a survivingspouse and $10,000 to eachsurviving dependant.
Pays $6,000
Bill 59 (After November1st, 1996)
Allowed
Tort access was onlyallowed to those withvery serious injuries.
Pays up to $400 per week.
Pays up to $100,000 tocover medical andrehabilitation expenses andup to $72,000 forattendant care expenses.For catastrophic injuries,pays up to $2 million for allmedical, rehabilitation, andattendant care expenses.
No coverage
Pays $25,000 to asurviving spouse and$10,000 to each survivingdependent.
Pays $6,000
After November 1,1996
As per Basic Policy
Tort access was onlyallowed to those withvery serious injuries.
You can purchase addedcoverage in increments of$200 per week to provideup to $1,000 per week ofcoverage.
You can purchase anadditional $1 millioncoverage.
You can purchaseadjustments to reflect costof living increases.
You can purchaseadditional coverage up to$50,000 to a survivingspouse and $20,000 toeach survivingdependant.
You can purchase anadditional $2,000 ofcoverage.
Source: Zurich Canada.
Health and Moral Hazards of No-Fault Insurance 20 The Fraser Institute
www.fraserinstitute.org

PUBLIC POLICY SOURCES, NUMBER 2
eluded restoring the right to sue for economiclosses, and a sharp reduction in the level of maxi-mum allowable income replacement benefitsfrom $1,000 per week to $400 per week. Thesechanges are outlined in Table 2.
The United States
Nine American states currently have some formof no-fault insurance. Michigan and New York,for example, have a verbal threshold systemwhich allows access to the tort system providedthat victims' injuries are deemed to be sufficientlyserious, as defined by the law in each state. Inter-estingly, three U.S. states (Pennsylvania, Ken-tucky, and New Jersey) have a combined choicesystem, which allows the purchaser of auto insur-ance to choose between a no-fault and a tort basedsystem. Purchasers of the no-fault plan are notallowed to sue for damages unless their injuriesexceed the threshold level. A price differential hasbeen set for the two policies.
Australia and New Zealand
No-fault insurance was introduced in New Zea-land in 1974 and in three Australian states—Vic-toria (1974), Tasmania (1976), and NorthernTerritory (1979). New Zealand and Northern Ter-ritory abolished the right to sue altogether, whileTasmania and Victoria placed restrictions on theright to have access to the courts.
In Victoria, the Transport Accident Commissionbecame the sole provider of transport accidentpersonal injury insurance, providing access to thecourts by a combination of both descriptive andmonetary thresholds depending on the circum-stances surrounding each individual accident. InNew Zealand, all victims of accidents can apply toa government body for accident compensation.
Section 6: The Empirical Evidence Related to the Impactof the Introduction of No-Fault Insurance
Traffic accidents and fatalities over 40 explanatory variables. These variables in-clude:
Quebec
In an earlier survey, Sheldon (1996) examined theresearch that has been conducted regarding theimpact of the introduction of no-fault insuranceon the number of accidents—fatal and non-fatal—and on the level of premiums. Two comprehens-ive empirical studies have been conducted toassess the impact of the introduction of a pureno-fault system in Quebec in 1978. Gaudry (1992)used a comprehensive econometric model usingmonthly data from 1956 to 1982 which included
• gasoline and diesel prices
• the price of vehicle maintenance
• the quantity of personal and utility vehicles
• the proportion of small cars
• the proportion of cars equipped with a safetybelt
• speed limit reduction and compulsory beltuse introduced in 1976
• breathalyser law introduced in March 1973
The Fraser Institute 21 Health and Moral Hazards of No-Fault Insurance
www.fraserinstitute.org

PUBLIC POLICY SOURCES, NUMBER 2
• higher penalties for driving infractions initi-ated in April 1982
• police patrol frequency arid strikes
• urban transit strikes
• intercity bus strikes
• weather conditions
• alcohol and drug consumption
The results suggested that fatalities increased by6.8 percent after the introduction of no-fault in-surance. Of this nearly 7 percent increase, 3.3 per-cent is attributed to the impact of a flat-ratedpremium structure.
Devlin (1992), using econometric techniques, buta different econometric model, arrived at resultsthat were similar in magnitude to Gaudry's.Using data from Ontario and Quebec, Devlin in-cluded the following independent variables,among others, to model the no-fault experience:
• The proportion of male drivers under the ageof 25
• The total number of vehicles driven
• The decrease in the legal drinking age in bothprovinces
• The enforcement of seat belt legislation
• A time trend
Devlin found that the number accidents involvingbodily injury increased by about 9.6 percent afterthe introduction of no-fault insurance.
Australia and New Zealand
McEwin (1989) estimated the impact of the intro-duction of pure no-fault schemes in New Zealand(1974) and in the Northern Territory in Australia(1979). In this study, fatal accidents were found toincrease by up to 16 percent after no-fault insur-ance was introduced. The explanatory variables
adopted by McEwin to explain road fatalities in-cluded variables to measure police force strength,population, the quality of highways, the propor-tion of motorcycles in each jurisdiction, the pro-portion of the population between the ages of 17and 25, expenditures on alcohol, average weeklyearnings, and the number of kilometres driven.
The United States
Five studies were examined which estimated theimpact of the introduction of no-fault schemes inthe United States. Two studies found no signifi-cant increase in the number of accidents, whilethree studies concluded that accident rates in-creased by between 2 and 15 percent. Given that amyriad of so called partial no-fault schemes wereintroduced in the United States (with some statesadopting very low monetary thresholds and otherstates adopting verbal thresholds), it is not sur-prising that the empirical findings with respect tothe impact of the introduction of no-fault insur-ance and the number of accidents was mixed.
Conclusion
A body of empirical evidence exists which showsthat in areas where pure no-fault insuranceschemes have been introduced, fatal accidentsand injuries have increased. This supports thecontention that moral hazard does exist in thearea of auto insurance.
No-Fault Insurance Schemes andPremium Levels
The United States
Five studies which were concerned with the rela-tionship between no-fault insurance schemes andinsurance premiums were examined. One studyfound moderate increases in one jurisdiction—Florida—while a different study found large reduc-tions in premiums in another—Massachusetts.Other studies found that no-fault insurance in-
Health and Moral Hazards of No-Fault Insurance 22 The Fraser Institute
www.fraserinstitute.org

PUBLIC POLICY SOURCES, NUMBER 2
creased premiums and/or total bodily injury losscosts. For instance, Johnson, Flanagan, andWinkler (1992) examined data from 47 Americanstates from 1974 to 1985. Their findings suggestedthat when provision was made for medical pay-ments, no-fault insurance led to increased totalbodily injury loss costs.
As table 3 indicates, of the 15 states that had thehighest increase in average liability premiums be-tween 1989 and 1994, 10 had some form of no-fault insurance scheme operating.
The information outlined above suggests that theUS experience of no-fault insurancehas been less than successful in reduc-ing premiums. Also of interest is thatno US state has adopted no-fault insur-ance since 1976. On the other hand,since 1989, four states have repealedtheir mandatory no-fault laws.
Canada
Unfortunately, because Saskatchewanand Manitoba introduced no-fault in-surance schemes as recently as 1994,only limited data are available aboutthe impact of these schemes on premi-ums and accident rates. To this author'sknowledge, no comprehensive statisti-cal analyses have been conducted toassess the impact of the introduction ofno-fault insurance in Manitoba, Sas-katchewan or Ontario, where no-faultinsurance was introduced in 1990.
Table 4 details the percentage increaseor decrease in the level of auto insur-ance premiums in the Canadian prov-inces that have no-fault insurance,together with changes in BritishColumbia's premiums. Taken as theystand, the data seem to indicate thatQuebec and Ontario have had sharp
increases in their levels of average premiumssince 1993. Manitoba, Saskatchewan, and BritishColumbia have also seen relatively modest in-creases, although Saskatchewan has had no pre-mium increase since 1993. Obvious difficultiesarise in making direct comparisons between areasthat exhibit stark differences in their geographi-cal, environmental, and economic characteristics(such as weather conditions, population density,and economic growth). The problem is furthercompounded given that, with the exception ofOntario, insurance is provided by a governmentrun monopoly. Political influences have played asignificant part in the price setting process.
Table 3: Insurance Regimes and Premiums in theUnited States: States with the Highest Growth inAverage Liability Premiums, 1989-1994
State
Texas
Massachusetts
South Dakota
Nebraska
Utah
Hawaii
West Virginia
Kentucky
New Mexico
Rhode Island
Colorado
New York
Arkansas
Delaware
Wyoming
Insurance Regime
optional no-fault
mandatory no-fault
mandatory no-fault
tort
mandatory no-fault
mandatory no-fault
tort
optional no-fault
tort
tort
mandatory no-fault
mandatory no-fault
optional no-fault
optional no-fault
tort
Increase in AverageLiability Premiums
69.0%
68.9%
64.2%
63.7%
59.2%
63.7%
57.6%
57.2%
52.2%
50.0%
49.8%
49.2%
47.1%
46.9%
46.0%
Source: National Association of Insurance Commissioners (1996).
The Fraser Institute 23 Health and Moral Hazards of No-Fault Insurancewww.fraserinstitute.org

PUBLIC POLICY SOURCES, NUMBER 2
Significant problems arise if one attemptsto draw conclusions about whether apattern emerges between the presenceof no-fault insurance, the type of insur-ance provider (public or private), andthe level of average premiums. Onemust take extreme care to ensure thatthe level of insurance coverage is thesame across jurisdictions and must takeinto account a multitude of economicand non economic factors that may havean impact on premium levels. Given thelack of data, the question of how insur-ance delivery systems affect premiumswill not be analyzed in detail here.
Table 4: Percentage Increase or Decrease in AutoInsurance Premiums in B.C. and No-Fault Provincesin Canada
1993 1994 1995 1996 Total
B.C. 9.5 3.2 1.8 15
Quebec 35 35
Ontario 9.2 11.8 11.3 -4.7 29.5
Manitoba 9.7 -2 -1 6.1 12.9
Saskatchewan 4.75 0 0 0 4.75
Note: Negative numbers indicate a decrease in premiums.Source: KPMG Consulting Group as cited in the Vancouver Sun,"Demystifying No-Fault Insurance," by Tom Barrett, Feb. 26,1997, p. B4.
The impact of the introductionof no-fault insurance in Manitoba
Highlights from recent annual reports of the Man-itoba Public Insurance Corporation include:
1. The average cost per claim increased by 5.4percent during the 16-month period endedFebruary 29th, 1996. The average cost perclaim fell by 5.5 percent in the 12 months endedOctober 31,1994.
2. The underwriting loss during the 16-monthperiod ended February 29th, 1996 was$151,072 million. The underwriting loss in the12 month period ended October 31st, 1994, was$63,506 million.
3. The loss for the year during the 16-month pe-riod ended February 29th, 1996 was $58,045
1 ry
million. The gain for the 12 month periodended October 31st, 1994 was $6,909 million. Apayment of $51.8 million dollars was set asideto cover bodily injury claim costs held overfrom the tort system.
4. If one adjusts for the 16-month reporting pe-riod,18 fatalities increased by 10.6 percent duringthe year after the introduction of no-fault in-surance, and increased by 9.9 percent during the12-month period ended October 31st, 1994.The number of injuries fell by 18 percent and 9.7percent respectively during the same two timeperiods. Note that injuries and fatalities are asreported by Manitoba Public Insurance. Thedata do not necessarily imply that injuriesfrom traffic accidents have fallen, merely thatreported injuries have fallen because of the re-duced incentives to file a claim under the no-fault insurance scheme.
5. Operating Expenses increased from $30,081million in the year ended October 31st, 1994 to$50.97 million in the 16-month period endingFebruary 29th, 1996. Using a factor of 0.75(12/16) to adjust for the different length of thereporting period in the financial statements,implies that the operating expenses for the 12-month period after October 1st were $38,228million. Therefore, operating expenses in the
17 The 16-month reporting period was as a result of a change in the financial year end.
18 This was achieved my multiplying by a factor of 12/16.
Health and Moral Hazards of No-Fault Insurance 24 The Fraser Institutewww.fraserinstitute.org

PUBLIC POLICY SOURCES, NUMBER 2
first 12 months after the introduction of no-fault insurance in Manitoba went up by anestimated 27.1 percent.
6. Finally, the value of claims expenses duringthe 16-month period ended February 29th,1996 was $57.64 million. The value of claimsexpenses incurred during the 12 month periodended October 31st, 1994 was $40,203 million.Adjusting the data by a factor of 0.75 yields theresult that claims expenses increased by 7.53percent between the two reporting periods.
The evidence to date may be interpreted to revealthat no improvement in the underlying economicperformance of the company has taken place. Ofcourse, only time will reveal whether or not no-fault insurance has improved the financial statusof the insurance provider in Manitoba.
No-fault insurance inSaskatchewan
Highlights from the 1995 Annual Financial Reportof Saskatchewan Government Insurance include:
1. Net Income for the year ended December 31st,1995, was $3.5 million. This compares with anet loss of $93.8 million in 1994 and a net lossof $18.8 million in 1993.
2. Administrative expenses fell by $744,000 to$20,634 million in 1995. This represents a de-cline of 3.48 percent compared to 1994.
3. The value of claims incurred fell to $333.3 mil-lion from $406.6 million between 1995 and1994. This represents a reduction of 18 percentin 1995 relative to 1994.
The above data suggests that Saskatchewan Gov-ernment Insurance did, indeed, improve its finan-cial position in 1995. The main reason for thisimprovement was not from reduced administra-tive expenses, but from a sharp reduction in thenumber of injury claims submitted.
Table 5: Insurance Premiums andInsurance Regimes
AveragePremium
($)
Vancouver 1,434
Toronto 1,794
Montreal 1,759
Calgary 1,482
Edmonton 1,482
Ottawa 1,236
Halifax 1,209
Moncton 1,126
Winnipeg 871
Charlottetown 786
Regina 774
St John's 1,677
Insurance Regime
Add-On No-Fault
No-Fault
Pure No-Fault
Tort
Tort
No-Fault
Add-On No-Fault
Add-On No-Fault
Pure No-Fault
Add-On No-Fault
No-Fault
Add-On No-Fault
Source: Runzheimer Canada. Based on a 1997,4door Ford Taurus GL Sedan, 3 Litre, 6 Cylinder.Vehicle is insured for private use. Cited in the Van-couver Sun, "Demystifying No-Fault Insurance," byTom Barrett, Feb. 26,1997, p. B4.
At the time of writing, it is clearly too early drawconcrete conclusions as to whether or not the in-troduction of no-fault schemes in Saskatchewanand Manitoba achieved their fundamental objec-tives. The financial results of Saskatchewan Gov-ernment Insurance do suggest that, after theintroduction of no-fault insurance in 1995, thatentity's financial performance improved. Thesource of the improvement can be attributed, forthe most part, to a sharp reduction in claims ex-penses, and to a higher level of investment incomerelative to the previous financial year. It remainsto be seen whether or not Saskatchewan Govern-ment Insurance will continue to improve its per-formance in the future.
The Fraser Institute 25 Health and Moral Hazards of No-Fault Insurancewww.fraserinstitute.org

PUBLIC POLICY SOURCES, NUMBER 2
No-fault insurance in Ontario
Unfortunately, no rigorous statistical analysis hasbeen conducted to assess the impact of the intro-duction of no-fault insurance in Ontario. Athreshold no-fault system was introduced in On-tario in 1990, and in 1994, the right to sue wascompletely eliminated. Jack Carr (1996a) notedthat the initial impact of the policy change in 1990was to stabilize premiums by reducing benefits toall accident victims by 47.7 percent. Premium in-creases amounted to 11.8 percent in 1994 and 9.5percent in 1995.
No-fault insurance in Victoria,Australia
According to KPMG, the average level of premi-ums in Victoria increased by only 4 percent be-tween 1987 and 1995 after the introduction ofno-fault insurance in 1987. In conjunction with theinsurance product change, a thorough accidentprevention initiative was introduced. This hasserved to provide significant reductions in fatali-ties and deaths. It is not possible to attribute therelative influence of the accident prevention mea-sures and the insurance product reform in con-taining costs. What is clear is that the introductionof no-fault insurance cannot be the sole cause ofthe cost containment successes in Victoria. More-over, costs of treatment, long term costs, and lossof benefit costs were reported in the 1996 TACAnnual Report to be increasing at a rate well aboveinflation.
Conclusions and potential policychanges
Whether or not ICBC has the level of financialtrouble that it has indicated in its numerous pressreleases is open to question. If ICBC's mandate isto break even on its insurance operations, itwould need to reduce costs by between $200 mil-lion and $300 million (based on the financial infor-mation for the first three quarters of 1996). In the
absence of detailed financial information, includ-ing the full 1996 financial statements, one cannotjudge whether or not the proposed major insur-ance product reforms set by the Automobile In-surance Review Team are in any way justified.
Several areas of serious concern surround the Au-tomobile Insurance Review Team's product re-form recommendations discussed in Section 3.
1. The BC government imposed a premiumfreeze, set at $975, to the year 2000 as the con-straint under which product reforms were tobe assessed. In itself, this imposes severe pen-alties on ICBC.
2. The Automobile Insurance Review Team usedthe cost projections provided by KPMG andICBC in assessing the level of operating deficit(and therefore the level of the rate stabilizationreserve) in the years to 2000. In 1997, for exam-ple, the review team reported that ICBC willhave an estimated operating deficit of $385million. The reliability of this figure is open todoubt, given that it appears to have come fromprojections of cost increases from KPMG thatwere neither convincingly explained nor couldthey be replicated in the absence of sufficientdata from ICBC.
What is known is that ICBC reported a net loss of$41.43 million for the first nine months of 1996 ata time when press releases from the companyannounced anticipated losses in 1996 of $150 mil-lion. To compound the uncertainty, ICBC's finan-cial statements include "claims incurred," whichis an estimate of claims expected to be paid out ina given year. Scope exists to manipulate this esti-mate to make the operating position appear worsethan it actually is.
What is clear, however, is that in the viewpoint ofThe Allen Commission, "Neither [of the proposedproduct reforms] can control the long term under-lying increasing cost trend" (Automobile InsuranceReview, p. 67).
Health and Moral Hazards of No-Fault Insurance 26 The Fraser Institute
www.fraserinstitute.org

PUBLIC POLICY SOURCES, NUMBER 2
This amounts to an admission that neither a pureno-fault scheme, nor a partial no-fault insurancescheme—in this case with a monetary threshold—can, in the long term, control insurance costs. Inlight of this statement, is fundamental reform ofthe insurance product in British Columbia desir-able? Calculations to measure the cost savings fora deductible on pain and suffering payments areset out in the product reform options below. TheAllen Commission, in Product Option One, rec-ommended a deductible of $35,000 on pain andsuffering payments. I contend that a deductible of$10,000, or perhaps $15,000 on these awards,would save ICBC sufficient funds to offset anyfinancial concerns, and if introduced with othercost saving measures contained in the Allen Com-mission final report, would provide ample mon-ies to increase the level of benefits paid to at-faultdrivers. The basis for imposing a deductible onpain and suffering payments of $35,000 (in termsof the expected savings from this single measure)were not set out by the Review Commission.
out to the at-fault drivers, and to the benefits thatare paid to persons involved in accidents.
It is widely acknowledged that the problem ofincreasing insurance costs stems from driverscausing too many accidents. As such, this situa-tion is best counteracted by a combination of roadsafety improvement measures and rigorous en-forcement of the rules of the road. With regard tothe situation in British Columbia, a number ofopportunities have been highlighted by KPMGand the Automobile Insurance Review Team as tohow ICBC could effectively save significant sumsof money, while at the same time retaining thefundamental advantages of a tort-based system.These issues need to be addressed at the earliestopportunity before recourse is taken to introducea system of insurance that restricts the freedom ofinnocent accident victims to obtain adequate com-pensation for their injuries.
This report has argued that no-fault insurance isnot the answer to the challenges that ICBC facesduring the coming years. The evidence from otherjurisdictions, in particular those in the USA andCanada, suggest that no-fault insurance schemeshave not offered drivers long-lasting reductionsin auto insurance premiums. The potential bene-fits of no-fault systems lie in their ability to offerone-time reductions in insurance costs by effec-tively offering less coverage. This is achievedthrough reduced benefits for innocent victims, orin the form of deductibles (either verbal or inmonetary terms) on pain and suffering awards, orin limiting access to the courts. In turn, in theoryat least, some of these accrued savings can then beredistributed to increase the benefits that are paid
Potential policy changes
1. ICBC could divide its $4.5 billion reserve fundinto four or five equal segments and hire anumber of local investment managementfunds to look after the portfolio. A 1 percentincrease in investment performance wouldhave meant an extra $40 million or so in addi-tional investment income in 1995.
2. ICBC should recognize the risk associated withage and gender in setting premiums.
19 A range of accident prevention measures, theft and fraud reduction, and service enhancement changeswere identified by the Automobile Insurance Review Team to have the capacity to save $100 million in1998. This does not include significant savings (as identified by KPMG) that could be gained by adoptingMediation and Alternate dispute resolution procedures.
The Fraser Institute 27 Health and Moral Hazards of No-Fault Insurancewww.fraserinstitute.org

PUBLIC POLICY SOURCES, NUMBER 2
Potential changes in theinsurance product
Pain and suffering awards
Appendix Table 2 provides the basis for estimat-ing the potential savings to ICBC of introducing adeductible for payments made to alleviate painand suffering. The estimated savings to ICBCafter the introduction of a $10,000 deductible forpain and suffering is $202 million. Savings fromdeductibles of $5,000 and $15,000 are estimated tosave ICBC $131 million and $235 million per yearrespectively.
Charge the at-fault driver a one-time sum of up to $500 towardscompensation to innocent party
ICBC may consider charging the at-fault driver asingle "fine" of perhaps $500 to offset costs in-curred. This potential measure has the advantageof reinforcing the need for careful driving habits,is easy to implement, and could save ICBC a sig-nificant sum of money.
Table 6: Potential Savings Resulting fromCharging a Levy to At-Fault Drivers
Number of Estimated Amount of EstimatedProperty/CollisionClaims
Paid Outby ICBCin 1995
Claimsfrom
Accidentswhich
Involve anAssessment
of Fault
Fine ($) Savings($ million)
226,009 101,705 500 50.85
226,009 101,705 250 25.43
Assumptions: The number of property damagecollisions is used as a proxy for the total number ofaccidents in B.C. in 1995 for which claims wereincurred. It is assumed that 90 percent of allaccidents involve one party who is assessed at fault.
Source: Author's calculations using ICBC claimsdata for 1995.
Health and Moral Hazards of No-Fault Insurance 28 The Fraser Institute
www.fraserinstitute.org

PUBLIC POLICY SOURCES, NUMBER 2
Appendix Table 1: Selected ICBC Financial Data 1975 to 1995
1975
1976
1977
1978
1979
1980
1981
1982
1983
1984
1985
1986
1987
1988
1989
1990
1991
1992
1993
1994
1995
Numberof
PoliciesWritten
1,450,000
1,504,000
1,560,000
1,622,000
1,671,000
1,805,000
1,873,000
1,821,000
1,833,000
1,834,000
1,842,000
1,917,000
1,981,000
2,036,000
2,095,000
2,170,000
2,223,000
2,276,000
2,292,000
2,343,000
2,390,000
TotalICBCCosts
($000s)
249,023
327,603
313,200
380,980
430,715
555,781
664,274
766,457
791,320
833,722
827,000
928,000
1,058,000
1,221,000
1,434,000
1,727,842
2,030,981
2,168,512
2,132,305
2,287,544
2,506,029
CPIforVancouver
(1986 =100)
45.40
49.70
53.30
57.40
61.90
67.70
77.30
85.50
90.20
93.80
96.80
100.00
103.10
106.80
111.50
117.60
123.70
127.40
132.00
134.70
138.00
AverageICBC
Costs PerPolicy
171.74
217.82
200.77
234.88
257.76
307.91
354.66
420.90
431.71
454.59
448.97
484.09
534.07
599.71
684.49
796.24
913.62
952.77
930.33
976.33
1048.55
AverageICBC
Costs PerPolicy
Adjustedfor
Inflation
378.28
438.27
376.68
409.20
416.41
454.82
458.81
492.28
478.61
484.64
463.81
484.09
518.02
561.52
613.89
677.08
738.58
747.86
704.79
724.82
759.82
%
Increasein
AverageTotal
Costs perPolicy Netof Inflation
15.86
-14.05
8.63
1.76
9.22
0.88
7.30
-2.78
1.26
-4.30
4.37
7.01
8.40
9.33
10.29
9.08
1.26
-5.76
2.84
4.83
Under-writing
Loss($000s)
(108,891)
(96,230)
(118,468)
(84,823)
(170,121)
(236,998)
(186,987)
(188,398)
(314,747)
(496,222)
(392,836)
(90,527)
(123,891)
(252,868)
ICBC Total Costs Per Policy Written
Average Annual Compounded % Rate of Growth 1975 to 1995 (net of inflation): 3.55
Average Annual Compounded % Rate of Growth 1991 to 1995 (net of inflation): 0.71
Average Annual Compounded % Rate of Growth 1975 to 1986 (net of inflation): 2.27
Average Annual Compounded % Rate of Growth 1986 to 1991 (net of inflation): 8.82
Source: ICBC Annual Reports and B.C. Stats.
InvestmentIncome($000s)
3,800
30,200
35,200
43,500
58,200
70,700
102,600
108,536
100,616
128,032
158,385
171,241
179,205
213,140
278,493
331,937
315,824
243,627
246,594
264,781
315,122
TotalClaims
Incurred($000s)
256,000
216,000
297,000
313,000
338,000
450,000
553,000
609,000
625,674
660,353
653,883
742,139
850,546
953,798
1,126,456
1,362,791
1,617,483
1,704,436
1,641,572
1,783,731
1,967,308
NetIncome($000s)
(34,179)
(144,181)
71,800
6,100
3,800
(68,000)
600
3,200
4,300
9,564
73,562
1,120
(57,793)
26,153
90,095
17,190
(98,398)
(64,186)
156,067
140,890
62,254
AveragePremium
($)
124
236
216
226
226
232
300
361
379
376
387
376
411
516
580
631
669
785
852
893
917
The Fraser Institute 29 Health and Moral Hazards of No-Fault Insurance
www.fraserinstitute.org

PUBLIC POLICY SOURCES, NUMBER 2
Appendix Table 2: Potential Savings
Size of Loss Coverages(Column A) Closed
(Column B)
1-499
500-999
1,000-2499
2,500-4,999
5,000-9999
10,000-24,999
25,000-49,999
50,000-99,999
100,000-199,999
200,000-499,999
500,000-999,999
Greaterthan$lMillion
Total
1,265
1,639
5,013
6,652
8,604
9,218
3,627
1,636
710
349
84
32
38,829
LossPayments
(Column C)
272,527
1,041,182
8,002,097
23,413,067
60,104,120
144,786,525
125,291,733
111,814,389
97,136,972
100,609,668
58,264,338
65,609,211
796,345,829
from a Deductible on Pain and Suffering Awards
Average^Loss (midpoint for
the size ofloss)
(Column D)
250
750
1,750
3,750
7,500
17,500
37,500
75,000
150,000
350,000
750,000
1,250,000
EstimatedIndividual
Payment forPain&
Suffering(Column E)
ColumnD x 53%
133
398
928
1,988
3,975
9,275
19,875
39,750
79,500
185,500
250,000
250,000
TotalEstimatedPaymentsfor Pain &Suffering
(Column F)
ColumnE x B
148,638
577,748
4,123,193
11,724,150
30,329,100
75,818,050
63,295,875
57,669,000
43,554,950
57,410,500
21,000,000
8,000,000
425,689,498
EstimatedPayments
With aDeductibleof $10,000
(forIndividual)(Column G)
ColumnE-10,000
0
0
0
0
0
0
9,875
29,750
69,500
175,500
240,000
240,000
of $10,000
EstimatedTotal
Paymentswith
Deductibleof $10,000
(Column H)
ColumnGxB
0
0
0
0
0
0
35,816,625
48,671,000
49,345,000
61,249,500
20,160,000
7,680,000
222,922,125
Source: ICBC; and calculations by author.Note: Numbers may not add up due to rounding.Key Assumptions:1. Payments for pain and suffering are estimated as being 53 percent of the total payments for bodily injuries.This assumption is based on information contained in the KPMG report (Volume II, page VI-10).2. The total estimated payments for pain and suffering were stated as being $454 million in 1995 in Volume IIof the KPMG report. To simplify this illustration, pain and suffering payments have been set at $425.7 millionin 1995.
Health and Moral Hazards of No-Fault Insurance 30 The Fraser Institutewww.fraserinstitute.org

PUBLIC POLICY SOURCES, NUMBER 2
References
Automobile Insurance Review. (1997). Report to the Hon-ourable Andrew Petter. March.
Barrett, Tom. (1997). "Demystifying No-Fault Insur-ance." Vancouver Sun, February 26, p. B4.
Motor Vehicle Branch, Ministry of Transportation andHighways, Province of British Columbia. (1994).British Columbia 1994 Traffic Collision Statistics.
Bruce, C. (1984). "The Deterrent Effects of Insuranceand Tort Law: A Survey of the Empirical Litera-ture." Law and Policy, vol. 6, no. 1, pp. 67-100.
Carr, J. (1996a). Notes and Comments on The Report ofthe Ontario Task Force on Insurance. Revised Draft,July 11.
. (1996b) "No Fault Automobile Insurance Theoryand Practice: The Ontario Experience." (Unpub-lished). September 24.
Devlin, R.A. (1992). "Liability versus No-Fault Auto-mobile Insurance Regimes: An Analysis of the Ex-perience in Quebec." In Dionne G. (ed.),Contributions to Insurance Economics (Boston, MA:Kluwer Academic Publishers), pp. 449-520.
Devlin, R.A. (1993). "Automobile Insurance in Ontario:Public Policy and Private Interests." Canadian Pub-lic Policy, vol. XIX, no. 3, pp. 298-310.
Gaudry, M. (1992). "Measuring the Effects of the No-Fault 1978 Quebec Automobile Insurance Act Withthe Drag Model." In Dionne G. (ed.), Contributionsto Insurance Economics (Boston, MA: Kluwer Aca-demic Publishers), pp. 471-498.
ICBC. (1974 to 1995). Annual Financial Reports.
. (1995). "The Use of Mediation in Settling InjuryClaims—A Cost Benefit Analysis." July.
KPMG. (1996). Motor Vehicle Insurance in British Colum-bia at the Crossroads: the Case for Change. Vol. I,December 19.
. (1997a). Motor Vehicle Insurance in British Colum-bia at the Crossroads: Additional Working Papers. Feb-ruary 18.
. (1997b). Motor Vehicle Insurance in British Colum-bia at the Crossroads: Options and Choices. Vol. II,January 21.
Manitoba Public Insurance. (1993 to 1995). Annual Re-ports.
McEwin, I.R. (1989). "No Fault and Road Accidents:Some Australasian Evidence." International Reviewof Law and Economics, 9, pp. 13-24.
Saskatchewan Government Insurance. (1993 to 1995).Annual Reports.
Sheldon, Peter. (1996). "No Fault vs. Tort InsuranceSchemes: A Survey of the Empirical Evidence."Submitted to Associated Economic ConsultantsLtd., Columbia Pacific Consulting, Discovery Eco-nomic Consultants, Peta Consultants Ltd., Septem-ber 27.
Winter, Ralph. (1992). "Moral Hazard, and InsuranceContracts," In Dionne G. (ed.), Contributions to In-surance Economics (Boston, MA: Kluwer AcademicPublishers), pp. 61-96.
Witt, R.C., and J. Urrutia. (1983). "A Comparative Eco-nomic Analysis of Tort Liability and No-FaultCompensation Systems in Automobile Insurance."The Journal of Risk and Insurance, December, pp.631-669.
The Fraser Institute 31 Health and Moral Hazards of No-Fault Insurance
www.fraserinstitute.org