THE GUINNESS GLOBAL ENERGY REPORT · 2014-02-11 · The Guinness Global Energy Report February 2014...
26
THE GUINNESS GLOBAL ENERGY REPORT Developments and trends for investors in the global energy sector February 2014 Tel: +44 (0) 20 7222 5703 Email: [email protected] Web: guinnessfunds.com Guinness Asset Management Ltd is authorised and regulated by the Financial Conduct Authority HIGHLIGHTS FOR JANUARY OIL Brent down slightly to $107; Brent/WTI gap narrows Brent declined from $111 to $107 while WTI declined a dollar, from $98 to $97. US demand has started strongly in 2014 (up 4% year on year), helping global oil inventories to tighten a little. NATURAL GAS US gas price up sharply on very cold weather Henry Hub gas was up strongly during the month, ending January at $4.94. having peaked at over $5.50 during the month as unusually cold weather boosted heating demand. Underlying market looks slightly undersupplied EQUITIES Energy outperforms the broad market The MSCI World Energy Index fell in January by 6.1%, underperforming the MSCI World Index which fell by 3.77% (all in US dollar terms). The Guinness Global Energy Fund was down by 4.06% on the month, outperforming the MSCI World Energy index by 2.00%. CHART OF THE MONTH Natural gas in storage plummets as cold weather bites; positive for price US natural gas in storage vs five year average (bcf) -600 -400 -200 0 200 400 600 800 1,000 2011 2012 2013 2014 Bcf Source: Bloomberg LP; Guinness Funds The start of 2014 has seen some exceptionally large draws of gas from US natural gas storage as very cold weather across the country has increased heating demand. Gas in storage is now 17% below the 5 year average (2007-11). This has pushed the front month gas price up (as we write) to $5.36/mcf, the highest level for 4 years. The 12 month forward curve has also risen, giving US natural gas producers the ability to lock in prices at well above 2013 levels. GUINNESS GLOBAL ENERGY FUND Fund size: $195m (31.01.14) The Guinness Global Energy Fund invests in listed equities of companies engaged in the exploration, production and distribution of oil, gas and other energy sources. We believe that over the next twenty years the combined effects of population growth, developing world industrialisation and diminishing fossil fuel supplies will force energy prices higher and generate growing profits for energy companies. The Fund is run by Tim Guinness, a portfolio manager with over 35 years’ experience, alongside co-managers Will Riley and Jonathan Waghorn. The investment philosophy, methodology and style which characterise the Guinness approach have been applied to the management of energy equity portfolios since 1998. Important information about this report This report is primarily designed to inform you about recent developments in the energy markets invested in by the Guinness Global Energy Fund. It also provides information about the Fund’s portfolio, including recent activity and performance. For regulatory purposes it falls within the legal definition of a financial promotion. Please therefore note the risk warnings on the last page of this document. This document is provided for information only and all the information contained in it is believed to be reliable but may be inaccurate or incomplete; any opinions stated are honestly held at the time of writing, but are not guaranteed. The contents of the document should not therefore be relied upon. It is not an invitation to make an investment nor does it constitute an offer for sale.
Transcript of THE GUINNESS GLOBAL ENERGY REPORT · 2014-02-11 · The Guinness Global Energy Report February 2014...
THE GUINNESS GLOBAL ENERGY REPORT
Developments and trends for investors in the global energy sector February 2014
Tel: +44 (0) 20 7222 5703
Email: [email protected]
Web: guinnessfunds.com
Guinness Asset Management Ltd
is authorised and regulated by the
Financial Conduct Authority
HIGHLIGHTS FOR JANUARY
OIL
Brent down slightly to $107; Brent/WTI gap narrows Brent declined from $111 to $107 while WTI declined a dollar,
from $98 to $97. US demand has started strongly in 2014 (up
4% year on year), helping global oil inventories to tighten a
little.
NATURAL GAS
US gas price up sharply on very cold weather Henry Hub gas was up strongly during the month, ending
January at $4.94. having peaked at over $5.50 during the month
as unusually cold weather boosted heating demand. Underlying
market looks slightly undersupplied
EQUITIES
Energy outperforms the broad market The MSCI World Energy Index fell in January by 6.1%,
underperforming the MSCI World Index which fell by 3.77% (all
in US dollar terms). The Guinness Global Energy Fund was down
by 4.06% on the month, outperforming the MSCI World Energy
index by 2.00%.
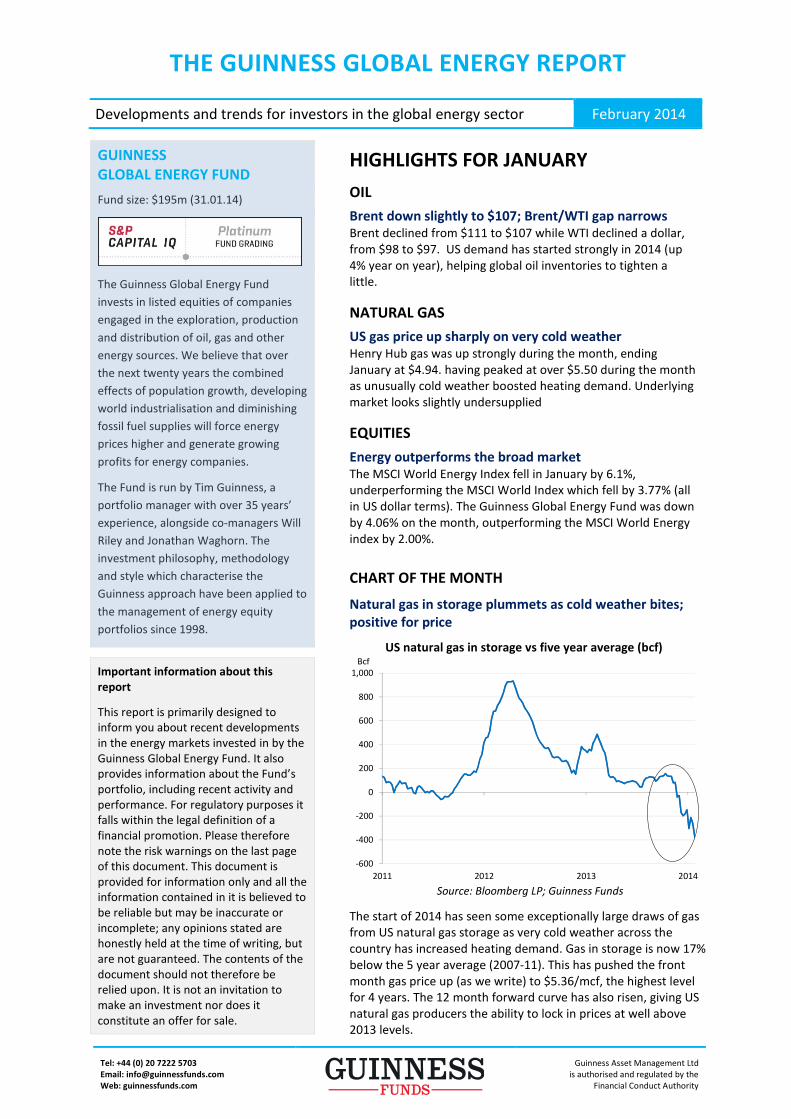
CHART OF THE MONTH
Natural gas in storage plummets as cold weather bites;
positive for price
US natural gas in storage vs five year average (bcf)
-600
-400
-200
0
200
400
600
800
1,000
2011 2012 2013 2014
Bcf
Source: Bloomberg LP; Guinness Funds
The start of 2014 has seen some exceptionally large draws of gas
from US natural gas storage as very cold weather across the
country has increased heating demand. Gas in storage is now 17%
below the 5 year average (2007-11). This has pushed the front
month gas price up (as we write) to $5.36/mcf, the highest level
for 4 years. The 12 month forward curve has also risen, giving US
natural gas producers the ability to lock in prices at well above
2013 levels.
GUINNESS
GLOBAL ENERGY FUND
Fund size: $195m (31.01.14)
The Guinness Global Energy Fund
invests in listed equities of companies
engaged in the exploration, production
and distribution of oil, gas and other
energy sources. We believe that over
the next twenty years the combined
effects of population growth, developing
world industrialisation and diminishing
fossil fuel supplies will force energy
prices higher and generate growing
profits for energy companies.
The Fund is run by Tim Guinness, a
portfolio manager with over 35 years’
experience, alongside co-managers Will
Riley and Jonathan Waghorn. The
investment philosophy, methodology
and style which characterise the
Guinness approach have been applied to
the management of energy equity
portfolios since 1998.
Important information about this
report
This report is primarily designed to
inform you about recent developments
in the energy markets invested in by the
Guinness Global Energy Fund. It also
provides information about the Fund’s
portfolio, including recent activity and
performance. For regulatory purposes it
falls within the legal definition of a
financial promotion. Please therefore
note the risk warnings on the last page
of this document. This document is
provided for information only and all the
information contained in it is believed to
be reliable but may be inaccurate or
incomplete; any opinions stated are
honestly held at the time of writing, but
are not guaranteed. The contents of the
document should not therefore be
relied upon. It is not an invitation to
make an investment nor does it
constitute an offer for sale.
The Guinness Global Energy Report February 2014
Guinness Global Energy Fund guinnessfunds.com
The value of investments and the income from them can go down as well as up.
Guinness Asset Management is authorised and regulated by the Financial Conduct Authority. 2
Contents
1. JANUARY IN REVIEW ................................................................................................................................................ 2
2. MANAGER’S COMMENTS ..................................................................................................................................... 7
3. PERFORMANCE Guinness Global Energy Fund ................................................................................ 11
4. PORTFOLIO Guinness Global Energy Fund ........................................................................................ 12
5. OUTLOOK ....................................................................................................................................................................... 15
6. APPENDIX Oil and gas markets historical context ....................................................................... 24
1. JANUARY IN REVIEW
i) Oil market
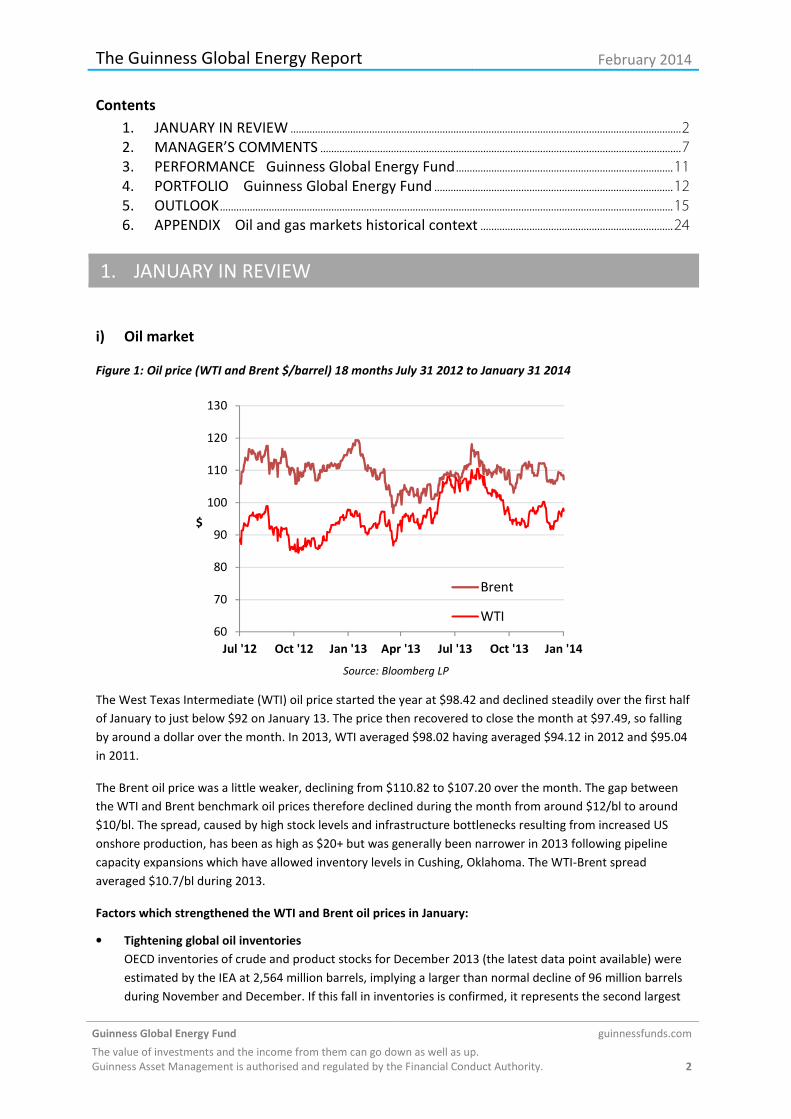
Figure 1: Oil price (WTI and Brent $/barrel) 18 months July 31 2012 to January 31 2014
60
70
80
90
100
110
120
130
Jul '12 Oct '12 Jan '13 Apr '13 Jul '13 Oct '13 Jan '14
$
Brent
WTI
Source: Bloomberg LP
The West Texas Intermediate (WTI) oil price started the year at $98.42 and declined steadily over the first half
of January to just below $92 on January 13. The price then recovered to close the month at $97.49, so falling
by around a dollar over the month. In 2013, WTI averaged $98.02 having averaged $94.12 in 2012 and $95.04
in 2011.
The Brent oil price was a little weaker, declining from $110.82 to $107.20 over the month. The gap between
the WTI and Brent benchmark oil prices therefore declined during the month from around $12/bl to around
$10/bl. The spread, caused by high stock levels and infrastructure bottlenecks resulting from increased US
onshore production, has been as high as $20+ but was generally been narrower in 2013 following pipeline
capacity expansions which have allowed inventory levels in Cushing, Oklahoma. The WTI-Brent spread
averaged $10.7/bl during 2013.
Factors which strengthened the WTI and Brent oil prices in January:
• Tightening global oil inventories
OECD inventories of crude and product stocks for December 2013 (the latest data point available) were
estimated by the IEA at 2,564 million barrels, implying a larger than normal decline of 96 million barrels
during November and December. If this fall in inventories is confirmed, it represents the second largest
The Guinness Global Energy Report February 2014
Guinness Global Energy Fund guinnessfunds.com
The value of investments and the income from them can go down as well as up.
Guinness Asset Management is authorised and regulated by the Financial Conduct Authority. 3
November-December decline in the last 10 years (only 2010 was higher). The overall level of inventories
now sits just below the mid-point of the 10 year range, having started 2013 close to the top of the range.
• Improving US oil product demand data
Consistently stronger demand data for US crude oil products is emerging. The 4 week average ‘US
petroleum products supplied’ data registered a 3.8% yoy growth rate in January, having consistently been
above 4% yoy for the last two months of 2013. The IEA currently forecast US growth of just 0.4% in 2014,
so the longer the higher growth rate sustains, the more likely it becomes that US and global oil demand
will be revised higher.
Factors which weakened to the WTI and Brent oil prices in January:
• Small recovery in production from Libya
Libyan production recovered slightly in January, averaging 0.5m b/day (versus 0.2m b/day in December
2013). Production was running at 1.4m b/day in the middle of 2013 but collapsed later in the year as
regional tensions emerged. There is hope that production will soon be up to 0.6m b/day as, in particular,
the large El Sharara field comes back into production having been blocked by local tribesmen since the
end of October. If Libyan production does recover further this year, we expect the rise to absorbed by
other members of OPEC, especially Saudi, Kuwait and UAE.
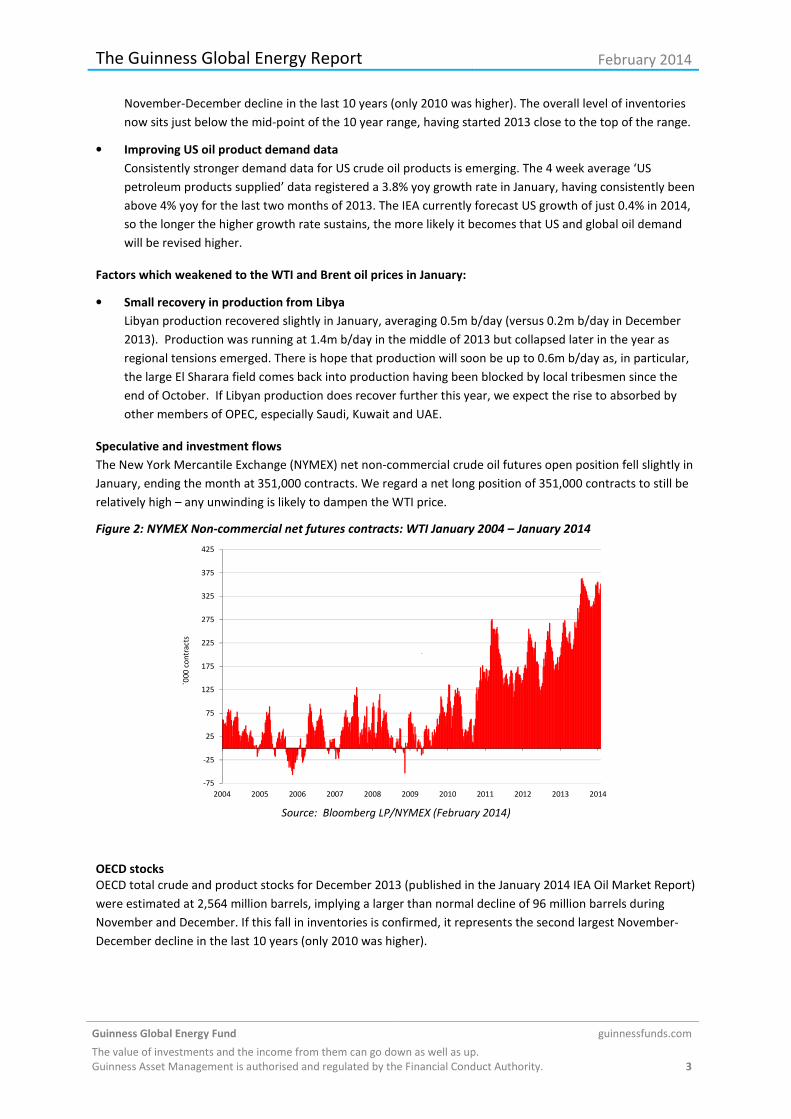
Speculative and investment flows
The New York Mercantile Exchange (NYMEX) net non-commercial crude oil futures open position fell slightly in
January, ending the month at 351,000 contracts. We regard a net long position of 351,000 contracts to still be
relatively high – any unwinding is likely to dampen the WTI price.
Figure 2: NYMEX Non-commercial net futures contracts: WTI January 2004 – January 2014
-75
-25
25
75
125
175
225
275
325
375
425
2004 2005 2006 2007 2008 2009 2010 2011 2012 2013 2014
`00
0 c
on
tra
cts
`
Source: Bloomberg LP/NYMEX (February 2014)
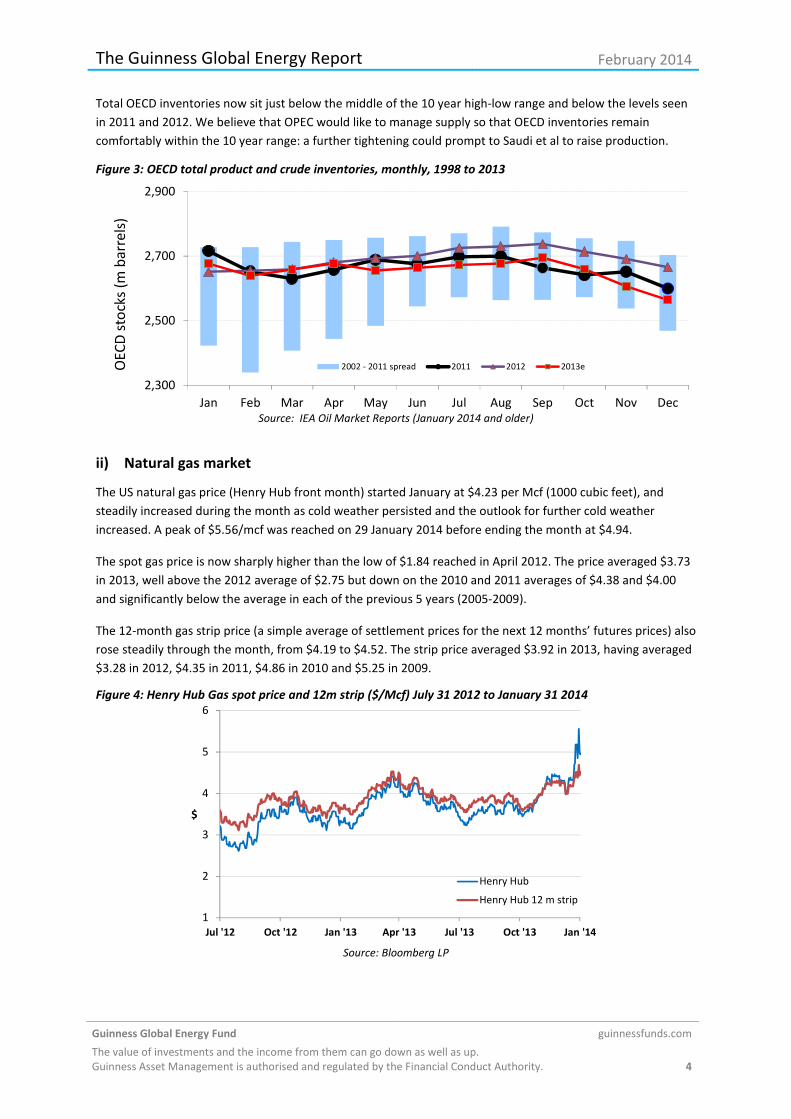
OECD stocks
OECD total crude and product stocks for December 2013 (published in the January 2014 IEA Oil Market Report)
were estimated at 2,564 million barrels, implying a larger than normal decline of 96 million barrels during
November and December. If this fall in inventories is confirmed, it represents the second largest November-
December decline in the last 10 years (only 2010 was higher).
The Guinness Global Energy Report February 2014
Guinness Global Energy Fund guinnessfunds.com
The value of investments and the income from them can go down as well as up.
Guinness Asset Management is authorised and regulated by the Financial Conduct Authority. 4
Total OECD inventories now sit just below the middle of the 10 year high-low range and below the levels seen
in 2011 and 2012. We believe that OPEC would like to manage supply so that OECD inventories remain
comfortably within the 10 year range: a further tightening could prompt to Saudi et al to raise production.
Figure 3: OECD total product and crude inventories, monthly, 1998 to 2013
2,300
2,500
2,700
2,900
Jan Feb Mar Apr May Jun Jul Aug Sep Oct Nov Dec
OE
CD
sto
cks
(m b
arr
els
)
2002 - 2011 spread 2011 2012 2013e
Source: IEA Oil Market Reports (January 2014 and older)
ii) Natural gas market
The US natural gas price (Henry Hub front month) started January at $4.23 per Mcf (1000 cubic feet), and
steadily increased during the month as cold weather persisted and the outlook for further cold weather
increased. A peak of $5.56/mcf was reached on 29 January 2014 before ending the month at $4.94.
The spot gas price is now sharply higher than the low of $1.84 reached in April 2012. The price averaged $3.73
in 2013, well above the 2012 average of $2.75 but down on the 2010 and 2011 averages of $4.38 and $4.00
and significantly below the average in each of the previous 5 years (2005-2009).
The 12-month gas strip price (a simple average of settlement prices for the next 12 months’ futures prices) also
rose steadily through the month, from $4.19 to $4.52. The strip price averaged $3.92 in 2013, having averaged
$3.28 in 2012, $4.35 in 2011, $4.86 in 2010 and $5.25 in 2009.
Figure 4: Henry Hub Gas spot price and 12m strip ($/Mcf) July 31 2012 to January 31 2014
1
2
3
4
5
6
Jul '12 Oct '12 Jan '13 Apr '13 Jul '13 Oct '13 Jan '14
$
Henry Hub
Henry Hub 12 m strip
Source: Bloomberg LP

The Guinness Global Energy Report February 2014
Guinness Global Energy Fund guinnessfunds.com
The value of investments and the income from them can go down as well as up.
Guinness Asset Management is authorised and regulated by the Financial Conduct Authority. 5
Factors which strengthened the US gas price in January included:
• Cold weather across the US
The extremely cold weather in the US continued through January, resulting in sharply higher gas demand
for heating. During the month, the US witnessed a record weekly natural gas inventory draw (of 287 bcf
for the week ending on January 10) and the expectation is that there will be further cold weather in the
United Sates. Whilst the positive effect of cold weather on demand is only a temporary factor, the
resulting tightening of gas inventories (which now sit around 17% below their 5 year average (2007-
2011)) is a useful prop for the price going into 2014. We note that, on a weather adjusted basis, the US
natural gas market is slightly undersupplied (see below).
Figure 5: Weather adjusted US natural gas inventories
20
-350
-300
-250
-200
-150
-100
-50
0
50
100
150
200
-150 -100 -50 0 50 100 150 200 250 300
Ga
s st
org
ae
wit
hd
raw
al
/ in
ject
ion
Heating Degree Days minus Cooling Degree Days
All data to Aug 2013
Sep-13
Oct-13
Nov-13
Dec-13
Jan-14
Poly. (All data to Aug 2013)
Data points above the line
indicate Undersupply
Data points above the line
indicate Oversupply
• Low levels of electric power generation switching from coal to natural gas
We believe that there is an incentive for electricity producers to switch from natural gas feedstock to coal
feedstock, once natural gas prices rise to over $3.50/mcf. We have witnessed this kind of pricing
environment for a number of months now, but the actual volume of power generation that has switched
from coal to natural gas is smaller than would have been expected. In October 2013, y-o-y power demand
was up 1% but coal use for power generation was down 1%, while in November US yoy power demand
was up 3% but coal use was down 6%. This may be because US coal inventories are getting to low levels
and may indicate a lower level of potential natural gas to coal switching ahead, if natural gas prices
remain relatively high.
Factors which weakened the US gas price in January included:
• US onshore production
The November data (latest available) from the Energy Information Agency indicated that total US natural
gas production (Lower 48 States) was up, rising by 1.1 bcf/day month-on-month, setting another
production record at 75.95 bcf/day. Total onshore production rose by 0.9 Bcf/day month-on-month,
implying that offshore production declined slightly. Year-on-year production is up by 2.2 bcf/day (3.0%)
and is driven primarily by production growth from the Marcellus.

The Guinness Global Energy Report February 2014
Guinness Global Energy Fund guinnessfunds.com
The value of investments and the income from them can go down as well as up.
Guinness Asset Management is authorised and regulated by the Financial Conduct Authority. 6
Natural gas in storage
Swings in the supply/demand balance for US natural gas should, in theory, show up in movements in gas
storage data. The following graph shows the 12 month gas strip price (in black) against the amount of gas in
storage expressed as the deviation from the 5 year storage average (in green). Swings in storage have
frequently been a leading indicator to movements in the gas strip price.
Figure 6: Deviation from 5yr gas storage norm vs gas price 12 month strip (H. Hub $/Mcf)
0
2
4
6
8
10
12
14
16-800
-600
-400
-200
0
200
400
600
800
1,000
1998 2000 2002 2004 2006 2008 2010 2012 2014
Na
tura
l g
as
pri
ce 1
2 m
on
th s
trip
($
/Mcf
)
De
via
tio
n f
rom
5y
r n
orm
(B
cf)
Deviation from 5yr norm (Bcf)
Gas price ($/Mcf)
Source: Bloomberg, EIA (January 2014)
The surplus of gas in the second half of 2008 and 2009, a result of oversupply during the recession, can be seen
in gas storage data, with the inflection point in storage occurring in July 2008 and the storage line moving from
negative (i.e. deficit) to positive (i.e. surplus) territory over this 18 month period. This coincided with the gas
strip price falling from a peak of over $13 in July to below $5. An unusually cold 2009/10 winter boosted
demand and pushed the gas storage level back into balance, only for oversupply to persist again for much of
the rest of 2010. A cold 2010/11 winter followed by a hot 2011 summer tightened storage again, with storage
levels staying around the 5 year average for much of this period.
The very mild 2011/12 winter (in combination with rising production) caused gas storage levels to balloon to
record levels, driving prices down to their lowest levels for a decade. Since then coal-to-gas switching and shut
ins and the sharp rig count drop have worked in the other direction, seeing gas prices rising from their sub $2
lows in April 2012 to around $4.0 at the end of 2013. Most recently, gas in storage has tightened considerably,
though much of this can be attributed to an extremely cold 2013/14 winter rather than a structural tightening.
We wait to see whether coal regains power generation market share as a result of the higher gas price
although note that many coal fired power plants will start to be decommissioned from 2015.
We watch movements in gas storage closely as a tightening from here, weather adjusted, is likely to be a
coincident indicator for the start of a sustained gas price recovery.

The Guinness Global Energy Report February 2014
Guinness Global Energy Fund guinnessfunds.com
The value of investments and the income from them can go down as well as up.
Guinness Asset Management is authorised and regulated by the Financial Conduct Authority. 7
World vehicle population
2. MANAGER’S COMMENTS
This month we repeat and expand on some of the ‘big picture’ thoughts on the energy markets that appeared
in our outlook for energy piece published separately last month. What might the next 12 months hold for us as
investors in, and interested observers of, the energy markets?
Crude oil
In terms of the crude oil markets, we continue to think commentators are over-focussed on US shale oil
production growth and the prospect of US “energy independence”. The main impact is that it is good news for
the US balance of payments. As regards likely impact on the oil price it is just one supply and demand factor.
Growth in US shale oil production of 5-6m b/day between 2009 and 2017 is comparable in size to the growth
in FSU oil production of 5m b/day from 7.3m b/day to 12.3m b/day over 8 years between 1998 and 2006,
during which the oil price rose from $10/bbl to $66/bbl! Our suspicion is that commentators will soon start
focusing on the fact that shale oil production growth is slowing down as the decline rate treadmill begins to
overwhelm fraccing productivity gains.
A minimum WTI oil price of $80 appears to be a critical requirement for new unconventional investment, and
Bakken oil prices were below that level for most of November 2013. If new oil growth is plentiful, we would
see a good chance of substantially weaker WTI oil prices as US inventories build amid a ban on oil exports. One
of the key discussion points in 2014 will be: “to export oil or not to export oil?”. Over to you, Mr. Obama…
As we have stated before, this ‘shale revolution’ in the US is a production surge just like the development of
the Gulf of Mexico and North Sea and Alaska in the 1980s in response to the 1970s price hike. However, there
is one huge difference: back then oil demand from the OECD economies had exploded from 1950 to 1973.
They were at the end of a 25 year journey adopting the motor vehicle; impetus was fading and demand
naturally then corrected as prices jumped.
Now, however, the picture is different. China’s
per capita demand for oil has not yet
even reached that of the OECD at the
beginning of the 1950s. We expect two
decades of unrelenting oil demand
growth to come while the Chinese
vehicle fleet moves from 100 million
now to 400 million by 2030, and India
and several other developing economies
follow about ten years behind. The
coming world car fleet explosion helps to
explain rather simply the reason why
global demand for oil is in a strong
upward trajectory.
Looking ten years forward to 2024, we
continue to see 10 to 13m b/day of
global demand growth (emerging
economies growing at 12-15m b/day,
less 2m b/day of demand decline from the OECD) and muted supply growth (made up of barrels per day
growth of perhaps 2-3m from the US, 1-2m from Iraq, 1m from Africa, 1.75m from Brazil, 1.25m from Canada,
1m from the Caspian, and some mature basin declines). If you doubt us, remember that Canada, for example,
only grew its oil production by 1.3m b/day from 2002 to 2013 despite all the effort to develop its oil sands.
Please note we are being 1m b/day more optimistic about US shale oil than the EIA (they are predicting 2m
b/day of growth from here). And we may also be too optimistic on our non-US oil growth expectations. When
assessing the prospects for global supply as a whole, it is important to remember that the starting point each
-
500,000
1,000,000
1,500,000
2,000,000
2,500,000
19
60
19
65
19
70
19
75
19
80
19
85
19
90
19
95
20
00
20
05
20
10
20
15
20
20
20
25
20
30
'00
0s
veh
icle
s
Russia
Indonesia
India
Brazil
China
Other
United
States
40 years: fleet grows by 750 million vehicles
20 years: fleet grows by
1,000 million vehicles
Source: DoE; Guinness Asset Management

The Guinness Global Energy Report February 2014
Guinness Global Energy Fund guinnessfunds.com
The value of investments and the income from them can go down as well as up.
Guinness Asset Management is authorised and regulated by the Financial Conduct Authority. 8
year is a fall of around 4.5m b/day (5% of total supply) as existing basins decline. This is quite some hurdle to
overcome year after year.
For two years we have commented that Saudi, the UAE and Kuwait stand at centre stage of the oil market and
that they would manage whatever the US, China or Eurozone economies threw at them. That continues to be
our view. We also see them coping with whatever Iran, Libya and Iraq throw at them in the future. So our view
is much the same as last year, in that oil will trade mostly in the $90 – $110 range, with Brent towards the top
end of this range and WTI at around a $10 discount to Brent.
The mid-point of this range is $100/bl, which equates to global crude oil demand spend at around 4.3% of
world GDP. This is more or less what the world has paid on average for its oil the last 40 years. It is a level that
will not bring the world economy to a grinding halt and it is a price that, from OPEC’s point of view, looks fair.
They will strive to achieve it; and bear in mind, Saudi’s 2014 national budget will be balanced if the oil that the
country exports is sold at $102/bl. It is also likely that it will rise from here gradually at something like inflation
or higher, leading to closer to $150/bl oil prices by the end of the decade. We show our view in the context of
the recent past using inflation-adjusted oil prices:
Oil price (inflation adjusted)
1986-
2001 2002 2003 2004 2005 2006 2007 2008 2009 2010 2011 2012 2013
2014
Est
WTI 30 33 38 49 66 75 82 104 68 84 99 94 98 95
Brent 30 32 35 46 64 75 82 103 67 84 115 112 108 105
Brent/WTI
(12m
MAV)
30 33 37 48 65 75 82 104 68 84 107 103 103 100
Brent/WTI
(5yr MAV) 30 25 32 37 42 51 61 75 79 82 89 93 93 99
0
20
40
60
80
100
120
Brent/WTI (12m MAV)
Brent/WTI (5yr MAV)
Source: Bloomberg; Guinness Asset Management
This optimistic view is influenced by the fact that we feel that the recovery in the US economy continues and
that China will continue to transition to a ‘consumption’ growth phase of development. The European
recovery may not come until 2015, but come it will.
Natural gas
Next, we turn our attention to North American natural gas markets. We could see a usefully tighter gas
market in 2014 than in 2013 if US gas demand continues to grow at c1.5bcf/day p.a. (split broadly equally
between electricity demand, industrial on-shoring demand and net export demand, i.e. Mexico exports up,
Canada imports down).
The Guinness Global Energy Report February 2014
Guinness Global Energy Fund guinnessfunds.com
The value of investments and the income from them can go down as well as up.
Guinness Asset Management is authorised and regulated by the Financial Conduct Authority. 9
The principal imponderable left is how much coal-to-gas switching remains to unwind. We are still cautious
about this alleviation of supply tightness and can see the market balancing, rather than being short, for
another year as this totally unwinds. But it does seem clear to us that in 2015, i.e. in 12-18 months, some
combination of a rising gas price and rising gas drilling rig count is likely.
We have been guilty in the past of expecting a quick balance of the gas market as a result of the collapse in the
natural gas drilling rig count. And we may be guilty again of over-optimism about how much the gas price will
rise before the market rebalances. Nonetheless we are increasingly comfortable with forecasting gas above
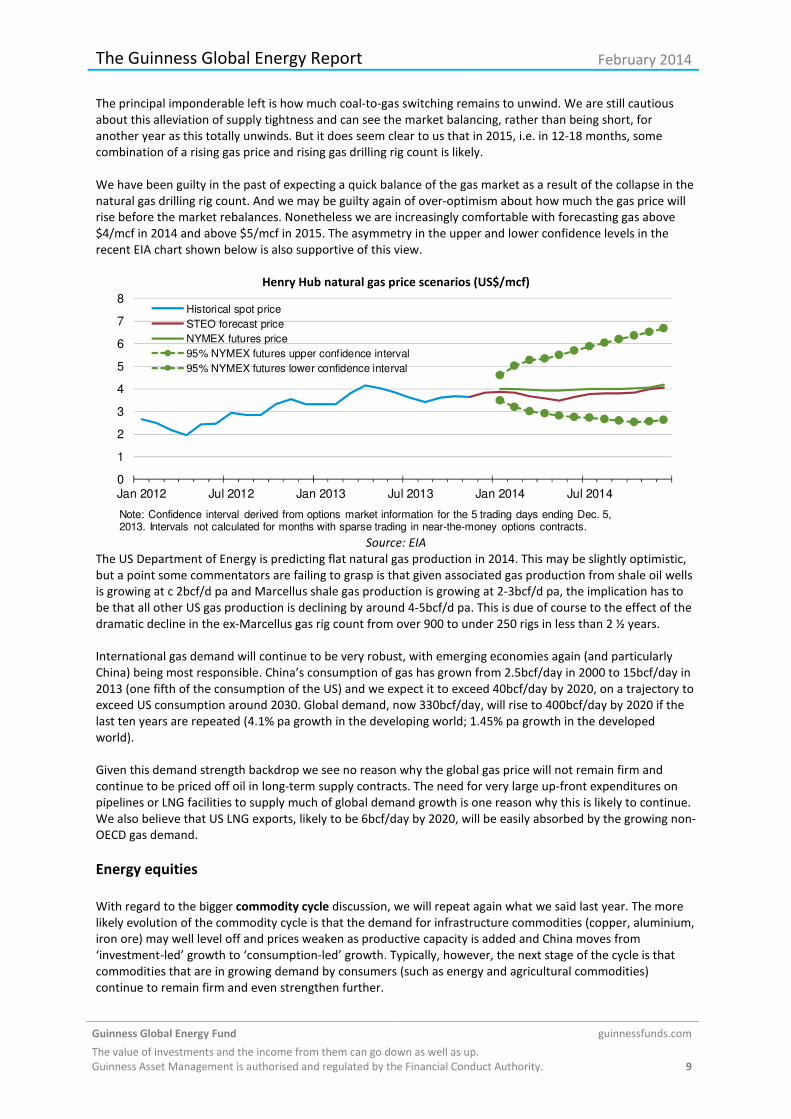
$4/mcf in 2014 and above $5/mcf in 2015. The asymmetry in the upper and lower confidence levels in the
recent EIA chart shown below is also supportive of this view.
Henry Hub natural gas price scenarios (US$/mcf)
0
1
2
3
4
5
6
7
8
Jan 2012 Jul 2012 Jan 2013 Jul 2013 Jan 2014 Jul 2014
Historical spot price
STEO forecast price
NYMEX futures price
95% NYMEX futures upper confidence interval
95% NYMEX futures lower confidence interval
Note: Confidence interval derived from options market information for the 5 trading days ending Dec. 5, 2013. Intervals not calculated for months with sparse trading in near-the-money options contracts.
Source: EIA
The US Department of Energy is predicting flat natural gas production in 2014. This may be slightly optimistic,
but a point some commentators are failing to grasp is that given associated gas production from shale oil wells
is growing at c 2bcf/d pa and Marcellus shale gas production is growing at 2-3bcf/d pa, the implication has to
be that all other US gas production is declining by around 4-5bcf/d pa. This is due of course to the effect of the
dramatic decline in the ex-Marcellus gas rig count from over 900 to under 250 rigs in less than 2 ½ years.
International gas demand will continue to be very robust, with emerging economies again (and particularly
China) being most responsible. China’s consumption of gas has grown from 2.5bcf/day in 2000 to 15bcf/day in
2013 (one fifth of the consumption of the US) and we expect it to exceed 40bcf/day by 2020, on a trajectory to
exceed US consumption around 2030. Global demand, now 330bcf/day, will rise to 400bcf/day by 2020 if the
last ten years are repeated (4.1% pa growth in the developing world; 1.45% pa growth in the developed
world).
Given this demand strength backdrop we see no reason why the global gas price will not remain firm and
continue to be priced off oil in long-term supply contracts. The need for very large up-front expenditures on
pipelines or LNG facilities to supply much of global demand growth is one reason why this is likely to continue.
We also believe that US LNG exports, likely to be 6bcf/day by 2020, will be easily absorbed by the growing non-
OECD gas demand.
Energy equities
With regard to the bigger commodity cycle discussion, we will repeat again what we said last year. The more
likely evolution of the commodity cycle is that the demand for infrastructure commodities (copper, aluminium,
iron ore) may well level off and prices weaken as productive capacity is added and China moves from
‘investment-led’ growth to ‘consumption-led’ growth. Typically, however, the next stage of the cycle is that
commodities that are in growing demand by consumers (such as energy and agricultural commodities)
continue to remain firm and even strengthen further.
The Guinness Global Energy Report February 2014
Guinness Global Energy Fund guinnessfunds.com
The value of investments and the income from them can go down as well as up.
Guinness Asset Management is authorised and regulated by the Financial Conduct Authority. 10
Lastly, when we look at energy equity valuations, we see that the Guinness Global Energy Fund, based on
consensus estimates, is trading on a 2014 PE ratio of 11.0x at January 31 2014; well below the broad market’s
2014 PE of 14.6x. The PE discount is 25%, giving a potential upside versus the broad market of around 35%
when energy PEs close the gap with the broad market; history indicates they’ll close the gap when the current
oil price and long-run market expectations for the oil price come together. The oil price chart above says to us
that $100 oil is around where that could happen. This represents a little bit more than tripling in the real oil
price from the cheap oil 1985-2002 period.
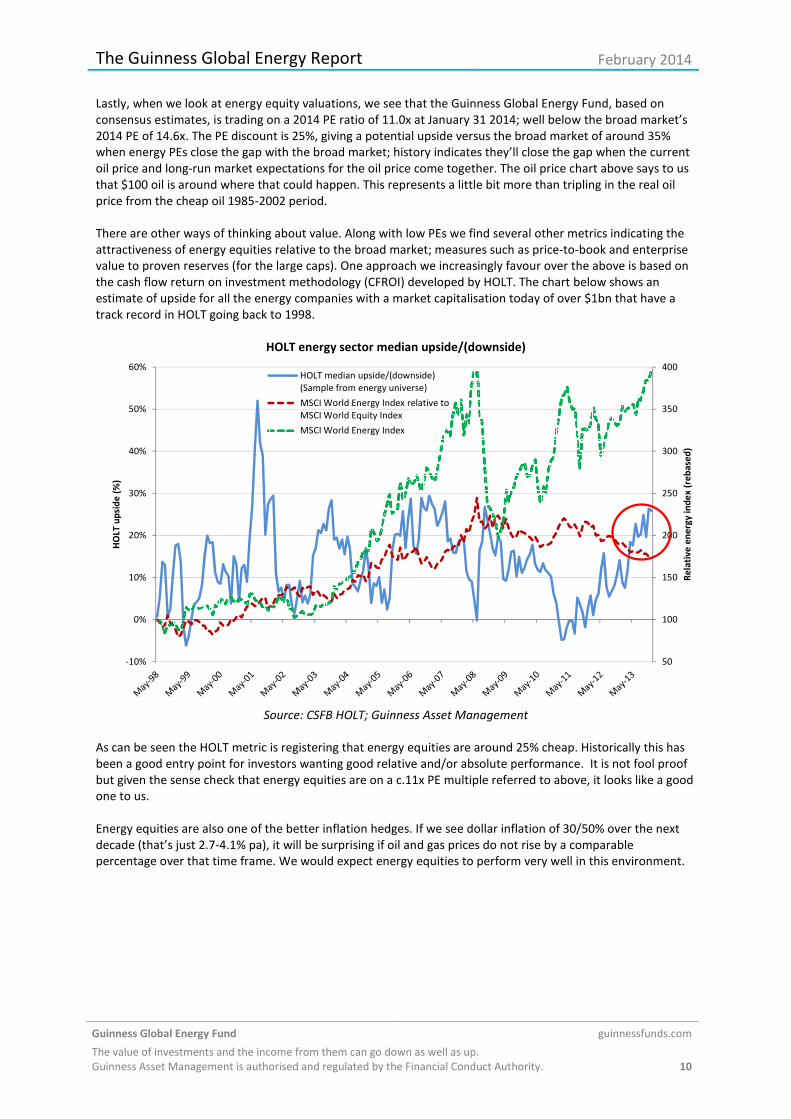
There are other ways of thinking about value. Along with low PEs we find several other metrics indicating the
attractiveness of energy equities relative to the broad market; measures such as price-to-book and enterprise
value to proven reserves (for the large caps). One approach we increasingly favour over the above is based on
the cash flow return on investment methodology (CFROI) developed by HOLT. The chart below shows an
estimate of upside for all the energy companies with a market capitalisation today of over $1bn that have a
track record in HOLT going back to 1998.
HOLT energy sector median upside/(downside)
50
100
150
200
250
300
350
400
-10%
0%
10%
20%
30%
40%
50%
60%
Re
lati
ve
en
erg
y in
de
x (r
eb
ase
d)
HO
LT u
psi
de
(%
)
HOLT median upside/(downside)
(Sample from energy universe)
MSCI World Energy Index relative to
MSCI World Equity Index
MSCI World Energy Index
Source: CSFB HOLT; Guinness Asset Management
As can be seen the HOLT metric is registering that energy equities are around 25% cheap. Historically this has
been a good entry point for investors wanting good relative and/or absolute performance. It is not fool proof
but given the sense check that energy equities are on a c.11x PE multiple referred to above, it looks like a good
one to us.
Energy equities are also one of the better inflation hedges. If we see dollar inflation of 30/50% over the next
decade (that’s just 2.7-4.1% pa), it will be surprising if oil and gas prices do not rise by a comparable
percentage over that time frame. We would expect energy equities to perform very well in this environment.

The Guinness Global Energy Report February 2014
Guinness Global Energy Fund guinnessfunds.com
The value of investments and the income from them can go down as well as up.
Guinness Asset Management is authorised and regulated by the Financial Conduct Authority. 11
3. PERFORMANCE Guinness Global Energy Fund
The main index of oil and gas equities, the MSCI World Energy Index, was down by 6.1% in January. The MSCI
World Index was down by 3.77% over the same period. The Fund was down by 4.06% (class B) over this period,
outperforming the MSCI World Energy Index by 2.00% (all in US dollar terms).
Within the Fund, January’s stronger performers were Ultra Petroleum, Bill Barrett, Penn Virginia, Soco
International and Trina Solar. Poorer performers were Chevron, OMV, PetroChina, Stone Energy and Helix
Energy Solutions.
The following tables show the Fund’s performance* along with the performance of the MSCI World Energy
Index over various periods to January 31 2014 as well as over calendar years. The base currency of the Fund is
US dollars.
USD performance (B class shares)
Cumulative % returns* 1 year 3 years
annualised
5 years
annualised
10 years
annualised
1999-to-date
annualised
Guinness Global Energy (B) +9.9% -1.0% +14.6% +13.1% +14.7%
MSCI World Energy Index +5.2% +2.8% +11.4% +10.6% +9.5%
Calendar year %
performance* 2014 2013 2012 2011 2010 2009 2008 2007 2006 2005
Guinness Global Energy (B) -4.1 +23.5 +2.2 -14.3 +14.4 +60.7 -48.2 +37.9 +10.0 +62.3
MSCI World Energy Index -6.1 +19.0 +2.5 +0.8 +12.7 +26.9 -37.9 +30.9 +18.5 +29.5
Source: Bloomberg, bid to bid, gross income reinvested, in US dollars
*Calculation by Guinness Asset Management Limited, simulated past performance prior to 31.3.08, launch date of
Guinness Global Energy Fund. The Guinness Global Energy investment team has been running global energy funds in
accordance with the same methodology continuously since November 1998. These returns are calculated using a
composite of the Investec GSF Global Energy Fund class A to 29.2.08 (managed by the Guinness team until this date); the
Guinness Atkinson Global Energy Fund (sister US mutual fund) from 1.3.08 to 31.3.08 (launch date of this Fund) and the
Guinness Global Energy Fund class B since launch. Performance would be lower if an initial charge and/or redemption fee
were included.
Past performance should not be taken as an indicator of future performance. The value of this investment
and any income arising from it can fall as well as rise as a result of market and currency fluctuations as well
as other factors. You may lose money in this investment.
Returns stated above are in US dollars; returns in other currencies may be higher or lower as a result of
currency fluctuations. Investors may be subject to tax on distributions.
The Fund’s Prospectus gives a full explanation of the characteristics of the Fund and is available at
www.guinnessfunds.com.

The Guinness Global Energy Report February 2014
Guinness Global Energy Fund guinnessfunds.com
The value of investments and the income from them can go down as well as up.
Guinness Asset Management is authorised and regulated by the Financial Conduct Authority. 12
4. PORTFOLIO Guinness Global Energy Fund
Buys/Sells
There were no buys or sells in January.
Sector Breakdown
The following table shows the asset allocation of the Fund at January 31 2014. We have also shown the asset
allocation of the Guinness Atkinson Global Energy Fund (our US global energy fund which was started in 2004
and is managed in tandem with the Guinness Global Energy Fund) at year-end 2006 and 2007 for comparative
purposes:
(%) 31 Dec
2006*
31 Dec
2007*
31 Dec
2008
31 Dec
2009
31 Dec
2010
31 Dec
2011
31 Dec
2012
31 Dec
2013
31 Jan
2014
Change
YTD
Oil & Gas 95.4 103.5 96.4 98.2 93.3 97.9 97.3 93.5 93.5 0.0
Integrated 29.9 40.3 41.6 35.9 33.0 30.9 30.4 29.2 28.5 -0.7
Integrated – Can & Em Mkts 15.3 25.9 12.1 11.9 8.2 8.8 8.4 9.4 9.2 -0.2
Exploration & production 30.3 25.8 28.7 32.8 37.1 41.1 40.3 35.4 36.3 0.9
Drilling 9.9 8.1 5.2 8.5 6.1 5.9 7.1 6.4 6.6 0.2
Equipment & services 3.4 3.4 6.4 5.9 5.4 6.1 7.4 9.8 9.4 -0.4
Refining and marketing 6.6 0.0 2.4 3.2 3.5 5.1 3.7 3.3 3.5 0.2
Solar 0.0 0.0 0.0 0.0 3.2 1.3 1.2 2.6 2.9 0.3
Coal & consumables 3.3 2.5 2.3 0.0 0.0 0.0 0.0 0.0 0.0 0.0
Construction & engineering 0.0 0.0 0.4 0.3 0.3 0.4 0.7 1.0 1.1 0.1
Cash 1.3 -6.0 0.9 1.5 3.2 0.4 0.9 2.7 2.5 -0.2
Total 100 100 100 100 100 100 100 100 100
*Guinness Atkinson Global Energy Fund
Source: Guinness Asset Management
Basis: Global Industry Classification Standard (GICS)
The Fund at January 31 2014 was on an average price to earnings ratio (PE) versus the S&P 500 Index at 1,782
as set out in the table. (Based on S&P 500 ‘operating’ earnings per share estimates of $56.9 for 2009, $83.8 for
2010, $96.4 for 2011, $96.8 for 2012, $108.0 for 2013 and $122.2 for 2014). This is shown in the following
table:
2009 2010 2011 2012 2013 2014
Guinness Global Energy Fund PE 16.0 10.6 10.2 11.3 12.0 11.0
S&P 500 PE 31.4 21.3 18.5 18.4 16.5 14.6
Premium (+) / Discount (-) -49% -50% -45% -39% -27% -25%
Average oi price (WTI $) $61.9/bbl $79.5/bbl $95/bbl $94/bbl $98/bbl $95/bbl
Source: Standard and Poor’s; Guinness Asset Management Ltd
The Guinness Global Energy Report February 2014
Guinness Global Energy Fund guinnessfunds.com
The value of investments and the income from them can go down as well as up.
Guinness Asset Management is authorised and regulated by the Financial Conduct Authority. 13
Portfolio Holdings
Our integrated and similar stock exposure (c.38%) is comprised of a mix of mid cap, mid/large cap and large
cap stocks. Our five large caps are Exxon, BP, Chevron, Royal Dutch Shell and Total. Mid/large and mid-caps are
ENI, Statoil, Hess and OMV. At January 31 2014 the median PE ratio of this group was 9.5x 2014 earnings. We
have one Canadian integrated holding, Suncor. The company has significant exposure to oil sands and stands
on an attractive PE of 10.6x 2014 earnings given the company’s good growth prospects.
Our exploration and production holdings (c.35%) give us exposure most directly to rising oil and natural gas
prices. We include in this category non-integrated oil sands companies, as this is the GICS approach. The stock
here with oil sands exposure is Canadian Natural Resources. The pure E&P stocks are all largely in the US
(Newfield, Devon, Chesapeake, Carrizo, Stone, Penn Virginia, Ultra, QEP and Bill Barrett) and three more
(ConocoPhillips, Apache and Noble) which have significant international production. One of the key metrics
behind a number of the E&P stocks held is low enterprise value / proven reserves. All of the E&P stocks held
also provide exposure to North American natural gas and include two of the industry leaders (Devon and
Chesapeake). In PE terms, the group divides roughly into two: (i) ConocoPhillips, Apache, Chesapeake, Devon,
Newfield, Carrizo, Ultra and Stone all with quite low PEs (10x – 17x 2014 earnings); and (ii) Noble, Bill Barrett,
Penn Virginia and QEP with higher PE ratios. However, all look reasonably attractive on EV/EBITDA multiples.
We have exposure to four (pure) emerging market stocks in the main portfolio, though two are half-positions.
Two are classified as integrateds by the GICS (Gazprom and PetroChina) and two as E&P companies (Dragon Oil
and SOCO International). Gazprom is the Russian national oil and gas company which produces approximately
a quarter of the European Union gas demand and trades on 3.0x 2014 earnings. PetroChina is one of the
world’s largest integrated oil and gas companies and has significant growth potential and advantages as a
Chinese national champion. Dragon Oil is an oil and gas E&P company focused on offshore Turkmenistan in the
Caspian Sea and trades on 7.3x 2014 earnings. SOCO International is an E&P company with production in
Vietnam and exploration interests across East Africa in Angola, Democratic Republic of Congo and the Republic
of Congo.
We have useful exposure to oil service stocks, which comprise around 16% of the portfolio. The stocks we own
are split between those which focus their activities in North America (land drillers Patterson and Unit on 22.3x
and 12.6x 2014 earnings) and those which operate in the US and internationally (Helix, Halliburton and
Shawcor on 12x – 14x 2014 earnings).
Our independent refining exposure is currently in the US in Valero, the largest of the US refiners, which is
currently trading at significant discount to book and replacement value. Valero has a reasonably large
presence on the US Gulf Coast and is benefitting from the rise in US exports of refined products seen in recent
times.
Our alternative energy exposure is currently a single unit split equally between two companies: JA Solar and
Trina Solar. Both were loss making in 2012 and 2013 due to sharp falls in solar prices during the year but are
expected to return to profitability during 2014. Trina is a Chinese solar module manufacturer and JA Solar is a
Chinese solar cell manufacturer. Some measure of their continued recovery potential may be indicated by
their 2010 PEs of 4.1x and 1.2x respectively.
The Guinness Global Energy Report February 2014
Guinness Global Energy Fund guinnessfunds.com
The value of investments and the income from them can go down as well as up.
Guinness Asset Management is authorised and regulated by the Financial Conduct Authority. 14
Portfolio at December 31 2013 (for compliance reasons disclosed one month in arrears)
Guinness Global Energy Fund 31 December 20132006 2007 2008 2009 2010 2011 2012 2013
Stock Curr. Country% of
NAV
B'berg
mean PER
B'berg
mean PER
B'berg
mean PER
B'berg
mean PER
B'berg
mean PER
B'berg
mean PER
B'berg
mean PER
B'berg
mean PER
Integrated Oil & Gas
Exxon Mobil Corp USD US 3.21 15.45 13.9 11.9 26.0 16.9 12.0 12.9 13.7
Chevron Corp USD US 3.17 16.0 14.2 11.0 24.3 13.4 9.3 10.1 11.0
Royal Dutch Shell PLC EUR NL 3.27 8.9 7.1 8.2 16.2 11.4 8.5 8.4 10.0
BP PLC GBP GB 3.35 7.3 7.4 5.9 10.3 7.1 7.1 8.8 10.6
Total SA EUR FR 3.37 8.1 8.2 7.1 12.9 9.6 8.6 8.2 9.1
ENI SpA EUR IT 3.29 6.2 6.8 6.2 12.3 9.3 8.9 8.7 13.2
Statoil ASA NOK NO 3.28 7.8 10.7 8.0 14.6 11.0 9.4 8.9 9.8
Hess Corp USD US 3.21 15.0 13.9 11.3 43.3 16.1 13.8 14.0 14.1
OMV AG EUR AT 3.10 6.8 6.6 5.4 14.0 8.7 10.9 7.6 9.1
29.24
Integrated / Oil & Gas E&P - Canada
Suncor Energy Inc CAD CA 3.23 15.1 15.6 11.7 35.3 23.5 10.4 11.6 11.2
Canadian Natural Resources Ltd CAD CA 3.21 24.6 17.0 11.0 14.9 14.8 15.6 22.6 15.5
6.44
Integrated Oil & Gas - Emerging market
PetroChina Co Ltd HKD HK 3.03 8.4 8.2 10.5 11.2 9.0 8.8 10.2 9.7
Gazprom OAO USD RU 3.21 nm nm nm 5.1 4.0 2.7 2.8 3.0
6.24
Oil & Gas E&P
ConocoPhillips USD US 3.23 7.1 7.3 6.6 19.5 11.9 8.3 12.4 12.1
Apache Corp USD US 3.07 11.8 9.9 7.7 15.5 9.3 7.2 9.0 10.5
Devon Energy Corp USD US 3.19 9.8 8.9 6.2 17.1 10.4 10.3 19.2 14.4
Noble Energy Inc USD US 3.07 35.9 25.0 19.3 40.3 32.9 25.9 29.8 21.8
Chesapeake Energy Corp USD US 3.18 7.5 8.5 7.6 11.0 9.3 9.7 56.0 16.1
QEP Resources Inc USD US 1.01 nm nm nm nm 22.2 18.7 24.7 21.8
Newfield Exploration Co USD US 2.91 7.0 7.6 7.8 4.8 5.3 6.0 10.1 13.3
Ultra Petroleum Corp USD US 1.09 15.1 19.0 8.2 12.0 9.7 8.5 11.7 13.4
Stone Energy Corp USD US 1.58 12.6 6.7 6.2 15.0 17.0 8.9 12.5 11.6
Bill Barrett Corp USD US 1.05 18.9 27.6 9.8 15.8 13.2 15.2 505.3 nm
Carrizo Oil & Gas Inc USD US 1.62 63.1 64.0 24.9 30.4 35.2 43.6 30.7 19.2
Penn Virginia Corp USD US 1.51 5.2 5.2 3.7 nm nm nm nm nm
Trinity Exploration & Production Ltd GBP GB 0.31 nm nm nm nm nm nm nm 4.1
Ophir Energy PLC GBP GB 0.34 nm nm nm nm nm nm nm nm
Triangle Petroleum Corp USD US 0.28 nm nm nm nm nm nm nm nm
Cluff Natural Resources PLC GBP GB 0.33 nm nm nm nm nm nm nm nm
27.77
Oil & Gas E&P - Emerging markets
Dragon Oil PLC GBP GB 1.58 26.3 15.7 13.0 18.9 13.7 7.4 7.5 8.5
Soco International PLC GBP GB 1.59 61.6 56.7 60.9 37.9 52.3 33.8 9.4 9.9
JKX Oil & Gas PLC GBP GB 0.79 2.4 1.9 2.4 2.5 2.8 3.3 4.5 7.7
WesternZagros Resources Ltd CAD CA 0.31 nm nm nm nm nm nm nm nm
Sino Gas & Energy Holdings Ltd AUD AU 0.18 nm nm nm nm nm nm 200.0 100.0
4.45
Drilling
Patterson-UTI Energy Inc USD US 3.15 6.3 10.0 10.7 nm 37.4 11.7 14.2 21.5
Unit Corp USD US 3.25 7.7 9.0 7.6 19.6 17.0 12.6 12.4 13.6
6.40
Equipment & Services
Halliburton Co USD US 3.20 23.2 20.0 23.4 38.8 25.2 15.2 17.1 16.3
Helix Energy Solutions Group Inc USD US 3.13 8.1 6.9 9.5 40.0 43.9 15.4 12.5 21.8
ShawCor Ltd CAD CA 3.35 34.0 26.6 21.9 23.3 34.0 58.2 19.0 10.6
Shandong Molong Petroleum Machinery Co Ltd HKD HK 0.15 10.8 7.5 5.0 13.8 5.4 7.5 nm nm
9.83
Solar
Trina Solar Ltd USD US 1.44 nm 18.9 11.3 8.4 4.1 506.3 nm nm
JA Solar Holdings Co Ltd USD US 1.20 10.3 27.7 41.1 nm 1.2 nm nm nm
2.64
Oil & Gas Refining & Marketing
Valero Energy Corp USD US 3.31 6.1 6.5 9.3 nm 31.8 12.7 10.3 15.1
3.31
Construction & Engineering
Kentz Corp Ltd GBP GB 1.00 nm 40.9 41.3 40.7 28.0 21.2 17.9 15.3
Cash 2.68
Total 100
PER 10.8 10.6 9.6 16.5 11.0 10.5 11.6 12.2
Med. PER 10.1 10.0 9.4 15.8 13.2 10.3 12.4 13.2
Ex-gas PER 11.0 10.9 10.3 17.8 11.0 10.6 10.7 11.5
Research holding The Fund’s portfolio may change significantly over a short period of time; no recommendation is made for the
purchase or sale of any particular stock.

The Guinness Global Energy Report February 2014
Guinness Global Energy Fund guinnessfunds.com
The value of investments and the income from them can go down as well as up.
Guinness Asset Management is authorised and regulated by the Financial Conduct Authority. 15
5. OUTLOOK
i) Oil market
The table below illustrates the difference between the growth in world oil demand and non-OPEC supply over
the last 10 years, together with the IEA forecasts for 2013 and 2014.
2004 2005 2006 2007 2008 2009 2010 2011 2012 2013e 2014e
IEA IEA
World Demand 82.5 84.0 85.2 87.0 86.5 85.5 88.4 89.0 90.0 91.2 92.5
Non-OPEC supply
(includes Angola and Ecuador for
periods when each country was
outs ide OPEC1)
50.3 50.4 51.3 50.5 49.6 51.4 52.7 52.9 53.4 54.7 56.4
Angola supply adjustment1 -1.0 -1.2 -1.4 0.0 0.0 0.0 0.0 0.0 0.0 0.0 0.0
Ecuador supply adjustment1 -0.5 -0.5 -0.5 -0.5 0.0 0.0 0.0 0.0 0.0 0.0 0.0
Indonesia supply adjustment2 1.0 0.9 0.9 1.0 1.0 0.0 0.0 0.0 0.0 0.0 0.0
Non-OPEC supply
(ex. Angola/Ecuador and inc.
Indones ia
for a l l periods )
49.8 49.6 50.3 51.0 50.6 51.4 52.7 52.9 53.4 54.7 56.4
OPEC NGLs 4.2 4.3 4.3 4.3 4.5 5.1 5.6 5.9 6.3 6.4 6.6
Non-OPEC supply plus OPEC NGLs
(ex. Angola/Ecuador and inc.
Indones ia for a l l periods )
54.0 53.9 54.6 55.3 55.1 56.5 58.3 58.8 59.7 61.1 63.0
Call on OPEC-123 28.5 30.1 30.6 31.7 31.4 29.0 30.1 30.2 30.3 30.1 29.5
Iraq supply adjustment4 -2.0 -1.8 -1.9 -2.1 -2.4 -2.4 -2.4 -2.7 -3.0 -3.1 -3.2
Call on OPEC-115 26.5 28.3 28.7 29.6 29.0 26.6 27.7 27.5 27.4 27.0 26.3
1Angola joined OPEC at the start of 2007, Ecuador rejoined OPEC at the end of 2007 (having previously been a member in the 1980s)
2Indonesia left OPEC as of the start of 2009
3Algeria, Angola, Ecuador, Iran, Iraq, Kuwait, Libya, Nigeria, Qatar, Saudi, U.A.E. Venezuela
4Iraq has no offical quota
5Algeria, Angola, Ecuador, Iran, Kuwait, Libya, Nigeria, Qatar, Saudi, U.A.E. Venezuela
Source: 2003 - 2008: IEA oil market reports; 2009 - 13: 21 January 2014 Oil market Report Global oil demand in 2013 was 4.2m b/day up on the pre-recession (2007) peak. This means the combined
effect of the 2007-8 oil price spike and the 2008/09 recession was quite small and has been shrugged off
remarkably quickly. The IEA forecast a further rise of 1.3m b/day in 2014, which would take oil demand to an
all-time high of 92.5m b/day.
The Guinness Global Energy Report February 2014
Guinness Global Energy Fund guinnessfunds.com
The value of investments and the income from them can go down as well as up.
Guinness Asset Management is authorised and regulated by the Financial Conduct Authority. 16
OPEC
Five years ago, in order to put a floor under a plunging oil price, OPEC announced in its December 17 2008
meeting a new quota target of 25.0m b/day with effect from 1 January 2009. This figure represented a 4.2m
b/day cut from the actual OPEC-11 September 2008 production level (29.2m b/day). From then, quotas
remained unchanged until the OPEC meeting on December 13 2011, at which OPEC substituted a 30 m b/day
target without specifying individual country quotas. The statement read as follows:
“In light of …………. the demand uncertainties, the Conference decided to maintain the current production level
of 30.0 mb/day, including production from Libya, now and in the future. The Conference also agreed that
Member Countries would, if necessary, take steps (including voluntary downward adjustments of output) to
ensure market balance and reasonable price levels. In taking this decision, Member Countries confirmed their
preparedness to swiftly respond to developments that might have a detrimental impact on orderly market
developments. Given the ongoing worrying economic downside risks, the Conference directed the Secretariat
to continue its close monitoring of developments in supply and demand, as well as non-fundamental factors,
such as macro-economic sentiment and speculative activity, keeping Member Countries abreast at all times.”
The 30m b/day figure includes 2.7m b/day for Iraq, so in effect 25.0m b/day for OPEC-11 was moved up to
27.3m b/day. The timing of this announcement was clearly complicated by numerous issues: notably (1) a
range of tricky problems in four OPEC member countries – Libya (recovery from civil war), Iran (western
sanctions over nuclear weapons development), Venezuela (a change of leadership), Nigeria (tribal unrest in the
delta and sectarian unrest elsewhere); (2) production problems in certain non OPEC countries that might or
might not resolve themselves speedily (Yemen, Syria and Southern Sudan); and (3) a real problem in
forecasting how Iraq might develop. Our view is that this 30m b/day needs to be taken as a marker in the sand
(“this is where we would like to see production all things being normal”) but little more than that at present.
November 2013 production for OPEC-11 is reported to be around 26.9m b/day, indicating that OPEC
production is in line with targets. None of this changes our view that OPEC may be ill-disciplined when prices
are high but remain capable of being totally effective at cutting production when the oil price weakens
significantly – as they did in December 2008, 2006, 2001 and 1998.
OPEC met in December 2013 and no changes to production levels were made. Little new came out of the
conference, with OPEC reiterating its “readiness to swiftly respond to developments which could have an
adverse impact on the maintenance of an orderly and balanced oil market”. The next meeting is scheduled for
June 2014.
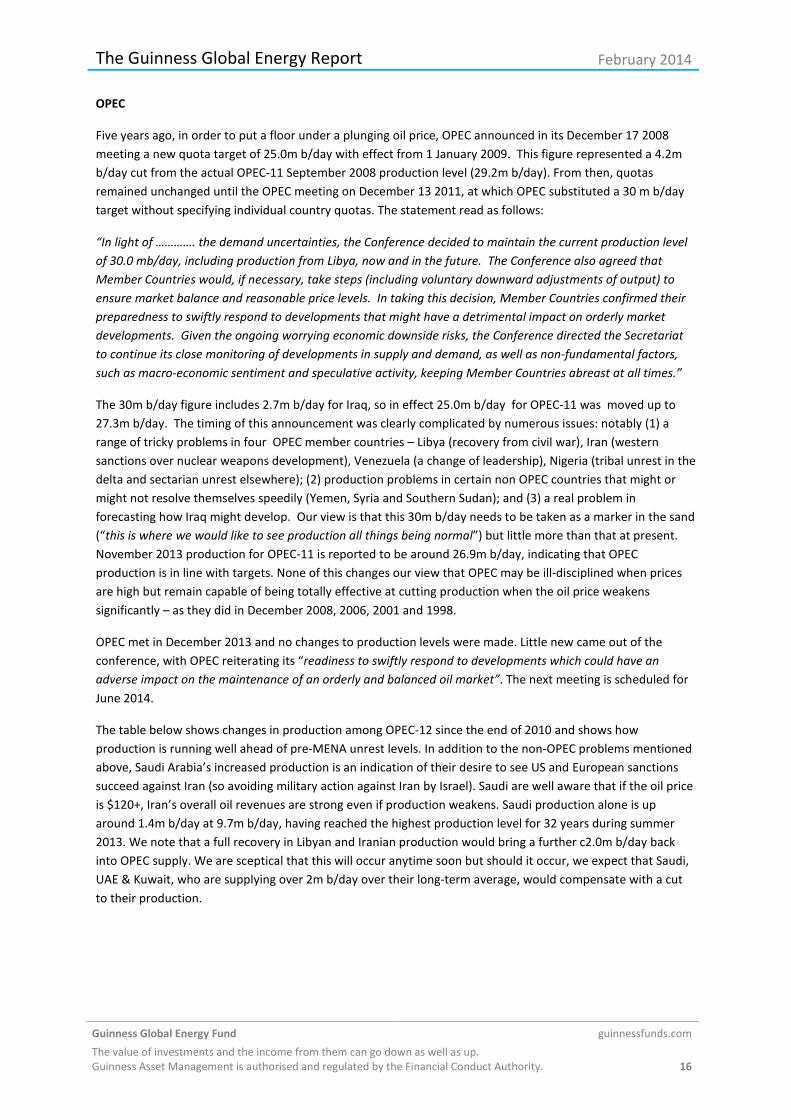
The table below shows changes in production among OPEC-12 since the end of 2010 and shows how
production is running well ahead of pre-MENA unrest levels. In addition to the non-OPEC problems mentioned
above, Saudi Arabia’s increased production is an indication of their desire to see US and European sanctions
succeed against Iran (so avoiding military action against Iran by Israel). Saudi are well aware that if the oil price
is $120+, Iran’s overall oil revenues are strong even if production weakens. Saudi production alone is up
around 1.4m b/day at 9.7m b/day, having reached the highest production level for 32 years during summer
2013. We note that a full recovery in Libyan and Iranian production would bring a further c2.0m b/day back
into OPEC supply. We are sceptical that this will occur anytime soon but should it occur, we expect that Saudi,
UAE & Kuwait, who are supplying over 2m b/day over their long-term average, would compensate with a cut
to their production.
The Guinness Global Energy Report February 2014
Guinness Global Energy Fund guinnessfunds.com
The value of investments and the income from them can go down as well as up.
Guinness Asset Management is authorised and regulated by the Financial Conduct Authority. 17
('000 b/day) 31-Dec-10 31-Jan-14 Change
Saudi 8,250 9,700 1,450
Iran 3,700 2,700 -1,000
UAE 2,310 2,770 460
Kuwait 2,300 2,930 630
Nigeria 2,220 1,925 -295
Venezuela 2,190 2,450 260
Angola 1,700 1,480 -220
Libya 1,585 470 -1,115
Algeria 1,260 1,140 -120
Qatar 820 725 -95
Ecuador 465 548 83
OPEC-11 26,800 26,838 38
Iraq 2,385 3,050 665
OPEC-12 29,185 29,888 703 Source: Bloomberg LP (February 2014)
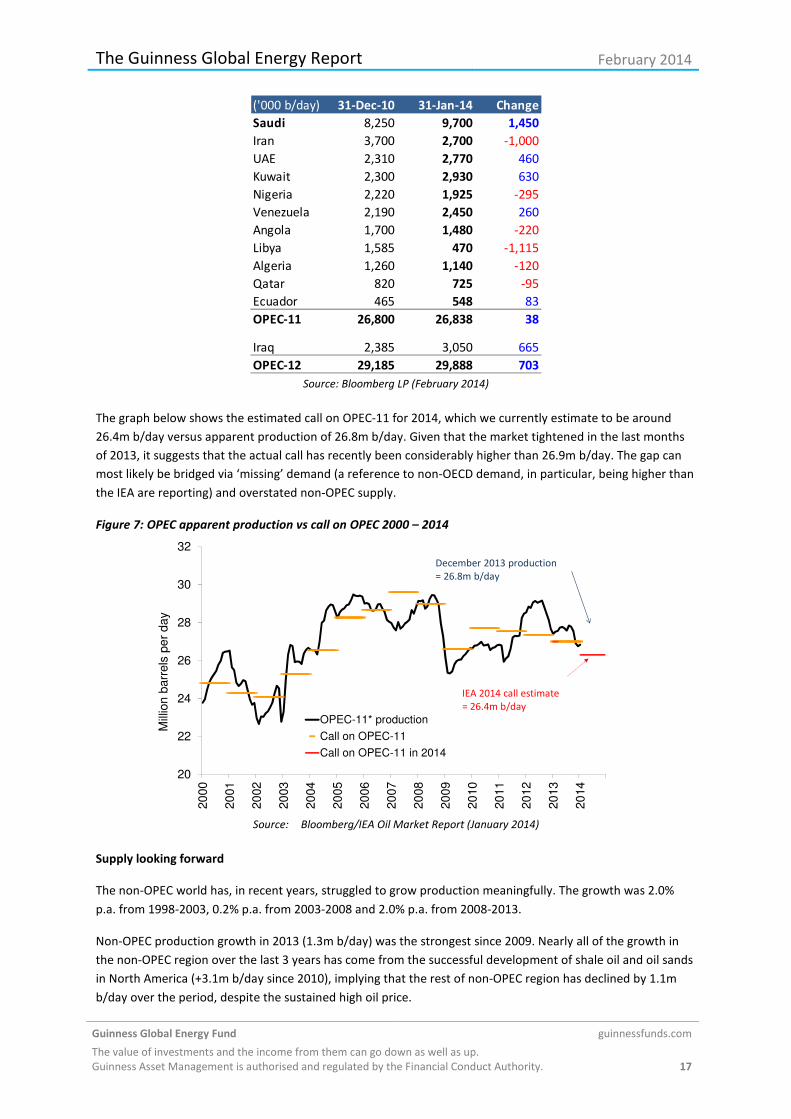
The graph below shows the estimated call on OPEC-11 for 2014, which we currently estimate to be around
26.4m b/day versus apparent production of 26.8m b/day. Given that the market tightened in the last months
of 2013, it suggests that the actual call has recently been considerably higher than 26.9m b/day. The gap can
most likely be bridged via ‘missing’ demand (a reference to non-OECD demand, in particular, being higher than
the IEA are reporting) and overstated non-OPEC supply.
Figure 7: OPEC apparent production vs call on OPEC 2000 – 2014
20
22
24
26
28
30
32
20
00
20
01
20
02
20
03
20
04
20
05
20
06
20
07
20
08
20
09
20
10
20
11
20
12
20
13
20
14
Mill
ion
barr
els
pe
r d
ay
OPEC-11* production
Call on OPEC-11
Call on OPEC-11 in 2014
IEA 2014 call estimate
= 26.4m b/day
December 2013 production
= 26.8m b/day
Source: Bloomberg/IEA Oil Market Report (January 2014)
Supply looking forward
The non-OPEC world has, in recent years, struggled to grow production meaningfully. The growth was 2.0%
p.a. from 1998-2003, 0.2% p.a. from 2003-2008 and 2.0% p.a. from 2008-2013.
Non-OPEC production growth in 2013 (1.3m b/day) was the strongest since 2009. Nearly all of the growth in
the non-OPEC region over the last 3 years has come from the successful development of shale oil and oil sands
in North America (+3.1m b/day since 2010), implying that the rest of non-OPEC region has declined by 1.1m
b/day over the period, despite the sustained high oil price.

The Guinness Global Energy Report February 2014
Guinness Global Energy Fund guinnessfunds.com
The value of investments and the income from them can go down as well as up.
Guinness Asset Management is authorised and regulated by the Financial Conduct Authority. 18
The IEA estimates a further 1.7m b/day of growth in 2014. Whilst the IEA have a long history of over-optimism
towards oil supply growth, it seems plausible that 2014 will see non-OPEC supply grow better than at any time
over the last decade. The expected supply is dominated by North America (+1.2 m b/day) and supported in
particular by Africa and the FSU (+0.3m b/day and +0.2m b/day respectively). Should non-OPEC supply grow
this strongly in 2014, we expect it to have a small loosening effect on the global oil balance, with the growth
largely absorbed by rising demand and a slight reduction in OPEC supply.
Looking further ahead, we must consider in particular increases in supply from two regions: Iraq and North
America. Starting with Iraq, the questions of how big an increase is likely, in what timescale, and how other
OPEC members react are all important issues. Our conclusion is that while an increase in Iraqi production may
be possible (say, 2m barrels per day over the next 5 years), if it occurs it will be surprisingly easily absorbed by
a combination of OPEC adjustment, if necessary, modest non-OPEC supply growth and continuing growth in
demand from developing countries of c.15m b/day over the next 10 years. Iraqi production was running at
3.1m b/day in January 2014, down from a high of 3.6m b/day in mid-2000. Despite this potential, continued
unrest across the country and a continued lack of required infrastructure does not fill us with confidence that
growth can easily be achieved.
The recent growth in US shale oil, in particular from the Bakken, Permian and Eagleford basins, raises the
question of how much more there is to come. So far, new oil production from these sources amounts to
around 2.5m b/day. Our assessment is that US shale oil is a high cost source of oil but one that is viable at
current oil prices and attractive for North American producers to develop. In total, it could be comparable in
size to the UK North Sea, i.e. it could grow by around a further 3m b/day between now and 2017. We also
observe that since the discovery of the Bakken, Eagleford and Permian, the US has struggled to find another
large shale resource, despite 3 years of trying.
Other opportunities to exploit unconventional oil likely exist internationally, notably in Argentina (Vaca
Muerta), Russia (Bazhenov), China (Tarim and Sichuan) and Australia (Cooper). However, the US is far better
understood geologically; the infrastructure in the US is already in place; service capacity in the US is high; and
the interests of the landowner are aligned in the US with the E&P company. In most of the rest of the world,
the reverse of each of these points is true, and as a result we see international shale being 5-10 years behind
North America.
Demand looking forward
The IEA reported growth in oil demand in 2013 of 1.2m b/day, comprising an increase in non-OECD demand of
1.1m b/day and an increase in OECD demand of 0.1m b/day. The components of this non-OECD demand
growth can be summarised as follows:-
Figure 8: Non-OECD oil demand
2009 2010 2011 2012 2013e 2014e 2010 2011 2012 2013 2014
Asia 18.25 19.70 20.35 21.12 21.68 22.37 1.45 0.65 0.77 0.56 0.69
M. East 7.10 7.32 7.43 7.68 7.81 8.01 0.22 0.11 0.25 0.13 0.20
Lat. Am. 5.70 6.03 6.17 6.40 6.61 6.78 0.33 0.14 0.23 0.21 0.17
FSU 4.00 4.15 4.39 4.49 4.63 4.74 0.15 0.24 0.10 0.14 0.11
Africa 3.37 3.48 3.48 3.67 3.78 3.95 0.11 0.00 0.19 0.11 0.17
Europe 0.70 0.68 0.66 0.69 0.68 0.69 -0.02 -0.02 0.03 -0.01 0.01
39.12 41.36 42.48 44.05 45.19 46.54 2.24 1.12 1.57 1.14 1.35
Source: IEA Oil Market Report (January 2014)
The Guinness Global Energy Report February 2014
Guinness Global Energy Fund guinnessfunds.com
The value of investments and the income from them can go down as well as up.
Guinness Asset Management is authorised and regulated by the Financial Conduct Authority. 19
As can be seen, Asia has settled down into a steady pattern of growth since 2010. Collective growth in the
Middle East, Latin America, FSU and Africa in 2013 almost exactly matched that in Asia. These other non-OECD
regions are all central to the developing world industrialisation and urbanisation thesis: it is much more than
just a China story. Looking into 2014, further non-OECD growth of 1.3m b/day is expected, the Asian
component of this up a little on 2013 to 0.7m b/day.
For OECD demand in 2013, the IEA initially expected a decline but this was reversed to an overall rise of 0.1m
b/day as North America came in far stronger than expected, up 0.4m b/day. European demand was down,
reflecting weak economic expectations for the region, whilst a decline in the Pacific region reflects the gradual
switching away from the temporary move to oil by Japan post Fukushima. OECD demand in 2014 is forecast to
be down by 0.1m b/day, with North America up, Europe flat and Pacific down.
Global oil demand over the next few years is likely to follow a similar pattern, with a flat to shallow decline
picture in the OECD overshadowed by strong growth in the non-OECD area. The small decline in the OECD
reflects improving oil efficiency over time, though this effect will be dampened by economic, population and
vehicle growth. Within the non-OECD, population growth and rising oil use per capita will both play a
significant part. Price and the trajectory of global GDP will have an effect at any point in the short term, but
overall we would not be surprised to see average annual non-OECD demand growth of around 1.5m b/day to
the end of the decade. This would represent a growth rate of 3% p.a., no greater than the growth rate over the
last 15 years (3.2% p.a.).
Conclusions about oil
From the low of $31.42 on December 22 2008 we saw the oil price (WTI) recover to above $70 by May 2009,
and range trade around $65-$85 for the subsequent 20 months. Since November 2010 it has generally moved
above this range, trading in a wider range of $80-$110. Brent’s trading range over the same period has been
higher, at $90-$125.
The table below summarises our view by showing our oil price forecasts for WTI and Brent in 2013 against
their historic levels, and rises in percentage terms that we have seen in the period from 2002 to 2012.
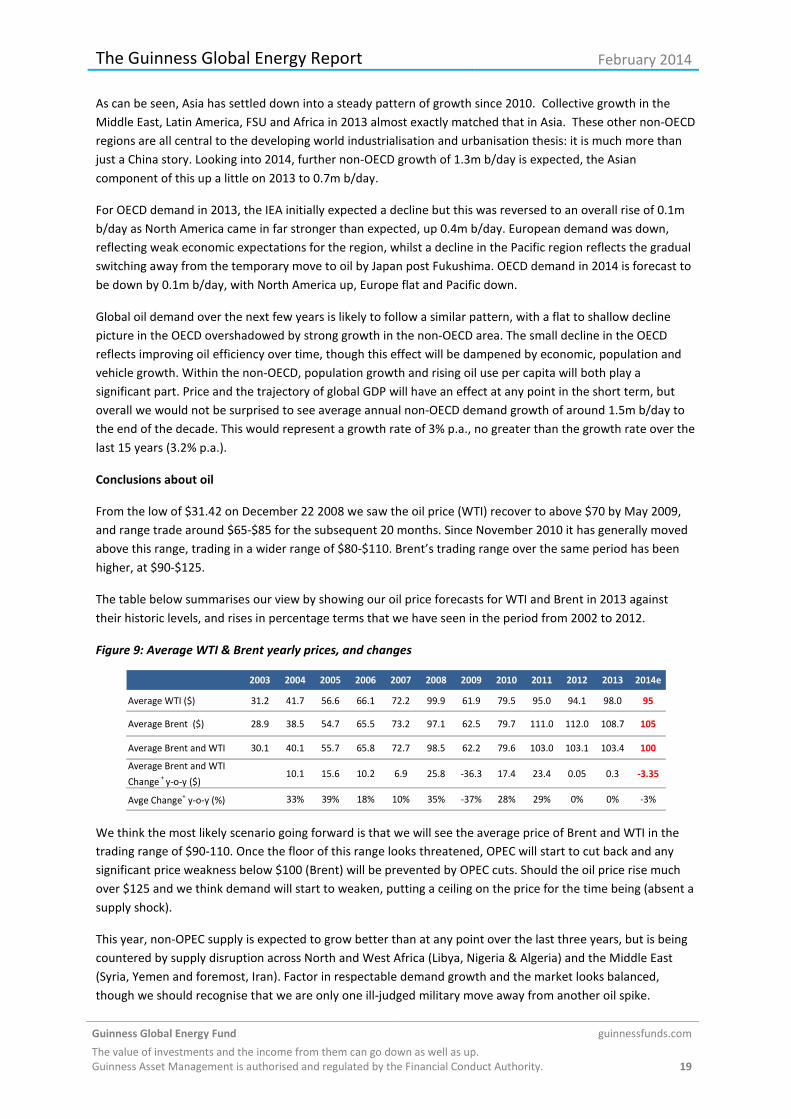
Figure 9: Average WTI & Brent yearly prices, and changes
2003 2004 2005 2006 2007 2008 2009 2010 2011 2012 2013 2014e
Average WTI ($) 31.2 41.7 56.6 66.1 72.2 99.9 61.9 79.5 95.0 94.1 98.0 95
Average Brent ($) 28.9 38.5 54.7 65.5 73.2 97.1 62.5 79.7 111.0 112.0 108.7 105
Average Brent and WTI 30.1 40.1 55.7 65.8 72.7 98.5 62.2 79.6 103.0 103.1 103.4 100
Average Brent and WTI
Change +
y-o-y ($)10.1 15.6 10.2 6.9 25.8 -36.3 17.4 23.4 0.05 0.3 -3.35
Avge Change+ y-o-y (%) 33% 39% 18% 10% 35% -37% 28% 29% 0% 0% -3%
We think the most likely scenario going forward is that we will see the average price of Brent and WTI in the
trading range of $90-110. Once the floor of this range looks threatened, OPEC will start to cut back and any
significant price weakness below $100 (Brent) will be prevented by OPEC cuts. Should the oil price rise much
over $125 and we think demand will start to weaken, putting a ceiling on the price for the time being (absent a
supply shock).
This year, non-OPEC supply is expected to grow better than at any point over the last three years, but is being
countered by supply disruption across North and West Africa (Libya, Nigeria & Algeria) and the Middle East
(Syria, Yemen and foremost, Iran). Factor in respectable demand growth and the market looks balanced,
though we should recognise that we are only one ill-judged military move away from another oil spike.

The Guinness Global Energy Report February 2014
Guinness Global Energy Fund guinnessfunds.com
The value of investments and the income from them can go down as well as up.
Guinness Asset Management is authorised and regulated by the Financial Conduct Authority. 20
At the heart of it all, we believe that Saudi are working hard to try and maintain a ‘good’ oil price (Brent at
$100-110). So far, they are succeeding.
ii) Natural gas market
US supply & demand: recent past
On the demand side, industrial gas demand and electricity gas demand, each about a third of total US gas
demand, are key. Commercial and residential demand, which make up the final third, have been fairly constant
on average over the last decade – although yearly fluctuations due to the coldness of winter weather can be
marked.
Industrial demand (of which around 35% comes from petrochemicals) tends to trend up and down depending
on the strength of the economy, the level of the US dollar and the differential between US and international
gas prices. Between 2000 and 2009 industrial demand was in steady decline, falling from 22.2 Bcf/day to 16.9
Bcf/day. Since 2009 the lower gas price (particularly when compared to other global gas prices) and recovery
from recession has seen demand rebound, up in 2013 to around 20.2 Bcf/day.
Electricity gas demand is affected by weather, in particular warm summers which drive demand for air
conditioning, but the underlying trend depends on GDP growth and the proportion of incremental new power
generation each year that goes to natural gas versus the alternatives of coal, nuclear and renewables. Gas has
been taking market share in this sector: in 2013, 27.2% of electricity generation is estimated to have been
powered by gas, up from 21.6% in 2007. The big loser here is coal which has consistently lost market share
over the past 10 years.
Total gas demand in 2013 (including Canadian and Mexican exports) is estimated to have been 74.8 Bcf/day,
up by 0.4 Bcf/day (0.5%) vs 2012 and up 5.7 Bcf/day (8%) vs the 5 year average. The biggest change in 2013 vs
2012 was in power generation (-2.8 Bcf/day), as much of the coal to gas switching seen in 2012 unwound as
the gas price recovered. This, however, was more than offset by a rise in commercial demand (+2.2 Bcf/day),
driven by a cold finish to the 2012/13 winter, industrial demand (+0.7 Bcf/day) and exports to Canada and
Mexico (+0.3 Bcf/day).
Overall, whilst gas demand in the US has been reasonably strong over the past four years, it has been trumped
over this period by a rise in onshore supply, pulling the gas price lower.
The supply side fundamentals for natural gas in the US are driven by 5 main moving parts: onshore and
offshore domestic production, net imports of gas from Canada, exports of gas to Mexico and imports of
liquefied natural gas (LNG). Of these, onshore supply is the biggest component, making up over 80% of total
supply.
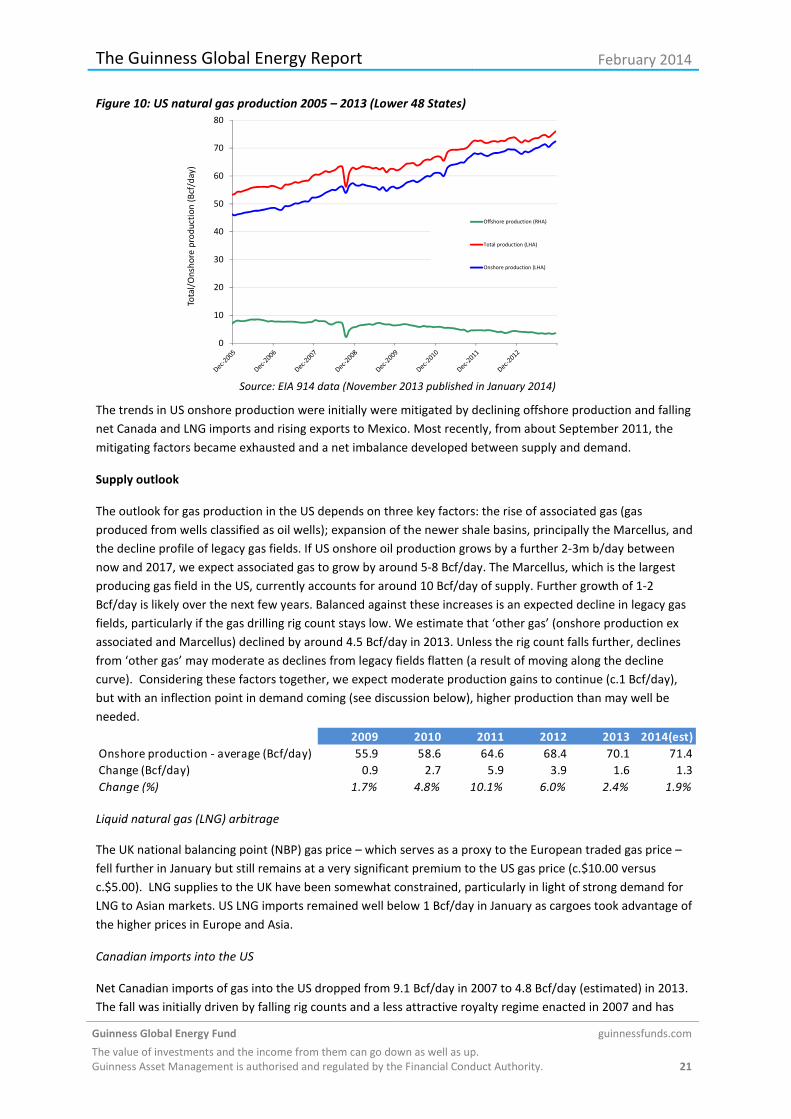
Since the middle of 2008 the weaker gas price in the US reflects growing onshore US production driven by
rising gas shale and associated gas production (coming from growing onshore US oil production). Interestingly,
the overall rise in onshore production has come despite of a collapse in the number of rigs drilling for gas,
which has dropped from a 1,606 peak in September 2008 to 358 at the start of February 2014. However,
offsetting the fall, the average productivity per rig has risen dramatically as producers focus their attention on
the most prolific shale basins. Onshore gas supply is now at 72.4 Bcf/day, around 15.0 Bcf/day (26%) above the
57.4 Bcf/d peak in 2009 before the rig count collapsed.
The Guinness Global Energy Report February 2014
Guinness Global Energy Fund guinnessfunds.com
The value of investments and the income from them can go down as well as up.
Guinness Asset Management is authorised and regulated by the Financial Conduct Authority. 21
Figure 10: US natural gas production 2005 – 2013 (Lower 48 States)
0
10
20
30
40
50
60
70
80
Tota
l/O
nsh
ore
pro
du
ctio
n (
Bcf
/da
y)
Offshore production (RHA)
Total production (LHA)
Onshore production (LHA)
Source: EIA 914 data (November 2013 published in January 2014)
The trends in US onshore production were initially were mitigated by declining offshore production and falling
net Canada and LNG imports and rising exports to Mexico. Most recently, from about September 2011, the
mitigating factors became exhausted and a net imbalance developed between supply and demand.
Supply outlook
The outlook for gas production in the US depends on three key factors: the rise of associated gas (gas
produced from wells classified as oil wells); expansion of the newer shale basins, principally the Marcellus, and
the decline profile of legacy gas fields. If US onshore oil production grows by a further 2-3m b/day between
now and 2017, we expect associated gas to grow by around 5-8 Bcf/day. The Marcellus, which is the largest
producing gas field in the US, currently accounts for around 10 Bcf/day of supply. Further growth of 1-2
Bcf/day is likely over the next few years. Balanced against these increases is an expected decline in legacy gas
fields, particularly if the gas drilling rig count stays low. We estimate that ‘other gas’ (onshore production ex
associated and Marcellus) declined by around 4.5 Bcf/day in 2013. Unless the rig count falls further, declines
from ‘other gas’ may moderate as declines from legacy fields flatten (a result of moving along the decline
curve). Considering these factors together, we expect moderate production gains to continue (c.1 Bcf/day),
but with an inflection point in demand coming (see discussion below), higher production than may well be
needed.
2009 2010 2011 2012 2013 2014(est)
Onshore production - average (Bcf/day) 55.9 58.6 64.6 68.4 70.1 71.4
Change (Bcf/day) 0.9 2.7 5.9 3.9 1.6 1.3
Change (%) 1.7% 4.8% 10.1% 6.0% 2.4% 1.9%
Liquid natural gas (LNG) arbitrage
The UK national balancing point (NBP) gas price – which serves as a proxy to the European traded gas price –
fell further in January but still remains at a very significant premium to the US gas price (c.$10.00 versus
c.$5.00). LNG supplies to the UK have been somewhat constrained, particularly in light of strong demand for
LNG to Asian markets. US LNG imports remained well below 1 Bcf/day in January as cargoes took advantage of
the higher prices in Europe and Asia.
Canadian imports into the US
Net Canadian imports of gas into the US dropped from 9.1 Bcf/day in 2007 to 4.8 Bcf/day (estimated) in 2013.
The fall was initially driven by falling rig counts and a less attractive royalty regime enacted in 2007 and has
The Guinness Global Energy Report February 2014
Guinness Global Energy Fund guinnessfunds.com
The value of investments and the income from them can go down as well as up.
Guinness Asset Management is authorised and regulated by the Financial Conduct Authority. 22
accelerated due to increased domestic demand from Canadian oil sands development and the depressed US
price. Although the Canadian rig count has recovered somewhat, we expect net imports to continue to decline
in 2014 to around 4.5 Bcf/day.
Demand outlook
Assuming average temperatures, we expect US total demand in 2014 (including exports to Canada and
Mexico) to be just over 76 Bcf/day, around 1.5 Bcf/day higher than 2013. Demand from power generation is
expected to be up on 2013 by around 0.8 Bcf/day, driven by reasonable US GDP growth and gas continuing to
take market share from coal. Residential and commercial gas demand will as ever be weather dependent, but
assuming average temperatures, demand should be about unchanged 2012 from 2013. And we expect
industrial consumption about 0.5 Bcf/day above 2013.
Looking out further, the low US gas price has stimulated various initiatives that are likely have a material
impact on demand from 2016 onwards. The most significant is the group of LNG export terminals in the US and
Canada which are in the planning/early construction stages. There are over 26 bcf/day of LNG export projects
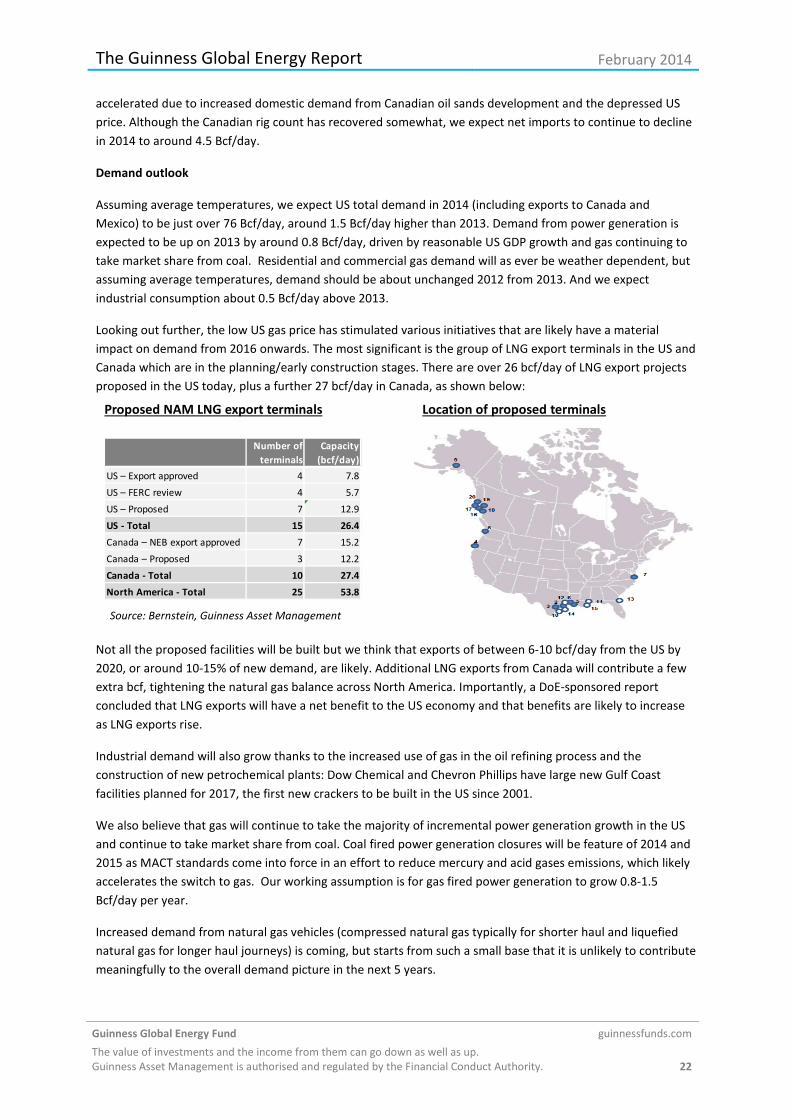
proposed in the US today, plus a further 27 bcf/day in Canada, as shown below:
Location of proposed terminalsProposed NAM LNG export terminals
Number of
terminals
Capacity
(bcf/day)
US – Export approved 4 7.8
US – FERC review 4 5.7
US – Proposed 7 12.9
US - Total 15 26.4
Canada – NEB export approved 7 15.2
Canada – Proposed 3 12.2
Canada - Total 10 27.4
North America - Total 25 53.8
Not all the proposed facilities will be built but we think that exports of between 6-10 bcf/day from the US by
2020, or around 10-15% of new demand, are likely. Additional LNG exports from Canada will contribute a few
extra bcf, tightening the natural gas balance across North America. Importantly, a DoE-sponsored report
concluded that LNG exports will have a net benefit to the US economy and that benefits are likely to increase
as LNG exports rise.
Industrial demand will also grow thanks to the increased use of gas in the oil refining process and the
construction of new petrochemical plants: Dow Chemical and Chevron Phillips have large new Gulf Coast
facilities planned for 2017, the first new crackers to be built in the US since 2001.
We also believe that gas will continue to take the majority of incremental power generation growth in the US
and continue to take market share from coal. Coal fired power generation closures will be feature of 2014 and
2015 as MACT standards come into force in an effort to reduce mercury and acid gases emissions, which likely
accelerates the switch to gas. Our working assumption is for gas fired power generation to grow 0.8-1.5
Bcf/day per year.
Increased demand from natural gas vehicles (compressed natural gas typically for shorter haul and liquefied
natural gas for longer haul journeys) is coming, but starts from such a small base that it is unlikely to contribute
meaningfully to the overall demand picture in the next 5 years.
Source: Bernstein, Guinness Asset Management

The Guinness Global Energy Report February 2014
Guinness Global Energy Fund guinnessfunds.com
The value of investments and the income from them can go down as well as up.
Guinness Asset Management is authorised and regulated by the Financial Conduct Authority. 23
Other
The oil/gas price ratio ($ per bbl WTI/$ per mcf Henry Hub) of 19.4x at the end of January continues well
outside the more normal ratio of 6-9x. If the oil price averages around $95 and the relationship between the
oil and gas price returning to its longer-term average of 6-9x, this would imply the gas price increasing back to
above $10 once the gas market has returned to balance. This is quite a thought and a long way away from
current market sentiment.
The following chart of the front month US natural gas price against heating oil (No 2), residual fuel oil (No 6)
and coal (Sandy Barge adjusted for transport and environmental costs) seeks to illustrate how coal and
residual fuel oil switching provide a floor and heating oil a ceiling to the natural gas price. With the gas price
trading below the coal price support level for the first 8 months of 2012, resulting coal to gas switching for
power generation was significant. Much of this short-term switching has now unwound again, though there is
probably a little more to go if gas persists above $4/mcf. The recent increase in natural gas prices to $5/mcf
has not been met with significant switching to coal, so we will track the price sensitivity of that switching
carefully from here.
Figure 11: Natural gas versus substitutes (fuel oil and coal)
Henry Hub vs residual fuel oil, heating oil, Sandy Barge (adjusted) and Powder River coal (adjusted)
0
5
10
15
20
25
30
$ p
rice
Henry Hub
Powder river coal
"No 2 Heating Oil (NY delivered)"
No 6 Residual Fuel Oil (East Coast delivered)
Sandy Barge coal
Source: Bloomberg LP (December 31 2013)
Conclusions about natural gas
The US natural gas price bottomed in 2012 and the recovery is underway. Natural gas at around $4.50-$5.00
spot is more than double the April 2012 low but still below the (full cycle) marginal cost of supply. We do not
believe the excess in production over demand can continue indefinitely with natural gas trading at this level: a
combination of reduced capital spending by the exploration companies, decelerating production, and growing
natural gas demand stimulated by the low gas price will rebalance the market, as is now happening. As this all
happens we expect the price to stabilise in the $4-5 range. It may be held at this level for a period until demand
grows further, and longer term we expect the price to normalise to $6-8.

The Guinness Global Energy Report February 2014
Guinness Global Energy Fund guinnessfunds.com
The value of investments and the income from them can go down as well as up.
Guinness Asset Management is authorised and regulated by the Financial Conduct Authority. 24
6. APPENDIX Oil and gas markets historical context
Figure 12: Oil price (WTI $) last 24 years.
0
20
40
60
80
100
120
140
160
1989
1990
1991
1992
1993
1994
1995
1996
1997
1998
1999
2000
2001
2002
2003
2004
2005
2006
2007
2008
2009
2010
2011
2012
2013
$
Source: Bloomberg LP
For the oil market, the period since the Iraq Kuwait war (1990/91) can be divided into two distinct periods: the
first 9-year period was broadly characterized by decline. The oil price steadily weakened 1991 - 1993, rallied
between 1994 –1996, and then sold off sharply, to test 20 year lows in late 1998. This latter decline was partly
induced by a sharp contraction in demand growth from Asia, associated with the Asian crisis, partly by a rapid
recovery in Iraq exports after the UN Oil for food deal, and partly by a perceived lack of discipline at OPEC in
coping with these developments.
The last 13 years, by contrast, have seen a much stronger price and upward trend. There was a very strong
rally between 1999 and 2000 as OPEC implemented 4m b/day of production cuts. It was followed by a period
of weakness caused by the rollback of these cuts, coinciding with the world economic slowdown, which
reduced demand growth and a recovery in Russian exports from depressed levels in the mid 90’s that
increased supply. OPEC responded rapidly to this during 2001 and reintroduced production cuts that stabilized
the market relatively quickly by the end of 2001.
Then, in late 2002 early 2003, war in Iraq and a general strike in Venezuela caused the price to spike upward.
This was quickly followed by a sharp sell-off due to the swift capture of Iraq’s Southern oil fields by Allied
Forces and expectation that they would win easily. Then higher prices were generated when the anticipated
recovery in Iraq production was slow to materialise. This was in mid to end 2003 followed by a much more
normal phase with positive factors (China demand; Venezuelan production difficulties; strong world economy)
balanced against negative ones (Iraq back to 2.5 m b/day; 2Q seasonal demand weakness) with stock levels
and speculative activity needing to be monitored closely. OPEC’s management skills appeared likely to be the
critical determinant in this environment.
By mid-2004 the market had become unsettled by the deteriorating security situation in Iraq and Saudi Arabia
and increasingly impressed by the regular upgrades in IEA forecasts of near record world oil demand growth in
2004 caused by a triple demand shock from strong demand simultaneously from China; the developed world
(esp. USA) and Asia ex China. Higher production by OPEC has been one response and there was for a period
some worry that this, if not curbed, together with demand and supply responses to higher prices, would cause
an oil price sell off. Offsetting this has been an opposite worry that non OPEC production could be within a
decade of peaking; a growing view that OPEC would defend $50 oil vigorously; upwards pressure on inventory
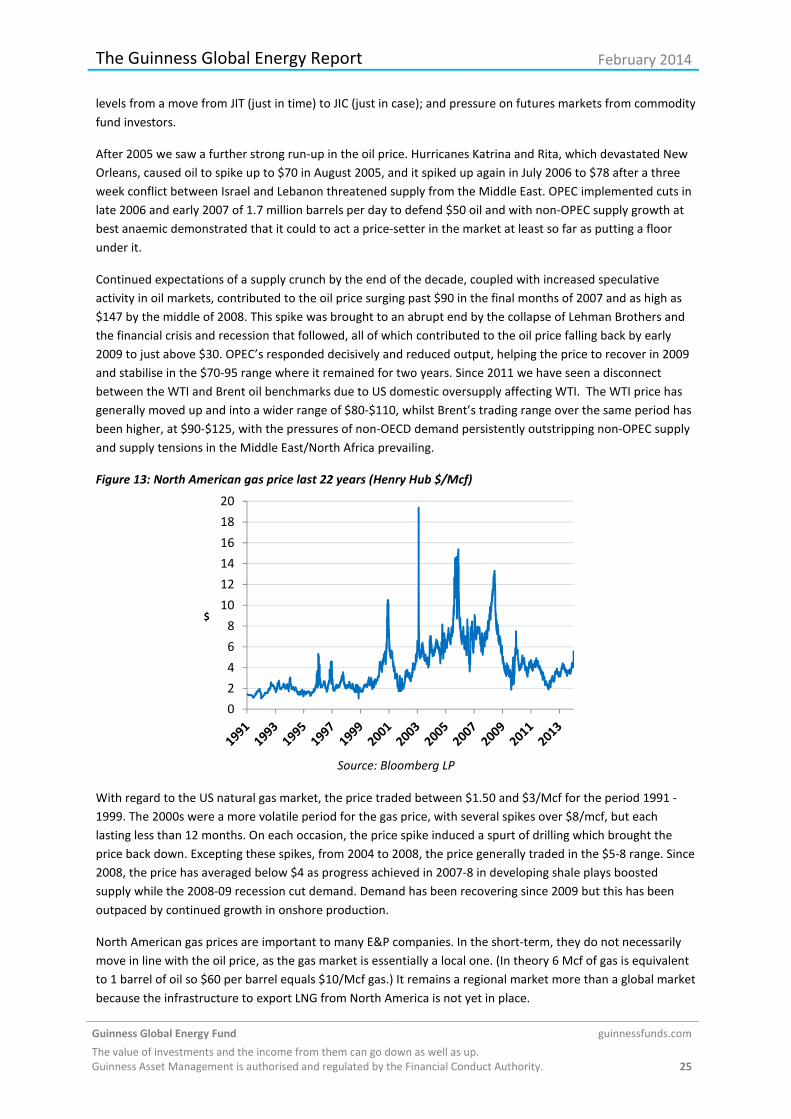
The Guinness Global Energy Report February 2014
Guinness Global Energy Fund guinnessfunds.com
The value of investments and the income from them can go down as well as up.
Guinness Asset Management is authorised and regulated by the Financial Conduct Authority. 25
levels from a move from JIT (just in time) to JIC (just in case); and pressure on futures markets from commodity
fund investors.
After 2005 we saw a further strong run-up in the oil price. Hurricanes Katrina and Rita, which devastated New
Orleans, caused oil to spike up to $70 in August 2005, and it spiked up again in July 2006 to $78 after a three
week conflict between Israel and Lebanon threatened supply from the Middle East. OPEC implemented cuts in
late 2006 and early 2007 of 1.7 million barrels per day to defend $50 oil and with non-OPEC supply growth at
best anaemic demonstrated that it could to act a price-setter in the market at least so far as putting a floor
under it.
Continued expectations of a supply crunch by the end of the decade, coupled with increased speculative
activity in oil markets, contributed to the oil price surging past $90 in the final months of 2007 and as high as
$147 by the middle of 2008. This spike was brought to an abrupt end by the collapse of Lehman Brothers and
the financial crisis and recession that followed, all of which contributed to the oil price falling back by early
2009 to just above $30. OPEC’s responded decisively and reduced output, helping the price to recover in 2009
and stabilise in the $70-95 range where it remained for two years. Since 2011 we have seen a disconnect
between the WTI and Brent oil benchmarks due to US domestic oversupply affecting WTI. The WTI price has
generally moved up and into a wider range of $80-$110, whilst Brent’s trading range over the same period has
been higher, at $90-$125, with the pressures of non-OECD demand persistently outstripping non-OPEC supply
and supply tensions in the Middle East/North Africa prevailing.
Figure 13: North American gas price last 22 years (Henry Hub $/Mcf)
0
2
4
6
8
10
12
14
16
18
20
$
Source: Bloomberg LP
With regard to the US natural gas market, the price traded between $1.50 and $3/Mcf for the period 1991 -
1999. The 2000s were a more volatile period for the gas price, with several spikes over $8/mcf, but each
lasting less than 12 months. On each occasion, the price spike induced a spurt of drilling which brought the
price back down. Excepting these spikes, from 2004 to 2008, the price generally traded in the $5-8 range. Since
2008, the price has averaged below $4 as progress achieved in 2007-8 in developing shale plays boosted
supply while the 2008-09 recession cut demand. Demand has been recovering since 2009 but this has been
outpaced by continued growth in onshore production.
North American gas prices are important to many E&P companies. In the short-term, they do not necessarily
move in line with the oil price, as the gas market is essentially a local one. (In theory 6 Mcf of gas is equivalent
to 1 barrel of oil so $60 per barrel equals $10/Mcf gas.) It remains a regional market more than a global market
because the infrastructure to export LNG from North America is not yet in place.

The Guinness Global Energy Report February 2014
Guinness Global Energy Fund guinnessfunds.com
The value of investments and the income from them can go down as well as up.
Guinness Asset Management is authorised and regulated by the Financial Conduct Authority. 26
IMPORTANT INFORMATION AND RISK FACTORS
This report is primarily designed to inform you about recent developments in the energy markets invested in
by the Guinness Global Energy Fund. It may also provide information about the Fund’s portfolio, including
recent activity and performance. For regulatory purposes it falls within the legal definition of a financial
promotion. Please therefore note the risk warnings below.
It contains facts relating to the energy market and our own interpretation. Any investment decision should
take account of the subjectivity of the comments contained in the report.
This document is provided for information only and all the information contained in it is believed to be
reliable but may be inaccurate or incomplete; any opinions stated are honestly held at the time of writing, but
are not guaranteed. The contents of the document should not therefore be relied upon. It should not be
taken as a recommendation to make an investment in the Fund or to buy or sell individual securities, nor does
it constitute an offer for sale.
Investment in the Fund carries with it a degree of risk and investors should read the risk factors section in the
prospectus before investing. The full Fund documentation contains more complete and detailed information
of risk, fees, charges and expenses that are to be borne by an investor. The documentation should be read
carefully before investing. The full documentation needed to make an investment, including the Prospectus,
the KIID and the Application Form are available, free of charge, from the Manager: Capita Financial Managers
(Ireland) Limited, 2 Grand Canal Square, Grand Canal Harbour, Dublin 2, Ireland or the Promoter and
Investment Manager: Guinness Asset Management Ltd, 14 Queen Anne's Gate, London SW1H 9AA.
Documentation is also available from the website www.guinnessfunds.com. This document should not be
distributed to Retail Clients who are resident in countries where the Fund is not registered for sale or in any
other circumstances where its distribution is not authorised or is unlawful.
THIS INVESTMENT IS NOT FOR SALE TO U.S. PERSONS
The Guinness Global Energy Fund is a sub-fund of Guinness Asset Management Funds PLC (the “Company”),
an open-ended umbrella-type investment company, incorporated in Ireland and authorised and supervised by
the Central Bank of Ireland. The Fund has been approved by the Financial Conduct Authority for sale in the
UK. The Company and the Fund have been recognised in the UK by the FCA pursuant to section 264 of the
FSMA. Guinness Asset Management Ltd is authorised and regulated by the Financial Conduct Authority.
The prospectus for Switzerland, the KIID for Switzerland, the articles of association, the annual and semi-
annual reports, as well as the list of the buying and selling transactions can be obtained free of charge from
the representative in Switzerland, Carnegie Fund Services S.A., 11, rue du Général-Dufour, 1204 Geneva,
Switzerland, Tel. +41 22 705 11 77, Fax: + 41 22 705 11 79, www.carnegie-fund-services.ch. The paying agent
is Banque Cantonale de Genève, 17 Quai de l'Ile, 1204 Geneva, Switzerland.
Telephone calls maybe recorded and monitored.
Tel: +44 (0) 20 7222 5703
Email: [email protected]
Web: guinnessfunds.com
Guinness Asset Management is
authorised and regulated by the
Financial Conduct Authority


![Graphics: Merrill Corp - Guinness Guinness Atkinson Funds ......Renminbi Yuan & Bond Fund TM Merrill Corp - Guinness Guinness Atkinson Funds Semi-Annual Report [Funds] 033-075340 06-30-2012](https://static.fdocuments.us/doc/165x107/602a92ec51b9e0293a534dd6/graphics-merrill-corp-guinness-guinness-atkinson-funds-renminbi-yuan.jpg)