The Growth of Small Corrosion Fatigue Cracks in … 2015 NASA/TM−2015-218672 The Growth of Small...
13
January 2015 NASA/TM−2015-218672 The Growth of Small Corrosion Fatigue Cracks in Alloy 7075 Robert S. Piascik Langley Research Center, Hampton, Virginia https://ntrs.nasa.gov/search.jsp?R=20150002818 2018-07-11T01:54:58+00:00Z
-
Upload
duongquynh -
Category
Documents
-
view
217 -
download
0
Transcript of The Growth of Small Corrosion Fatigue Cracks in … 2015 NASA/TM−2015-218672 The Growth of Small...

January 2015
NASA/TM−2015-218672
The Growth of Small Corrosion Fatigue Cracks in Alloy 7075
Robert S. Piascik Langley Research Center, Hampton, Virginia
https://ntrs.nasa.gov/search.jsp?R=20150002818 2018-07-11T01:54:58+00:00Z

NASA STI Program . . . in Profile
Since its founding, NASA has been dedicated to the advancement of aeronautics and space science. The NASA scientific and technical information (STI) program plays a key part in helping NASA maintain this important role.
The NASA STI program operates under the auspices of the Agency Chief Information Officer. It collects, organizes, provides for archiving, and disseminates NASA’s STI. The NASA STI program provides access to the NTRS Registered and its public interface, the NASA Technical Reports Server, thus providing one of the largest collections of aeronautical and space science STI in the world. Results are published in both non-NASA channels and by NASA in the NASA STI Report Series, which includes the following report types:
• TECHNICAL PUBLICATION. Reports of
completed research or a major significant phase of research that present the results of NASA Programs and include extensive data or theoretical analysis. Includes compilations of significant scientific and technical data and information deemed to be of continuing reference value. NASA counter-part of peer-reviewed formal professional papers but has less stringent limitations on manuscript length and extent of graphic presentations.
• TECHNICAL MEMORANDUM. Scientific
and technical findings that are preliminary or of specialized interest, e.g., quick release reports, working papers, and bibliographies that contain minimal annotation. Does not contain extensive analysis.
• CONTRACTOR REPORT. Scientific and
technical findings by NASA-sponsored contractors and grantees.
• CONFERENCE PUBLICATION.
Collected papers from scientific and technical conferences, symposia, seminars, or other meetings sponsored or co-sponsored by NASA.
• SPECIAL PUBLICATION. Scientific,
technical, or historical information from NASA programs, projects, and missions, often concerned with subjects having substantial public interest.
• TECHNICAL TRANSLATION.
English-language translations of foreign scientific and technical material pertinent to NASA’s mission.
Specialized services also include organizing and publishing research results, distributing specialized research announcements and feeds, providing information desk and personal search support, and enabling data exchange services. For more information about the NASA STI program, see the following: • Access the NASA STI program home page
at http://www.sti.nasa.gov • E-mail your question to [email protected] • Phone the NASA STI Information Desk at
757-864-9658 • Write to:
NASA STI Information Desk Mail Stop 148 NASA Langley Research Center Hampton, VA 23681-2199
National Aeronautics and Space Administration Langley Research Center Hampton, Virginia 23681-2199
January 2015
NASA/TM−2015-218672
The Growth of Small Corrosion Fatigue Cracks in Alloy 7075
Robert S. Piascik Langley Research Center, Hampton, Virginia

Available from:
NASA STI Program / Mail Stop 148 NASA Langley Research Center
Hampton, VA 23681-2199 Fax: 757-864-6500
The use of trademarks or names of manufacturers in the report is for accurate reporting and does not constitute an official endorsement, either expressed or implied, of such products or manufacturers by the National Aeronautics and Space Administration.

iii
Table of Contents 1.0 Introduction .......................................................................................................................... 1 2.0 Experimental Procedures ..................................................................................................... 1 3.0 Experimental Results and Discussion .................................................................................. 3
3.1 Fatigue Crack Growth Rate ................................................................................................. 3 3.2 Small Crack Fractography ................................................................................................... 4
4.0 Conclusions .......................................................................................................................... 5 5.0 References ............................................................................................................................ 6
List of Figures Figure 1. ECT specimen. ........................................................................................................ 2 Figure 2. Corrosion fatigue setup. .......................................................................................... 2 Figure 3. The fatigue crack growth characteristics of small cracks in air. ............................. 3 Figure 4. The corrosion fatigue crack growth characteristics of small and long cracks in
deaerated salt water. ................................................................................................ 4 Figure 5. Fatigue crack/initiation. .......................................................................................... 5 Figure 6. Surface pitting. ........................................................................................................ 5
iv
Nomenclature
a Crack Length Ag/AgCl Silver/Silver Chloride da/dN Crack Growth Rate ECT Extended Compact Tension L-T Longitudinal-Transverse NaCl Sodium Chloride K Crack-tip Stress Intensity Factor P Load R Stress Ratio
Abstract
The corrosion fatigue crack growth characteristics of small (>35 μm) surface and corner cracks in aluminum alloy 7075 is established. The early stage of crack growth is studied by performing in situ long focal length microscope (500×) crack length measurements in laboratory air and 1% sodium chloride (NaCl) environments. To quantify the “small crack effect” in the corrosive environment, the corrosion fatigue crack propagation behavior of small cracks is compared to long through-the-thickness cracks grown under identical experimental conditions. In salt water, long crack constant Kmax growth rates are similar to small crack da/dN.
1.0 Introduction
The propagation of small fatigue cracks from surface defects (5 μm to 10 μm) constitutes a large percentage (50% to 90%) of the total fatigue life of structural components [1]. Thus, accurate prediction of small crack da/dN is required for damage tolerant based life predictions. A problem arises because small cracks propagate at unpredictable accelerated rates compared to long fatigue cracks [2]. The difference in long and small crack growth behavior is due to numerous effects (i.e., diminished crack-tip shielding (closure) effects at small crack sizes). Compounding the small crack problem are complex environmental effects. Research on high strength steels in salt water has shown that chemically short (< 500-μm) cracks propagate 1.5 to 500 times faster than long cracks subjected to the same mechanical driving force [3]. Limited data on 2000 series alloys exposed to deaerated salt water suggest little chemical-crack-length effect [4]. The purpose of this work is to study the chemical crack length effect in environmentally sensitive alloy 7075-T6.
2.0 Experimental Procedures
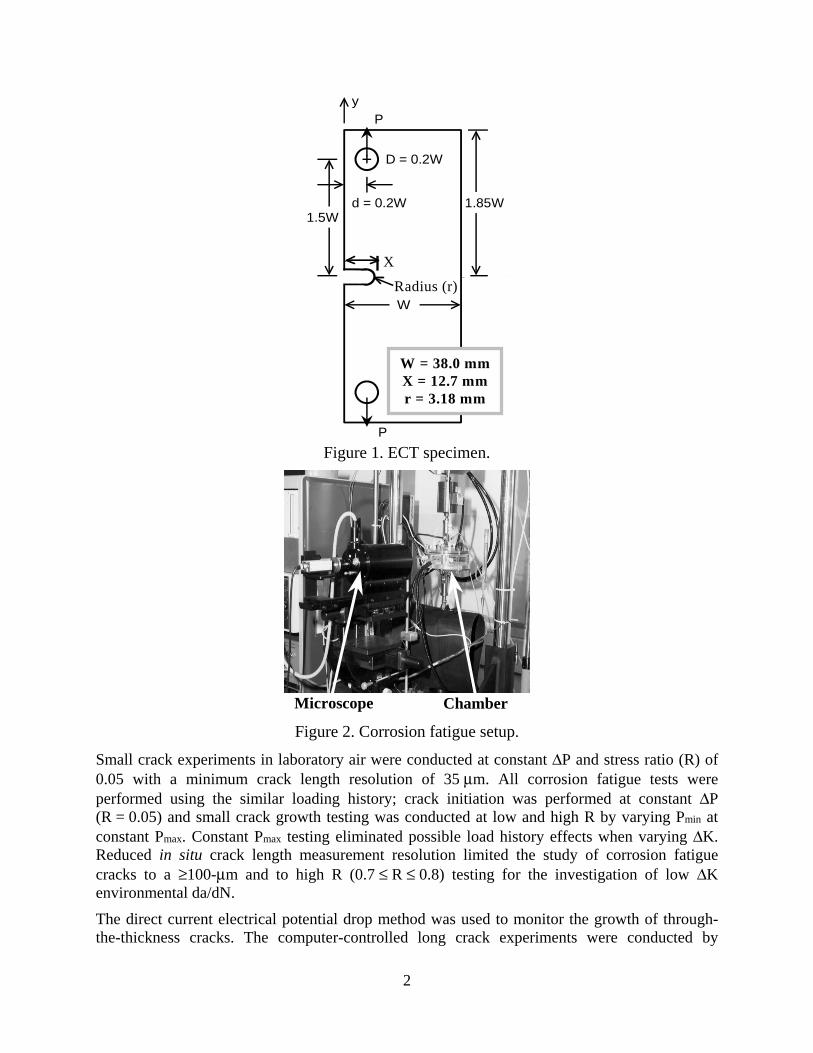
Constant amplitude fatigue crack growth experiments were conducted using a pin-loaded extended compact tension (ECT) specimen (also known as the eccentrically loaded single-edge cracked tension specimen) as shown in Fig. 1. The blunt notched alloy 7075-T6 sheet specimens were oriented in the longitudinal-transverse (L-T) direction. The growth of small surface and corner cracks located at the root of the polished (through 0.3-μm diamond paste) blunt notch were monitored in situ by using the long focal length (×500 magnification) microscope shown in Fig. 2. The surface crack length (a) was measured to an accuracy of approximately 3 μm in air and 5 μm in salt water. The acetate replica method [5] was also used to verify microscope-based surface dimension of small cracks at the root of the notch. Crack length measurements were conducted while the specimen remained at 70% of maximum load. Small surface and corner crack growth rates and stress intensity factors were calculated assuming uniform semicircular crack geometry and procedures documented elsewhere [4].
2
Figure 1. ECT specimen.
Figure 2. Corrosion fatigue setup.
Small crack experiments in laboratory air were conducted at constant ΔP and stress ratio (R) of 0.05 with a minimum crack length resolution of 35 μm. All corrosion fatigue tests were performed using the similar loading history; crack initiation was performed at constant ΔP (R = 0.05) and small crack growth testing was conducted at low and high R by varying Pmin at constant Pmax. Constant Pmax testing eliminated possible load history effects when varying ΔK. Reduced in situ crack length measurement resolution limited the study of corrosion fatigue cracks to a ≥100-μm and to high R (0.7 ≤ R ≤ 0.8) testing for the investigation of low ΔK environmental da/dN.
The direct current electrical potential drop method was used to monitor the growth of through-the-thickness cracks. The computer-controlled long crack experiments were conducted by
y
c
D = 0.2W
d = 0.2W 1.85W1.5W
W
P
P
X2
X
W = 38.0 mmX = 12.7 mmr = 3.18 mm
Radius (r)
Microscope Chamber

3
continuously adjusting the load to maintain the programmed ΔK and R. The decreasing ΔK test was conducted at variable R (0.2 ≤ R ≤ 0.09) at a constant Kmax (15 MPa√m).
A 1.5-litre O-ring sealed plastic chamber, shown in Fig. 2, was used for salt-water corrosion fatigue experiments. The mid-half of the ECT specimen was continuously immersed in helium deaerated 1% NaCl (pH = 8) solution. All aqueous NaCl experiments were conducted at constant electrode potential using a potentiostat, two fully immersed platinum counter electrodes, and a silver/silver chloride (Ag/AgCl) reference electrode. All deaerated corrosion fatigue experiments were conducted at a constant electrochemical potential of −830 mVSCE (approximately 100 mVSCE cathodic of the breakaway or pitting potential). The distilled water/salt solution was continuously circulated through the test chamber at a rate of 30 ml/min. from a reservoir containing 25 liters of argon deaerated NaCl solution. A quartz window located on the side of the chamber and adjacent to the notch was used for in situ long focal length microscope viewing of the notch root surface fatigue cracks.
3.0 Experimental Results and Discussion
3.1 Fatigue Crack Growth Rate
Figure 3 shows the crack growth characteristics of small surface and corner cracks in air at R = 0.05. Here, data are shown for a range of crack lengths, 10 μm ≤ a ≤ 1000 μm for replica-based measurements and 35 μm ≤ a ≤ 1400 μm for microscope-based measurements. Typical of small crack data, the scatter is presumed to be a result of crack-front/microstructure interaction [2]. A power law fit of the microscope and replica data (solid and dotted lines, respectively) show that both measurement techniques yield nearly identical small crack da/dN for alloy 7075. Further comparisons with literature small crack data (dashed line power law fit) for similar low R (R = 0) show that the ECT results correlate well with replica-based data from single edge notch tests [6]. Long crack growth characteristics (R = 0) are similar to small crack da/dN for ΔK > 3 MPa√m, but small cracks exhibit accelerated da/dN in the long crack growth threshold regime.
Figure 3. The fatigue crack growth characteristics of small cracks in air.
Range of Stress Intensity Factor (MPa m1/2)
1 10
Fat
igu
e C
rac
k G
row
th R
ate
(m
m/c
ycle
)
10-7
10-6
10-5
10-4
10-3
Alloy 7075-T6 Laboratory AirMicroscope Data
Replica Data
Replica (NASA/CAE)Long Crack (NASA/CAE)
4
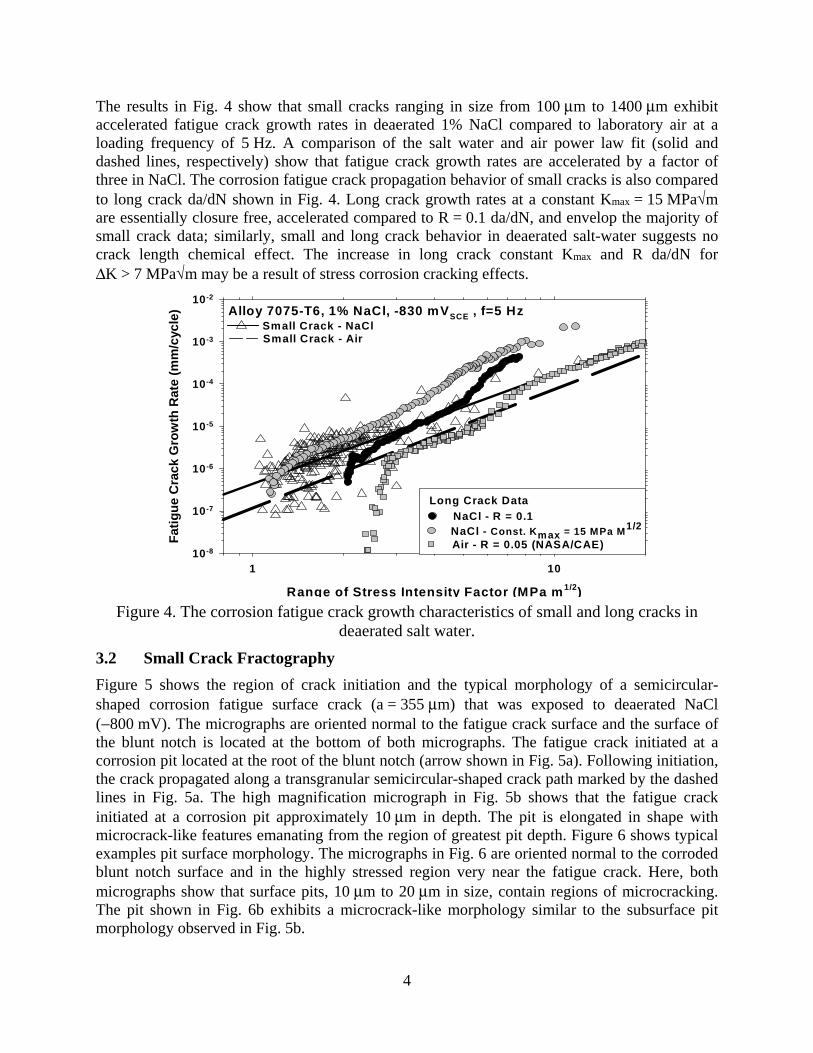
The results in Fig. 4 show that small cracks ranging in size from 100 μm to 1400 μm exhibit accelerated fatigue crack growth rates in deaerated 1% NaCl compared to laboratory air at a loading frequency of 5 Hz. A comparison of the salt water and air power law fit (solid and dashed lines, respectively) show that fatigue crack growth rates are accelerated by a factor of three in NaCl. The corrosion fatigue crack propagation behavior of small cracks is also compared to long crack da/dN shown in Fig. 4. Long crack growth rates at a constant Kmax = 15 MPa√m are essentially closure free, accelerated compared to R = 0.1 da/dN, and envelop the majority of small crack data; similarly, small and long crack behavior in deaerated salt-water suggests no crack length chemical effect. The increase in long crack constant Kmax and R da/dN for ΔK > 7 MPa√m may be a result of stress corrosion cracking effects.
Figure 4. The corrosion fatigue crack growth characteristics of small and long cracks in
deaerated salt water.
3.2 Small Crack Fractography
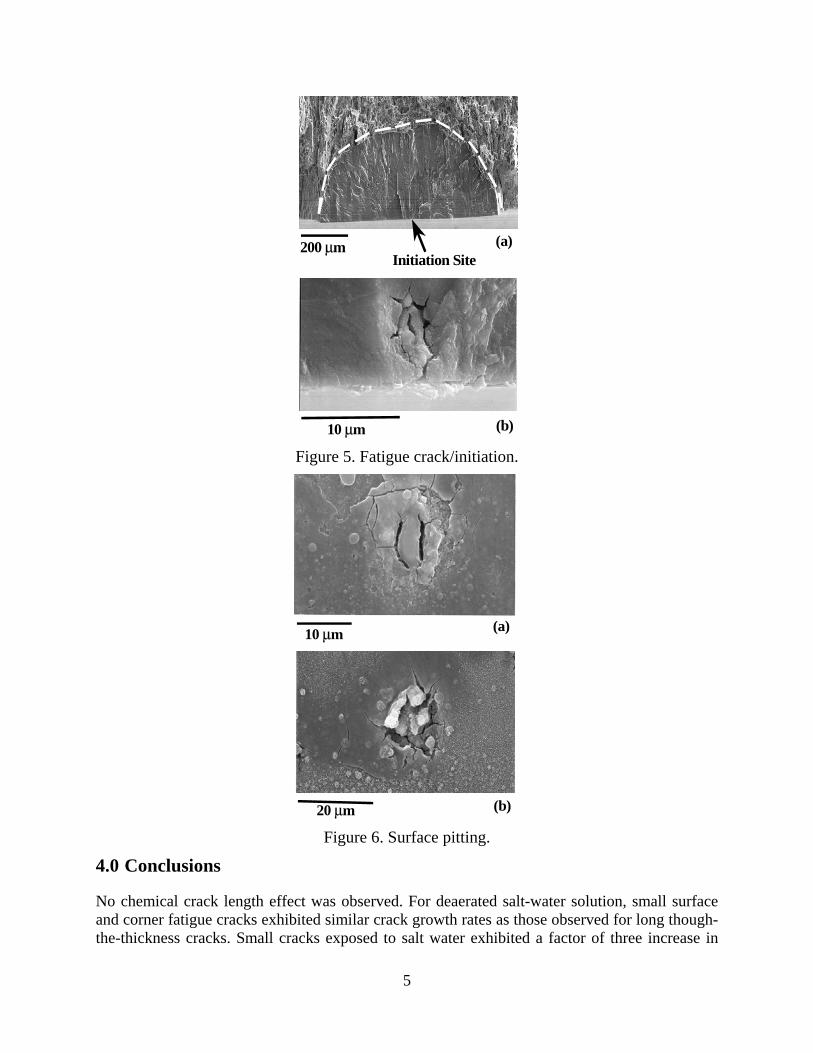
Figure 5 shows the region of crack initiation and the typical morphology of a semicircular-shaped corrosion fatigue surface crack (a = 355 μm) that was exposed to deaerated NaCl (−800 mV). The micrographs are oriented normal to the fatigue crack surface and the surface of the blunt notch is located at the bottom of both micrographs. The fatigue crack initiated at a corrosion pit located at the root of the blunt notch (arrow shown in Fig. 5a). Following initiation, the crack propagated along a transgranular semicircular-shaped crack path marked by the dashed lines in Fig. 5a. The high magnification micrograph in Fig. 5b shows that the fatigue crack initiated at a corrosion pit approximately 10 μm in depth. The pit is elongated in shape with microcrack-like features emanating from the region of greatest pit depth. Figure 6 shows typical examples pit surface morphology. The micrographs in Fig. 6 are oriented normal to the corroded blunt notch surface and in the highly stressed region very near the fatigue crack. Here, both micrographs show that surface pits, 10 μm to 20 μm in size, contain regions of microcracking. The pit shown in Fig. 6b exhibits a microcrack-like morphology similar to the subsurface pit morphology observed in Fig. 5b.
Alloy 7075-T6, 1% NaCl, -830 mVSCE , f=5 Hz
Range of Stress Intensity Factor (MPa m 1/2)
1 10
Fat
igu
e C
rac
k G
row
th R
ate
(mm
/cyc
le)
10-8
10-7
10-6
10-5
10-4
10-3
10-2
Small Crack - NaClSmall Crack - Air
NaCl - Const. Kmax = 15 MPa M1/2 Air - R = 0.05 (NASA/CAE)
NaCl - R = 0.1
Long Crack Data
5
Figure 5. Fatigue crack/initiation.
Figure 6. Surface pitting.
4.0 Conclusions
No chemical crack length effect was observed. For deaerated salt-water solution, small surface and corner fatigue cracks exhibited similar crack growth rates as those observed for long though-the-thickness cracks. Small cracks exposed to salt water exhibited a factor of three increase in
200 μmInitiation Site
10 μm
(a)
(b)
20 μm
10 μm (a)
(b)
6
da/dN compared to small crack growth rates in air. A similar factor of three increase in long crack da/dN (R = 0.1) was observed in NaCl compared to long crack growth rates (R = 0.05) in air. Presumably, small crack growth rate data shown herein was truncated near a ΔK = 1 MPa√m due to crack length resolution. It is likely that small cracks grow at accelerated rates for ΔK < 1 MPa√m.
5.0 References
1. Newman, J. C., Jr.; Phillips, E. P.; Swain, M. H.; and Everett, R. A., Jr.: Fatigue Mechanics: An Assessment of a Unified Approach to Life Prediction, pp. 5-27, “Advances in Fatigue Lifetime Predictive Techniques,” eds. Mitchell, M. R.; and Landgraf, R. W., ASTM STP1122, 1992.
2. Ritchie, R. O.: “Small Fatigue Cracks,” ed. J. Lankford, TMS-AIME, Warrendale, PA, 1986.
3. Gangloff, R.; and Wei, R.: in “Small Fatigue Cracks,” ed. J. Lankford, TMS-AIME, Warrendale, PA, 1986, pp. 239-264.
4. Piascik, R. S.; and Willard, S. A.: “The Growth of Small Corrosion Fatigue Cracks In Alloy 2024,” Journal of Fatigue & Fracture of Engineering Materials & Structures, Vol. 17, No. 11, pp. 1247-1259, 1994.
5. Swain, M. H.: Monitoring Small-Crack Growth by the Replication Method, pp. 34-56, “Small-Crack Test Methods,” eds. Larsen, J. M.; and Allison, J. E., ASTM STP1149, 1992.
6. Newman, J. C., Jr.; Wu, X. R.; Venneri, S. L.; and Li, C. G.: Small Crack Effects in High-Strength Aluminum Alloys, NASA-RP-1309, 1994.
REPORT DOCUMENTATION PAGEForm Approved
OMB No. 0704-0188
2. REPORT TYPE
Technical Memorandum 4. TITLE AND SUBTITLE
The Growth of Small Corrosion Fatigue Cracks in Alloy 70755a. CONTRACT NUMBER
6. AUTHOR(S)
Piascik, Robert S.
7. PERFORMING ORGANIZATION NAME(S) AND ADDRESS(ES)
NASA Langley Research CenterHampton, VA 23681-2199
9. SPONSORING/MONITORING AGENCY NAME(S) AND ADDRESS(ES)
National Aeronautics and Space AdministrationWashington, DC 20546-0001
8. PERFORMING ORGANIZATION REPORT NUMBER
L-20516
10. SPONSOR/MONITOR'S ACRONYM(S)
NASA
13. SUPPLEMENTARY NOTES
12. DISTRIBUTION/AVAILABILITY STATEMENTUnclassified - UnlimitedSubject Category Availability: NASA CASI (443) 757-5802
19a. NAME OF RESPONSIBLE PERSON
STI Help Desk (email: [email protected])
14. ABSTRACT
The corrosion fatigue crack growth characteristics of small (>35 m) surface and corner cracks in aluminum alloy 7075 is established. The early stage of crack growth is studied by performing in situ long focal length microscope (500×) crack length measurements in laboratory air and 1% sodium chloride (NaCl) environments. To quantify the "small crack effect" in the corrosive environment, the corrosion fatigue crack propagation behavior of small cracks is compared to long through-the-thickness cracks grown under identical experimental conditions. In salt water, long crack constant Kmax growth rates are similar to small crack da/dN.
15. SUBJECT TERMS
Fatigue Crack Growth; Corrosion; Fractography; Extended Compact Tension; Aluminum Alloy
18. NUMBER OF PAGES
13
19b. TELEPHONE NUMBER (Include area code)
(443) 757-5802
a. REPORT
U
c. THIS PAGE
U
b. ABSTRACT
U
17. LIMITATION OF ABSTRACT
UU
Prescribed by ANSI Std. Z39.18Standard Form 298 (Rev. 8-98)
3. DATES COVERED (From - To)
5b. GRANT NUMBER
5c. PROGRAM ELEMENT NUMBER
5d. PROJECT NUMBER
5e. TASK NUMBER
5f. WORK UNIT NUMBER
869021.03.07.01.07
11. SPONSOR/MONITOR'S REPORT NUMBER(S)
NASA/TM-2015-218672
16. SECURITY CLASSIFICATION OF:
The public reporting burden for this collection of information is estimated to average 1 hour per response, including the time for reviewing instructions, searching existing data sources, gathering and maintaining the data needed, and completing and reviewing the collection of information. Send comments regarding this burden estimate or any other aspect of this collection of information, including suggestions for reducing this burden, to Department of Defense, Washington Headquarters Services, Directorate for Information Operations and Reports (0704-0188), 1215 Jefferson Davis Highway, Suite 1204, Arlington, VA 22202-4302. Respondents should be aware that notwithstanding any other provision of law, no person shall be subject to any penalty for failing to comply with a collection of information if it does not display a currently valid OMB control number.PLEASE DO NOT RETURN YOUR FORM TO THE ABOVE ADDRESS.
1. REPORT DATE (DD-MM-YYYY)
01 - 201501-


![Early Corrosion Fatigue Damage on Stainless Steels Exposed ... · surrounding environment [13,14]. Then, corrosion fatigue is defined as a synergistic effect in which corrosion and](https://static.fdocuments.us/doc/165x107/6047f176e1f3ef03307425bb/early-corrosion-fatigue-damage-on-stainless-steels-exposed-surrounding-environment.jpg)


