The Greenhouse Gas Protocol - World Resources Institute · PDF file1 Table of contents Table...
68
The Greenhouse Gas Protocol a corporate accounting and reporting standard World Resources Institute
Transcript of The Greenhouse Gas Protocol - World Resources Institute · PDF file1 Table of contents Table...

The Greenhouse Gas Protocol a corporate accounting and reporting standard
World Resources Institute

PROJECT DIRECTORS
Janet Ranganathan World Resources InstituteDave Moorcroft World Business Council for Sustainable DevelopmentJasper Koch World Business Council for Sustainable DevelopmentPankaj Bhatia World Resources Institute
PROJECT MANAGEMENT TEAM
Bryan Smith Innovation Associates Hans Aksel Haugen Norsk HydroVicki Arroyo Cochran Pew Center on Global Climate ChangeAidan J. Murphy Shell InternationalSujata Gupta Tata Energy Research InstituteYasuo Hosoya Tokyo Electric Power CompanyRebecca Eaton World Wildlife Fund
CORE ADVISORS
Mike McMahon BP Don Hames Dow Chemical CanadaBruno Vanderborght HolcimMelanie Eddis KPMGKjell Øren Norsk HydroLaurent Segalen PricewaterhouseCoopersMarie Marache PricewaterhouseCoopersRoberto Acosta UNFCCCVincent Camobreco U.S. EPACynthia Cummis U.S. EPAElizabeth Cook World Resources Institute
1
Table of contents
Table ofcontents
INTRODUCTION
The Greenhouse Gas Protocol Initiative
CHAPTER 1
GHG accounting and reporting principles
CHAPTER 2
Business goals and inventory design
CHAPTER 3
Setting organizational boundaries
CHAPTER 4
Setting operational boundaries
CHAPTER 5
Accounting for GHG reductions
CHAPTER 6
Setting a historic performance datum
CHAPTER 7
Identifying and calculating GHG emissions
CHAPTER 8
Managing inventory quality
CHAPTER 9
Reporting GHG emissions
CHAPTER 10
Verification of GHG emissions
References
Appendices
Glossary
List of contributors
About WRI and WBCSD
2
10
6
14
20
26
30
34
40
44
48
51
52
56
60
64

2
The mission of the Greenhouse Gas Protocol Initiative (GHG Protocol) is
to develop and promote internationally accepted greenhouse gas
(GHG) accounting and reporting standards through an open and
inclusive process.
Jointly convened in 1998 by the World Business Council for
Sustainable Development (WBCSD) and the World Resources Institute
(WRI), the GHG Protocol is a unique multi-stakeholder partnership of
businesses, NGOs, and governments that serves as the premier source
of knowledge about corporate GHG accounting and reporting.
This corporate accounting and reporting standard draws on the
expertise and contributions of numerous individuals and
organizations from around the world. The resulting standard and
guidance are supplemented by a number of user-friendly GHG
calculation tools on the GHG Protocol website (www.ghgprotocol.org).
The standard, guidance, and tools will help companies and
other organizations:
• develop a credible GHG inventory underpinned by GHG
accounting and reporting principles
• account and report information from global operations in a way
that presents a clear picture of GHG impacts, and facilitates
understanding as well as comparison with similar reports
• provide internal management with valuable information on which
to build an effective strategy to manage and reduce GHG emissions
• provide GHG information that complements other climate
initiatives and reporting standards, including financial standards
The Greenhouse Gas Protocol Initiative
Introduction

Introduction
This first edition of the GHG Protocol comprises GHG
accounting and reporting standards, and guidelines for
companies and other types of organizations1. It addresses the
accounting and reporting of the six greenhouse gases2
covered by the Kyoto Protocol.
Unlike for financial accounting and reporting, there are no
‘generally accepted accounting and reporting practices’ for
corporate GHG emissions. The GHG Protocol is a significant
milestone on the journey toward generally accepted GHG
accounting and reporting practices. It builds on extensive
dialogue, which has taken place between diverse stakeholder
groups over the last three years; on the road testing of an
earlier draft by more than 30 companies in 10 countries; and
on extensive peer reviews. It is intended that in the future the
GHG Protocol will be revised using feedback from its
application.
GHG emissions – a business issue
Many governments are taking steps to reduce GHG emissions
through national policies. These include the introduction of
permit trading systems; voluntary reduction and reporting
programs; carbon or energy taxes; and regulations and
standards on energy efficiency and emissions.
In recent years, global warming and climate change have
become international issues for both industrialized and
developing countries. They will undoubtedly continue to be
important politically and economically for generations to
come. Increasingly, companies will need to understand and
manage their GHG risks in order to maintain their license to
operate, to ensure long-term success in a competitive business
environment, and to comply with national or regional policies
aimed at reducing corporate GHG emissions.
Measuring and reporting GHG emissions
Performance measurement plays an essential role in strategy
development and evaluating to what extent organizational
objectives have been met. Credible GHG accounting will be a
prerequisite for participation in GHG trading markets and for
demonstrating compliance with government regulations. At an
operational level, GHG emissions performance may be relevant
to eco-efficiency involving dematerialization of products and
processes, energy efficiency, and the reduction of waste.
The benefits of a common standard
In addition to ensuring that GHG performance measures are
relevant and useful, their success will also depend on ensuring
that benefits outweigh costs. To achieve this, two objectives
must be met.
Firstly, the time and cost of developing GHG accounting andreporting systems must be kept as low as possible. The GHGProtocol helps to meet this objective by providing user-friendly and systematic guidance. Secondly, a corporateGHG inventory must be developed in such a way as to becompatible with requirements and standards which may bedeveloped nationally in the future. At present, the diversityof accounting and reporting practices makes it harder todevelop such an inventory, and reduces the comparability,credibility, and utility of GHG information.
The GHG Protocol builds on the experience and knowledgeof many organizations, practitioners, and stakeholders topromote convergence of GHG accounting practices. In thisway, it will reduce costs, improve comparability, andstrengthen the capacity of managers to make informeddecisions on GHG risks and opportunities. The GHG Protocolwill also render reported information credible and reliable inthe eyes of external stakeholders.
As national regulatory schemes governing GHGs are stillevolving, it is not possible to predict the exact accountingand reporting requirements of the future. The GHG Protocol,however, will help companies better understand their ownposition as regulatory programs are debated and developed.
Buy-in and flexibility An important starting point for a company contemplatingGHG performance measurement is to understand where themeasures link with the company’s business drivers, and whattheir relevance to company performance will be. This willalso encourage buy-in to the system from employees andsenior management who may be faced with a range ofcompeting objectives. The guidelines have been assembledto reflect these needs and to suit a variety of organizations.Since the GHG Protocol is concerned with accounting foremissions at the corporate level, it covers a number of issuesthat are not touched upon by other reporting schemes andguidelines, such as how to draw organizational andoperational boundaries for a GHG inventory.
Relation to other measurement and reportingguidelinesThe GHG Protocol is compatible with most other emergingGHG reporting schemes since emissions data accounted foron the basis of the GHG Protocol will meet the reportingrequirements of most of these. The GHG calculation toolsavailable on the website (www.ghgprotocol.org) areconsistent with those proposed by the IntergovernmentalPanel on Climate Change (IPCC) for the compilation ofemissions at the national level (IPCC, 1996a). Many arerefined to be user-friendly for non-technical company staff,
3
The Greenhouse Gas Protocol Initiative

and to increase the accuracy of emissions data at companylevel.
Thanks to help from many companies, organizations, andindividual experts through an intensive road test and peerreview phase, these tools represent current best practice in theevolving area of corporate GHG accounting.
Future activities of the GHG Protocol
The GHG Protocol will continue to serve as a process by which toimprove and further develop accounting and reportingstandards in the future, and to broaden the base of users andstakeholder input. This includes building bridges with existingand emerging climate initiatives.
Feedback is invited and encouraged from organizations usingthese guidelines to account and report on their GHGemissions, as well as from users of reported information. Twoadditional accounting modules are under development thataddress accounting for GHG emissions in the value chain andproject-based GHG reduction activities. Further information isavailable at www.ghgprotocol.org
4
The Greenhouse Gas Protocol Initiative
Frequently asked questions Below is a list of frequently asked questions, with directions torelevant sections of the document.
• What should I consider when setting out to account forand report GHG emissions? Chapter 2
• How do I deal with complex company structures andshared ownership?Chapter 3
• What is the difference between direct and indirectemissions and what is their relevance?Chapter 4
• How do I account for GHG reductions? Chapter 5
• What is a base year and why do I need one?Chapter 6
• My GHG emissions will change with acquisitions anddivestitures. How do I account for these?Chapter 6
• How do I identify my company’s GHG emissions sources?Chapter 7
• What data collection activities and data managementissues do my operational facilities have to deal with?Chapter 7
• What kinds of tools are there to help me calculate GHGemissions?Chapter 7
• What determines the quality and credibility of my GHGemissions information?Chapter 8
• What information should I report?Chapter 9
• What data must be available to obtain external verificationof the inventory data?Chapter 10

5
The Greenhouse Gas Protocol Initiative
CHAPTER 1 GHG accounting and reporting principlesGuidance on GHG accounting and reporting principles
CHAPTER 2 Business goals and inventory design
CHAPTER 3 Setting organizational boundariesGuidance on setting organizational boundaries
CHAPTER 4 Setting operational boundariesGuidance on setting operational boundaries
CHAPTER 5 Accounting for GHG reductions
CHAPTER 6 Setting a historic performance datumGuidance on setting a historic performance datum
CHAPTER 7 Identifying and calculating GHG emissions
CHAPTER 8 Managing inventory quality
CHAPTER 9 Reporting GHG emissionsGuidance on reporting GHG emissions
CHAPTER 10 Verification of GHG emissions
Navigating your way through thisdocument
Whilst every effort has been made to keep this document asconcise as possible, the diversity and complexity of GHGaccounting and reporting issues necessitate comprehensivecoverage. This section will help you navigate your waythrough the document.
The GHG Protocol comprises three types of sections: GHGaccounting and reporting standards (blue pages), guidanceon applying standards (orange pages), and practical adviceranging from designing a GHG inventory to verifyingemissions data (green pages).
The order of contents presented below demonstrates a logicalprogression for companies aiming to implement the GHGProtocol.
1 Throughout the rest of this document, the term ‘company’ is used as shorthand for‘companies and other types of organizations’.
2 Carbon dioxide (CO2), methane (CH4), nitrous oxide (N2O), Hydrofluorocarbons(HFCs), Perfluorcarbons (PFCs) and Sulphur Hexafluoride (SF6).
NOTES

6
As with financial reporting, generally accepted GHG accounting
principles are intended to underpin GHG accounting and reporting
to ensure that:
• the reported information represents a true and fair account of an
organization’s GHG emissions
• the reported information is credible and unbiased in its treatment
and presentation of issues
GHG accounting and reporting is evolving and is new to many. The
principles outlined in this chapter are the outcome of a collaborative
process involving a wide range of technical, environmental, and
accounting disciplines.
GHG accounting and reporting principles
Chapter 1

GHG accounting and reporting should be based on the following principles:
7
GHG accounting and reporting principles
Define boundaries that appropriately reflect the GHGemissions of the business and the decision-making needsof users.
Account for all GHG emissions sources and activitieswithin the chosen organizational and operationalboundaries. Any specific exclusions should be stated andjustified.
Allow meaningful comparison of emissions performanceover time. Any changes to the basis of reporting shouldbe clearly stated to enable continued valid comparison.
Address all relevant issues in a factual and coherentmanner, based on a clear audit trail. Importantassumptions should be disclosed and appropriatereferences made to the calculation methodologies used.
Exercise due diligence to ensure that GHG calculationshave the precision needed for their intended use, andprovide reasonable assurance on the integrity ofreported GHG information.
• Relevance
• Completeness
• Consistency
• Transparency
• Accuracy

8
Guidance on GHG accounting and reporting principles
RelevanceIt is necessary to define accounting and reportingboundaries that appropriately reflect the GHG emissions ofyour business. The choice of appropriate boundariesdepends on the characteristics of the company, theintended purpose of the GHG information, and the needsof the users. When choosing such boundaries, a number ofdifferent dimensions need to be considered such as: • organizational structures: operating licenses, ownership,
legal agreements, joint ventures, etc.• operational boundaries: on-site and off-site activities,
processes, services and impacts• the business context: nature of activities, geographic
locations, industry sector(s), purpose of information,users of information
• specific exclusions or inclusions and their validity andtransparency
The boundaries should represent the substance andeconomic reality of the business, and not merely its legalform.
More information on setting appropriate boundaries isprovided in: • Chapter 2: Business goals and inventory design• Chapter 3: Setting organizational boundaries• Chapter 4: Setting operational boundaries
CompletenessIdeally all emissions sources within the chosenorganizational and operational boundaries should bereported. In practice, a lack of data or the cost ofgathering data may be a limiting factor. If specific sourcesare not reported, this needs to be clearly stated in thereport. Sometimes it is tempting to define a materialitythreshold, i.e. stating that sources not exceeding a certainsize are omitted. However, the materiality of a source canonly be established after it has been assessed. This impliesthat some data is available and can be included in the GHGinventory – even if it is just an estimate. What is consideredmaterial will also depend on the needs of users and thesize of a company and its emissions sources.
ConsistencyUsers of GHG information will often want to track andcompare GHG emissions information over time in order toidentify trends and to assess the performance of thereporting organization. Conformity over time, with thesame approach and practices in the calculation andpresentation of data, is essential. If there is a change in thebasis of reported information, this should be clearly stated.
In addition, when presenting GHG information, it isimportant to provide sufficient economic/business contextto justify and explain any significant changes. This enablescontinued comparison of like with like. The way in whichdata and activities are described will affect users’ ability tounderstand GHG information. Technical and scientificterms should be used carefully. Since GHG accounting andreporting is new to many companies and stakeholders, thelevel of knowledge of different user groups of GHGemissions data may be quite varied.
More information on this is provided in:• Chapter 6: Setting a historic performance datum• Chapter 9: Reporting GHG emissions
TransparencyTransparency relates to the degree to which reportedinformation is seen as being reliable. It entails being openwith relevant issues and data. Information is usually judged‘transparent’ when it conveys a good understanding of theissues in the context of the reporting company, and whenit provides a meaningful assessment of performance. Anindependent external verification is a good way ofincreasing transparency.
More information on this is provided in: • Chapter 9: Reporting GHG emissions• Chapter 10: Verification of GHG emissions
AccuracyAccurate data is important for making decisions. Poorinternal calculation/reporting systems and the inherentuncertainties in the calculation methodology applied canjeopardize accuracy. In an emissions inventory, a poorcalculation/reporting system (i.e. a systemic error) canresult from an emissions calculation process in which some
Guidance on GHG accounting and reporting principles

aspect of real-world emissions production is misstated or isnot taken into account. In contrast to a poor reportingsystem, inherent uncertainties result from the intrinsicvariability in the process causing the emissions and theassociated calculation methodology. Adhering toprescribed and tested GHG calculation methodologies, andputting in place a robust accounting and reporting systemwhich has appropriate internal and external controls, canimprove data accuracy.
More information on how to increase your inventory’saccuracy and on how to minimize data uncertainties isprovided in: • Chapter 8: Managing inventory quality
9
Guidance on GHG accounting and reporting principles
Volkswagen: Maintaining relevance andcompleteness over time
While working on its 2000 GHG inventory, Volkswagenrealized that the structure of its emissions sources hadundergone considerable changes over the last five years.Emissions from production processes, which wereconsidered to be irrelevant at a corporate level in 1996,were assessed and found to constitute almost 20 percent ofaggregate corporate GHG emissions.
New sites for engine testing and the investment intomagnesium die-casting equipment at certain productionsites were examples of growing emissions sources.Volkswagen’s experience demonstrates that emissionssources have to be regularly re-assessed to maintain acomplete and relevant inventory over time.

10
Improving your understanding of your company’s GHG emissions by
compiling a GHG inventory makes good business sense. The four
categories of business goals most frequently listed by companies as
reasons for compiling a GHG inventory are the following:
• GHG risk management
• public reporting/participation in voluntary initiatives
• GHG markets
• regulatory/government reporting
Business goals and inventory design
Chapter 2

GHG risk management• identifying GHG risks and reduction opportunities in the
value chain• setting internal targets, measuring and reporting progress• identifying cost effective reduction opportunities• developing process/product innovations• internal/external benchmarking
Public reporting/participation in voluntary initiatives• stakeholder reporting, e.g. Global Reporting Initiative • voluntary non-governmental organization (NGO)
programs, e.g. Climate Neutral Network, WWF ClimateSavers Program, Environmental Resources Trust
• voluntary government programs, e.g. Canadian ClimateChange Voluntary Challenge and Registry, AustralianGreenhouse Challenge Program, California Climate ActionRegistry, and US EPA Climate Leaders Initiative
• eco-labeling and certification
GHG markets • buying or selling emissions credits• cap and trade allowance trading programs, e.g. UK
Emissions Trading Scheme, Chicago Climate Exchange
Regulatory/government reporting• directives, e.g. European Integrated Pollution Prevention
and Control Directive, European Pollutant EmissionRegister
• reporting under national or local regulations, e.g.Canadian National Pollutant Release Inventory
• carbon taxes• baseline protection
This list is not exhaustive – companies may have otherimportant goals for an inventory. In practice, most companieshave multiple goals. It therefore makes sense that, from theoutset, the inventory is designed to provide information for avariety of different uses and users. To this end, informationshould be collected in ways that it can be subsequentlyaggregated and dis-aggregated for different operational andorganizational boundaries, and for different businessgeographic scales, e.g. state, country, Annex 1 countries, non-Annex 1 countries, facility, business unit, and company.
The guidance on operational boundaries in Chapter 4: Settingoperational boundaries, provides information on settingboundaries for different inventory goals and uses.
GHG risk managementFor companies developing a GHG inventory for the first time,information that helps them more effectively manage thebusiness risks and opportunities associated with potential GHGconstraints can be an important motivator.
An inventory of direct GHG emissions, as well as emissionsoccurring up- and downstream of operations, will provide anassessment of the company’s GHG exposure. It will help thecompany respond more effectively to any move towardregulations and caps governing GHG emissions, as well astoward shifts in consumer preferences based on corporateGHG performance and reputation. Policies that increase theprice of fossil fuels and electricity may have a profound impacton the future competitive performance of companies in theGHG intensive sectors.
Conducting a rigorous GHG inventory is also a prerequisite forsetting GHG reduction goals and for identifying opportunitiesfor reductions.
Public reporting/participation in voluntary initiativesCompanies with global operations may want to develop asingle corporate GHG inventory that enables them toparticipate in a number of NGO and government schemes indifferent locations. Companies preparing sustainability reportsusing the Global Reporting Initiative guidelines will need toreport information on their GHG emissions (GRI, 2000).
Adoption of the GHG Protocol standard provides sufficientinformation to meet the GHG accounting requirements ofmost of these voluntary initiatives. Appendix 1 provides anoverview of the GHG accounting and reporting requirements
11
Business goals and inventory design
Rio Tinto: Setting a GHG reduction target
Rio Tinto mines and processes natural resources. In 1999, itpublished a three-year five percent improvement target andhas subsequently reported positive annual progress. TheGHG reduction goal was set for two reasons. Firstly, it wasrealised that targets would increase the company’s rate ofenvironmental performance improvement and, secondly,stakeholders were asking which direction the companywanted to go. The reduction target was developed in amanner that the company believed measured actualperformance, and was aligned with business improvement.It was only developed after confidence in the GHGaccounting methodology had been gained throughpreparing a number of annual inventories and projections.

of different voluntary programs on climate change.
Since the accounting guidelines of many voluntary schemesare periodically updated, companies planning to participateare advised to contact the scheme administrator to checkwhat the current requirements are. Some schemes may makemore demands on the company than others.
The Australian Greenhouse Challenge Program, for example,requires participants to develop an action plan of GHGreduction measures as well as a forecast of GHG emissionswith and without implementation of the action plan. TheWWF Climate Savers Program requires participants to committo an overall GHG reduction goal and to obtain anindependent verification of current CO2 emissions as abaseline for performance.
GHG markets and regulatory/government reportingGHG markets and regulatory approaches to greenhouse gasemissions are beginning to emerge in some parts of theworld. Shell and BP have already established internal GHGemissions trading programs as part of their overall GHGmanagement strategy. It is not possible, however, at this earlystage, to design a comprehensive GHG accounting systemthat will meet the future requirements of all the differentregulatory and market based mechanisms. Different schemeswill evolve with different inventory requirements. With this inmind, the GHG Protocol standard has been designed toprovide GHG information building blocks that can be used asthe foundation for supporting a variety of informationrequirements, including those resulting from regulatory ormarket based systems.
It is likely that future regulatory and trading schemes willimpose additional layers of accounting specificity relating towhich facilities are included; which GHG sources areaddressed; how base years are established; the type ofcalculation methodology used; the choice of emissions factors;and the monitoring and verification approaches employed.However, the broad participation and best practicesincorporated into the GHG Protocol are likely to inform theaccounting requirements of future schemes. Chapter 4:Setting operational boundaries, describes the GHG reportingrequirements under the European Pollutant Emissions Registerand Integrated Pollution Prevention Control Directive. Again,it is important to check the specific requirements, as these aresubject to change.
For emissions trading, where compliance is to be judged bycomparing the inventory with the emissions cap, it is likelythat a rigorous and accurate inventory of direct emissions will
generally be required. Indirect emissions are difficult to verifyand present particular challenges in terms of avoiding doublecounting of emissions. To facilitate independent verification,emissions trading may require that participating companiesestablish an audit trail for emissions data (see Chapter 10:Verification of GHG emissions). Over time, as the importanceof emissions trading grows, emissions inventories will becomeincreasingly transparent, comparable, and accurate.
12
Business goals and inventory design
Ford Motor Company: Experiences roadtesting the GHG Protocol
When Ford Motor Company embarked on an effort tounderstand and reduce its GHG impacts, it wanted to trackemissions with enough accuracy and detail to managethem effectively. An internal cross-functional GHG inventoryteam was formed to accomplish this goal. Although thecompany was already reporting basic energy and carbondioxide data at the corporate level, a more detailedunderstanding of these emissions was essential to set andmeasure progress against performance targets and evaluatepotential participation in external trading schemes.
For several weeks, the team worked on creating a morecomprehensive inventory for stationary combustionsources, and quickly found a pattern emerging. All toooften the team left meetings with as many questions asanswers, and the same questions kept coming up from oneweek to the next. How should the company drawboundaries? How could acquisitions and divestitures beaccounted for? What emissions factors should be used?And perhaps most importantly, how could themethodology be deemed credible with stakeholders?Although the team had no shortage of opinions, there alsoseemed to be no right or wrong answers – until the teamdiscovered the GHG Protocol.
The GHG Protocol provided guidance on answering many ofthe questions. Although at the time, still a road test draft,the GHG Protocol offered a framework upon which to basedecisions, one supported by a diverse set of stakeholders,and with the promise of becoming a global standard.Because of its flexible and progressive nature, the GHGProtocol could be applied at the company’s own pace andtailored to meet its specific needs. As a result of the GHGProtocol, Ford Motor Company now has a more robustinventory of GHGs from stationary sources, one that can becontinually improved to fulfill rapidly emerging GHGmanagement needs.


14
Businesses vary in their legal and organizational structures – these
include incorporated and non-incorporated joint ventures,
subsidiaries and others. Companies may operate globally and
encompass a number of autonomous business streams and business
units.
When accounting for GHG emissions from partially-owned
entities/facilities, it is important to draw clear organizational
boundaries, which should be consistent with the organizational
boundaries which have been drawn up for financial reporting
purposes.
Settingorganizational boundaries
Chapter 3

Financial reporting is based upon the concepts of ‘control’and ‘influence’. The concepts of ‘control’ and ‘influence’ areoften defined and applied differently according to acompany’s specific financial accounting and reportingpolicies/practices. Where possible, it makes sense to followcompany-specific distinctions already in place for financialaccounting, provided these are explicitly explained andfollowed consistently. When applying these concepts theunderlying assumption of ‘substance over form’ should befollowed. This assumption is based on the premise that GHGemissions should be accounted and reported in accordancewith the company’s substance and economic reality and notmerely its legal form.
For the purpose of applying the concepts of ‘control’ and‘significant influence’ to GHG accounting, the followingdefinitions may prove helpful.
Control is defined as the ability of a company to direct theoperating policies of another entity/facility. Usually, if thecompany owns more than 50 percent of the voting interests,this implies control. The holder of the operating license oftenexerts control, however, holding the operating license is not asufficient criteria for being able to direct the operating policiesof an entity/facility. In practice, the actual exercise ofdominant influence itself is enough to satisfy the definition ofcontrol without requiring any formal power or ability throughwhich it arises.
Significant influence: the issue of whether a company hassignificant influence over an entity/facility is likely to havebeen already established by the company-specific financialaccounting and reporting policies/practices. However, whereit is necessary to determine if one company exerts significantinfluence over an entity/facility, the following factors shouldbe considered:• the company owns voting interests of between 20 and 50
percent• the company has the power to participate in the
entity’s/facility’s financial and operating policy decisions• the company has a long-term interest in the entity/facility
Definitions of ‘control’ or ‘significant influence’ apply toincorporated as well as to non-incorporated operations, i.e.GHG emissions have to be reported from incorporated as wellas from non-incorporated entities/facilities. GHG emissionsfrom entities/facilities that are not under significant influenceor control (e.g. the company owns less than 20 percent of thevoting interests) are generally not reported. This is consistentwith financial accounting standards where a company wouldonly recognize revenue if dividends were paid or a loss
incurred if the asset was impaired. However, it is recognizedthat GHG emissions are different in their nature and it may beappropriate for these to be reported to properly reflect thecompany’s overall GHG emissions. If this is the case it isimportant to state this in the public report.
Companies should preferably account for and report theirGHG emissions according to the framework presented inTable 1. This framework is set out to provide GHG emissionsinformation in a transparent manner on the basis ofcontrol/influence and equity share basis. Equity share isdefined as the percentage of economic interest in/benefitderived from an operation. This approach increases theusability of GHG information for different users and aims, asfar as possible, to mirror the approach adopted by financialaccounting and reporting standards.
Where there is a contractual arrangement that covers GHGemissions, the company should defer to this for the purposesof emissions allocation.
15
Setting organizational boundaries

If the reporting company wholly owns all its facilities/entities,simply report the same number under the control and equitycategories and report zero for entities under significantinfluence.
Depending on the needs of users and the accessibility of GHGinformation, a company may determine that it is sufficientonly to report its controlled GHG emissions, and not to reportits equity share of such emissions. If this is the case, it shouldbe clearly stated in the company’s public GHG report.
16
Setting organizational boundaries
Table 1: Accounting for GHG emissions on the basis of control and equity share
Category What to report
Repo
rtin
g fo
r co
ntro
l
Controlled entities/facilitiesEmissions from those entities/facilities, which aredefined as being controlled. It is likely that this willalready be determined by company-specific financialaccounting policies/practices.
This category includes entities/facilities that are:• wholly owned• not wholly owned, but controlled• jointly controlled assets/entities
The concept of jointly controlled assets/entities will haveto be considered based on the specific business andindustry context.
Wholly ownedNot wholly owned but controlledJointly controlled
100% of GHG emissions100% of GHG emissions
Equity share of GHG emissions
A Controlled entities/facilitiesEmissions from those entities/facilities, which aredefined as being controlled. It is likely that this willalready be determined by company-specific financialaccounting policies/practices.
This category includes entities/facilities that are:• wholly owned• not wholly owned, but controlled• jointly controlled assets/entities
Equity share of GHG emissions
If there is a specific contractual arrangement that coversthe division of earnings/production, that arrangementshould be considered. This is likely to be most prominentin the upstream oil and gas industry, and is determinedby company-specific financial accountingpolicies/practices.
B Significant influence – associated entities/facilitiesEmissions from entities/facilities over which the reportingcompany has significant influence but does not control. Itis likely that this will already be determined by company-specific financial accounting policies/practices.
Equity share of GHG emissions
If there is a specific contractual arrangement that coversthe division of earnings/production, that arrangementshould be considered. This is likely to be most prominentin the upstream oil and gas industry, and is determinedby company-specific financial accountingpolicies/practices.
Repo
rtin
g fo
r eq
uity
sh
are
Equity share of GHG emissions Equity share of GHG emissions from entities/facilities thatare controlled or under significant influence ( A + B )

What constitutes ‘control’ and ‘significant influence’ may not
always be obvious. The definitions provided by different
financial accounting and reporting standards such as the
International Accounting Standards (IAS) and US Generally
Accepted Accounting Principles (US GAAP) do not always
converge. Therefore, when accounting for GHG emissions
from partially-owned entities/facilities you should follow, as
closely as possible, the distinctions of ‘control’ and ‘significant
influence’ as applied by your company for the financial
consolidation of such entities/facilities.
By focusing on degree of control/influence, the framework
presented in Table 1 mirrors, as far as possible, the approach
adopted by financial accounting and reporting standards. This
approach is also based on the concept of ‘substance and
economic reality over legal form’. Following a reporting
approach that is consistent with such standards has several
advantages. GHG emissions will, in the near future, become a
liability and, therefore, should be accounted for in the same
way as financial liabilities. In addition, due to the transparent
nature of this framework in terms of the degree of
control/influence exerted over GHG emissions sources,
companies can better assess their GHG risks and
opportunities, leading to well-informed management
decisions.
This framework also provides greater transparency and utility
of information for the different users and uses of GHG
information.
GHG emissions reduction initiatives, and regulatory and
trading schemes often focus on control rather than
ownership. The company holding the operating license might
be asked to report 100 percent of the operations’ GHG
emissions. It is therefore important to distinguish between
operations controlled on the basis of the operating license
and those controlled on the basis of majority voting interest
or other reasons.
For the purpose of public reporting and to inform internal
management decisions, GHG emissions data should show a
complete picture of the reporting company’s GHG emissions,
and therefore cover all categories of control/influence as
specified in Table 1.
In some industry sectors, such as the oil and gas industry, the
economic interest a party receives from an entity can vary
over time depending on the specific agreements in place. For
example, a company owns 50 percent of the voting interests
in an entity, but, based on funding and production sharing
contracts in place, receives 60 percent of the production in
the first three years, and in subsequent years 50 percent.
Therefore, the equity share in years one to three would be 60
percent, with 50 percent in the subsequent years. In most
cases, the equity share will equal the voting interest in the
venture.
17
Guidance on setting organizational boundaries
Guidance on setting organizational boundaries

The following example illustrates how to account for
and report GHG emissions from controlled and owned
entities/facilities on an equity share-based approach and
on a control-based approach.
In the examples presented in Figure 1, it is assumed – with
the exception of Entity D – that the company holding the
majority voting interest also holds the operating license.
18
Guidance on setting organizational boundaries
Company Alpha
Control-based total: 1950 tCO2Equity share: 1630 tCO2
Company Beta
Control-based total: 2050 tCO2Equity share: 2290 tCO2
Entity B (incorporated)
emissions: 400 tCO2
80 %
20 % voting interest
voting interest
voting interest and
voting interest
voting interest
50 %
40 % holding operating license
100 %
50 %
60 %
Entity A (incorporated)
emissions: 700 tCO2
Entity F (incorporated)
emissions: 1000 tCO2
100 % voting interest
voting interest
voting interest
voting interest
voting interestEntity D (incorporated)
emissions: 600 tCO2
Joint Venture C (not incorporated)
emissions: 500 tCO2
Entity E (incorporated)
emissions: 800 tCO2
10 %
90 %
Figure 1: Voting interest held by company Alpha and company Beta

In this example (Figure 1), it is assumed that Company Alpha
controls Entity D, although Alpha does not hold the operating
license for Entity D. Based on the definition of control, it has
to be considered who actually exercises dominant influence
over the operations of Entity D. Clearly, investment decisions
and other significant financial and operational decisions
regarding the operation of Entity D can only be taken with
the consent of Company Alpha, since it holds the majority
voting interest.
19
Guidance on setting organizational boundaries
Category Entities/facilities What to report
wholly owned Entity A (Alpha owns 100%) 100% 700 tCO2
not wholly owned, but controlled Entity B (Alpha owns 80%) 100% 400 tCO2
Entity D (Alpha does not hold operatinglicense but owns 60%)
100% 600 tCO2
jointly controlled Joint Venture C (Alpha controls jointly with Beta) 50% 250 tCO2
Rep
ort
ing
fo
r co
ntr
ol
Control-based total 1950 tCO2
controlled entities/facilities Entity A (Alpha owns 100%) equity share 700 tCO2
Entity B (Alpha owns 80%) equity share 320 tCO2
Entity D (Alpha does not hold operatinglicense but owns 60%)
equity share 360 tCO2
Joint Venture C (Alpha controls jointly with Beta) equity share 250 tCO2
associated entities/facilities -significant influence
Rep
ort
ing
fo
r eq
uity
sh
are
Equity share total 1630 tCO2
Category Entities/facilities What to report
wholly owned Entity F (Beta owns 100%) 100% 1000 tCO2
not wholly owned, but controlled Entity E (Beta owns 90%) 100% 800 tCO2
jointly controlled Joint Venture C (Beta controls jointly with Alpha) 50% 250 tCO2
Rep
ort
ing
fo
r co
ntr
ol
Control-based total 2050 tCO2
controlled Entity F (Beta owns 100%) equity share 1000 tCO2
entities/facilitiesEntity E (Beta owns 90%) equity share 720 tCO2
Joint Venture C (Beta controls jointly with Alpha) equity share 250 tCO2
associated entities/facilities -significant influence
Entity D (Beta holds operating licenseand owns 40%)
equity share 240 tCO2
Entity B (Beta owns 20%) equity share 80 tCO2
Rep
ort
ing
fo
r eq
uity
sh
are
Equity share total 2290 tCO2
Table 2: Company Alpha: GHG emissions on the basis of control/influence and equity share
Table 3: Company Beta: GHG emissions on the basis of control/influence and equity share

20
After a company has determined its organizational boundaries in
terms of the entities/facilities that it owns or controls, it must then
define its operational boundaries.
For effective and innovative GHG management, setting operational
boundaries that are comprehensive with respect to direct and indirect
emissions will help a company better manage the full spectrum of
GHG risks and opportunities that exist in its upstream and
downstream operations.
This involves making choices about how to account for direct and
indirect GHG emissions1.
Settingoperational boundaries
Chapter 4
Direct GHG emissions are emissions from sources that are
owned or controlled by the reporting company, e.g. emissions
from factory stacks, manufacturing processes and vents, and
from company-owned/controlled vehicles.
Indirect GHG emissions are emissions that are a consequence
of the activities of the reporting company, but occur from
sources owned or controlled by another company, e.g.
emissions from the production of purchased electricity, contract
manufacturing, employee travel on scheduled flights, and
emissions occurring during the product use phase.
Introducing the concept of ‘scope’ To help delineate direct and indirect emissions sources, improve
transparency, and provide utility for different types of
organizations with different needs and purposes, three ‘scopes’are defined for GHG accounting and reporting purposes.
The GHG Protocol recommends that companies account for and
report scopes 1 and 2 at a minimum.
Scope 1: Direct GHG emissionsScope 1 accounts for direct GHG emissions from sources that are
owned or controlled by the reporting company. Scope 1
emissions are principally the result of the following activities:
• production of electricity, heat, or steam
• physical or chemical processing2, e.g. cement, adipic acid
and ammonia manufacture
• transportation of materials, products, waste, and
employees, e.g. use of mobile combustion sources, such as:
trucks, trains, ships, airplanes, buses, and cars
• fugitive emissions: intentional or unintentional releases such
as: equipment leaks from joints, seals; methane emissions
from coal mines; HFC emissions during the use of air
conditioning equipment; and CH4 leakages from gas
transport
Scope 2: GHG emissions from imports of electricity,heat, or steamScope 2 accounts for indirect emissions associated with the
generation of imported/purchased electricity, heat, or steam.
Emissions attributable to the generation of exported/sold
electricity, heat, or steam should be reported separately under
supporting information. These emissions must also be included
in scope 1. To increase data transparency, emissions data
associated with imported and exported electricity, heat, or steam
should not be netted.
The emissions associated with the generation of imported
electricity, heat, or steam are a special case of indirect emissions.
For many companies, electricity usage represents one of the
most significant opportunities to reduce GHG emissions.
Companies can reduce their use of electricity and/or use it more
efficiently by investing in energy efficient technologies.
Additionally, emerging green power markets3 enable some
companies to switch to less GHG intensive electricity suppliers.
Companies can also install an efficient co-generation plant on
site to replace the import of more GHG intensive electricity from
the grid. Scope 2 facilitates the transparent accounting of such
choices.
Scope 3: Other indirect GHG emissions Scope 3 allows for the treatment of other indirect emissions that
are a consequence of the activities of the reporting company,
but occur from sources owned or controlled by another
company, such as:
• employee business travel
• transportation of products, materials, and waste
• outsourced activities, contract manufacturing, and franchises
• emissions from waste generated by the reporting company
when the point of GHG emissions occurs at sources or sites
that are owned or controlled by another company, e.g.
methane emissions from landfilled waste
• emissions from the use and end-of-life phases of products
and services produced by the reporting company
• employees commuting to and from work
• production of imported materials
Double countingConcern is often expressed that such accounting treatment of
indirect emissions will lead to double counting when two
different entities include the same emissions in their respective
inventories. Whether or not double counting occurs depends on
how consistently direct and indirect emissions are reported.
Whether or not double counting matters, depends on how the
reported information is used.
Double counting needs to be avoided when compiling national
inventories under the Kyoto Protocol, but these are usually
compiled via a top-down exercise using national economic data,
rather than aggregation of bottom-up company data.
Compliance regimes are more likely to focus on the ‘point of
release’ of emissions and are more concerned about a
company’s direct emissions. For participating in GHG markets, it
would not be acceptable for two organizations to claim
ownership of the same piece of commodity and it is therefore
necessary to make sufficient provisions to ensure that this does
not occur between participating entities. For GHG risk
management and voluntary reporting double counting is less
important.
21
Setting operational boundaries

Companies should, at a minimum, account and report GHG
emissions from scopes 1 and 2. To ensure maximum flexibility
and clarity, companies are also encouraged to account and
report relevant scope 3 emissions. Together these three scopes
represent significant opportunities for reducing emissions.
Figure 2 provides an overview of activities that generate GHG
emissions along a company’s value chain. Appendix 2 lists
GHG emissions sources and activities by scopes and sectors.
All scopes:
• Account and report GHG information separately for each
scope.
• To facilitate comparability over time, further subdivide
emissions data where this aids transparency, e.g. by
business units/facilities, country, source types (production
of electricity or steam, transportation, processes, etc.).
Scope 1:
• All companies report scope 1.
Scope 2:
• All companies report scope 2.
• Emissions from imported electricity can be estimated from
purchase records and grid emissions factors. You should use
the most reliable emissions factors available and be
consistent in their use.
• Purchases of electricity by electric utilities for sale to end-use
customers (e.g. an electricity utility that has a supply
contract with a power generator) should be reported under
scope 2. The rationale for this is that utilities often exercise
choice over where they buy their energy and this may
present significant opportunities for GHG reductions.
• Trading transactions of electricity should not be reported.
• If you export electricity, heat, or steam to the grid or to
another company, the emissions associated with the exports
should not be deducted from scope 1.
• Emissions from exported electricity, heat, or steam should
be reported under supporting information and not
deducted from any imports, as this would be inconsistent
with how other exported products are accounted, e.g.
22
Guidance on setting operational boundaries
Guidance on setting operational boundaries
Figure 2: An overview of GHG emissions along the value chain

export of clinker by a cement company or scrap steel by an
iron and steel company.
• Three examples are provided below to illustrate GHG
accounting from energy generation.
• GHG emissions from activities upstream of your electricity
provider, e.g. exploration, drilling, flaring, transportation,
and refining should not be reported under scope 2.
Scope 3:
• Scope 3 provides an opportunity to be innovative with
GHG management. Emissions reported under scope 3
should be adequately explained and supported by data and
evidence.
• It will not be relevant or appropriate for companies to report
on all of the activities listed under scope 3. Companies should
report those activities that are relevant to their business and
goals, and for which they have reliable information.
Scopes and business goalsCompanies frequently cite four goals as compelling reasons
for compiling a GHG inventory:
• GHG risk management
• public reporting/participation in voluntary initiatives
• GHG markets
• regulatory/government reporting
Since most companies have multiple goals, it makes sense to
design an inventory from the outset to provide information
that will serve all of these. This will require consideration of
how data might subsequently be ‘sliced and diced’, e.g. by
state, country, facility, business unit, and company.
GHG risk managementFrom the perspective of GHG management it makes sense to
define broad operational boundaries that explore GHG
emissions risks and opportunities in all three scopes. This will
be important for understanding the competitive environment
and for developing a long-term business strategy in a GHG
constrained world. For GHG risk management, accuracy is less
important, since the goal is to capture a broad overview of a
company’s GHG impact.
Narrower focus on direct emissions may miss major GHG
reduction opportunities and risks. For example, appliances
such as washing machines, refrigerators, and automobiles
produce most GHG emissions during their use phase.
Whirlpool has estimated that its clothes dryer uses 20 times
more energy over its working life than the energy used in
manufacturing the dryer, and its washing machines 50 times
more (Loreti et al., 2000). Similarly, General Motors (GM) has
estimated that all GM vehicles in operation in the United
States account for 23 percent of US transportation-related
emissions (EIA, 1997). Estimates of GHG emissions from
indirect sources both upstream and downstream of your
operations will improve your understanding of GHG impacts
and help identify opportunities to collaborate with others in
your value chain to reduce GHG emissions and to share the
benefits.
Public reporting/participation in voluntary initiativesSome companies, particularly in the electric utility and
chemical-manufacturing sector, produce GHG inventories in
conjunction with voluntary partnerships with government.
Many countries have developed national GHG reporting
schemes targeted at business, for example, Canada’sVoluntary Challenge Register, Australia’s Greenhouse
Challenge Program, and the US Department of Energy’sVoluntary 1605b Reporting Program. The specific GHG
reporting requirements relating to direct and indirect GHG
23
Guidance on setting operational boundaries
Reporting GHGs from energy generation
Example one: Company A is an electric utility that owns
two power generation plants and has a supply contract
with a third power generation plant owned by company B.
Company A reports the GHG emissions from the two
power plants it owns under scope 1 and the emissions from
the electricity supplied to it by B under scope 2. Company
B reports all the emissions from its power plant under
scope 1.
Example two: Company C installs a co-generation unit,
reduces its import of electricity from the grid, and sells
surplus electricity to a neighboring company D. Company
C reports all emissions from the co-generation unit under
scope 1 and increases its direct emissions. Company C also
reports a reduction in scope 2 emissions. Emissions from
the generation of electricity exported to D are reported by
C under supporting information, and by D as scope 2
emissions.
Example three: Company E uses electricity supplied by a
co-generation unit that is owned by an energy supplier.
Company E reports the GHG emissions associated with its
electricity use under scope 2, even if it consumes 100
percent of the power and steam produced. The energy
supplier reports all the emissions as direct under scope 1.
In countries where GHG emissions are regulated it is
possible that related financial impacts associated with
GHG emissions are negotiated in the contract between
the two parties. This would deal with any extra costs for
the energy supplier.

emissions vary between the different initiatives. Some
schemes, such as the US Department of Energy 1605b
Program, leave the choice of what to include entirely up to
the reporting entity, while others are more specific. In the US,
several state governments, such as California and New
Hampshire, are also developing GHG registries. Partners in the
US EPA’s voluntary industry-government partnership, Climate
Leaders, must compile their GHG inventory to include scope 1
and scope 2 emissions and set a public GHG emissions
reduction goal.
Appendix 1 provides an overview of the various GHG
accounting and reporting requirements of several voluntary
GHG reporting and reduction initiatives. A GHG accounting
and reporting system developed according to the GHGProtocol should enable you to meet nearly all the accounting
and reporting requirements of these initiatives.
GHG markets and regulatory/government reportingCompanies intending to participate in GHG trading systems
will need to produce a rigorous and verifiable scope 1
inventory. Where compliance is judged against a datum and
emissions cap, as is the case for the US Sulfur Dioxide Trading
Program, it is also necessary to produce a robust baseline.
Although regulatory and market-based programs typically
focus on direct emissions sources, there are exceptions. The
UK Emissions Trading Scheme for example, requires direct
entry participants to account for GHG emissions from the
generation of imported electricity, heat, and steam (DEFRA,
2001).
Regulatory programs often focus on scope 1 emissions from
operated or controlled facilities. In Europe, facilities falling
under the requirements of the Integrated Pollution and
Prevention and Control Directive (IPPC) must report emissions
exceeding a specified threshold for each of the six Kyoto
gases4. From 2003, information on emissions reported under
IPPC for the reporting year 2001 and onwards will be
included in a European Pollutant Emission Register (EPER) –a publicly accessible internet-based database that permits
comparison of emissions of individual facilities or industrial
sectors in different countries (EC–DGE, 2000).
24
Guidance on setting operational boundaries
Shell Canada: One standard, multiple uses
An important goal of many companies is to build a GHG
inventory that serves many uses. One of these is to establish
a foundation which anticipates compliance with future
national GHG accounting schemes and regulations. Shell
Canada’s participation in the GHG Protocol road test was
driven, in part, by the desire to compare the ideas of the
GHG Protocol with current reporting needs of the Canadian
Climate Change Voluntary Challenge and Registry (VCR).
Shell Canada undertook a gap analysis to identify
components that could be added to the VCR to meet the
intentions of the GHG Protocol, and also to see how the
GHG Protocol might be enhanced.
The GHG Protocol’s three-scope accounting approach for
direct and indirect emissions was different to how Shell
Canada had traditionally reported GHGs under the VCR
scheme. The GHG Protocol’s scope terminology was found
to be very useful for distinguishing between emissions Shell
has direct control over and those it indirectly influences.
Shell Canada believes the utility of the scope approach will
increase as the GHG Protocol becomes further defined and
is utilized internationally. The formalization of the GHGProtocol’s three-scope approach in broad international
application could significantly improve the clarity of GHG
reporting, while not discounting the incentive to become
more energy efficient in the use of imported electricity.
Overall, Shell felt it was largely in agreement with the GHGProtocol and with slight modifications could meet the
requirements of that accounting system. No substantial
barriers were found in VCR that would prevent Shell’s GHG
inventory from achieving compliance with both reporting
systems. With select additions, Shell can offer a future
report that achieves both VCR Champion Reporting status
domestically and GHG Protocol compatibility. This is an
important discovery for Shell Canada because it
demonstrates the validity of its existing reporting methods
and provides a blueprint for its continuous improvement
toward a future international standard.

25
Guidance on setting operational boundaries
Norsk Hydro: Learning by doing
In 1990, Norsk Hydro recognized that it did not have a
good overview of the GHG emissions from its operations
and decided to conduct a first GHG inventory. In addition
to CO2 and CH4 the company also looked at N2O from
fertilizer production and fluorinated species such as CF
gases and SF6. Norsk Hydro has since developed a web-
based system for registering GHGs, other emissions, and
energy data to keep track of environmental performance.
Based on the inventory work, the company established
good contacts with the scientific community and
regulatory authorities. The inventory also provided an
excellent basis for identifying emissions reduction potentials
through a variety of measures, in particular through
improved operational performance and the introduction of
new technology. Gradually, Norsk Hydro reduced emissions
of CF gases from aluminum electrolysis, and decreased the
use of SF6 in magnesium casting. A major lesson from the
‘learning by doing‘ approach with GHG inventories was
realizing the importance of consistent boundary definitions.
This produces quantitative, high quality data, which
provides a basis for cost-effective abatement measures.
As a consequence of the company’s environmental
principles – a life cycle view of activities, and a focus on
abatement actions, which prove to be cost-effective in a life
cycle context – Norsk Hydro extended its analysis to a
company-wide life cycle inventory of GHGs in 1996. The
study revealed that from a life cycle perspective, about 80
percent of GHG emissions were related to use of the
company’s products, mainly CO2 from the use of oil and
gas, as well as N2O from the use of fertilizers.
Swiss Re: The bottom line on business travel
When Swiss Re began recording environmental
performance indicators, the company gave high priority to
energy consumption and business travel since they
traditionally constitute the highest GHG impacts of an
insurance company.
While acquiring data from energy suppliers proved
relatively easy, accessing correlated business travel data
from reservation agents proved more challenging. Swiss
Re’s Business Travel Centre in Zurich began sorting some
800 of almost 5000 travel cards and extrapolating the
result for the total number of flights in 1996. Based on this
spot-check system, the business travel indicator was
projected each year in the same manner until 1999. In
2000, Swiss Re launched a Lotus Notes-based ‘travel
booking system’ for business trips. At first sight, the system
permitted a consistent indicator for the first time, but it
proved impossible to correlate the number of destinations
with the accumulated number of miles flown.
During 2000, Swiss Re decided to make all flight bookings
through American Express (AMEXCO), and was able to
utilize their Flight Power tool for detailed monitoring of all
business travel activities. Not only is it now possible to
record the number of destinations and cost per unit, but
the miles flown can also be calculated for further
evaluation. This solution immediately enhanced both data
quality and quantity. American Express provides monthly
data to update the miles per unit indicator on a quarterly
basis. This parameter is used for internal monitoring and to
promote cost consciousness of each cost center.
1 The terms ‘direct’ and ‘indirect‘ as used in this document should not be confusedwith their use in national GHG inventories where ‘direct‘ refers to the six Kyoto gasesand ‘indirect‘ refers to the precursors NOx, NMVOC, and CO.
2 For some integrated manufacturing processes, such as ammonia manufacture, it maynot be possible to distinguish between GHG emissions from the process and theproduction of electricity, heat, or steam.
3 Green power includes renewable energy sources and specific clean energytechnologies that reduce GHG emissions relative to other sources of energy thatsupply the electric grid, e.g. solar photovoltaic panels, geothermal energy, landfill gas,and wind turbines.
4 EPER sets the following facility-based reporting thresholds for Kyoto GHGs (kg/yr):CO2 – 100,000,000; CH4 – 100,000; N2O- 10,000; HFCs – 100; PFCs – 100; SF6 – 50. Reported emissions data must be accompanied by a one-letter codereferring to the methodology of emissions determination (M - measurement, C - calculated, E - non standardized estimate). Source categories should becompatible with NOSE-P categories.
NOTES

26
The GHG Protocol focuses on accounting and reporting for GHG
emissions at the corporate level. The reporting standard provides
guidance on how to prepare a summary of GHG information for a
company’s global operations. GHG reductions can then be measured
by comparing absolute changes in the company’s overall GHG
emissions over time, or by developing ratio indicators to track relative
performance.
A company’s overall emissions may be reduced, even if increases
occur at specific sources, facilities, or operations within a given
country. Focusing on the overall company GHG impact has the
advantage of helping companies more effectively manage their
aggregate GHG risks and opportunities. It also helps guide the
transfer of resources to activities resulting in the most cost-effective
GHG reductions.
Accountingfor GHG reductions
Chapter 5

GHG reductions at the scale of a facility or countryFrom the perspective of the climate it does not matter where
GHG emissions reductions occur. From the perspective of
national and international policies on global warming, the
place where reductions are achieved is relevant since these
policies focus on achieving GHG reductions within specific
countries or regions. Thus companies with global operations
will have to respond to an array of national regulations and
requirements that address GHGs from operations or facilities
within a specific country.
The GHG Protocol calculates GHG emissions using a bottom-
up approach. This involves calculating emissions at the level of
an individual source and then rolling this up via facilities to
the corporate level. This approach enables companies to slice
and dice GHG emissions information at different scales, e.g.
by individual sources or facilities, or by a collection of facilities
within a given country. This allows a company to meet an
array of government requirements or voluntary commitments.
Reductions can then also be measured by comparing
emissions over time for the chosen scale.
Project-based reductions, offsets, creditsInternational negotiators and domestic policymakers are
developing market-based regulatory instruments. It is widely
anticipated that corporations, amongst others, will actively
trade emissions allowances or emissions reduction credits
through these mechanisms.
For example, the Kyoto Protocol sets emissions targets for
participating industrialized nations and establishes three market-
based mechanisms to promote cost-effective reductions. These
are: international emissions trading, joint implementation (JI),
and the clean development mechanism (CDM).
Under each mechanism, a party facing high costs in reducing
its own emissions can purchase certified emissions reduction
credits for lower cost reductions undertaken by another party.
These credits will be generated by financing projects that
result in verifiable emissions reductions (e.g. district heating
upgrades) or in removing GHGs from the atmosphere (e.g.
enhancing carbon sinks via reforestation activities). It is
envisioned that both government and corporate entities will
use these credits to fulfill obligations under domestic law. At
both national and international levels, the rules governing the
eligibility of reduction projects and the trade of emissions
rights are still under discussion.
A few leading companies are already seeking to turn emissions
reductions into competitive advantage and are participating in
a variety of ‘pre-compliance’ or voluntary transactions.
Experience from this ‘pre-compliance‘ market in GHG
reduction credits highlights the importance of delineating
reductions with a robust, valid and quantifiable accounting
system that provides credible and verifiable data. Key
accounting challenges for project-based credits are
establishing ownership of the reduction credits, baseline
construction and additionality, and leakage.
Under the Kyoto Protocol, JI and CDM activities must result in
GHG reductions that are additional to any that would
otherwise occur in the absence of the certified project activity.
The baseline provides a reference point for what emissions
would have been without the project intervention. Leakage
relates to increases or decreases of GHG emissions elsewhere
as a result of a project.
The GHG Protocol does not address all the accounting
challenges associated with project-based reductions, but it can
help companies identify and account for those reductions that
occur within their organizational and operational boundaries.
The GHG Protocol is initiating a task force to explore and
develop guidance on accounting for project-based reductions
in a manner that is robust and consistent with the potential
financial value and integrity of any commodity that may be
attached to reductions.
Reporting project-based reductions, offsets, creditsThe sale, transfer, or banking of emissions reductions credits
achieved from reduction activities within a company’s selected
operational boundaries (scopes 1, 2 or 3) should be clearly
indicated in its public GHG report under the section on
supporting information.
The purchase of emissions reduction credits from another
organization may also be reported in the public GHG report.
Appropriate supporting information addressing the validity
and credibility of purchased emissions reduction units should
be included.
When companies make changes to their operations that result
in GHG reductions, these will usually be captured in one of
the three GHG Protocol scopes. However, some companies
may be able to make changes to their own operations that
result in GHG reductions not captured by any of their three
scopes, for example:
• Substituting fossil fuel with imported waste-derived fuel that
might otherwise be landfill or incinerated without energy
recovery. Such substitution may have no direct effect on (or
may even increase) the importing company’s own GHG
27
Accounting for GHG reductions

emissions. However, it could result in real GHG savings
elsewhere, e.g. avoiding landfill GHG emissions and fossil
fuel use.
• The installation of an on-site co-generation plant that
provides electricity for the company and other
organizations. This may increase the company’s direct
emissions, but decrease the GHG emissions of the
organizations using the exported electricity, by displacing
more GHG intensive electricity sources.
These reductions may be accounted for in the same way as
the purchased project-based reductions described above and
reported in a company’s public GHG report.
28
Accounting for GHG reductions
Kansai Electric Power Company: Accountingfor GHGs from electricity consumption
In Japan the responsibility for CO2 emissions from electricity
consumption is assigned to end-users. Emissions are
calculated by multiplying a CO2 emissions factor by the
amount of electricity consumed. The CO2 emissions factor
is derived by dividing the total amount of CO2 emitted by
an electricity supplier by the corresponding amount of
electricity generated from all the supplier’s sources, e.g.
nuclear, fossil-fueled, and hydroelectric power (the mean
emissions factor). Although it is not possible to identify a
particular power generation source with a given reduction
of electricity in Japan, some organizations have assumed
that any reductions they make in electricity leads to a
reduction in fossil-fueled power generation. Kansai Electric
Power Company points out that this assumption over-
estimates GHG reductions from reduced electricity use and
is not credible for the following reasons:
• in practice, hydroelectric power is used for the short-
term load balancing needed to control frequency,
whereas nuclear power is used to balance seasonal load
by planning periodic inspections outside of demand
peaks
• since the CO2 emissions factor for fossil-fueled power is
greater than the average emissions factor for all power
sources, this approach overestimates actual GHG
reductions
In the absence of a credible and verifiable alternative, the
mean CO2 emissions factor should thus be used for
calculating the CO2 reductions from lower electricity
consumption.


30
“What sort of comparisons do I need to make over time?”
Emissions performance comparisons can be done against the last
accounting period as well as against emissions in a selected reference
year.
Comparison only against the last accounting period is unlikely to
cater for strategic business goals such as establishment of emissions
reduction targets and management of risks and opportunities, or
address the needs of investors and other stakeholders.
Setting a historic performance datum
Chapter 6

The GHG Protocol recommends setting a historic performance
datum for comparing emissions over time. This performance
datum is the base year emissions. Base year emissions can
be differentiated from the term baseline, used in the context
of project-based accounting under the Kyoto Protocol. The
base year emissions concept aims at a broader footprint
intended to allow comparison of emissions performance over
time. This datum recognizes that the methods and tools to
account and report GHG emissions will improve over time,
and that many industries will undergo major changes and
consolidation. In contrast, a baseline usually refers to an
emissions scenario that would occur in the absensce of the
GHG reduction project.
If you intend to participate in a voluntary GHG reductions
scheme or a GHG emissions trading scheme, it is important to
first check with the scheme to determine whether it has any
specific rules governing the establishment of base year
emissions or baselines. The UK Emissions Trading Scheme, for
example, specifies that the baseline will be the average
emissions in the three years up to and including 2000 for
direct entry participants (DEFRA, 2001).
Choosing a base yearCompanies should choose a base year for which verifiable
data is available. Companies should specify their reasons for
choosing that particular year.
Base year emissions adjustmentsCompanies should develop a base year emissions adjustment
policy, and clearly articulate the basis for making any
adjustments. The policy should state any ‘significant
threshold’1 applied for considering base year emissions
adjustment.
The following rules should be observed for base year
emissions adjustments:
• The base year emissions should be adjusted to maintain
comparability if significant structural changes occur in the
organization. What defines a significant structural change
usually depends on the size of the organization. Examples
include mergers, major acquisitions, and divestitures.
• The base year emissions should be adjusted to account for
the transfer of ownership/control of emissions sources.
• The base year emissions should not be adjusted for
organic growth or decline of the organization. Organic
growth/decline refers to increase/decrease in production
output, changes in product mix, plant closures and the
opening of new plants. The rationale for this is that
organic growth results in new or additional emissions to
the atmosphere, whereas an acquisition only transfers
existing GHG emissions from one company’s balance
sheet to another.
• The base year emissions should not be adjusted for any
changes in outsourcing activities if the company is
reporting its indirect emissions from such activities under
scopes 2 or 3. The same rule applies to insourcing.
• If significant structural changes occur during the middle of
a year, the base year emissions should be adjusted on a
pro-rata basis.
• The base year emissions should be adjusted for changes in
calculation methodologies that result in significant
changes in your calculated GHG emissions data. Discovery
of errors, or a number of cumulative errors, that
significantly affects base year emissions should result in an
adjustment of base year emissions.
In summary, once a company has determined how it will
adjust its base year emissions, it should apply this policy in a
consistent manner. For example, it should adjust for both
GHG emissions increases and decreases. The base year
emissions should be retrospectively adjusted to allow for
specific changes in the company that would otherwise
invalidate the use of its base year emissions as a performance
datum, or would compromise the consistency and relevance
of the reported GHG information.
31
Setting a historic performance datum

The establishment of a base year and adjustment of base year
emissions should be related to business goals:
• to achieve certified emissions reduction targets, there may
be external rules which influence the choice and
adjustment of the base year emissions
• for internal management goals, the company may follow
the rules and guidelines recommended in this document,
or it may develop its own approach which should be
followed consistently
• to report progress toward publicly set GHG reduction
goals, the company should follow the rules and guidelines
recommended in this document
Choosing a base yearObtaining reliable data for historical base years such as 1990
is a challenging task. For some GHG sources a consistent and
verifiable data set may not be available. If this is the case,
particularly for key source categories, it may make sense to
choose a more recent base year. Some organizations are
adopting 1990 as a base year in order to be consistent with
the Kyoto Protocol. The Kyoto Protocol set 1990 as a base
year for industrialized countries to reduce their emissions in
the first commitment period of 2008-2012.
Base year adjustment for structural changesBase year emissions should be adjusted for structural changes
when there is significant impact on the reporting consistency
of the organization’s total emissions. This may include
accounting for the cumulative effect of a number of small
acquisitions or divestitures. While adding some complexity,
this approach aligns with financial accounting practices, and
provides a meaningful basis for measuring performance over
time. Examples one and two offer illustrations of possible
structural changes and the application of the GHG Protocolstandard on base year emissions adjustment.
32
Guidance on setting a historic performance datum
Guidance on setting a historicperformance datum
Example one: Base year emissionsadjustment for an acquisition – Figure 3
Company Gamma consists of two business units (A and B).
In its base year (year one) the company emits 50 tonnes
CO2. In year two, the company undergoes organic growth,
leading to an increase in emissions to 30 tonnes CO2 per
business unit, i.e. 60 tonnes CO2 in total. The base year
emissions are not adjusted in this case. In the beginning of
year three, Gamma acquires a production facility C from
another company. The annual emissions of facility C in year
one were 15 tonnes CO2, and 20 tonnes CO2 in year two.
The total emissions of company Gamma in year three,
including facility C are therefore 80 tonnes CO2. To
maintain consistency over time, the company recalibrates
its base year emissions to take into account the acquisition
of facility C. The base year emissions increase by 15 tonnes
CO2 – the quantity of emissions produced by facility C in
Gamma’s base year. The adjusted base year emissions are
65 tonnes CO2.
20
40
60
80
100
0year one
(base year)year two
(increase inproduction)
year three(acquisition of
facility C)
A25
B25
A30
B30
A30
B30
C15
C20
Adjusted base yearemissions:65 tonnes CO2
50
60
80
Emis
sion
s (t
onne
s C
O2)
Figure 3
No adjustment for organic growth or declineOrganic growth or decline is not considered a condition for base
year emissions adjustment. Opening a new facility is considered a
case of organic growth because it represents new sources of GHG
emissions that did not exist prior to the setting of a base year.
Similarly, the acquisition of companies or parts of companies that
came into existence after the company’s base year was set are
regarded as organic growth because these changes represent new
GHG emissions that occurred after the base year was set. In the
following cases, there should be no adjustment to the base year:
• an operating unit that was set up after the base year was
established is shut down
• a new operating unit is started
• an acquisition of a company or part/s of a company that
came into existence after the base year of the acquiring
company was set (see Example three)
• ‘outsourcing’ of operations that came into existence after the
base year was set
• ‘insourcing’ of operations that came into existence after the
base year was set
No adjustment for ‘outsourcing’ reported underscope 2 and/or scope 3Structural change due to ‘outsourcing/contract
manufacturing’ is not considered a condition for base year
emissions adjustment if the company is reporting its indirect
emissions from relevant ‘outsourcing’ activities under scope 2
(outsourcing of energy for use) or under scope 3
(outsourcing/contract manufacturing). The same rule applies
to ‘in-sourcing’. An example of ‘in-sourcing’ is when a
company starts its own generation of electricity and thus
reduces its use of imported electricity.
33
Guidance on setting a historic performance datum
Example two: Base year emissionsadjustment for a divestment – Figure 4
Company Beta consists of three business units (A, B, and C).
Each business unit emits 25 tonnes CO2 and the total
emissions for the company are 75 tonnes CO2 in the base
year (year one). In year two, the output of the company
grows, leading to an increase in emissions to 30 tonnes CO2
per business unit, i.e. 90 tonnes CO2 in total. In year three,
Beta divests business unit C, and its annual emissions are now
60 units, representing an apparent reduction of 15 units
relative to the base year emissions. However, to maintain
consistency over time, the company recalibrates its base year
emissions to take into account the divestment of business unit
C. The base year emissions are lowered by 25 tonnes CO2 –the quantity of emissions produced by the business unit C in
the base year. The adjusted base year emissions are 50 tonnes
CO2, and the emissions of company Beta are seen to have
risen by 10 tonnes CO2 over the three years.
20
40
60
80
100
0year one
(base year)year two
(increase inproduction)
year three(divestment of
facility C)
A25
B25
A30
B30
A30
B30
Adjusted base yearemissions:50 tonnes CO2
C25
C30
75
90
60
Emis
sion
s (t
onne
s C
O2)
Example three: Acquisition of a facility thatcame into existence after the base year wasset – Figure 5
Company Teta consists of two business units (A and B). In
its base year (year one) the company emits 50 tonnes CO2.
In year two, the company undergoes organic growth,
leading to an increase in emissions to 30 tonnes CO2 per
business unit, i.e. 60 tonnes CO2 in total. The base year
emissions are not adjusted in this case. In the beginning of
year three, Teta acquires a production facility C from
another company. Facility C came into existence in year
two, its emissions being 15 tonnes CO2 in year two and 20
tonnes CO2 in year three. The total emissions of company
Teta in year three, including facility C are therefore 80
tonnes CO2. In this acquisition case, the base year
emissions of company Teta do not change because the
acquired facility C did not exist in year one when the base
year of Teta was set. The base year emissions datum of Teta
therefore remains at 50 tonnes CO2.
20
40
60
80
100
0year one
(base year)year two
(increase inproduction)
year three(acquisition of
facility C)
A25
B25
A30
B30
A30
B30
C15
C20
50
60
80
Emis
sion
s (t
onne
s C
O2)
No adjustment:base year emissions50 tonnes CO2
1 ‘Significant threshold’ is a qualitative or quantitative criteria used to define asignificant structural change. It is the responsibility of the company/verifier todetermine the ‘significant threshold’ for considering base year emissions adjustment.In most cases the ‘significant threshold’ depends on the use of the information, thecharacteristics of the company, and the features of structural changes.
NOTES
Figure 4Figure 5

34
Once the organizational and operational boundaries have been
established, companies generally calculate GHG emissions via the
following steps:
• identify GHG emissions sources
• select an emissions calculation approach
• collect activity data and choose emissions factors
• apply calculation tools to estimate GHG emissions
• roll-up GHG data to corporate level
These steps are described in the following sections. A short
description of the calculation tools developed by the GHG Protocol is
also provided. The calculation tools are available on the GHG Protocol
website at www.ghgprotocol.org
Identifyingand calculating GHG emissions
Chapter 7
Identify GHG emissions sources To facilitate the selection of applicable calculation tools,
emissions of GHGs are categorized here in terms of key
sources. Appendix 2 relates emissions sources with the
activities identified in Chapter 4: Setting operational
boundaries.
Emissions of GHGs typically occur from the following source
categories:
• stationary combustion: combustion of fuels in stationary
equipment such as boilers, furnaces, burners, turbines,
heaters, incinerators, engines and flares
• mobile combustion: combustion of fuels in transportation
devices such as automobiles, trucks, trains, aeroplanes,
and ships
• process emissions: emissions from physical or chemical
processes, e.g. CO2 from the calcination step in cement
manufacturing, CO2 from catalytic cracking in a
petrochemical processing, PFC emissions from aluminum
smelting, etc.
• fugitive emissions: intentional and unintentional releases
such as equipment leaks from joints, seals, packing and
gaskets, etc. This may also include fugitive emissions from
coal piles, wastewater treatment, pits, cooling towers,
fugitive CH4 emissions from gas processing facilities
Every business has some processes, products or services that
generate direct and/or indirect emissions from one or more of
the above source categories. Appendix 2 provides an overview
of direct and indirect GHG emissions sources organized by
scopes and industry sectors. It may be used as an initial guide
to identify your major GHG sources.
Identifying scope 1 emissions
As a first step in identifying GHG sources, a company should
undertake an exercise to track down its direct emissions
sources in each of the four broad categories described above
– stationary combustion, mobile combustion, process, and
fugitive. The power industry has direct emissions from all the
main source categories, except process emission sources.
Process emissions are specific to certain industry sectors like oil
and gas, aluminum, cement, etc. Manufacturing companies
that generate process emissions and also own or control a
power production facility, will have direct emissions from all
the main source categories. Office based organizations may
not have any direct GHG emissions except in cases where
they own or operate a combustion device or refrigeration and
air-conditioning equipment. Often companies are surprised to
realize that a significant amount of emissions come from
sources which are not initially obvious (see UTC box).
Identifying scope 2 emissions
The next step is to identify indirect emissions sources from the
use of purchased electricity, heat, or steam. Almost all
businesses generate indirect emissions due to the use of
imported electricity for their processes or products/services.
Identifying scope 3 emissions
This step is needed if a company also plans to report its scope
3 emissions. It involves identification of other indirect
emissions from the reporting company’s upstream and
downstream activities. All companies use raw materials or
goods that have generated emissions during their mining or
processing phases. Indirect emissions due to transportation
are also common to all businesses. These include
transportation in vehicles owned or controlled by another
organization, e.g. transport of raw materials/goods and
products, employees commuting to and from work, and
business-related travel by employees. Product use is an
important category of indirect emissions for companies
manufacturing automobiles, appliances, and fuels.
A comprehensive identification of indirect emissions sources
also includes accounting for GHGs associated with
‘outsourcing/contract manufacturing’ or franchises, e.g.
drilling operations, building construction, facilities
management, printing, waste management, retail outlets, etc.
By looking at scope 3 emissions, businesses are encouraged to
expand their inventory boundary across their value chain and
35
Identifying and calculating GHG emissions
United Technologies Corporation (UTC):More than meets the eye
Back in 1996, the team responsible for setting boundary
conditions for UTC’s new Natural Resource Conservation,
Energy and Water Use Reporting Program, met to decide
what sources of energy were going to be included in the
program’s annual report of energy consumption. The team
decided to include jet fuel in the annual report; jet fuel was
used by a number of UTC divisions for engine and flight
hardware testing and for test firing. Although the amount
of jet fuel used in any given year was subject to wide
variability due to changing test schedules, the total amount
consumed in an average year was not expected to be large.
Jet fuel consumption reports, however, proved that UTC’sinitial belief was wrong. Jet fuel had accounted for between
nine and 13 percent of the corporation’s total annual use of
energy since the program commenced. Had UTC not
included the use of jet fuel in annual data collection efforts,
a significant energy source would have been overlooked.

to identify all relevant GHG emissions. Figure 2 in Chapter 4:
Setting operational boundaries (guidance), provides an
overview of activities that generate GHG emissions along a
company’s value chain.
Identification of emissions sources does not imply that a
business will be able to calculate emissions for all indirect
emissions sources. In some cases it may be difficult to obtain
good quality data from contractors/suppliers. Nevertheless,
identification of GHG sources along the value chain provides a
broad overview of various linkages and possible opportunities
for GHG reductions.
Select an emissions calculation approachDirect measurement of GHG emissions by monitoring exhaust
gas concentration and flow rate is rare. In most instances
accurate estimates can be obtained by using appropriate
calculation methods employing derived emissions factors.
Table 5 in Chapter 8: Managing inventory quality, provides a
comparison of various calculation methods. The IPCC
guidelines (IPCC, 1996b) refer to several calculation
approaches or techniques ranging from the application of
derived emissions factors, through to direct monitoring. One
important exception to this hierarchy is the calculation of CO2
emissions from fuel use data. In many instances, even small
users know both the amount of fuel consumed, and the
carbon content of the fuel. CO2 emissions can then be
calculated with an accuracy of two to three percent. This is far
better than the accuracy achieved by direct monitoring of
CO2 emissions.
Apart from some process emissions, which can be calculated
based on a mass balance, the most common approach for
calculating GHG emissions is through application of emissions
factors. Emissions factors are documented information relating
GHG emissions to some characteristic of the emissions
sources. The emissions are calculated by multiplying the
emissions factor by an appropriate activity factor (fuel
consumed, quantity of output produced, etc.). Activity factors
relating to transportation include: total fuel consumed, vehicle
miles traveled, passenger miles traveled, or volume of goods
transported. Usually activity data based on fuel use will
provide the most accurate estimate of GHG emissions for
transportation sources.
Collect activity data and choose emissions factorsFor most small to medium-sized companies and for many
larger companies, scope 1 emissions will be calculated based
on the purchased quantities of commercial fuels (such as
natural gas and heating oil) using published emissions factors.
Scope 2 emissions will be calculated from metered electricity
consumption using published emissions factors. Scope 3
emissions will be calculated from activity factors such as
passenger miles and published or third-party emissions
factors. In all these cases, if source/facility specific emissions
factors are available, it is preferable that they be used. User-
friendly calculation tools are available on the GHG Protocolwebsite to assist in these calculations.
Companies involved in fuels extraction and processing,
chemicals, minerals, waste management, and primary metals
will be faced with a wider range of alternative
approaches/methodologies. They should seek guidance from
the sector specific guidelines on the GHG Protocol website
(where available) or from their industry associations, e.g.
International Aluminium Institute, American Petroleum
Institute, WBCSD project: Toward a Sustainable Cement
Industry, etc.
Apply calculation tools to estimate GHG emissionsThis section provides an overview of the GHG calculation tools
available on the GHG Protocol website
(www.ghgprotocol.org). Use of these tools is encouraged as
they have been peer reviewed by experts and industry leaders
and are believed to be the best available. The tools, however,
are optional. Companies may use their own GHG calculation
tools, provided they are consistent with the approaches
described.
There are two main categories of calculation tools:
• cross-sector tools that can be applied to many different
sectors: stationary combustion, mobile combustion, and
HFC use in refrigeration and air-conditioning
• sector-specific tools, e.g. aluminium, iron and steel,
cement, etc.
Most companies will need to apply more than one calculation
tool to cover all their GHG sources. For example, to calculate
GHG emissions from an aluminium smelter, the company
would use the calculation tools for aluminium production,
stationary combustion (for any import of electricity, steam and
heat, generation of energy on-site), and mobile combustion
(for transportation of materials and products, vehicles
employed on-site, and employee business travel).
Structure of calculation toolsAll cross-sector and sector-specific calculation tools are based
on a similar structure and offer step-by-step guidance on
measuring and calculating emissions data. Each calculation
tool comprises of a guidance section and automated
worksheets with explanations on how to use them.
36
Identifying and calculating GHG emissions

The general structure of the guidance section is as follows:
• overview: provides an overview of the purpose and scope
of the tool, the calculation method used in the tool, and a
process description
• choosing activity data and emissions factors: provides
good practice guidance and references for default
emissions factors
• calculation methods: describes different calculation
methods depending on the availability of site-specific
activity data and emissions factors
• quality control: provides good practice guidance
• internal reporting and documentation: provides guidance
on internal documentation to support emissions calculations
In the automated worksheet section, it is only necessary to
insert activity data into the worksheets and to select the
appropriate emissions factors. Default emissions factors are
provided, but it is also possible to insert customized emissions
factors if more accurate emissions factors are available. The
emissions of different GHGs are calculated separately and then
converted to CO2 equivalents on the basis of their global
warming potential.
Some of the tools take a tiered approach, offering a choice
between a simple and a more advanced calculation approach.
The more advanced approach results in more accurate
emissions data but usually require a higher level of data detail
37
Identifying and calculating GHG emissions
Calculation tools Main features
Stationary combustion • calculates direct and indirect CO2 emissions from combustion of fuels in stationaryequipment
• provides two options for allocating emissions from a co-generation facility• default emission factors provided for different fuels, and country averages for grid electricity
Mobile combustion • calculates direct and indirect GHG emissions (CO2) from mobile sources• mobile sources included are road, air, water, and rail transport• default emission factors provided
Cro
ss-s
ecto
r to
ols
HFC from air conditioningand refrigeration
• calculates direct HFC emissions during manufacture of refrigeration and air-conditioning(RAC) equipment, and use of RAC equipment in commercial applications
• two calculation methodologies are provided: a sales-based approach, and an emissionfactor based approach
Aluminium and other non-ferrous metals production
• calculates direct GHG emissions from aluminium production (CO2 from anode oxidationand PFC emissions from the ‘anode effect’)
• guideline and calculation approach provided for emissions of SF6 used in non-ferrousmetals production as a cover gas
Iron and steel • calculates direct GHG emissions (CO2) from oxidation of the reducing agent andcalcination of the flux used in steel production and from the removal of carbon from theiron ore and scrap steel used
Nitric acid manufacture • calculates direct GHG emissions (N2O) from the production of nitric acid
Ammonia manufacture • calculates direct GHG emissions (CO2) from ammonia production. This is for the removalof carbon from the feedstock stream only; combustion emissions are calculated with thestationary combustion module.
Adipic acid manufacture • calculates direct GHG emissions (N2O) from adipic acid production
Cement • calculates direct GHG emissions from cement manufacturing (CO2 from the calcinationprocess)
• two calculation methodologies are provided: cement-based approach and clinker-basedapproach
Lime • calculates direct GHG emissions from lime manufacturing (CO2 from the calcination process)
HFC-23 from HCFC-22production
• calculates direct HFC-23 emissions from production of HCFC-22
Sect
or-
spec
ific
to
ols
Semiconductors • calculates direct PFC emissions from production of semiconductor wafers
Table 4: Overview of GHG calculation tools available on the GHG Protocol website
and a more thorough understanding of the technologies used
in the business operations.
Table 4 provides an overview of the calculation tools available
at the GHG Protocol website, and their main features. In
addition, a user-friendly guide for calculating GHG emissions
from small office-based organizations is under development.
Roll-up GHG data to corporate levelTo report a corporation’s total GHG emissions, companies will
usually need to gather and summarize data from multiple sites,
possibly in different countries and business divisions. It is
important to plan this process carefully to minimize the
reporting burden, and to reduce the risk of random errors that
might occur while compiling data. Ideally, corporations will
integrate GHG reporting with their existing reporting tools and
processes, and take advantage of any relevant data already
collected or reported by sites to division or corporate offices.
The tools and processes chosen for a site to report data will
depend upon the information and communication
infrastructure already in place (i.e. how easy is it to include new
data categories in corporate databases). It will also depend
upon the amount of detail that corporate headquarters wish to
be reported from sites. Data collection and management tools
could include:
• secure databases available over the company intranet or
internet, for direct data entry by sites
• spreadsheet templates filled out and e-mailed to a corporate
or division office, where data is processed further
• paper reporting forms faxed to a corporate or division office
where data is re-entered in a corporate database. However,
this method will increase the likelihood of random errors.
For internal reporting up to the corporate level, it is
recommended that standardized reporting formats be used to
ensure that data received from different business units and
facilities is comparable, and that internal reporting rules are
observed (see BP box). Standardized formats can significantly
reduce the risk of random errors.
There are two basic approaches for gathering data on GHG
emissions from a corporation’s sites:
• individual sites directly calculate their GHG emissions and
report this data to the corporate level
• individual sites report activity/fuel use data (such as quantity
of fuel used) to the corporate level, where GHG emissions
are calculated
The difference between these two approaches is where the
emissions calculations occur, i.e. where activity data is
multiplied by the appropriate emissions factors.
Individual sites collect GHG emissions dataAsking facilities to calculate GHG emissions themselves will
help to increase their awareness and understanding of the
issue. However, it may also lead to resistance, increased
training needs, an increase in calculation errors, and a greater
need for auditing of calculations. Requesting that facilities
calculate GHG emissions themselves may be the preferred
option if:
• emissions calculations require detailed knowledge of the
kind of equipment being used at facilities
• emissions calculations are not standardized across a
number of facilities
• process emissions (in contrast to emissions from burning
fossil fuels) make up an important share of total GHG
emissions
• resources are available to train facility staff to conduct
these calculations and to audit them
• a user-friendly tool is available to simplify the calculation
and reporting task for site-level staff
Individual sites collect activity/fuel use dataThis approach may be particularly suitable for office-based
organizations. Requesting that facilities report their own
activity/fuel use data may be the preferred option if:
• the staff at the corporate or division level can calculate
emissions data in a straightforward manner on the basis of
activity/fuel use data
• emissions calculations are standardized across a number of
facilities
The choice of collection approach depends on the needs and
characteristics of the reporting company. Corporations have
taken different approaches. BP provides sites with a
calculation protocol, requests that they calculate and report
their total GHG emissions, and follows up with audits to
ensure calculations are correct and documented. United
Technologies Corporation requests that its sites report fuel
and travel details, leaving the choice of emissions factors and
38
Identifying and calculating GHG emissions
Corporate levelSite level
Activity data x
emissions factor =
GHG emissions
Activity data
Sites report GHGemissions
Sites report activity dataGHG emissions are calculated at corporate level:
activity datax
emissions factor =
GHG emissions

calculations to corporate staff. The two approaches should
produce the same result and they are not mutually exclusive.
To maximize accuracy and minimize reporting burdens, some
companies combine both approaches. A small number of
large, complex sites with process emissions are asked to
calculate their emissions at the site level, and these calculations
are carefully reviewed. Larger numbers of small sites with
uniform emissions from standard sources are asked only to
report fuel use and travel activity. The corporate database or
reporting tool then calculates total emissions for each of these
standard activities.
Even when facilities calculate their own emissions, corporate
staff may still wish to gather activity/fuel use data to double-
check calculations and to better understand the opportunities
for emissions reductions. Corporate staff should also verify that
facility-reported data is based on approved reporting periods,
units, and inventory boundaries.
Internal reporting of emissions data to corporate level
Reports from site level to corporate or division offices should
include all relevant information as specified in Chapter 9:
Reporting GHG emissions, and a number of additional
reporting categories. Some reporting categories are common
to both facility level data collection approaches. These include:
• a brief description of the emissions sources
• a list and justification of specific exclusion or inclusion of
sources
• comparative information from previous years
• the reporting period covered
• any trends seen in data
• progress toward any business targets
• an estimation of accuracy of activity/fuel use data reported
• a description of events and changes that have an impact
on reported data (acquisitions, divestitures, closures,
technology upgrades, changes of reporting boundaries or
calculation methodologies applied, etc.)
Individual sites report GHG emissions data to
corporate level
In addition to the aforementioned common categories of
reporting data, facilities using this approach should also report
the following details:
• description of GHG calculation methodologies, and any
changes made to methodologies relative to previous
reporting periods
• ratio indicators (see Chapter 9: Reporting GHG emissions)
• details on any data references used for the calculations, in
particular information on emissions factors used
Clear records of calculations undertaken to derive emissions
data should be kept for any future internal or external
verification.
Individual sites report activity/fuel use data to
corporate level
In addition to the aforementioned common categories of
reporting data, facilities using this approach should also report
the following details:
• fuel use data (fuel types used at facility and electricity
consumption)
• activity data for freight and passenger transport activities
(e.g. freight transport in tonnes x kilometers)
• activity data for process emissions (e.g. tonnes of fertilizer
produced, tonnes of waste landfilled)
• clear records of calculations undertaken to derive
activity/fuel use data
• any other conversion factors necessary to translate fuel use
into CO2 emissions
39
Identifying and calculating GHG emissions
BP: A standardized system for internalreporting of GHGs
BP has been collecting GHG data from the different parts of
its operations for more than four years and has recently
consolidated its internal reporting processes into one
central database system. The responsibility for reporting
emissions lies with about 320 individual BP facilities and
business departments, which are termed ‘reporting units‘.All reporting units have to complete a standard Excel
reporting pro-forma every quarter stating actual emissions
for the preceding three months, and updates to forecasts
for the current year and the next two years. In addition,
reporting units are asked to account for all significant
variances, including sustainable reductions. The reporting
units all use the same BP reporting guidelines (BP, 2000) for
quantifying their emissions of carbon dioxide and methane.
All pro-forma spreadsheets are e-mailed automatically by
the central database to the reporting units, and the
completed e-mail returns are uploaded into the database
by a corporate team, who check the quality of the
incoming data. The data is then compiled, by the end of
the month following each quarter end, to provide the total
emissions inventory and forecasts for analysis against BP’sGHG targets. Finally the inventory is reviewed by a team of
independent external auditors to provide assurance on the
quality and accuracy of the data.

40
There are several reasons why companies should plan and implement
appropriate activities to address inventory quality:
• to temper their decisions and conclusions when numbers
are ‘soft‘
• to identify opportunities to improve the accuracy of their
inventory
• to provide defensible data of relative certainty when, and if, these
are required by government regulation, emissions trading plans,
or eco-labeling programs
• to avoid costs if the inventory development has to be redone
Managinginventory quality
Chapter 8
For public reporting, it may be sufficient to document
inventory assumptions and to note major sources of
uncertainty. Other inventory uses may require calculation and
reporting of relative uncertainty. It is possible that for future
cap and trade systems, participation in the market may be
limited to those firms that can meet minimum inventory and
base year emissions standards. This is because performance
against a target is impossible to gauge if either the base year
data or the inventory is unreliable. In fact, reductions achieved
by companies or projects whose inventories are seen as less
reliable may be heavily discounted in credit-based trading.
Emissions trading, eco-certification and labeling may require a
higher degree of accuracy than general stakeholder reporting.
This is because the success of such programs depends on
reliably differentiating between small changes in GHG
performance, and between companies competing in the same
markets.
Ensuring inventory quality
To develop a high quality inventory, it is essential to plan an
inventory quality system that includes suitable reviews and
accuracy checks for activity data, emissions factors, emissions
calculations, and that applies uncertainty analysis tools to
qualify data. There are two main sources of uncertainty in any
emissions inventory:
Systemic uncertainty is a consistent difference between a
measurement and its true value that is not due to random
chance. Systemic uncertainty depends on the internal system
adopted to calculate and report emissions data to corporate
level. Usually a company has direct control over the choice
and management of calculation protocols and internal
reporting system. Therefore, companies can ensure low
systemic uncertainty by adopting appropriate quality
assurance practices (see the section on ‘steps to improve
inventory quality’ in this chapter).
Inherent uncertainty is a difference due to random error, or
due to fluctuations between a measurement and its true
value. Inherent uncertainty depends on the calculation
methodology used, and the measurement of
activity/emissions data. In all methods for inventory
development, some sources of inherent uncertainty will always
be present.
Broadly speaking, there are two calculation methodologies
that can be used to generate emissions data:
• Emissions factor method: emissions factors applied in this
approach are either obtained from published sources, or
derived from site-specific and/or source-specific data. Use
of derived emissions factors is always preferred as it leads
to higher certainty in emissions data. Activity data usually
have lower uncertainties as they are linked with economic
activity and so there are generally financial incentives to
keep accurate records. In cases where activity data are
measured using instruments, uncertainty is a function of
instrument capabilities and proper calibration.
• Direct monitoring system: inventory quality procedures
required for a direct monitoring system are more detailed.
Precision in direct monitoring of GHG emissions may
require measurement of both the exit stream and the
uncontrolled stream. The sources of uncertainty in this
case are due to instrument capabilities and calibration.
The need for appropriate tools to characterize uncertainty is
discussed in the section on ‘Undertaking an uncertainty
analysis’. In order to minimize uncertainties, the companies
developing inventories should employ consistent inventory
quality procedures.
Steps to improve inventory quality
1. Adopt and apply GHG accounting and reporting
principles
The first step toward increasing credibility is to implicitly
follow the GHG accounting and reporting principles in all
phases of the inventory development process (see Chapter
1: GHG accounting and reporting principles).
2. Use a standardized system for calculation and internal
reporting of GHGs across multiple business
units/facilities (see Chapter 7: Identifying and calculating
GHG emissions).
3. Select an appropriate calculation methodology
The desired level of inventory quality relates to inventory
end uses. For an overall assessment of GHG emissions for
internal management purposes, published emissions
factors may be acceptable. If the inventory goal, however,
is to participate in an emissions trading scheme, emissions
factors may need to be derived from site-specific fuel and
equipment data, or, for certain sources, on a continuous
emissions monitoring system. Table 5 provides a
comparison of various calculation methods.
4. Set up a robust data collection system
Designing a good data collection can greatly reduce
possible sources of errors such as data inaccuracy and/or
data input mistakes. Some good practices in the data
collection process are provided below:
• request data in familiar unit/s (e.g. natural gas data in
volume units)
41
Managing inventory quality

• request data from metered or measured sources as they
may be more accurate than purchase records
• establish internal control systems to catch errors (e.g.
request both activity use data and activity cost data to
enable a cross check for data errors, compare and check
with previous year(s) data)
Where fuel activity data is provided in other units (currency,
mass, volume) it should preferably be converted to energy
units before calculating the carbon content. The CO2
emissions from burning a unit of a specific fuel will be more
exactly determined if the amount of energy units burned is
known.
5. Establish appropriate information technology controls
To ensure authorized use of relevant computer applications,
such as calculation protocols, databases, internal and
external reporting files, and back-up information.
6. Undertake regular accuracy checks for technical errors
Technical errors can result from various sources such as:
• incomplete identification of emissions sources
• use of incorrect methods or assumptions
• errors in converting measurement units
• use of incorrect data
• mistakes in data entry
• incorrect use of spreadsheets or calculation tools
• mathematical miscalculations
The inventory development process should include
numerous quality checks on a regular basis to spot any of
the technical errors listed above. The quality checks can
take various forms, such as:
• track and verify data input
• check spreadsheet formulae
• compare derived emissions factors with published
factors
• compare facility level fuel purchase with total fuel use
from all identified combustion emissions sources
7. Conduct periodic internal audits and technical reviews
Internal experts who are not directly involved in the
inventory development process should carry out periodic
technical reviews and audits.
8. Ensure management review of the GHG information
To help in the identification of additional issues of
misreporting and inaccuracies, and to enhance utility of
the GHG inventory.
9. Organize regular training sessions for inventory
development team members
10. Perform uncertainty analysis
Qualifying and/or calculating the error range of an
emissions estimate should be carried out to evaluate the
quality of emissions estimates. Uncertainty, its sources, and
methods for its quantification are discussed in following
sections.
11. Obtain independent external verification
Undertaking an uncertainty analysis
Uncertainty analysis is normally undertaken to help identify
areas where accuracy needs to be improved, and to prioritize
inventory quality efforts. The uncertainty estimates can also be
useful in reviewing the choice of calculation methodology. For
some inventory end-uses, it may be necessary to
communicate the actual reliability of the emissions data. In
such cases, companies may need to carry out an uncertainty
analysis as an essential element of the complete inventory.
42
Managing inventory quality
Calculation approaches
Published emission factors
Derived emission factors
Emissions or parameters monitoring
Inventory quality Data requirements Cost
Fair – Good1 Low Low
High Moderate Moderate
Good – High High High
Vauxhall Motors: The importance of regularaccuracy checks
When setting up GHG information collection systems it is
important to pay attention to detail as illustrated by the
following example from UK automotive manufacturer,
Vauxhall Motors. The company wished to calculate GHG
emissions from staff air travel. However, when determining
the impact of flight travel, it is important to make sure that
the round trip distance is used when calculating emissions.
Fortunately, Vauxhall realized this fact early on and avoided
reporting emissions that were 50 percent lower than the
actual value.
Table 5: Comparison of calculation approaches

Identifying sources of uncertainty
As discussed in the previous section on ‘Ensuring inventory
quality’, uncertainty in emissions estimates can be either due
to systemic errors or inherent errors, or a combination of
both.
Systemic uncertainty results from choices such as follows:
• use of factors that are poorly researched and uncertain
(e.g. factors for CH4 and N2O from combustion processes)
• use of ‘average case‘ factors not perfectly matched to
specific and varying circumstances (e.g. average miles per
gallon, average kgCO2/MWh generated)
• deliberate estimation to compensate for missing data (e.g.
non-reporting facilities, or missing fuel bills)
• assumptions that simplify calculation of emissions from
highly complex processes
Inherent uncertainty results from random errors such as:
• imprecise measurement of emissions-producing activity
(e.g. miles traveled in aeroplanes or rental vehicles, hours
per year specific equipment is used)
• insufficient frequency of measurement to account for
natural variability
• poor calibration of measuring instruments
• human errors of calculation and omission
Approaches for characterizing uncertainty
The first step toward characterizing uncertainty associated
with emissions data is to understand and quantify the
different sources of variability and inaccuracies in the data
being used. This analysis should include an assessment of
both systemic and inherent uncertainty. Depending on the
desired level of quality, companies should then work toward
minimizing both sources of uncertainty. They can choose from
three different methods to characterize uncertainty of
emissions totals. In an emissions inventory these can be
applied to specific line items, subtotals, or grand totals.
1. The simplest approach for estimating uncertainty is to
note the main sources of systemic and inherent
uncertainty in the inventory. If possible, the direction
(over- or underestimates) of any systemic uncertainty and
an estimate of the relative magnitude (e.g. 30 percent) of
the specific source of uncertainty should be stated. This
will usually be sufficient for internal management and
public reporting purposes.
2. Alternatively, companies can use an ordinal ranking system
to characterize uncertainty of emissions data (semi-
quantitative ranking). The number of levels and the
confidence intervals used are left to the discretion of the
individual company. For instance, an ordinal ranking
system could take the following form:
• high certainty – actual emissions likely to be within
+/- 5% of reported total
• good certainty – actual emissions likely to be within
+/- 15% of reported total
• fair certainty – actual emissions likely to be within
+/- 30% of reported total
• poor certainty – actual emissions could vary by more
than +/- 50% from reported total
3. Finally, companies can use numerical estimates for
confidence intervals (e.g. plus or minus seven percent) to
provide a quantitative uncertainty value for emissions
data. Numerical estimates may be based on professional
experience, or they may be calculated from available
statistics. This approach usually requires considerable effort
and data.
Quantifying uncertainty at emissions source level andcorporate level
A facility’s reported emissions total is usually computed by
adding together several single-source subtotals such as:
emissions from combustion of natural gas, emissions from
electricity use, and emissions from vehicle fleet operation.
If needed by regulatory schemes, certainty judgements can be
made for each reported subtotal and for the grand total. If a
firm has multiple sites, its corporate total is the result of
further addition across sites. Companies aiming to calculate or
rank certainty therefore need to employ two methods – one
for single-source subtotals and the other for sums combining
these subtotals. These methods are explained in detail in the
guidelines on quantification of uncertainty available at the
GHG Protocol website: www.ghgprotocol.org
43
Managing inventory quality
1 For commonly used fossil fuels, the inventory quality can be good.
NOTES

44
Reported information should be ‘relevant, complete, consistent,
transparent and accurate‘. The GHG Protocol specifies reporting to a
minimum of scopes 1 and 2.
GHG reports should be based on the best data available at the time of
publication. At the outset, it is better to be open about any
limitations, and over time, correct and communicate any
discrepancies identified in subsequent years.
ReportingGHG emissions
Chapter 9

A public GHG emissions report should include thefollowing information:
Description of the reporting organization and its boundaries
• provide an outline of the organization and the reporting
boundaries chosen
• specify the reporting period covered
• justify specific exclusions of sources
Information on emissions and performance
• report emissions data both on a control-based and an
equity share-based approach
• report emissions data separately for each scope
• report emissions data for all six GHGs separately (CO2,
CH4, N2O, HFCs, PFCs, SF6) in metric tonnes and in metric
tonnes of CO2 equivalent
• illustrate performance over time and, if appropriate,
relative to a base year datum and a target
• subdivide emissions data further, where this aids
transparency, e.g. by business units/facilities, country,
source types (optional)
• report relevant ratio performance indicators (optional)
• illustrate performance against internal and external
benchmarks (optional)
Supporting information
• describe the methodologies used to calculate and account
for emissions, or provide a reference or link to the
calculation tools used
• provide appropriate context for any significant emissions
changes, such as extended process shut downs,
acquisitions/divestitures, outsourcing/insourcing, plant
closures/openings, process changes, changes in reporting
boundaries or calculation methodologies
• report any emissions reduction credits that are banked,
purchased from, or sold to a third party. Specify if the
reduction is verified/certified and provide appropriate
supporting information (see Chapter 5: Accounting for
GHG reductions)
• report emissions from biologically-sequestered carbon
(e.g. CO2 from burning biomass/biofuels)
• report emissions attributable to the generation of
exported electricity and steam (by a non-electric utility)
(see Chapter 4: Setting operational boundaries)
• outline any GHG management/reduction programs or
strategies, as well as information on GHG reduction
projects accruing outside the reporting boundaries,
subdivided for sinks and sources reduction projects.
Specify if the project is verified/certified and provide
appropriate supporting information (see Chapter 5:
Accounting for GHG reductions) (optional)
• report emissions from GHGs not covered by the Kyoto
Protocol, e.g. CFCs, NOx, etc. (optional)
• outline external assurance provided over the reported
emissions data (optional)
• provide a contact person
45
Reporting GHG emissions

By following the GHG Protocol reporting requirements, users
adopt a comprehensive standard with the necessary detail for
credible public reporting. For national or voluntary GHG
reporting, trading, and regulatory schemes, or for internal
management purposes, reporting requirements may vary or be
less detailed (Appendix 1 summarizes the requirements of several
voluntary GHG initiatives).
For public reporting, it is important to differentiate between
frontline reports that are, for example, published on the internet
or in brochures, and background reports that contain all
necessary data. Not every frontline report must contain all
information as specified by the GHG Protocol standards, but it
should provide a link or reference to a publicly available
background report where all the required information is available.
In addition to the six Kyoto gases, companies may also want to
provide emissions data for other GHGs (e.g. Montreal gases) to
put changes in the emissions levels of Kyoto gases into context.
Switching from CFCs to HFCs, for example, will increase
emissions of Kyoto gases. Information on the emissions of GHGs,
other than the six Kyoto gases, should be reported separately in a
public report as supporting information (see Texaco box).
Emissions from bio-fuels such as wood should also be reported
separately under supporting information.
For some companies, providing emissions data for specific GHGs
and business units, or reporting ratio indicators, may compromise
business confidentiality. If this is the case, the data need not be
publicly reported, but can be made available to those auditing
the GHG emissions data, assuming confidentiality is secured.
It takes time to develop a rigorous and complete inventory of
GHG emissions. Knowledge will improve over several years of
estimating and reporting data. It is therefore recommended that
the GHG report:
• is based on the best data available at the time of publication,
while being open about its limitations
• openly communicates any discrepancies identified in
subsequent years
When reporting changes to boundaries or emissions calculation
methodologies, and when mergers, divestitures, acquisitions or
closures occur, it is important to provide additional information to
users. This allows current emissions data to be compared to data
from previous years. If improved measurement, calculation and
collection procedures lead to significant differences in reported
GHG data, companies are encouraged to adjust the data
reported for previous years. Chapter 6: Setting a historic
performance datum, describes how corporate base year
emissions should be adjusted to account for structural changes
such as mergers, acquisitions, divestitures or closures.
46
Guidance on reporting GHG emissions
Guidance on reporting GHG emissions
Texaco: Reporting non-Kyoto GHGs
One objective of the independent review of Texaco’s GHG
emissions inventory was to make recommendations for
enhancing the accuracy and completeness of the company’sinventory.
A key finding from the review of the company’s protocol
related to the types of GHGs included. By taking into account
the Kyoto gases which concern the oil and gas industry (CO2,
CH4, and N2O), as well as other non-Kyoto gases such as NOx,
CO, VOCs, H2S, and SOx, Texaco obtained the flexibility to
participate in potential multi-pollutant trading scenarios which
are likely to develop in the future, such as those proposed in
the U.S. However, combining these emissions in a CO2
equivalent total could provide an inconsistent comparison for
benchmarking Texaco’s emissions against other petroleum
industry companies.
This theory was tested by examining the relative impact of
NOx, CO and VOC on total GHG emissions from commonly
used natural gas-fired combustion equipment. The assessment
indicated that the contribution of NOx to the total CO2
equivalent GHG emissions represented three to four percent of
the total emissions from gas heaters, nine to ten percent of
emissions from natural gas turbines, and 50 percent of
emissions from natural gas IC engines. Emissions of CO and
VOC are negligible (< 0.2 percent) for gas heaters and
turbines, and < one percent for IC engines. Therefore,
inclusion of NOx in the GHG inventory does, for some sources,
have a significant impact on the total estimated emissions;
while CO and VOC are unlikely to be material to gas-fired
combustion source GHG emissions. Based on these findings,
the URS/KPMG team recommended that CO2, CH4 and N2O
emissions be tracked separately from the criteria pollutants to
maintain consistency between Texaco’s emissions reporting
and other industry and international practices.

47
Guidance on reporting GHG emissions
Use of ratio indicators
There are two principal aspects of GHG performance, which
are of interest to management and stakeholders. One
concerns the overall GHG impact of a company or an
organization – that is the absolute quantity of GHG emissions.
The other concerns the performance in reducing GHG
emissions, measured in ratio indicators.
Ratio indicators provide information on relative performance.
Ratios can facilitate comparison between similar products and
processes. However, it is important to recognize the inherent
diversity of businesses, and the circumstances of individual
companies. Apparently minor differences in process, product
or location can be significant in terms of environmental effect.
It is necessary to know the business context in order to be
able to interpret ratio indicators correctly. Companies may
choose to report GHG ratio indicators for a number of
reasons. These include:
• looking at performance over time, i.e. relating figures from
different years, and in relation to targets and base years
• establishing a relationship between figures from different
categories, e.g. the relation between the value that an
action provides compared to its impact on society or on
the environment
• improving comparability between different sizes of
business and operations by normalizing figures , i.e. by
assessing the impact of different sized businesses on the
same scale
Corporations should form ratios using the performance data
that make sense for their business and that supports their
decision-making. They should select ratios for external
reporting that permit a better understanding and
interpretation of their performance for their stakeholders. It is
important to provide some perspective on issues such as
scope and limitations of indicators in such a way that users
understand the nature of the information provided.
Corporations should think about what ratio indicators could
best capture the benefits and impacts of their business, i.e. its
operations, its products, and its effects on the marketplace
and on the entire economy. Some examples of different ratio
indicators are provided below.
Productivity/efficiency ratios
Productivity/efficiency ratios express the value or achievement
of a business related to its GHG impact. Increasing efficiency
ratios reflect a positive performance improvement. Examples
of productivity/efficiency ratios include resource productivity
(e.g. sales per GHG), and process eco-efficiency (e.g.
production volume per amount of GHGs).
Intensity ratios
Intensity ratios express the GHG impact per unit of activity or
unit of value. A declining intensity ratio reflects a positive
performance improvement. Many companies historically
tracked environmental performance with intensity ratios.
Intensity ratios are often called ‘normalized’ environmental
impact data. Examples of intensity ratios include emissions
intensity (e.g. tonnes of CO2 emissions per electricity unit
generated) and resource intensity (e.g. GHG emissions per
function or per service).
Percentages
A percentage indicator is a ratio between two similar issues
(with the same physical unit in numerator and denominator).
Examples of percentages that can be meaningful in
performance reports include current GHG emissions expressed
as a percentage of base year GHG emissions.
For further guidance on ratio indicators refer to Verfaillie, H.
and Bidwell, R., 2000; ISO 1999; NRTEE, 1999; and GRI,
2000.

48
Verification is the objective and independent assessment of whether
the reported GHG inventory properly reflects the GHG impact of the
company in conformance with the pre-established GHG accounting
and reporting standards.
Verification involves testing certain assertions of the GHG inventory,
such as accuracy and completeness. Verification also requires
evaluating and testing the ‘supporting’ evidence (in the form of an
audit trail) of how the GHG inventory was generated,
compiled/aggregated and reported.
Verification of GHG emissions
Chapter 10

The practice of verifying corporate GHG inventories is still in
its infancy, and the absence of generally accepted GHG
accounting and reporting standards means that reporting
standards against which verifications have taken place have
varied from company to company.
With the emergence of generally accepted accounting and
reporting standards, such as the GHG Protocol, verification
practices should become more uniform, credible, and widely
accepted. This section provides guidance on conducting an
independent verification of a GHG inventory. Even if a
company decides not to conduct an independent verification
at this time, it should still develop its inventory so that it may
be verified in the future.
Objectives
Before commissioning and planning an independent
verification, the reporting company should clearly define its
objectives (more information in Chapter 2: Business goals and
inventory design), and decide whether an external verification
is the best way to enhance those. Reasons for undertaking a
verification include:
• to add credibility to publicly reported information and
reduction goals, and to enhance stakeholder trust in the
reporting organization
• to increase management and board confidence in
reported information
• to improve internal GHG accounting and reporting
practices (data calculation, recording and internal
reporting systems, application of GHG accounting
principles, e.g. checks for completeness, consistency,
accuracy), and to facilitate learning and knowledge
transfer within the organization
• to meet or anticipate the requirements of future trading
programs
A key driver for the independent verification of BP’s GHG
inventory was to demonstrate to outside stakeholders the
company’s commitment to its reduction target, and also to
provide a sound basis for its internal emissions trading
program.
BP’s verification involved a team of third-party reviewers from
several consulting, verification and financial auditing firms,
supported by an independent expert panel which included
representatives from government, NGOs, academia, and the
United Nations. There are other ways to improve the quality,
reliability, and usefulness of GHG information, such as those
described in Chapter 8: Managing inventory quality.
Scope of verification
The scope of an independent verification and the level of
assurance it provides should be influenced by the company
goals and verification objectives. It is possible to verify either
the entire inventory data or specific parts of it. Parts may be
specified in terms of geographic location, business units and
facilities, and type/scope of emissions.
The verification process should also examine more general
managerial issues, such as internal control procedures,
managerial awareness, availability of resources, clearly defined
responsibilities, segregation of duties, and internal review
procedures. The reporting company and the verifier must
reach an agreement up-front on the level of assurance to be
provided. This addresses issues such as: should the auditor
simply review the data (low level of assurance) or actually
audit it (high level of assurance); and whether the verification
should involve site visits or be limited to a desktop review of
documentation. Companies such as BP and Texaco have
conducted independent verifications that have focused solely
on GHG emissions, while others, such as Shell, have
incorporated the verification of their GHG emissions into the
verification of environmental reporting.
Selecting a verifier
The selection and engagement of a verifier should take place
during the GHG reporting period in question, not at the end.
Defining the inventory scope and designing the processes for
data collection and internal documentation are much easier
when it is known in advance that the inventory must be
verifiable.
Some factors to consider when selecting a verifier include:
their experience in GHG verification, their understanding of
GHG issues and the company’s operations and their
objectivity and independence. The knowledge and
qualifications of the individual(s) conducting the verification is
more important than those of the organization they come
from.
The reporting company and the selected verifier should jointly
define an appropriate approach on which to base the design
and subsequent execution of the work plan. This also includes
deciding what type of information is necessary to complete
the verification. The verifier and the organization usually
discuss the approach before the external verification is
commissioned.
49
Verification of GHG emissions

Material needed for a GHG verification
1. All information as specified by Chapter 9: Reporting
GHG emissions
2. Information about the company:
• information about the company’s main activities and
their GHG emissions (type of GHG produced,
description of activity that causes GHG emissions)
• company group organization (list of subsidiaries and
their geographic location, ownership structure)
3. Data sources used for calculating GHG emissions.
This might, for example, include:
• energy consumption data (invoices, delivery notes,
weigh-bridge tickets, meter readings for electricity, gas
pipes, steam and hot water)
• production data (tonnes of material produced, kWh of
electricity produced)
• raw material consumption data for mass balance
calculations (invoices, delivery notes, weigh-bridge
tickets)
• activity data to calculate indirect emissions (invoices
for employee travel, invoices from shipping
companies)
4. Description of how GHG emissions data have been
calculated:
• emissions factors used and their justification
• assumptions on which estimations are based
5. Information gathering process:
• description of the systems used to collect, document and
process GHG emissions data at the facility and corporate
level
• description of internal control procedures applied
(internal audits, comparison with last year’s data,
recalculation by second person, etc.)
6. Other information:
• consolidation spreadsheets
• list of persons responsible for collecting GHG emissions
data at every site and at the corporate level (e-mail
and telephone numbers)
• information on uncertainties, quantified or otherwise
Documentation
Appropriate evidence needs to be available to support the
information in the GHG inventory being subjected to external
verification. Assertions by management for which there is no
available supporting evidence cannot be verified. Where a
reporting organization has not yet implemented systems for
routinely measuring and recording GHG emissions data, an
external verification cannot be undertaken.
Reporting entities need to guarantee the existence, quality
and retention of documentation so as to create an audit trail
of how the inventory was compiled. Reporting entities
designing and implementing the processes and procedures for
creating an inventory should, therefore, make a point of
creating a clear audit trail.
Information that underpins GHG inventory data should be
recorded in an electronic database or in another systematic
manner. Some of the required information for a GHG inventory
may already be in normal management/account records, or in
environmental management systems such as ISO 14001 and
the EU Eco-Management and Audit Scheme (EMAS).
While emissions reported under scopes 1 and 2 can be
verified fairly easily, verifying scope 3 emissions is more
complex since this usually requires access to data held by
another company or organization.
50
Verification of GHG emissions

References
API (2001), Compendium of Greenhouse Gas EmissionsMethodologies for the Oil and Gas Industry, Final Draft,
American Petroleum Institute
BP (2000), Environmental Performance: Group ReportingGuidelines, Version 2.2
DEFRA (2001), Guidelines for the Measurement and Reporting ofEmissions in the UK Emissions Trading Scheme, UK Department
for Environment, Food and Rural Affairs, UK ETS(01)05
DEFRA (1999), Environmental Reporting: Guidelines forCompany Reporting on Greenhouse Gas Emissions, UK
Department for Environment, Food and Rural Affairs, London
EC-DGE (2000), Guidance Document for EPER Implementation,
European Commission Directorate-General for Environment
EIA (1999), Voluntary Reporting of Greenhouse Gases, DOE/IEA-
0608(95), U.S. Energy Information Administration,
Department of Energy
EIA (1997), Mitigating Greenhouse Gas Emissions: VoluntaryReporting. U.S. Energy Information Administration,
Department of Energy, Washington DC
EPA (1999), Emission Inventory Improvement Program, Volume
VI: Quality Assurance/Quality Control. U.S. Environmental
Protection Agency
GRI (2000), Global Reporting Initiative, Sustainability ReportingGuidelines on Economic, Environmental, and Social Performance,
Global Reporting Initiative
IEA (2000), International Energy Agency, Paris (personal
communication with Karen Treanton
IPCC (2000), Good Practice Guidance and UncertaintyManagement in National Greenhouse Gas Inventories,Intergovernmental Panel on Climate Change
IPCC (1996a), Revised IPCC Guidelines for National GHGInventories: Reference Manual, Intergovernmental Panel on
Climate Change
IPCC (1996b), Revised IPCC Guidelines for National GHGInventories: Reference Manual, Intergovernmental Panel on
Climate Change
ISO (1999), International Standard on EnvironmentalPerformance Evaluation, (ISO 14031), International Standard
Organization, Geneva
Loreti, C., Wescott, W., and M. Isenberg (2000), An Overviewof Greenhouse Gas Emissions Inventory Issues, Pew Center on
Global Climate Change, Washington DC
NRTEE (1999), Measuring Eco-efficiency in Business: Feasibility ofa Core set of Indicators, National Roundtable on the
Environment and Economy, Ottawa
Thomas, C., Tennant, T., and J. Rolls (2000), The GHGIndicator: UNEP Guidelines for calculating Greenhouse GasEmissions for Business and Non-commercial Organizations,United Nations Environment Programme
Verfaillie, H., and R. Bidwell (2000), Measuring Eco-efficiency:A Guide to Reporting Company Performance, World Business
Council for Sustainable Development, Geneva
51
References

Appendix 1
Appendix 1 provides an overview of the GHG accounting and reporting requirements of different voluntary GHG initiatives.
52
Appendix 1
Voluntary initiative Focusentity (company) orproject
Gases covered Operational boundaries(direct/indirect emissions)
Organizationalboundaries
Australian GreenhouseChallenge
Entity (Australianoperations)
Six Kyoto gases Scopes 1 and 2 Distinguishes betweenGHGs the entitycontrols and those itinfluences, reductionsfrom influencedactivities are reportedseparately
California GHG Registry Entity (see legislation fordetails)
Six Kyoto gases Scopes 1 and 2 required,scope 3 to be determined
Consistent with GHGProtocol
Canada Climate ChangeVoluntary Challenge andRegistry
Entity CO2 required, otherKyoto gases optional
Flexible (scopes 1, 2, or 3) 100 percent ofemissions fromoperated facilities
Environmental ResourcesTrust – GHG Registry
Entity and project (withverifiable baseline)
Six Kyoto gases Scope 1 Case-by-case basis,depending uponownership structure and operating control
US EPA Climate LeadersInitiative
Entity (US operationsrequired, globaloperations optional)
Six Kyoto gases Scopes 1 and 2 required,scope 3 optional
Consistent with GHGProtocol
US Voluntary Reportingon GHG (1605bProgram)
Entity or project (US andinternational operationsof any US company)
Six Kyoto gases andozone precursors
Flexible (scopes 1, 2, or 3) Identification of otherpotential reporters tosame emissionreduction required
World Wildlife FundClimate Savers Program
Entity Energy related CO2,other gases on anegotiated basis
Scopes 1 and 2 required,scope 3 optional
Consistent with GHGProtocol
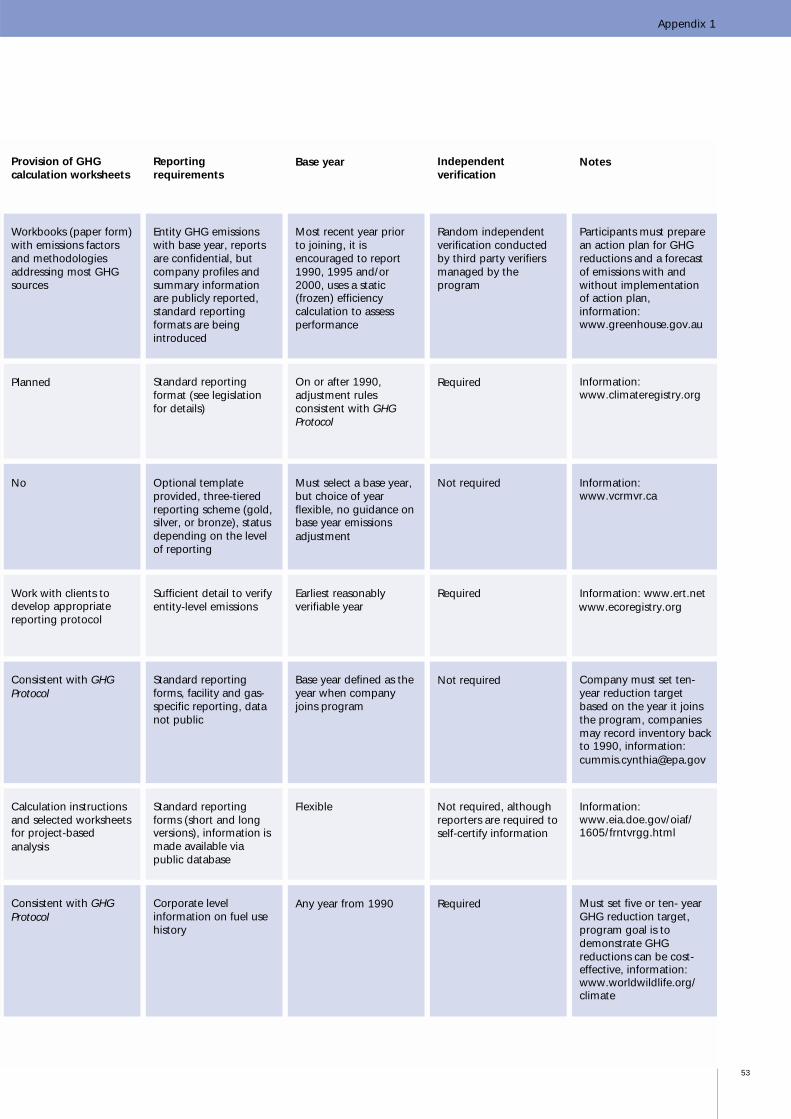
53
Appendix 1
Provision of GHGcalculation worksheets
Reportingrequirements
Base year Independentverification
Notes
Workbooks (paper form)with emissions factorsand methodologiesaddressing most GHGsources
Entity GHG emissionswith base year, reportsare confidential, butcompany profiles andsummary informationare publicly reported,standard reportingformats are beingintroduced
Most recent year priorto joining, it isencouraged to report1990, 1995 and/or2000, uses a static(frozen) efficiencycalculation to assessperformance
Random independentverification conductedby third party verifiersmanaged by theprogram
Participants must preparean action plan for GHGreductions and a forecastof emissions with andwithout implementationof action plan,information:www.greenhouse.gov.au
Planned Standard reportingformat (see legislationfor details)
On or after 1990,adjustment rulesconsistent with GHGProtocol
Required Information:www.climateregistry.org
No Optional templateprovided, three-tieredreporting scheme (gold,silver, or bronze), statusdepending on the levelof reporting
Must select a base year,but choice of yearflexible, no guidance onbase year emissionsadjustment
Not required Information:www.vcrmvr.ca
Work with clients todevelop appropriatereporting protocol
Sufficient detail to verifyentity-level emissions
Earliest reasonablyverifiable year
Required Information: www.ert.net
Consistent with GHGProtocol
Standard reportingforms, facility and gas-specific reporting, datanot public
Base year defined as theyear when companyjoins program
Not required Company must set ten-year reduction targetbased on the year it joinsthe program, companiesmay record inventory backto 1990, information:[email protected]
Calculation instructionsand selected worksheetsfor project-basedanalysis
Standard reportingforms (short and longversions), information ismade available viapublic database
Flexible Not required, althoughreporters are required toself-certify information
Information:www.eia.doe.gov/oiaf/1605/frntvrgg.html
Consistent with GHGProtocol
Corporate levelinformation on fuel usehistory
Any year from 1990 Required Must set five or ten- yearGHG reduction target,program goal is todemonstrate GHGreductions can be cost-effective, information:www.worldwildlife.org/climate
www.ecoregistry.org
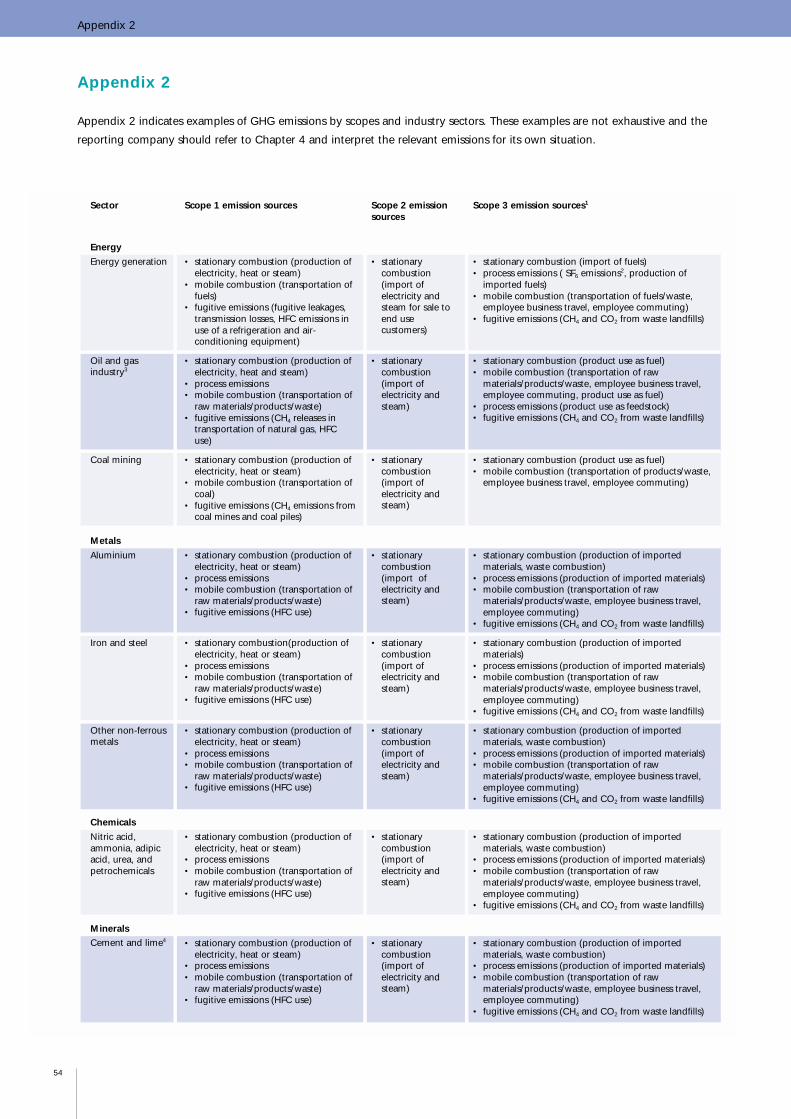
Appendix 2
Appendix 2 indicates examples of GHG emissions by scopes and industry sectors. These examples are not exhaustive and the
reporting company should refer to Chapter 4 and interpret the relevant emissions for its own situation.
54
Appendix 2
Sector Scope 1 emission sources Scope 2 emissionsources
Scope 3 emission sources1
Energy generation • stationary combustion (production ofelectricity, heat or steam)
• mobile combustion (transportation offuels)
• fugitive emissions (fugitive leakages,transmission losses, HFC emissions inuse of a refrigeration and air-conditioning equipment)
• stationarycombustion(import ofelectricity andsteam for sale toend usecustomers)
• stationary combustion (import of fuels)• process emissions ( SF6 emissions2, production of
imported fuels)• mobile combustion (transportation of fuels/waste,
employee business travel, employee commuting)• fugitive emissions (CH4 and CO2 from waste landfills)
Oil and gasindustry3
• stationary combustion (production ofelectricity, heat and steam)
• process emissions• mobile combustion (transportation of
raw materials/products/waste)• fugitive emissions (CH4 releases in
transportation of natural gas, HFCuse)
• stationarycombustion(import ofelectricity andsteam)
• stationary combustion (product use as fuel)• mobile combustion (transportation of raw
materials/products/waste, employee business travel,employee commuting, product use as fuel)
• process emissions (product use as feedstock)• fugitive emissions (CH4 and CO2 from waste landfills)
Coal mining • stationary combustion (production ofelectricity, heat or steam)
• mobile combustion (transportation ofcoal)
• fugitive emissions (CH4 emissions fromcoal mines and coal piles)
• stationarycombustion(import ofelectricity andsteam)
• stationary combustion (product use as fuel)• mobile combustion (transportation of products/waste,
employee business travel, employee commuting)
s
Aluminium • stationary combustion (production ofelectricity, heat or steam)
• process emissions• mobile combustion (transportation of
raw materials/products/waste)• fugitive emissions (HFC use)
• stationarycombustion(import ofelectricity andsteam)
• stationary combustion (production of importedmaterials, waste combustion)
• process emissions (production of imported materials)• mobile combustion (transportation of raw
materials/products/waste, employee business travel,employee commuting)
• fugitive emissions (CH4 and CO2 from waste landfills)
Iron and steel • stationary combustion(production ofelectricity, heat or steam)
• process emissions• mobile combustion (transportation of
raw materials/products/waste)• fugitive emissions (HFC use)
• stationarycombustion(import ofelectricity andsteam)
• stationary combustion (production of importedmaterials)
• process emissions (production of imported materials)• mobile combustion (transportation of raw
materials/products/waste, employee business travel,employee commuting)
• fugitive emissions (CH4 and CO2 from waste landfills)
Other non-ferrousmetals
• stationary combustion (production ofelectricity, heat or steam)
• process emissions• mobile combustion (transportation of
raw materials/products/waste)• fugitive emissions (HFC use)
• stationarycombustion(import ofelectricity andsteam)
• stationary combustion (production of importedmaterials, waste combustion)
• process emissions (production of imported materials)• mobile combustion (transportation of raw
materials/products/waste, employee business travel,employee commuting)
• fugitive emissions (CH4 and CO2 from waste landfills)
s
Nitric acid,ammonia, adipicacid, urea, andpetrochemicals
• stationary combustion (production ofelectricity, heat or steam)
• process emissions• mobile combustion (transportation of
raw materials/products/waste)• fugitive emissions (HFC use)
• stationarycombustion(import ofelectricity andsteam)
• stationary combustion (production of importedmaterials, waste combustion)
• process emissions (production of imported materials)• mobile combustion (transportation of raw
materials/products/waste, employee business travel,employee commuting)
• fugitive emissions (CH4 and CO2 from waste landfills)
sCement and lime4 • stationary combustion (production of
electricity, heat or steam)• process emissions• mobile combustion (transportation of
raw materials/products/waste)• fugitive emissions (HFC use)
• stationarycombustion(import ofelectricity andsteam)
• stationary combustion (production of importedmaterials, waste combustion)
• process emissions (production of imported materials)• mobile combustion (transportation of raw
materials/products/waste, employee business travel,employee commuting)
• fugitive emissions (CH4 and CO2 from waste landfills)
Energy
Metal
Chemical
Mineral

55
Appendix 2
Landfills, wastecombustion, andwater servicecompanies
• stationary combustion (production ofelectricity, heat or steam, wastecombustion)
• fugitive emissions (CH4 and CO2
emissions from waste landfills)• mobile combustion (transportation of
waste/products)
• stationarycombustion(import ofelectricity andsteam)
• stationary combustion (recycled waste used as a fuel)• process emissions (recycled waste used as a feedstock)• mobile combustion (transportation of waste/products,
employee business travel, employee commuting)
Pulp and paper6
Pulp and paper • stationary combustion (production ofelectricity, heat or steam)
• mobile combustion (transportation ofraw materials/products/waste)
• fugitive emissions (HFC use, landfillCH4 and CO2 emissions)
• stationarycombustion(import ofelectricity andsteam)
• stationary combustion (production of imported materials,waste combustion)
• process emissions (production of imported materials)• mobile combustion (transportation of raw
materials/products/waste, employee business travel,employee commuting)
• fugitive emissions (landfill CH4 and CO2 emissions)
HCFC 22production
• stationary combustion(production ofelectricity, heat or steam)
• process emissions• mobile combustion (transportation of
raw materials/products/waste)• fugitive emissions (HFC use)
• stationarycombustion(import ofelectricity andsteam)
• stationary combustion (production of imported materials)• process emissions (production of imported materials)• mobile combustion (transportation of raw
materials/products/waste, employee business travel,employee commuting)
• fugitive emissions (fugitive leaks in product use, CH4 andCO2 from waste landfills)
Generalmanufacturing andconsumerproducts
• stationary combustion (production ofelectricity, heat or steam)
• mobile combustion (transportation ofraw materials/products/waste)
• fugitive emissions (mainly HFCemissions in refrigeration and air-conditioning equipment, foamblowing)
• stationarycombustion(import ofelectricity andsteam)
• stationary combustion (production of imported materials,product use, waste combustion)
• mobile combustion (transportation of rawmaterials/products/waste, employee business travel,employee commuting, product use)
• fugitive emissions (CH4 and CO2 from waste landfills, HFCemissions in foam blowing)
Retailing • stationary combustion (production ofelectricity, heat or steam)
• mobile combustion (transportation ofraw materials/products/waste)
• fugitive emissions (mainly HFCemissions during use of refrigerationand air-conditioning equipment)
• stationarycombustion(import ofelectricity andsteam
• stationary combustion (production of imported materials)• process emissions (production of imported materials)• mobile combustion (transportation of raw
materials/products/waste, employee business travel,employee commuting)
Food retailing • mobile combustion (transportation ofraw materials/products/waste)
• fugitive emissions (mainly HFCemissions during use of refrigerationand air-conditioning equipment)
• stationarycombustion(import ofelectricity andsteam)
• stationary combustion (production of imported materials,waste combustion)
• process emissions (production of imported materials)• mobile combustion (transportation of raw
materials/products/waste, employee business travel,employee commuting)
• fugitive emissions (CH4 and CO2 from waste landfills)
Service sector andoffice basedorganizations
• stationary combustion (production ofelectricity, heat or steam)
• mobile combustion (transportation ofraw materials/waste)
• fugitive emissions (mainly HFCemissions during use of refrigerationand air-conditioning equipment)
• stationarycombustion(import ofelectricity andsteam)
• stationary combustion (production of imported materials)• process emissions (production of imported materials)• mobile combustion (transportation of raw
materials/products/waste, employee business travel,employee commuting)
Waste5
HFC, PFC, SF6 and HCFC 22 production7
Other sectors8
1 Scope 3 activities of outsourcing, contract manufacturing and franchises are notaddressed in this table as specific GHG sources depend on the nature of theoutsourced activity.
2 Guidelines on ‘SF6 use’ are to be developed.3 Guidelines on ‘oil and gas sector’ are to be developed. The American Petroleum
Institute has published a compendium of GHG emissions estimation methodologiesfor this industry (API, 2001).
4 The WBCSD project: Toward a Sustainable Cement Industry, has developed guidelinesand tools to calculate GHG emissions from the Cement sector.
5 Waste sector guidelines are under development. 6 Guidelines for pulp and paper sector are under development. 7 Guidelines for HFC, PFC and SF6 production are to be developed.8 Businesses in ‘other sectors’ can calculate GHG emissions using the cross-sectoral
calculation tools – stationary combustion, mobile(transportation) combustion, HFCuse, and waste.
NOTES

Glossary
Accounting Covers the company-internal compilation of GHG data.
Additionality Refers to a situation where a project results in emissions reductions additional to those that
would have taken place in the absence of the project activity (see also Chapter 5:
Accounting for GHG reductions).
Annex 1 countries Defined in the International Climate Change Convention as those countries taking on
emissions reduction obligations: Australia, Austria, Belgium, Bulgaria, Canada, Croatia,
Czech Republic, Denmark, Estonia, Finland, France, Germany, Greece, Hungary, Iceland,
Ireland, Italy, Japan, Latvia, Liechtenstein, Lithuania, Luxembourg, Monaco, Netherlands,
New Zealand, Norway, Poland, Portugal, Romania, Russian Federation, Slovakia, Slovenia,
Spain, Sweden, Switzerland, Ukraine, United Kingdom, USA.
Base year A historic datum (a specific year) for comparing emissions over time (see also Chapter 6:
Setting a historic performance datum).
Base year emissions GHG emissions in the base year (see also Chapter 6: Setting a historic performance datum).
Baseline A reference point for what emissions would have been without the intervention of the GHG
reduction project (see also Chapter 5: Accounting for GHG reductions).
Biofuels Fuels made from plant material, e.g. wood, straw and ethanol from plant matter.
Boundaries GHG accounting and reporting boundaries can have several dimensions, i.e. organizational,
operational, geographic, sectoral, business unit, and other.
Calculation tools A number of cross-sector and sector-specific tools that calculate GHG emissions on the basis
of activity data and emissions factors (available at www.ghgprotocol.org).
Cap and trade system A system that sets an overall emissions limit, allocates emissions allowances to participants,
and allows them to trade emissions credits with each other.
Co-generation unit/combined A facility producing electricity and steam/heat using the waste heat from electricity generation.
heat and power (CHP)
Control The ability of a company to direct the operating policies of another company or
organization (see also Chapter 3: Setting organizational boundaries).
CO2 equivalent The quantity of a given GHG multiplied by its global warming potential. This is the standard
unit for comparing the degree of harm which can be caused by emissions of different
GHGs.
Cross-sector calculation tool A GHG calculation tool that addresses GHG sources common to various sectors, e.g.
emissions from stationary or mobile combustion (see also calculation tools).
Direct GHG emissions Emissions from sources that are owned or controlled by the reporting company (see also
Chapter 4: Setting operational boundaries).
56
Glossary

Direct monitoring Direct monitoring of exhaust stream contents in the form of continuous emissions
monitoring (CEM) or periodic sampling (see also Chapter 8: Managing inventory quality).
Emissions The intentional and unintentional release of GHGs into the atmosphere.
Emissions credit A commodity giving its holder the right to emit a certain quantity of GHGs. Emissions
credits will, in the future, be tradable between countries and other legal entities.
Emissions factor A factor relating activity data (e.g. tonnes of fuel consumed, tonnes of product produced)
and absolute GHG emissions (see also Chapter 7: Identifying and calculating GHG
emissions).
Equity share The percentage of economic interest in/benefit derived from an operation.
Fugitive emissions Intentional and unintentional releases of GHGs from joints, seals, packing, gaskets, etc. (see
also Chapter 7: Identifying and calculating GHG emissions).
GHG accounting principles General accounting principles to underpin GHG accounting and reporting (See also Chapter 1:
GHG accounting and reporting principles).
GHG Protocol Initiative A multi-stakeholder collaboration convened by the World Resources Institute and the
and GHG Protocol World Business Council for Sustainable Development to design, develop and promote the
use of an international standard for calculating and reporting business GHGs.
Global warming potential (GWP) A factor describing the radiative forcing impact (degree of harm to the atmosphere) of one
unit of a given GHG relative to one unit of CO2.
Green power Includes renewable energy sources and specific clean energy technologies that reduce GHG
emissions relative to other sources of energy that supply the electric grid. Includes solar
photovoltaic panels, geothermal energy, landfill gas, and wind turbines.
Greenhouse gases (GHGs) For the purposes of this standard/guidance, GHGs are the six gases listed in the Kyoto
Protocol: carbon dioxide (CO2), methane (CH4), nitrous oxide (N2O), hydroflurocarbons
(HFCs), perfluorocarbons (PFCs), and sulphur hexafluoride (SF6).
Heating value The amount of energy released when a fuel is burned completely. Care must be taken not
to confuse higher heating values (HHVs), used in the US and Canada, and lower heating
values, used in all other countries (for further details refer to the calculation tool for
stationary combustion available at www.ghgprotocol.org).
Indirect GHG emissions Emissions that are a consequence of the activities of the reporting company, but occur from
sources owned or controlled by another company (see also Chapter 4: Setting operational
boundaries).
Intergovernmental Panel International body of climate change scientists. The role of the IPCC is to assess
on Climate Change (IPCC) the scientific, technical and socio-economic information relevant to the understanding of
the risk of human-induced climate change (www.ipcc.ch).
Inventory A list of an organization’s GHG emissions and sources.
57
Glossary

Inventory quality The extent to which an inventory provides accurate information (see also Chapter 8:
Managing inventory quality).
Kyoto Protocol A protocol to the International Convention on Climate Change – once entered into force it
will require countries listed in its Annex B (developed nations) to meet reduction targets of
GHG emissions relative to their 1990 levels during the period 2008-12.
Mobile combustion Burning of fuels by transportation devices such as cars, trucks, trains, aeroplanes, ships etc.
(see also Chapter 7: Identifying and calculating GHG emissions).
Non-Annex 1 countries Defined in the International Convention on Climate Change as those countries not taking
on emissions reduction obligations (see also Annex 1 countries).
Offset An emissions reduction achieved by undertaking a GHG reduction project (see also Chapter 5:
Accounting for GHG reductions).
Organic growth/decline Increases or decreases in GHG emissions as a result of changes in production output,
product mix, plant closures and the opening of new plants (see also Chapter 4: Setting
operational boundaries).
Outsourcing The contracting out of activities to other businesses (see also Chapter 4: Setting operational
boundaries)
Permit A marketable instrument giving its holder the right to emit a certain quantity of GHGs
Process emissions Emissions generated from manufacturing processes, such as cement or ammonia production
(see also Chapter 7: Identifying and calculating GHG emissions)
Project reduction module An additional module of the GHG Protocol covering GHG emissions accounting for GHG
reduction projects. This is work in progress. More information is available at
www.ghgprotocol.org
Ratio indicator Indicators providing information on relative performance, e.g. GHG emissions per
production volume (see also Chapter 9: Reporting GHG emissions).
Renewable energy Energy taken from sources that are inexhaustible, e.g. wind, solar and geothermal energy,
and biofuels.
Reporting Presenting data to internal management and external users such as regulators, shareholders,
the general public or specific stakeholder groups.
Reporting for control An approach for setting organizational boundaries. This requires reporting 100 percent of
GHG emissions from controlled entities/facilities (see also Chapter 3: Setting organizational
boundaries).
Reporting for equity share An approach for setting organizational boundaries. This requires reporting the equity share
equivalent of GHG emissions from entities/facilities under control and significant influence
(see also Chapter 3: Setting operational boundaries).
Scope Defines the operational boundaries in relation to indirect and direct GHG emissions (see also
Chapter 4: Setting operational boundaries).
58
Glossary

Scope 1 inventory A reporting organization’s direct GHG emissions (see also Chapter 4: Setting operational
boundaries).
Scope 2 inventory A reporting organization’s emissions from imports of electricity, heat, or steam (see also
Chapter 4: Setting operational boundaries).
Scope 3 Inventory A reporting organization’s indirect emissions other than those covered in scope 2 (see also
Chapter 4: Setting operational boundaries).
Sector specific calculation tools A GHG calculation tool that addresses GHG sources that are unique to certain sectors, e.g.
process emissions from aluminium production (see also Calculation tools).
Sequestration The uptake and storage of CO2. CO2 can be sequestered by plants and in
underground/deep sea reservoirs.
Significant influence For definition, refer to Chapter 3: Setting organizational boundaries.
Significant threshold A qualitative or quantitative criteria used to define a significant structural change. It is the
responsibility of the company/verifier to determine the ‘significant threshold’ for considering
base year emissions adjustment. In most cases the ‘significant threshold’ depends on the
use of the information, the characteristics of the company, and the features of structural
changes.
Sink Place where carbon is stored, mostly used for forests and underground/deep sea reservoirs
of CO2.
Source Any process or activity, which releases GHGs into the atmosphere.
Stationary combustion Burning of fuels to generate electricity, steam or heat (see also Chapter 7: Identifying and
calculating GHG emissions).
Structural change A significant change in the size or kind of operation of a business (see also Chapter 6:
Setting a historic performance datum).
Uncertainty The likely difference between a reported value and a real value (see also Chapter 8:
Managing inventory quality).
Value chain module An additional module of the GHG Protocol covering GHG emissions accounting for activities
happening upstream and downstream from a business. This is work in progress. More
information available at www.ghgprotocol.org
Verification Verification is the objective and independent assessment of whether the reported GHG
inventory properly reflects the GHG impact of the company in conformance with the pre-
established GHG accounting and reporting standards (see also Chapter 10: Verififcation of
GHG emissions).
59
Glossary

CONTRIBUTORS
Dawn Fenton ABB
Paul-Antoine Lacour AFOCEL
Ron Nielsen Alcan
Steve Pomper Alcan
Kenneth Martchek ALCOA
David Jaber Alliance to Save Energy
Alain Bill Alstom
Walter C. Retzsch American Petroleum Institute
Dale Louda American Portland Cement Alliance
Tom Carter American Portland Cement Alliance
Ted Gullison Anova
John Molburg Argonne National Laboratory
Fiona Gadd Arthur Andersen
Scot Foster Arthur D. Little
Mike Isenberg Arthur D. Little
Chris Loreti Arthur D. Little
Bill Wescott Arthur D. Little
Thomas E. Werkem Atofina Chemicals
David Harrison Australian Greenhouse Office
Linda Powell Australian Greenhouse Office
James Shevlin Australian Greenhouse Office
Bronwyn Pollock Australian Greenhouse Office
Jean-Bernard Carrasco Australian Greenhouse Office
William Work BASF Corporation
Ronald E. Meissen Baxter International
Nick Hughes BP
JoAnna Bullock Business for Social Responsibility
David Cahn California Portland Cement
Molly Tirpak California Climate Action Registry
David Olsen California Climate Action Registry
Alan D. Willis Canadian Institute of CharteredAccountants
Ellina Levina Center for Clean Air Policy
Steve Winkelman Center for Clean Air Policy
Paul Blacklock Calor Gas Limited
Mark Fallon CH2M Hill
Lisa Nelowet CH2M Hill
Charlene R. Garland Clean Air-Cool Planet
Donna Boysen Clean Energy Group
Jennifer DuBose Climate Neutral Network
Sue Hall Climate Neutral Network
Michael Burnett Climate Trust
Elizabeth Arner CO2e.com/Cantor Fitzgerald
Fernando E. Toledo CODELCO
Bruce Steiner Collier Shannon Scott
Lynn Preston Collins & Aikman
Annick Carpentier Confederation of European PaperIndustries
Sonal Pandya Conservation International
Michael Totten Conservation International
Dominick J. Mormile Consolidated Edison Company
Satish Malik CTI Project
Fred Zobrist CTI Project
Ian Lewis Cumming Cockburn Limited
60
List of contributors
ROAD TESTERS
Baxter International
BP
CODELCO
Dow Chemical Canada
Duncans Industries
DuPont Company
Ford Motor Company
Fortum Power and Heat
General Motors Corporation
Hindalco Industries
IBM Corporation
Maihar Cement
Nike
Norsk Hydro
Ontario Power Generation
Petro-Canada
PricewaterhouseCoopers road tested with companies in theEuropean non-ferrous metal sector
Public Service Electric and Gas
Shree Cement
Shell Canada
Suncor Energy
Tokyo Electric Power Company
Volkswagen
World Business Council for Sustainable Development
World Resources Institute
500 PPM – road tested with several small and medium sizedcompanies in Germany
List of contributors

61
List of contributors
Raymond P. Cote Dalhousie University
Markus Lehni Deloitte & Touche Experta
Mr. Tost Deloitte & Touche
Einar Telnes Det Norske Veritas
Philip Comer Det Norske Veritas
Scott Noesen Dow Chemical Company
Paul Cicio Dow Chemical Company
Francesco Balocco Dow Chemical Company
Frank Farfone Dow Chemical Company
Stephen Rose Dow Chemical Company
R. Swarup Duncans Industries
John B. Carberry DuPont Company
David Childs DuPont Company
Tom Jacob DuPont Company
Ed Mongan DuPont Company
Ron Reimer DuPont Company
Fred Whiting DuPont Company
Mack McFarland DuPont Company
Brian Glazebrook Ecobalance
Alan Tate Ecos Corporation
Justin Guest EcoSecurities
Pedro Moura Costa EcoSecurities
Kyle Davis Edison Mission Energy
Marcus Schneider Energy Foundation
Patrick Nollet Entreprises pour l’Environnement
James L. Wolf Envinta
Kenneth Olsen Environment Canada
Adrian Steenkamer Environment Canada
Millie Chu Environmental Defense Fund
Sarah Wade Environmental Defense Fund
Satish Kumar Environmental Energy Technologies
John Cowan Environmental Interface
Alice LeBlanc Environmental Financial Products
Edward W. Repa Environmental Research and EducationFoundation
William B. Weil Environmental Resources Management
Barney Brannen Environmental Resources Trust
Ben Feldman Environmental Resources Trust
Al Daily Environmental Synergy
Anita M. Celdran Environmental Technology Evaluation Center
William E. Kirksey Environmental Technology Evaluation Center
Juerg Fuessler Ernst Basler & Partners
Alan B. Reed EPOTEC
James Bradbury EPOTEC
Stefan Larsson ESAB
Lutz Blank European Bank for Reconstruction andDevelopment
Alke Schmidt European Bank for Reconstruction andDevelopment
Chris Evers European Commission
Urs Brodmann Factor Consulting and Management
Michael Savonis Federal Highway Administration
Anu Karessuo Finnish Forest Industries Federation
Tod Delaney First Environment
James D. Heeren First Environment
James T. Wintergreen First Environment
Kevin Brady Five Winds International
Duncan Noble Five Winds International
Steven Young Five Winds International
Rob Frederick Ford Motor Company
Chad McIntosh Ford Motor Company
Larry Merritt Ford Motor Company
John Sullivan Ford Motor Company
Dan Blomster Fortum Power and Heat
Arto Heikkinen Fortum Power and Heat
Jussi Nykanen Fortum Power and Heat
Steven Hellem GEMI
Judith M. Mullins General Motors Corporation
Terry Pritchett General Motors Corporation
Richard Schneider General Motors Corporation
Robert Stephens General Motors Corporation
Kristin Zimmerman General Motors Corporation
Mark Starik George Washington University
Michael Rumberg Gerling Group of Insurances
Jeffrey C. Frost GHG Spaces
Mr. Imai Global Environment and Energy Group
Joseph Romm Global Environment and TechnologyFoundation
Arthur H Rosenfeld Global Environment and TechnologyFoundation
Richard Tipper Greenergy ECCM
Matthew DeLuca Green Mountain Energy
Ralph Taylor Greenleaf Composting Company
Glenna Ford GreenWare Environmental Systems
Nickolai Denisov GRID-Arendal / Hindalco Industries
Mo Loya Honeywell Allied Signal
Ravi Kuchibhotla IBM Corporation
Edan Dionne IBM Corporation
Thomas A. Cortina ICCP
Paul E. Bailey ICF Consulting
Richard Lee ICF Consulting
Marcia M. Gowen ICF Consulting
Alyssa Tippens Interface Research Corporation
Willy Bjerke International Aluminium Institute
Jerry Marks International Aluminium Institute
Andrei Marcu International Emissions TradingAssociation
George Thomas International Finance Corporation
Akira Tanabe International Finance Corporation
Carl Gagliardi International Paper Company

Danny L. Adams International Paper Company
Thomas C. Jorling International Paper Company
Julie C. Brautigam International Paper Company
Mark E. Bateman Investor Responsibility Research Center
Michael Nesbit JAN Consultants
Chris Hunter Johnson & Johnson
Lisa Gibson KPMG
Chi Mun Woo KPMG
Jed Jones KPMG
Iain Alexander KPMG
David W. Carroll Lafarge Corporation
Ed Vine Lawrence Berkeley National Laboratory
Michael E. Canes Logistics Management Institute
Michael J. Bradley M.J. Bradley & Associates
Brian Jones M.J. Bradley & Associates
Maria Wellisch MWA Consultants
Margriet Kuijper NAM
Sukumar Devotta National Chemical Laboratory
Garth Edward Natsource
Robert Youngman Natsource
Dale S. Bryk Natural Resources Defense Council
Jeff Fiedler Natural Resources Defense Council
Reid A. Miner NCASI
Timothy J. Roskelley NESCAUM
Atulya Dhungana Nexant
Matthew W. Addison Nexant
David H. King Niagara Mohawk Power Corporation
Martin A. Smith Niagara Mohawk Power Corporation
Jim Goddard Nike
Amit Meridor NILIT
Karina Aas Norsk Hydro
Hans Goosens Norsk Hydro
Tore K. Jenssen Norsk Hydro
Halvor Kvande Norsk Hydro
Bernt Malme Norsk Hydro
Lillian Skogen Norsk Hydro
Jon Rytter Hasle Norsk Hydro
Jos van Danne Norsk Hydro
Morton A. Barlaz North Carolina State University
Geir Husdal Novatech
Gard Pedersen Novatech
Anda Kalvins Ontario Power Generation
Jan Corfee-Morlot OECD
Stephane Willems OECD
Ken Humphreys Pacific Northwest National Laboratory
Kathy Scales Petro-Canada
Judi Greenwald Pew Center on Global Climate Change
Daniel L. Chartier PG&E Generating
Orestes R. Anastasia Planning and DevelopmentCollaborative International
David B. Sussman Poubelle Associates
Bill Kyte Powergen UK
Melissa Carrington PricewaterhouseCoopers
Len Eddy PricewaterhouseCoopers
Dennis Jennings PricewaterhouseCoopers
Terje Kronen PricewaterhouseCoopers
Craig McBurnie PricewaterhouseCoopers
Olivier Muller PricewaterhouseCoopers
Dorje Mundle PricewaterhouseCoopers
Thierry Raes PricewaterhouseCoopers
Alain Schilli PricewaterhouseCoopers
Hans Warmenhoven PricewaterhouseCoopers
Pedro Maldonado PRIEN
Alfredo Munoz PRIEN
Mark S. Brownstein PSEG
James Hough PSEG
Samuel Wolfe PSEG
Jennifer Lee Resources for the Future
Alan Steinbeck Rio Tinto
Katie Smith RMC Group
Chris Lotspeich Rocky Mountain Institute
Thomas Ruddy Ruddy Consultants
Julie Doherty Science Applications Intl. Corp.
Richard Y. Richards Science Applications Intl. Corp.
Gareth Phillips SGS Product & Process Cerification
Edwin Aalders SGS Product & Process Cerification
Irma Lubrecht SGS Product & Process Cerification
Antoine de La Rochefordiere SGS Global Trading Solutions
Sean Kollee Shell Canada
Murray G. Jones Shell Canada
Rick Weidel Shell Canada
Anita M. Burke Shell Oil Company
Robert K. Ham Solid & Hazardous Waste Engineering
Jeremy K. O’Brien Solid Waste Association of NorthAmerica
Gwen Parker Stanford University
Philippe Levavasseur STMicroelectronics
Sue Hall Strategic Environmental Associates
Geoffrey Johns Suncor Energy
Christopher Walker Swiss Re
Gregory A. Norris Sylvatica
Vivek Sharma Tata Energy and Research Institute
Robert Graff Tellus Institute
Sivan Kartha Tellus Institute
Allen L. White Tellus Institute
Will Gibson Tetra Tech Em Incorporated
Ranjana Ganguly Tetra Tech India
Ashwani Zutshi Tetra Tech India
Sonal Agrawal Tetra Tech India
62
List of contributors

William C. McLeod Texaco
Arthur Lee Texaco
David W. Cross ThermoRetec Corporation
Mark D. Crowdis Think Energy
Tinus Pulles TNO MEP
Ralph Torrie Torrie Smith Associates
Eugene Smithart Trane Company
Laura Kosloff Trexler & Associates
Mark Trexler Trexler & Associates
Walter Greer Trinity Consultants
Hussein Abaza UNEP
Lambert Kuijpers UNEP
Gary Nakarado UNEP
Mark Radka UNEP
Stelios Pesmajoglou UNFCCC
Alden Meyer Union of Concerned Scientists
Judith Bayer United Technologies Corporation
Fred Keller United Technologies Corporation
Paul Patlis United Technologies Corporation
Ellen J. Quinn United Technologies Corporation
Bill Walters United Technologies Corporation
Gary Bull University of British Colombia
Zoe Harkin University of British Columbia
Gerard Alleng University of Delaware
Jacob Park University of Maryland
Nao Ikemoto U.S. Asia Environmental Partnership
Stephen Calopedis U.S. Department of Energy
Gregory H. Kats U.S. Department of Energy
Dick Richards U.S. Department of Energy
Arthur Rosenfeld U.S. Department of Energy
Arthur Rypinski U.S. Department of Energy
Monisha Shah U.S. Department of Energy
Tatiana Strajnic U.S. Department of Energy
Kenneth Andrasko U.S. EPA
Wiley Barbour U.S. EPA
Lisa H. Chang U.S. EPA
Ed Coe U.S. EPA
Andrea Denny U.S. EPA
Michael Gillenwater U.S. EPA
Reid Harvey U.S. EPA
Kathleen Hogan U.S. EPA
Dina Kruger U.S. EPA
Pam Herman Milmoe U.S. EPA
Roy Huntley U.S. EPA
Bill N. Irving U.S. EPA
Skip Laitner U.S. EPA
Beth Murray U.S. EPA
Heather Tansey U.S. EPA
Susan Thorneloe U.S. EPA
Chloe Weil U.S. EPA
Phil J. Wirdzek U.S. EPA
Tom Wirth U.S. EPA
Marguerite Downey U.S. Postal Service
Angela Crooks USAID
M. Michael Miller U.S. Geological Survey
Valentin V. Tepordei U.S. Geological Survey
Hendrik G. van Oss U.S. Geological Survey
Cyril Coillot Vivendi Environment
Eric Lesueur Vivendi Environment
Michael Dillman Volkswagen
Stephan Herbst Volkswagen
C.F. Schneider Westvaco Corporation
Gary Risner Weyerhauser
Thomas F. Catania Whirlpool Corporation
Eric Olafson Williams Company
Johannes Heister World Bank
Christine Elleboode WBCSD
Margaret Flaherty WBCSD
Al Fry WBCSD
Susanne Haefeli WBCSD
Kija Kummer WBCSD
Markus Ohndorf WBCSD
Kevin Baumert World Resources Institute
Fran Irwin World Resources Institute
Nancy Kete World Resources Institute
Bill LaRocque World Resources Institute
Jim MacKenzie World Resources Institute
Emily Matthews World Resources Institute
Sridevi Nanjundaram World Resources Institute
Jim Perkaus World Resources Institute
Samantha Putt del Pino World Resources Institute
Jason Snyder World Resources Institute
Jennifer Morgan World Wildlife Fund
Ingo Puhl 500 PPM
Monica Galvan
Karan Capoor
Pauline Midgley
WRI and WBCSD would also like to thank the following
organizations for their generous financial support: Energy
Foundation, Spencer T. and Ann W. Olin Foundation, John D.
and Catherine T. MacArthur Foundation, Charles Stewart Mott
Foundation, the US Environmental Protection Agency,
Anglo American, Baxter International, BP, Det Norske Veritas,
DuPont, General Motors, Lafarge, International Paper,
Norsk Hydro, Ontario Power Generation, Petro-Canada,
PowerGen, SGS, Shell, Statoil, STMicroelectronics, Sulzer,
Suncor, Swiss Re, Texaco, The Dow Chemical Company,
Tokyo Electric Power Company, Toyota, TransAlta and
Volkswagen.
63
List of contributors

64
About WRI and WBCSD
About WBCSD
The World Business Council for Sustainable Development
(WBCSD) is a coalition of 150 international companies united
by a shared commitment to sustainable development via the
three pillars of economic growth, environmental protection
and social equity. Our members are drawn from more than 30
countries and 20 major industrial sectors. We also benefit from
a global network of 30 national and regional business councils
and partner organizations involving some 700 business leaders
globally.
About WRI
The World Resources Institute (WRI) is an environmental think
tank that goes beyond research to create practical ways to
protect the Earth and improve people's lives. Inside the WRI,
the GHG Protocol Initiative is managed by the Sustainable
Enterprise Program. For more than a decade, WRI's Sustainable
Enterprise Program has harnessed the power of business to
create profitable solutions to environmental and social
challenges. WRI is the only organization that brings together
four influential forces to accelerate change in business practice
– corporations, entrepreneurs, investors, and business schools.
The Sustainable Enterprise Program improves people's lives
and the environment by helping business leaders and new
markets thrive.
Disclaimer
This report is released in the name of WRI and WBCSD. It is
the product of a collaborative effort, however, this does not
mean that every participating organization or every member
company of the WBCSD agrees with every word.
Copyright © World Business Council for Sustainable
Development and World Resources Institute, September 2001
ISBN 2-940240-18-3
Printed in Switzerland
Ordering publications
WBCSD
WBCSD, c/o E&Y Direct
Tel: (44 1423) 357 904
Fax: (44 1423) 357 900
e-mail: [email protected]
Publications are available at WBCSD’s website:
http://www.wbcsd.org
WRI
Hopkins Fulfillment Service
Tel: (1 410) 516 6956
Fax: (1 410) 516 6998
e-mail: [email protected]
Publications can be ordered from WRI’s secure online store:
http://www.wristore.com


4, chemin de Conches
1231 Conches-Geneva
Switzerland
Tel: (41 22) 839 31 00
Fax: (41 22) 839 31 31
E-mail: [email protected]
Internet: www.wbcsd.org
10 G Street, NE (Suite 800)
Washington, DC 20002
USA
Tel: (1 202) 729 76 00
Fax: (1 202) 729 76 10
E-mail: [email protected]
Internet: www.wri.org
World Resources Institute