The Green Supply Chain - epa.gov · 0 ICCt THE INTERNATIONAL COUNCIL ON CLEAN TRANSPORTATION The...
31
0 ICCt THE INTERNATIONAL COUNCIL ON CLEAN TRANSPORTATION The Green Supply Chain A critical assessment of a multimodal, multinational freight supply chain of a Fortune 50 retailer Cristiano Façanha, PhD SmartWay Freight Matters Webinar Series November 14, 2018
-
Upload
vuongthuan -
Category
Documents
-
view
217 -
download
0
Transcript of The Green Supply Chain - epa.gov · 0 ICCt THE INTERNATIONAL COUNCIL ON CLEAN TRANSPORTATION The...
0
ICCt THE INTERNATIONAL COUNCIL ON CLEAN TRANSPORTATION
The Green Supply ChainA critical assessment of a multimodal, multinational freight supply chain of a Fortune 50 retailer
Cristiano Façanha, PhD
SmartWay Freight Matters Webinar Series November 14, 2018

icct THE INTERNATIONAL COUNCIL ON
Clean Transportation
Presenter
Cristiano Façanha, PhD
Program and regional lead International Council on Clean Transportation
2

icct THE INTERNATIONAL COUNCIL ON
Clean Transportation
Agenda
Background and motivation Project scope Modeling fundamentals Results Next steps
3

icct THE INTERNATIONAL COUNCIL ON
Clean Transportation
The role of freight and Background and supply chain motivation assessment
4

CO2 emissions from freight
30%. __ nfm __ ··· of all transport-related CO, emissions from fuel combustion
icct THE INTERNATIONAL COUNCIL ON
Clean Transportation
.:·_-7% of global CO2 emissions
2108 Mt
1 Freight 2010
8132 Mt
Freight 2050
Freight fuel consumption and GHG emissions are forecasted to grow four-fold through 2050
Source: International Transport Forum 2016
5
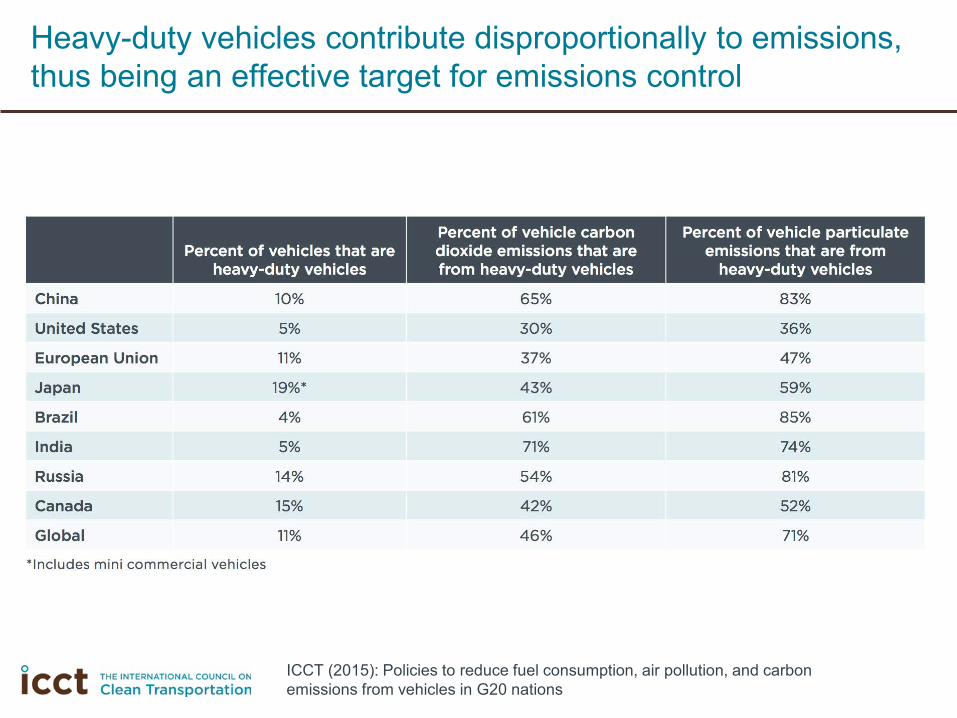
Percent of vehicles that are heavy-duty vehicles
China
United States
European Union
Japan
Brazil
India
Russia
Canada
Global
*Includes mini commercial vehicles
icct THE INTERNATIONAL COUNCIL ON
Clean Transportation
10%
5%
11%
19%*
4%
5%
14%
15%
11%
Percent of vehicle carbon dioxide emissions that are from heavy-duty vehicles
65%
30%
37%
43%
61%
71%
54%
42%
46%
Percent of vehicle particulate emissions that are from
heavy-duty vehicles
83%
36%
47%
59%
85%
74%
81%
52%
71%
Heavy-duty vehicles contribute disproportionally to emissions, thus being an effective target for emissions control
ICCT (2015): Policies to reduce fuel consumption, air pollution, and carbon emissions from vehicles in G20 nations

icct THE INTERNATIONAL COUNCIL ON
Clean Transportation
<<<<4111
What is a supply chain?
A supply chain involves the upstream and downstream flow of products, services, finances, and/or information from a source to a customer. (Mentzer et al., 2001)
Procurement Manufacturing Packaging Warehousing Transportation Retail End of life
7

icct THE INTERNATIONAL COUNCIL ON
Clean Transportation
Green Supply Chain Project scope Study
8

icct THE INTERNATIONAL COUNCIL ON
Clean Transportation
Objectives
Identify and showcase effective technologies and strategies to enhance the energy and environmental performance of global supply chains.
Assess energy consumption and emissions savings from advanced technologies/strategies along a real-world global supply chain.
Give visibility of actions already taken by leading shippers while providing benchmark reference for other companies.
Identify collaboration opportunities for government, industry and other interested stakeholders.
9

0 cct I ~''""" THE INTERNATl~~PORTATION ON CLEAN TRA
icct L COUNCIL ON ATIONA • THE INTERN sportat1on Clean Tran
A group of organizations participated in the conception and development of the study
OTHER STAKEHOLDERS
Port authorities Local environmental
agencies Shipping lines
Trucking companies Logistics providers
ADVISORY GROUP
STEERING COMMITEE
10
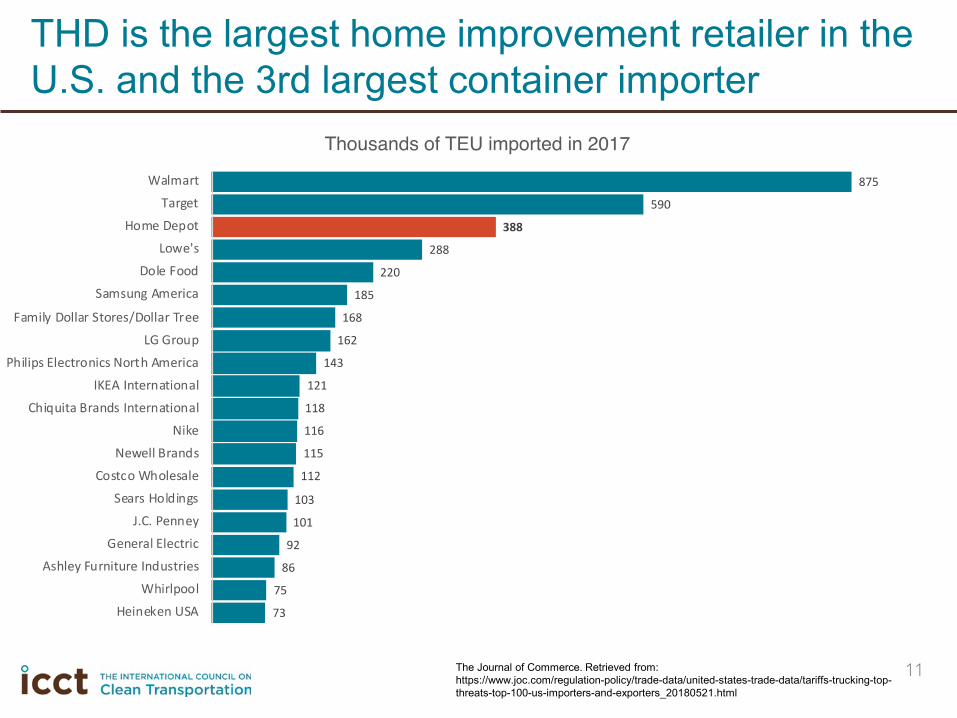
Walmart
Target
Home Depot
Lowe's
Dole Food
Samsung America
Family Dollar Stores/Dollar Tree
LG Group
Philips Electronics North America
IKEA International
Chiquita Brands International
Nike
Newell Brands 115
Costco Wholesale - 112
Sears Holdings - 103
J.C. Penney - 101
General Electric - 92
Ashley Furniture Industries - 86
Whirlpool - 75
Heineken USA - 73
icct THE INTERNATIONAL COUNCIL ON
Clean Transportation
Thousands of TEU imported in 2017
875
THD is the largest home improvement retailer in the U.S. and the 3rd largest container importer
The Journal of Commerce. Retrieved from: https://www.joc.com/regulation-policy/trade-data/united-states-trade-data/tariffs-trucking-top-threats-top-100-us-importers-and-exporters_20180521.html
11

* Asia-North America (EB)
Asia-North Europe (WB)
Asia-North America (WB)
Asia-Mediterranean (WB)
Asia-North Europe (EB)
Total millions of TEU in 2017
North Europe-North America (WB) - 3
Asia-Mediterranean (EB) - 2
North Europe-North America (EB) - 2
Asia-East Coast South America (SB) ■ 1
North Europe/Mediterranean-East Coast South America (SB) I 1
North Europe/Mediterranean-East Coast South America (NB) I 1
icct
North America-East Coast South America (NB) I 1
Asia-East Coast South America (NB) I 1
North America-East Coast South America (SB) I o
THE INTERNATIONAL COUNCIL ON
Clean Transportation
19
* Anlyzed supply chain in this trade route (WB) : West bound (EB): Esat bound (NB) : North bound (SB): South bound
Eastbound trade route from Asia to North America had the largest container traffic in 2017
World Shipping Council. Retrieved from: http://www.worldshipping.org/about-the-industry/global-trade/trade-routes
12

icct
) )
············································································································•►
◄••···········································································································
•··········································································································•►
THE INTERNATIONAL COUNCIL ON
Clean Transportation
<
Although the study boundary is limited to transportation, understanding the supply chain is critical to effectively influence the freight sector
Transportation Transportation
Supplier Producer Customer
Flow of products Flow of cash Flow of information
Basic supply chain: Source components
Transportation a key Make product Policy Target and component of supply
Move product Study chain management Sell product Boundary
13

The analysis evaluates each supply chain link based on real-world data
China
United States
Los Angeles
Shenzhen
1. China drayageProducts shipped from supplier’s factories to Shenzhen/Yantian terminals
2. Marine Containers with products shipped across Pacific Ocean to Los Angeles port
3. U.S. Drayage Containers transported from Los Angeles port to transload facility or closest distribution center
4. U.S. in-land Aggregated products at transload facility sent to distribution centers
5/6. SDC/RDC to Stores Final delivery from distribution centers to stores
icct THE INTERNATIONAL COUNCIL ON
Clean Transportation
-~
840mi
64mi 7456mi 35mi 173mi
14

icct THE INTERNATIONAL COUNCIL ON
Clean Transportation
The analysis considers three scenarios to evaluate emission reduction strategies Conventional Scenario: Basic supply chain without strategies
considered in the green scenario, instead those strategies are replaced by basic technology and operational practices.
Green Scenario: Current supply chain considering improvements already adopted (green strategies).
Green Plus Scenario: Future supply chain with additional improvements to those already implemented in the green scenario. To consider implementation timeframe, we divide this scenario into: Short-term (2020) Medium-term (2025) Long-term (2030)
15

icct THE INTERNATIONAL COUNCIL ON
Clean Transportation
Data, scenarios, Modeling strategies and fundamentals modeling approach
16

---+ ---+ ---+
icct THE INTERNATIONAL COUNCIL ON
Clean Transportation
We first developed a detailed model of the considered supply chain…
Factory 1
Factory 2
CFS
TransLoad
Rapid Deployment
Stock Distribution 1
Stock Distribution 2
Shekou Port Terminal
Yantian Port Terminal
LA Port Terminal
Road transportation
Railway
Sea Shipping
17

P:a ,,.-----..
---+ ■
icct THE INTERNATIONAL COUNCIL ON
Clean Transportation
… and parametrized it based on a network of links and nodes
Node 1
Node 2
Node 3
L1
L4
L2
L5
L6
L3
Node 5
Node 6
Node 7
Node 8
Node 4 L7
L8
Transportation Links
Nodes
18

icct THE INTERNATIONAL COUNCIL ON
Clean Transportation
We used detailed 2017 data on purchase orders from three suppliers
Purchase Order (PO)
Number
Item 1 (42’’ ceiling fan) • Quantity • Volume • Weight • Factory of origin • Port terminal of origin • Port terminal of destination • Inbound/Outbound Distribution center • Final store destination • Size of container • Marine vessel • Trucking carrier • …
Item 2 (50’’ ceiling fan)
Item 3 (60’’ ceiling fan)
19

I icct THE INTERNATIONAL COUNCIL ON
Clean Transportation
Basic modeling approach: aggregate PO data into shipments and characterize that shipment
PO CO2, NOx, PM, BC, SO2
Calculate this for all shipments
Distribution Store Center (Destination) (Origin) Specific carriers performance (U.S. EPA SmartWay Data)
Distance traveled
Freight of analyzed suppliers Total freight
20
icct THE INTERNATIONAL COUNCIL ON
Clean Transportation
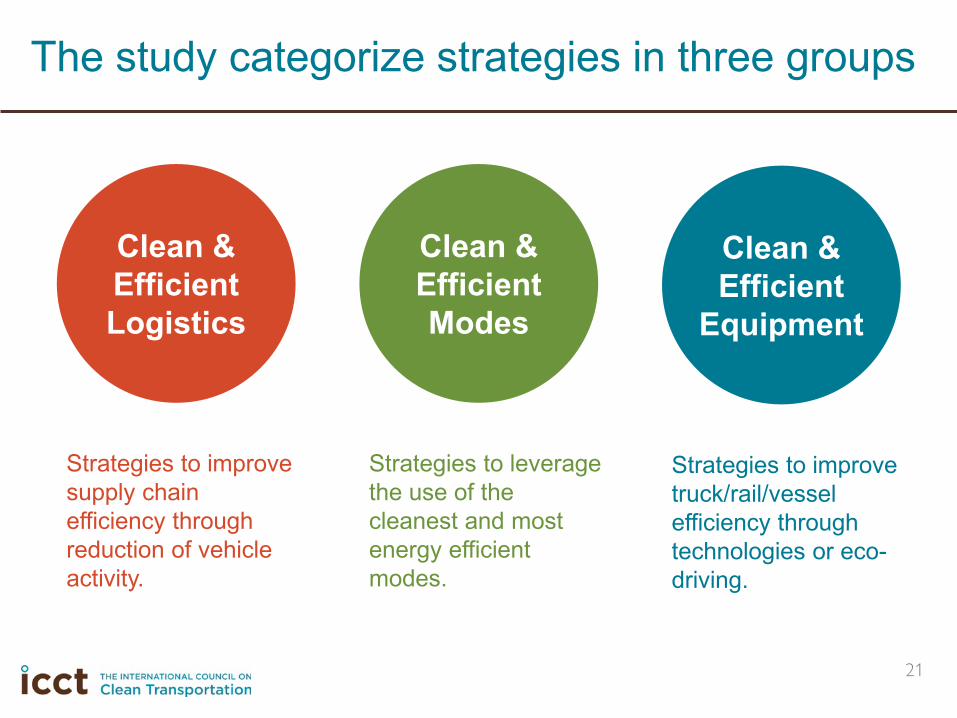
The study categorize strategies in three groups
Clean & Efficient Logistics
Clean & Efficient Modes
Clean & Efficient
Equipment
Strategies to improve supply chain efficiency through reduction of vehicle activity.
Strategies to leverage the use of the cleanest and most energy efficient modes.
Strategies to improve truck/rail/vessel efficiency through technologies or eco-driving.
21

• •
icct THE INTERNATIONAL COUNCIL ON
Clean Transportation
•• ••
• • •• •• • •
• • ••
• • • •
We evaluated a number of strategies applied to specific segments under different scenarios
Strategy Type Strategy Supply chain Link
China drayage Marine US drayage US inland SDC to Store RDC to Store
Clean and efficient logistics
Cargo consolidation (Consolidated Freight Station) Cube optimization
Transloading (network reconfiguration)
Floor loading
Direct routing + Short sea shipping
Schedule optimization (port and ship)
Clean and efficient modes
Truck to rail
Transloading (container switch)
Move to larger ships (Tripple E etc. )
Clean and efficient
equipment
Shore power
Slow steaming
Vessel technology
Vessel operations
Truck technology
Truck electrification
Rail technology
Driver training
Strategy applied to Green scenario Strategy applied to Green plus scenario
22

icct THE INTERNATIONAL COUNCIL ON
Clean Transportation
Results
23
180
160
140
120
100
80
60
40
20
0
icct
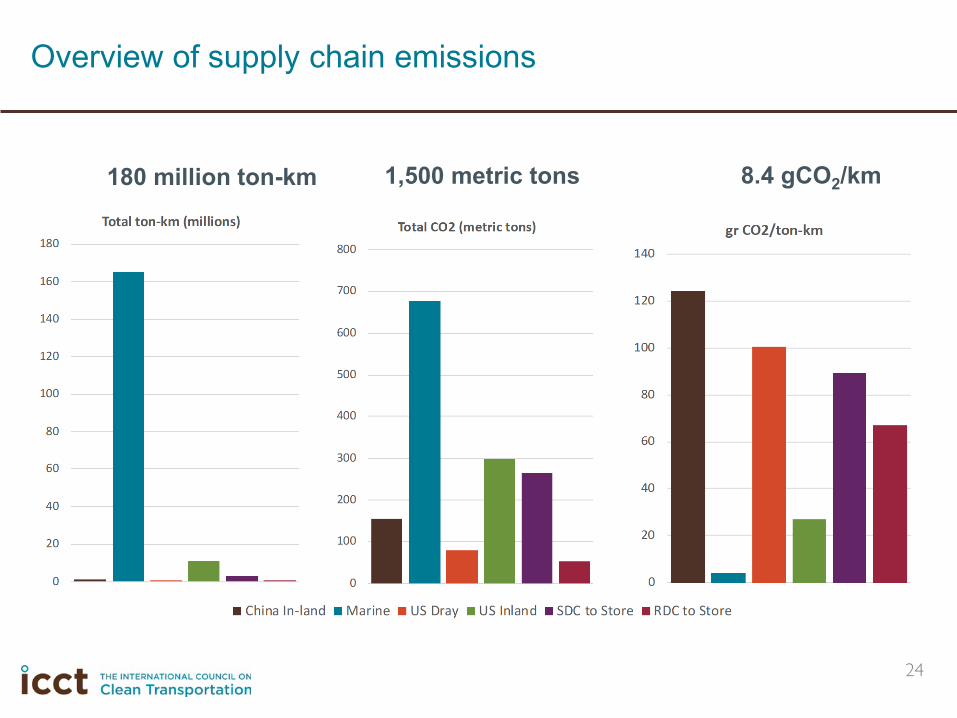
Total ton-km (millions)
----■ China In-land
THE INTERNATIONAL COUNCIL ON
Clean Transportation
Total CO2 (metric tons)
800
700
600
500
400
300
200
100
0
■ Marine ■ US Dray ■ US Inland
gr CO2/ton-km
140
120
100
80
60
40
20
• 0 -■ SDC to Store ■ RDC to Store
Overview of supply chain emissions
180 million ton-km 1,500 metric tons 8.4 gCO2/km
24

3,000
2,500
2,000
en C .9 u
j 1,500 C\J 0 (.)
1,000
500
0
icct
Conventional
Emissions scenario
THE INTERNATIONAL COUNCIL ON
Clean Transportation
Green Short-term Medium-term Long-term
Green Plus
■ Savings - Clean Equipment ■ Savings - Clean Mode ■ Savings - Clean Logistics
Current available technologies and strategies reduced CO2 emissions by almost 30% with respect to the conventional supply chain. Adopting advanced strategies can further reduce CO2 by roughly 35%.
Total CO2 emissions by scenario
25

70%
60%
50%
40%
30%
20%
10%
0% Green
■ CFS ■ Cube opt Floor loading
icct THE INTERNATIONAL COUNCIL ON
Clean Transportation
TSLD TSLD ■ Shift to rail ■ Rail tech ■ Driver training ■ Truck tech Truck ZE
For land-based segments, adopting logistic and mode shift strategies have shown reductions as large as vehicle technology improvements
Land-based CO2 savings by strategy
Clean Equipment
Clean Modes
Clean Logistics
26

70%
60%
50%
40%
30%
20%
10%
0% Green
■ CFS ■ Cube opt Floor loading
icct THE INTERNATIONAL COUNCIL ON
Clean Transportation
Green+ Short-Term Green+ Medium-Term Green+ Long-Term
TSLD TSLD ■ Shift to rail ■ Rail tech ■ Driver training ■ Truck tech Truck ZE
Most certain path to reduce emissions further is to promote vehicle technology not only on ICE trucks, but also zero-emission trucks and low-carbon rail technologies
Land-based CO2 savings by strategy
Clean Equipment
Clean Modes
Clean Logistics
27

60%
50%
40%
30%
20%
10%
0%
icct
Green
Shore power
THE INTERNATIONAL COUNCIL ON
Clean Transportation
Green+ Short-Term Green+ Medium-Term Green+ Long-Term
■ Ship improvements ■ Ship size ■ Ship scheduling
Given long distances traveled by marine vessels, technology and ship size provide the largest opportunities for supply chain decarbonization
Marine CO2 savings by strategy
28

icct THE INTERNATIONAL COUNCIL ON
Clean Transportation
Insights on health-related results
Study evaluated supply chain emissions of NOx, PM, black carbon, and SO2.
Marine emissions account for the lion’s share of local air pollutant supply chain emissions.
Technology plays an important role in the reduction of local air pollutants. For marine, technology strategies in the Green scenario have
reduced air pollutants by over 20%. Future technologies could reduce air pollution by over 50% from current levels.
For land-based links, cleaner vehicles reduced local air pollutants by over half. Moving towards soot-free HDVs and cleaner locomotives will virtually eliminate these emissions.
29

icct THE INTERNATIONAL COUNCIL ON
Clean Transportation
Next steps
Review process Publication and outreach Future research Well-to-wheels emissions Follow-up on key strategies to develop cost-benefit
analysis Expand the future analysis to include more complex
solutions (mode and logistics) Evaluate other industries and trade routes
30

icct THE INTERNATIONAL COUNCIL ON
Clean Transportation
Thank you!
Cristiano Façanha [email protected]
www.theicct.org
31