The Greek Debt Exchange: An Autopsy - Duke University
65
1 The Greek Debt Restructuring: An Autopsy Jeromin Zettelmeyer Christoph Trebesch Mitu Gulati * July 2013 Abstract The Greek debt restructuring of 2012 stands out in the history of sovereign defaults. It achieved very large debt relief – over 50 per cent of 2012 GDP – with minimal financial disruption, using a combination of new legal techniques, exceptionally large cash incentives, and official sector pressure on key creditors. But it did so at a cost. The timing and design of the restructuring left money on the table from the perspective of Greece, created a large risk for European taxpayers, and set precedents – particularly in its very generous treatment of holdout creditors – that are likely to make future debt restructurings in Europe more difficult. * EBRD, Peterson Institute for International Economics and CEPR, University of Munich and CESifo, and Duke University, respectively. We are grateful to Charlie Blitzer, Marcos Chamon, Stijn Claessens, Bill Cline, Juan Cruces, Henrik Enderlein, Anna Gelpern, Lorenzo Giorgianni, Féderic Holm-Hadullah, Christian Kopf, Sergi Lanau, Philip Lane, James Roaf, Julian Schumacher, Shahin Vallee, Mark Weidemaier, two anonymous referees, as well as seminar participants at London Business School, the ECB, the Peterson Institute for International Economics and the IMF for comments and conversations about the topic. Keegan Drake, Marina Kaloumenou, Yevgeniya Korniyenko and Tori Simmons provided excellent research assistance. The views expressed in this paper are those of the authors and should not be attributed to EBRD or any other institution.
Transcript of The Greek Debt Exchange: An Autopsy - Duke University

1
The Greek Debt Restructuring: An Autopsy
Jeromin Zettelmeyer
Christoph Trebesch
Mitu Gulati*
July 2013
Abstract
The Greek debt restructuring of 2012 stands out in the history of sovereign
defaults. It achieved very large debt relief – over 50 per cent of 2012 GDP –
with minimal financial disruption, using a combination of new legal techniques,
exceptionally large cash incentives, and official sector pressure on key creditors.
But it did so at a cost. The timing and design of the restructuring left money on
the table from the perspective of Greece, created a large risk for European
taxpayers, and set precedents – particularly in its very generous treatment of
holdout creditors – that are likely to make future debt restructurings in Europe
more difficult.
*EBRD, Peterson Institute for International Economics and CEPR, University of Munich and CESifo, and
Duke University, respectively. We are grateful to Charlie Blitzer, Marcos Chamon, Stijn Claessens, Bill
Cline, Juan Cruces, Henrik Enderlein, Anna Gelpern, Lorenzo Giorgianni, Féderic Holm-Hadullah,
Christian Kopf, Sergi Lanau, Philip Lane, James Roaf, Julian Schumacher, Shahin Vallee, Mark
Weidemaier, two anonymous referees, as well as seminar participants at London Business School, the
ECB, the Peterson Institute for International Economics and the IMF for comments and conversations
about the topic. Keegan Drake, Marina Kaloumenou, Yevgeniya Korniyenko and Tori Simmons provided
excellent research assistance. The views expressed in this paper are those of the authors and should not be
attributed to EBRD or any other institution.

2
1. Introduction
This paper studies a central episode of the European debt crisis: the restructuring and
near-elimination of Greece’s sovereign bonds held by private investors, comprising a
face value of more than 100 per cent of Greek GDP. After a €200 billion debt exchange
in March/April 2012 and a buyback of a large portion of the newly exchanged sovereign
bonds in December, the amount of Greek bonds in the hands of private creditors was
down to just €35 billion – just 13 per cent of where it had stood in April 2010, when
Greece lost access to capital markets.
The Greek debt exchange can claim historic significance in more than one respect. It set
a new world record in terms of restructured debt volume and aggregate creditor losses,
easily surpassing previous high water marks such as the default and restructuring of
Argentina 2001-2005. It was the first major debt restructuring in Europe since the
defaults preceding World War II1 – defying statements by European policy makers,
issued only months earlier, who had claimed that sovereign defaults were unthinkable
for EU countries. It also was a watershed event in the history of the European crisis,
plausibly contributing both to its expansion in the summer of 2011 and to its eventual
resolution (as we will argue in this paper). Finally, it occupies a special place in the
history of sovereign debt crises – along with the Brady deals, for example, and with the
2000 Ecuador restructuring – by introducing a set of legal innovations which helped to
engineer an orderly debt exchange, overcoming the collective action problem facing
Greek and EU policy makers as they sought to restructure a large amount debt dispersed
among many private creditors.2
The present paper gives an account of the background, mechanics, and outcomes of the
Greek debt restructuring. Beyond the basic historical narrative, we focus on three sets of
questions.
First, what were the distributional implications of the restructuring – both the main
exchange, and the end-2012 debt buyback? We answer this question by computing the
impact of the restructuring on the present value of expected cash flows both in the
aggregate and bond-by-bond. The results confirm that the exchange resulted in a vast
transfer from private creditors to Greece, in the order of €100 billion in present value
terms; corresponding to 50 per cent of 2012 GDP (this is net of the costs of
recapitalising Greek banks to offset losses incurred through the restructuring). But we
also show that the “haircuts” suffered by creditors on average were considerably lower
than the 75 per cent widely reported in the financial press at the time of the debt
exchange, namely, in the order of 59-65 per cent, depending on which methodology is
applied. Furthermore, these losses were not equally distributed across creditors, with
much higher present value losses on bonds maturing within a year (75 per cent or more),
and much lower losses on bonds maturing after 2025 (less than 50 per cent). Finally, we
show that the buyback of December 2012 did result in some debt relief for Greece,
1 Germany restructured its pre-war debt in 1953, but it had defaulted more than a decade earlier. 2 For details on these episodes, see Cline (1995, on the Brady deals) and Sturzenegger and Zettelmeyer (2007, on
Ecuador and other emerging market restructurings after the Brady deals). Reinhart and Rogoff (2009) and Cruces
and Trebesch (2013) provide broader historical perspectives.

3
despite the significant rise in bond market prices after its announcement. However, the
debt relief effects was small both due to the voluntary approach that was chosen and the
small scale of the operation.
Second, how was the free rider problem addressed, i.e. the incentive of each creditor not
to participate while hoping that all other bondholders accept? An important part of the
answer is that most Greek bonds were held by banks and other institutional investors
which were susceptible to pressure by their regulators and governments. They also faced
peer pressure via the Greek creditor committee, which resembled the “London Club”
process of the 1980s. However, large banks and regulated institutions accounted for no
more than 60 per cent of outstanding principal, while the final participation rate was 97
per cent. To bail in the remaining creditors, Greece relied on a mix of carrots and sticks
embedded in the exchange offer itself. The main stick was a change in domestic law
which made the offer compulsory for all holders of local-law bonds subject to approval
by creditors holding two-thirds of outstanding principal. The main carrot was an
unusually high cash pay-out: creditors received more than 15 per cent of the value of
their old bonds in cash-like short-term EFSF bonds. A further carrot consisted of legal
and contractual terms that gave the new bonds a better chance of surviving future Greek
debt crises than the old ones. Ironically, these “carrots” may have turned out to be
particularly appealing because market commentary thought it unlikely that Greece’s
proposed debt restructuring, even if it succeeded, would be the last one. In this situation,
many potential holdouts opted for the bird in hand rather than the two in the bush.
Third, we assess the restructuring and its implications for the management of future
European debt crises. Was the restructuring necessary and could it have been handled
better? Does it provide a template for any future European sovereign debt restructuring?
The flavour of our answers is mixed. On the one hand, the restructuring was both
unavoidable and successful in achieving deep debt relief relatively swiftly and in an
orderly manner – no small feat. On the other hand, its timing, execution and design left
money on the table from the perspective of Greece, created a large risk for European
taxpayers, and set precedents – particularly in its very generous treatment of holdouts –
that are likely to make future debt restructurings in Europe more difficult. Partly as a
result, it will be hard to repeat a Greek-style restructuring elsewhere in Europe should
the need arise. This calls for a more systematic approach to future debt restructurings,
which could be achieved through an ESM treaty change.
The paper has important limitations. It is essentially a case study. Although it provides
context, it focuses on the Greek debt restructuring rather than giving a fuller account of
the Greek or European debt crisis. In particular, it analyses neither the causes of the
crisis nor its management except as relates to the restructuring. And while it touches on
some of the big questions surrounding sovereign debt crises – including when countries
should restructure their debts and how debt restructurings can be efficiently managed –
we need to refer the reader to the broader literature for complete answers.3
3 For recent surveys of the literature see Panizza et al. (2009), Wright (2011), Das et al. (2012), Tomz and Wright
(2013) and Aguiar and Amador (forthcoming). On the origins the European sovereign debt crisis see Lane (2012).

4
The paper is for the most part organised chronologically. In the section that follows, we
describe the background to the 2012 restructuring: The May 2010 EU/IMF programme
with Greece, and the July 2011 decision to restructure in principle (euphemistically
referred to as “private sector involvement,” or PSI). We also briefly analyse the
implications of the restructuring proposal agreed by Greece and the IIF at that time. We
then turn to the main act of the Greek restructuring: the March-April 2012 debt
exchange, which is the main focus of this paper. Next, we analyse the last act (for now),
the December 2012 bond buyback. We conclude with an assessment of the Greek
restructuring and its implications for on-going and future debt crises in Europe.
2. From the 2010 Bailout to the July 2011 PSI Proposal
The Greek debt crisis began in October 2009, when the newly elected government of
George Papandreou revealed that the country had understated its debt and deficit figures
for years. The projected budget deficit for 2009, in particular, was revised upwards from
an estimated 7 per cent to more than 12 per cent (it eventually ended up at 15.6 per
cent). This set the stage for months of further bad economic news, which eroded market
confidence in Greece and its debt sustainability and resulted in a number of rating
downgrades, first by Fitch, then by S&P and Moody’s. As the situation continued to
deteriorate, Greek sovereign bond yields continued to rise, until spreads over German
bunds shot up from 300 to almost 900 basis points during April, effectively excluding
Greece from access to bond markets. Faced with an imminent rollover crisis, the Greek
government had no choice but to turn to Eurozone governments and the IMF.
Despite initial German resistance, a three-year rescue package was agreed on May 2nd
2010. It amounted to €80 billion in EU loans and a further €30 billion of IMF credit, and
was to be paid out in tranches until 2012, conditional on the implementation of a fiscal
adjustment package of 11 percentage points of GDP over three years, and structural
reforms meant to restore competitiveness and growth. One week later, Eurozone leaders
agreed on further rescue measures, particularly the creation of the European Financial
Stability Facility (EFSF) with a lending capacity of €440 billion for troubled sovereigns,
and the ECB’s “secondary market purchase programme” (SMP) to stabilise sovereign
bond yields in secondary markets. Initially, markets rallied, spreads fell sharply.
However, market scepticism soon returned, particularly after Moody’s downgraded
Greece in mid-June, citing substantial macroeconomic and implementation risks
associated with the Eurozone/IMF support package.4 By July, spreads again began to
exceed 800 basis points.
In October of 2010, the debt crisis in Europe reached a watershed at the trilateral
Franco-German-Russian Summit in Deauville, when President Sarkozy and Chancellor
Merkel called for a permanent crisis resolution mechanism in Europe “comprising the
necessary arrangements for an adequate participation of the private sector”. Although it
referred not to the handling of the on-going European crisis but to a European crisis
4 See “Moody's downgrades Greece to Ba1 from A3”, Global Credit Research, 14 Jun 2010.
http://www.moodys.com/research/Moodys-downgrades-Greece-to-Ba1-from-A3-stable-outlook--PR_200910

5
resolution framework that was to replace the EFSF in 2013, the “Deauville statement”
was widely interpreted as an official signal that sovereign debt restructuring would
henceforth be acceptable in European Union countries. The result was a sharp widening
of the bond spreads of peripheral European countries. In this setting, the prospects of a
quick return of Greece to international capital markets by early 2012 – as envisaged in
the May programme – looked increasingly unlikely.
Notwithstanding market scepticism, Greece’s programme achieved significant fiscal
consolidation during 2010 (about 5 per cent of GDP). In light of a deepening recession
and growing domestic opposition to the programme, however, fiscal adjustment became
stuck in the first half 2011, at a time when the overall and primary deficits were still in
the order of 10 and 5 percentage points, respectively, sovereign debt stood at over 140
per cent of GDP, and output was expected to continue to decline at a rate of 3-4 per cent
for the next two years. Most worryingly, structural reforms that were supposed to restore
growth in the medium term were delayed, and reform implementation was weak. An
IMF review ending on June 2, 2011 and published in mid-July concluded that Greece’s
outlook “does not allow the staff to deem debt to be sustainable with high probability”,
and all but ruled out a return to capital markets until the end of the programme period in
mid-2013. Unless the official sector was prepared to offer additional financing in the
order of €70-104 billion (depending on the timing of the assumed return to capital
markets), some form of “private sector involvement” (PSI) was unavoidable, even if one
took a benign view of Greece’s debt sustainability.5
On June 6th, 2011, German Finance Minister Wolfgang Schäuble wrote a letter to the
ECB and IMF proposing “to initiate the process of involving holders of Greek bonds …
through a bond swap leading to a prolongation of the outstanding Greek sovereign bonds
by seven years.”6 Shortly afterwards, a group of major French banks issued the first
detailed proposal on how a Greek bond rescheduling might look like (Kopf, 2011). The
French proposal already contained many of the elements that would ultimately be part of
the March 2012 exchange, namely a large upfront cash payment, a 30-year lengthening
of maturities, and a new GDP-linked security as sweetener. Importantly, however, it
only targeted bonds maturing in 2011-14, and it did not foresee any nominal debt
reduction (face value haircut). From the perspective of the German government, this
proposal was not sufficient, and talks about the form of PSI went on until the
extraordinary EU summit on July 21, 2011.7
Immediately after the summit, Euro area heads of government and the Institute of
International Finance (IIF) – representing major banks and other institutional investors
holding Greek bonds – each issued statements that together amounted to a new financing
proposal for Greece, consisting of an official sector commitment and a private sector
“offer”:
5 IMF Country Report No. 11/175. 6 See http://www.piie.com/blogs/realtime/?p=2203 7 See Financial Times, July 6, 2011, “Schäuble presses case for bond swap.” http://www.ft.com/cms/s/0/f2d96d3a-
a7de-11e0-a312-00144feabdc0.html

6
First, the official sector (EU and IMF together) promised financing in the amount of
€109 billion. Since only about €65 billion of the original €110 billion May 2010 package
had been disbursed up to that point, this amounted to additional official financing of €64
billion over and above the original commitment. The EU portion of the new financing
was to be delivered through EFSF loans with longer maturities – between 15 and 30
years – and lower interest rates than the loans disbursed so far. A maturity extension for
the bilateral EU loans that had already been disbursed was also promised.
Second, 39 financial institutions (both international and Greek) expressed their
willingness “to participate in a voluntary program of debt exchange.” Creditors would
have a choice between four options: a 30 year “par bond” with no face value reduction
paying slightly lower coupons than typical for Greece’s debt stock (namely, 4 per cent in
the first 5 years, 4.5 in the next five years, and 5 per cent thereafter); a 30 year “discount
bond” with a 20 per cent face value reduction but slightly higher coupon rates (6, 6.5
and 6.8 per cent, respectively); and a 15 year discount bond with a 20 per cent face value
reduction and 5.9 per cent coupon. The fourth option was to receive the par bond not
immediately but in lieu of cash repayment at the time the time of maturity of the bond
held by the creditor. Importantly, following a structure popularised in the Brady deals of
the early 1990s, the principal of the 30 year bonds were to be fully collateralised using
zero coupon bonds purchased by Greece from the EFSF and held in an escrow account.
For the 15 year bond, the collateral would cover collateralisation up to 80 per cent of
any loss on principal, up to a maximum of 40 per cent of new principal.
Assuming a 90 per cent participation rate among privately held bonds maturing between
August of 2011 and July of 2020 (the bonds to be targeted in the exchange, as
subsequently clarified by the Greek Ministry of Finance), this amounted to private
financing of about €135 billion in total, about €54 billion of which corresponded to the
period between mid-2011 and mid-2014.8 Hence, under the July 2011 proposal, the
official and private sector together would have lent Greece an extra €118 billion at low
interest rates between 2011 and 2014. This exceeded the €70 billion financing gap
calculated by the IMF in its July report by €38 billion corresponding to the collateral
that the official sector was offering to lend to Greece in order to persuade the private
sector to chip in its contribution. Hence, an extra €38 billion of official sector lending
“bought” €54 billion of private sector financing through 2011-14, as well as postponing
the repayment of principal falling due between 2014 and 2020, hence giving Greece and
its official creditors some leeway in case it remained shut off from capital market after
the programme period.
From a financing perspective, the July 2011 proposal hence implied a significant
contribution from the private sector. But did it also imply debt relief? The IIF claimed so
8 These numbers come from the IIF’s July 21 press release, but can also be approximately derived by taking Greece’s
bond amortisations (€203 billion between mid-2011 and 2020 and €89 billion between mid-2011 and mid-2014),
excluding holdings by the ECB and other central banks (about €53 billion for bonds maturing during 2012-2020 and
€26 billion during 2012-2014) and multiplying the result with 0.9. The ECB’s holdings were not publicly known in
July 2011, but became public in February 2012 for all Greek bonds maturing after January of 2012. Small
discrepancies between the derived amounts and those stated by the IIF could be explained by ECB holdings of
bonds maturing in the second half of 2011.

7
in its July press release, which stated that the debt exchange implied a 21 per cent Net
Present Value (NPV) loss for investors, based on an assumed discount rate of 9 per cent
(reflecting a guess as to what the yield of the new bonds might be following a successful
exchange). However, there are several reasons to be sceptical of this claim.
First, the IIF’s was referring to the fact that the value of the new instruments, applying a
9 per cent discount rate on the risky portion of their cash flows (together with a lower
interest rate on the collateralised portion) amounted to 79 cents per Euro of old
principal. Hence, investors opting for the new bonds would have suffered a loss of 21
cents on the Euro compared to the alternative of receiving full and immediate repayment
of their old bonds. This approach to computing creditor losses reflects widespread
market convention, and makes sense in some settings (when either the outstanding
bonds are of very short maturity; or when bonds are “accelerated”, i.e. become due and
payable immediately). But it is not suitable when creditors hold bonds of longer
maturity and if they do not have the right to immediate full repayment. In such a
situation, the value of the new bonds should be compared not to 100 per cent of face
value of the the old bonds, but rather to the present value of their promised payment
stream, evaluated at the same discount rate as the new bonds (see next section and
Sturzenegger and Zettelmeyer, 2008, for details). Using the IIF’s 9 per cent discount
rate, this implies much smaller creditor losses, namely, just 11.5 per cent (see Table 1).9
Second, for the purpose of computing Greece’s debt relief (as opposed to creditor
losses), it is doubtful whether 9 per cent was in fact the appropriate discount rate.
Sturzenegger and Zettelmeyer (2007b) argue that if the country is expected to return to
capital markets over the medium term, the discount rate for the purposes of computing
debt relief should be somewhere between the country’s future expected borrowing rate
and the international risk free rate, because the country will be using rates in this interval
to transfer revenues across time (saving at the international risk-free rate, or borrowing
against future revenues at a market rate).10
One rate which was surely within this interval
from the perspective of mid-2011 was the 5 per cent discount rate used by the IMF in its
debt sustainability calculations (since “risk free” German bonds yielded around 3 - 3.5
per cent in July 2011, and on the assumption of a future Greek borrowing spread at least
200 basis points after re-entering capital markets). Using this 5 per cent discount rate to
compare old and proposed new debt flows, the debt relief implied by the July 2011
financing offer would have been approximately zero – indeed, slightly negative. Using
the “risk free” discount rate of about 3.5 per cent (not shown in the table), would
indicate an increase of Greece’s debt burden by about 11-15 per cent the July 2011.
9 This point – that creditor losses implicit in the IIF’s financing offer were very small when properly computed -- was
made by several academics and analysts soon after the deal was announced; see Cabral (2011) and Ghezzi, Aksu,
and Garcia Pascual (2011). See also Kopf (2011) for a similar point about the June 2011 “French proposal”,
Ardagna and Caselli (2012) for a broader critique of the July 2011 deal, and Porzecanski (2013) for a description of
the run-up and aftermath of the July deal. 10 Since the 9 per cent rate was supposed to reflect the expectation secondary market yield on Greek bonds following a
successful exchange, this implies that Greece’s borrowing rate in “normal times” – following a successful re-
entering of capital markets – was less than 9 per cent in July 2011. Note that if Greece was not expected to re-access
capital markets at all, in the foreseeable future, either a higher discount rate would appropriate (see Dias, Richmond
and Wright (2012) or – on the assumption that Greece maintains access to EFSF lending – the EFSF rate. See debt
relief calculations in Section 3 below.

8
Table 1. Creditor Losses Implicit in July 2011 IIF Financing Offer
Assuming creditors had chosen ….
30 year Par bond, using
discount rate of ... 1/
30 year Discount bond,
using discount rate of 1/
5.0 9.0 15.0 5.0 9.0 15.0
Value of new securities received (PVnew) 103.6 79.0 61.4 106.3 79.0 59.4
Haircut in market convention (100-PVnew) -3.6 21.0 38.6
-6.3 21.0 40.6
Value of old bonds (PVold) 2/
101.3 89.3 75.6 101.3 89.3 75.6
Present value haircut (100*(1-PVnew/PVold) -2.3 11.5 18.7
-4.9 11.5 21.4
Note: In per cent of outstanding principal.
1/ Refers to discount rate applied to coupons. Collateralised principal discounted at 3.787% which was calibrated
to achieve an NPV of the new par bond of exactly 79% assuming a 9% discount rate for the coupons.
2/ Average value of non-ECB bond holdings
Sources: Hellenic Republic (Ministry of Finance), IIF, authors’ calculations
In the event, the July 2011 financing offer was never implemented. The deepening
recession in Greece and the difficulties of the EU and IMF to agree on a credible
package of structural reforms with the Greek government lowered expectations of the
growth path that Greece might realistically achieve and exacerbated worries about its
debt servicing capacity. These worries were reflected in sharply rising secondary yields,
making it much less likely that the largely voluntary debt exchange envisaged in July
would succeed – not just in the sense of restoring Greece’s solvency over the medium
term, but even in the more pedestrian sense of attracting high participation.11
On
October 9, 2011, German finance minister Wolfgang Schäuble, was quoted in
Frankfurter Allgemeine as saying “the debt reduction we aimed at in July may have been
too low”. This view was corroborated by a new IMF analysis prepared for the October
26 Euro summit in Brussels, which concluded that Greece’s debt was no longer
sustainable except “with much stronger PSI”.12
3. The March-April 2012 Bond Exchange
The Euro Summit statement of October 26th, 2011 invited “Greece, private investors and
all parties concerned to develop a voluntary bond exchange with a nominal discount of
50% on notional Greek debt held by private investors” and pledged to “contribute to the
PSI package up to 30 billion euro” as well as additional lending to help with the
11 Greek 10 year benchmark yields started rising sharply from mid-August onwards, stabilising at around 23 per cent
in mid-September – over 8 percentage points above their end-July levels. In these circumstances, the prospect of a
relatively low 9 per cent “exit yield” following the debt exchange envisaged in July seemed increasingly remote. If
a higher exit yield of 15 per cent is assumed (in line with market conditions in October), investors would have
suffered a significantly higher haircut under the terms of the July proposal (see Table 1). 12 Debt sustainability analysis dated October 21, 2011, available at
http://www.linkiesta.it/sites/default/files/uploads/articolo/troika.pdf (accessed 19.3. 2013).

9
recapitalisation of Greek banks. This set the stage for a new round of PSI negotiations,
which resulted in a major debt exchange in March and April of 2012.
On the side of private creditors, the negotiations were led by a steering group of 12
banks, insurers and asset managers on behalf of a larger group of 32 creditors, which
together held an estimated 30-40 per cent of Greece’s privately held debt (Table 2). This
effectively made the March 2012 restructuring a hybrid between a “London Club”
negotiation led by a steering group of banks, as had been typical for the restructuring of
bank loans in the 1980s and early 1990s – and a take-it-or-leave-it debt exchange offer,
which was typical for most bond restructurings since the late 1990s.13
The rebirth of the creditor committee was likely due to the fact that much of Greece’s
outstanding debt was held by large Western banks. It also made it easier for Greece’s
official creditors – particularly the Eurogroup – to influence the terms of the
restructuring (see section 3.4 below). This likely helped in designing some features of
the deal, such as the co-financing agreement between Greece and the European
Financial Stability Fund (EFSF) described in more detail below, that might have been
more difficult without some form of formal creditor representation.
Table 2. Composition and estimated bond holdings of creditor committee
On February 21, 2012, Greece and the steering committee announced in parallel press
releases that a deal had been agreed. A formal debt restructuring offer followed three
days later. This turned out to look very different from the IIF’s July “financing offer”.
Investors were only offered one take-it-or-leave it package – referred to as the “PSI
consideration”, not a menu of four alternatives. The promised official contribution was
used not to collateralise principal repayments of the new bonds, but rather to finance
13
See Rieffel (2003) and Das et al. (2012), Table 4. During the 1990s, Bank-led creditor committees also played a
role in the restructuring of Soviet-era debt in 1997 and, again, in 2000.
Steering Committee Members Further Members of the Creditor Committee
Allianz (Germany) 1.3 Ageas (Belgium) 1.2 MACSF (France) na
Alpha Eurobank (Greece) 3.7 Bank of Cyprus 1.8 Marathon (USA) na
Axa (France) 1.9 Bayern LB (Germany) na Marfin (Greece) 2.3
BNP Paribas (France) 5.0 BBVA (Spain) na Metlife (USA) na
CNP Assurances (France) 2.0 BPCE (France) 1.2 Piraeus (Greece) 9.4
Commerzbank (Germany) 2.9 Credit Agricole (France) 0.6 RBS (UK) 1.1
Deutsche Bank (Germany) 1.6 DekaBank (Germany) na Société Gén. (France) 2.9
Greylock Capital (USA) na Dexia (Belg/Lux/Fra) 3.5 Unicredit (Italy) 0.9
Intesa San Paolo (Italy) 0.8 Emporiki (Greece) na
LBB BW (Germany) 1.4 Generali (Italy) 3.0
ING (France) 1.4 Groupama (France) 2.0
National Bank of Greece 13.7 HSBC (UK) 0.8
Notes: In € billion. Estimates of bond holdings refer to June 2011, creditor committee composition to December
2011. Sources: Barclays (2011) and Institute of International Finance (http://www.iif.com/press/press+219.php).

10
large upfront cash payments. Most importantly, the new bonds offered for exchange
involved both much lower face value and lower coupon rates. Specifically, the “PSI
consideration” comprised (see also Appendix 1 for details):
(i) One and two year notes issued by the EFSF, amounting to 15 per cent of the old
debt’s face value;
(ii) 20 new government bonds maturing between 2023 and 2042, amounting to 31.5
per cent of the old debt’s face value, with annual coupons between 2 and 4.3 per
cent. These bonds were issued under English law and governed by a “co-financing
agreement” with the EFSF which instituted a sharing provision for the private
bondholders vis-à-vis the EFSF (see below);
(iii) A GDP-linked security which could provide an extra payment stream of up to one
percentage point of the face value of the outstanding new bonds if GDP exceeded
a specified target path (roughly in line with the IMF’s medium and long term
growth projections for Greece).
(iv) Compensation for any accrued interest still owed by the old bonds, in the form of
6-month EFSF notes.
Another important difference with respect to the July proposal was that the offer cast a
much wider net. Whereas the July plan had envisaged exchanging only sovereign and
sovereign-guaranteed railway bonds with less than 9 years of remaining maturity, the
February 201214
offer was directed at all privately held sovereign bonds issued prior to
2012, with total face value of €195.7 billion, as well as 36 sovereign-guaranteed bonds
issued by public enterprises with face value of just under €10 billion (not just Hellenic
Railways, but also of the Hellenic Defence Systems, and of Athens Public Transport).15
As a result, the total volume targeted in the February offer exceeded that of the July
proposal by about €50 billion, in spite of the fact that Greece’s bonded debt stock had
shrunk by €10 billion in the meantime, as investors continued to be repaid in full and on
time while negotiations dragged on.
Perhaps the only important sense in which the February proposal did not differ from the
July plan is that it excluded the bond holdings of the ECB – Greece’s single largest
bondholder by far, with €42.7 billion (16.3 per cent) of holdings in February 2012 –
national Central Banks (€13.5 billion of Greek bonds, about 5 per cent of the total), and
the EIB (€315 million). Just ahead of the publication of the offer, these were swapped
into a new series with identical payment terms and maturity dates. As part of the
February swap arrangement, the ECB committed to return any profits on Greek
government bond holdings, most of which had been purchased significantly below par
during 2010, to its shareholders. But this did not mean that they would be returned to
Greece: the Euro group agreed on such a return only in late November 2012.16
14
Depending on how one counts them, 81 or 99 issues (the ambiguity comes from the fact that 18 Greek-law titles
were listed using two different ISIN bond numbers, notwithstanding common issue dates, maturity dates and terms). 15
A number of sovereign guaranteed loans and bonds were left out of the exchange. However, information on these
guarantees has been difficult to come by and we do not know their total volume. 16 Some national central banks, such as the Banque de France, had previously agreed to return their profits on Greek
government bond holdings to Greece, but this did not apply to SMP profits.

11
With some exceptions,17
all bondholders that were offered the “PSI consideration” also
received a “consent solicitation”, in which they were asked to vote for an amendment of
the bonds that permitted Greece to exchange the bonds for the new package of
securities. Bondholders accepting the offer were considered to simultaneously have cast
a vote in favour of the amendment. However, bondholders that ignored or rejected the
exchange offer were deemed to have voted against the amendment only if they
submitted a specific instruction to that effect.
The rules for accepting the amendment differed according to their governing law. About
€20 billon of sovereign and sovereign-guaranteed bonds – just under 10 per cent of
eligible face value – had been issued under English-law. For these bonds, the
amendment rules were laid out in “collective action clauses” (CACs) contained in the
original bond contracts, and voted on bond-by-bond.18
In contrast, the large majority of
Greece’s sovereign bonds that had been issued under Greek law – €177.3 billion, over
86 per cent of eligible debt – contained no such collective action clauses, meaning that
these bonds could only be restructured with the unanimous consent of all bond holders.
However, because they were issued under local law, the bond contracts themselves
could be changed by passing a domestic law to that effect. In theory, Greece could have
used this instrument to simply legislate different payment terms, or give itself the power
to exchange the bonds for the new securities, but this might have been viewed as an
expropriation of bondholders by legislative fiat, and could have been challenged under
the Greek constitution, the European Convention of Human Rights and principles of
customary international law.
Instead, the Greek legislature passed a law (Greek Bondholder Act, 4050/12, 23.
February 2012) that allowed the restructuring of the Greek-law bonds with the consent
of a qualified majority, based on a quorum of votes representing 50 per cent of face
value and a consent threshold of two-thirds of the face-value taking part in the vote.19
Importantly, this quorum and threshold applied across the totality of all Greek-law
sovereign bonds outstanding, rather than bond-by-bond. While this “retrofit CAC” gave
17 The holders of a Swiss-law sovereign bond received only a consent solicitation, not an exchange offer, apparently
because the latter would have been too difficult, given local securities regulations, within the short period
envisaged. Holders of Japanese-law bonds, an Italian-law bond, and Greek-law guaranteed bonds received the
opposite treatment, i.e. only exchange offers, but no consent solicitation. Although the Japanese-law bonds
contained collective action clauses which allowed for the amendment of payment terms in principle, local securities
laws made it impractical to attempt such amendments in the short period envisaged. The Greek-law guaranteed
bonds also did not contain collective action clauses (or only with extremely high supermajority thresholds), and
were kept outside the remit of the February 23, 2012 Greek bondholder law which “retrofitted” CACs on all Greek-
law sovereign bonds. 18 Typically, these envisaged a quorum requirement (i.e. minimum threshold of voter participation) between 66.67and
75 per cent in a first attempt, followed by a quorum of between one-third and 50 per cent in a second meeting if the
initial quorum requirement was not met. The threshold for passing the amendment was usually between 66.67and
75 per cent of face value in the first meeting, and as low as 33.33 per cent in the second meeting. The Italian-law
bond, as best we know, did not contain a collective action clause. The Greek-law guaranteed bonds also either did
not contain collective action clauses or only with extremely high supermajority thresholds. 19 While the quorum requirement was lower than typical for the initial bondholder meeting under English-law bonds,
this was arguably justified by the fact that the Greek sovereign allowed itself only “one shot” to solicit the consent
of bondholder to the amendment of Greek-law bonds, whereas under the English-law bonds, failure to obtain a
quorum in the first meeting would have led to a second meeting with a quorum requirement between just one third
and one half. The idea behind this structure is described in Buchheit and Gulati (2010).

12
bondholders collectively a say over the restructuring which was roughly analogous to
that afforded to English-law bondholders, the sheer size of what it would have taken for
bondholders to purchase a blocking position made it near impossible for individual
bondholders (or coalitions of bondholders) to block the restructuring.
The offer was contingent on Greece obtaining the EFSF notes that were to be delivered
to creditors in the exchange (which in turn depended on the completion of some prior
actions under Greece’s IMF- and EU supported programme); and a “minimum
participation condition”, according to which the proposed exchange and amendments
would not go forward if this were to result in a restructuring of less than 75 per cent of
face value. Conditions of the type had been used in most debt exchange offers since the
mid-1990s to reassure tendering bondholders that they would not be left out in the cold
(i.e. holding a smaller, and potentially illiquid claim) in the event that most other
bondholders chose not to accept the offer. 20
At the same time, Greece and the Troika decided to set a 90 per cent minimum
participation threshold as a precondition for unequivocally going forward with the
exchange and amendments. This implied, in particular, that if Greece succeeded with its
attempt to amend its domestic law sovereign bonds within the framework set out by the
February 23 law, the exchange would likely go forward, since the Greek-law sovereign
bonds alone amounted to about 86 per cent of the total eligible debt. Between the two
thresholds Greece would allow itself discretion, “in consultation with its official sector
creditors” on whether or not to proceed with the exchange and amendments.
Greece gave its creditors just two weeks, until 8 March, to accept or reject the offer.
This tight deadline was needed to complete at least the domestic-law component of the
exchange before 20 March, when a large Greek-law bond issue was coming due for
repayment.
3.1. Restructuring Outcome
On March 9, Greece announced that 82.5 per cent of the €177.3 billion in sovereign
bonds issued under domestic law had accepted the exchange offer and consent
solicitation.21
Participation among the foreign-law bondholders was initially lower, at
around 61 per cent. But together, these participation levels implied that both thresholds
that were critical for the success of the exchange – first the two-thirds threshold for
amending all Greek-law bonds using the February 23 law, and subsequently the overall
participation threshold of 90 per cent – could be met by a wide margin. Since EFSF
financing had also been made available in the meantime, the government announced that
it would proceed with the exchange of the Greek-law bonds. At the same time, the
participation deadline for foreign-law bondholders was extended twice, to early April.
.
20 Hence, the minimum participation threshold can be interpreted as ruling out an inefficient equilibrium in which no
bondholder tenders for fear of being in this situation. See Bi et al (2011). 21 These and all following numbers referring to participation exclude holdings by the ECB and national central banks,
unless otherwise stated.

13
Figure 1. Exit yield curve, by duration of new bonds
Source: Bloomberg
Greece’s new bonds started trading immediately, on March 12, at yields in the range of
just under 14 (longer bonds) to about 17.5 per cent (shorter bonds, see Figure 1).
Weighted by principal, the average “exit yield” was 15.3 per cent – higher than the
sovereign yield of any other Euro area country at the time, and suggesting that even after
the success of a very significant debt reduction operation seemed all but assure, private
creditors remained sceptical about the future of Greece’s programme and its longer term
ability to repay. At the same time, Greece’s high exit yields were not unusually high
compared to emerging market debt restructurings of the past.22
By the end of the process, on April 26, after the last foreign law bonds were settled,
Greece had achieved total participation of €199.2 billion, or 96.9 per cent of eligible
principal, resulting in a pay-out of €29.7 in short-term EFSF notes and €62.4 in new
long sovereign bonds. Hence, the face value of Greece’s debt declined by about €107
billion as the result of the exchange, or 52 per cent of the eligible debt.23
Holders of €6.4 billion in face value held out. The holdouts were scattered across 25
sovereign or sovereign guaranteed bonds, of which 24 were foreign-law titles: Seven
bonds for which no amendment was attempted, one inquorate bond, and 16 bonds for
22 See Appendix 3, which shows exit yields for all distressed debt exchanges since 1990 for which secondary market
prices were available soon after the exchange. Sturzenegger and Zettelmeyer (2007b) and Cruces and Trebesch
(2013) provide some evidence suggesting that exit yields tend to be abnormally high (even after restructurings that
ultimately prove to be successful). Possible reasons include the high degree of uncertainty in the period immediately
after a debt restructuring, and in some cases lack of liquidity in bond markets after defaults. 23 The source of these numbers are press releases issued by the Greek Ministry of Finance on April 11 and 25, 2012.
Note there is a slight inconsistency between the reported total participation of €199.2 and the €29.7 and €62.4 in
new issuance: based on the face value conversion coefficient of 0.15 and 0.315 respectively, the latter should be the
€29.9 and €62.7 respectively. The difference seems to be accounted for by the 2057 English law CPI-indexed bond
with outstanding face value of €1.78 billion, which the Greek authorities counted as fully retired but of which only
€0.67 billion was exchanged. See following footnote.

14
which the amendment was rejected by the bondholders.24
In addition, there were
holdouts for one Greek-law guaranteed bond (an Athens Urban Transport bond maturing
in 2013). All other Greek-law sovereign and sovereign guaranteed bonds were amended
and exchanged in full (see appendix tables A3 and A4 for details).
The final participation rate among foreign law bondholders was 71 per cent, slightly
lower than the 76 per cent achieved by Argentina in 2005. However, because of the
large share of domestic law debt and the application of the Greek Bondholder Act to
bind in the domestic law bondholders, the share of holdouts in total eligible debt was
much smaller, just 3.1 per cent. So far, Greece has repaid the holdouts in full. As of July
2013, seven bonds involving holdouts have matured.25
Figure 2. Impact of Exchange on Greece’s Debt Service to Private Creditors
Note: Coupon plus principal repayments, at face value, in € billion. Sources: Hellenic Republic
(Ministry of Finance and Public Debt Management Agency), Bloomberg, and authors’ calculations.
Figure 2 shows how the debt exchange changed the payments expected by creditors. The
series denoted “before” the exchange refers to the payment flows promised by Greece’s
old bonds, both interest and amortisation. The series “after”, which is decomposed in
Figure 3, comprises both payment flows due to old bonds that were not exchanged
(bonds in the hands of holdouts, national central banks and the ECB), flows promised by
the new bonds, and payments flows associated with the short term EFSF notes (both the
24
This excludes a 2057 English-law CPI indexed bond, which was only partly exchanged (€0.67 out of €1.78 billion).
For the remaining €1.11 billion, the government reportedly struck a deal “at terms more favourable to the Republic
than PSI” (Ministry of Finance Press release, 11. April 2012). We have not been able to obtain information about
these terms, but presume that these bonds were held by domestic institutional investors which may have received
some other form of consideration by the Greek government. 25 The first of these, an English-law sovereign bond with remaining face value of €435 million repaid on 15 May
2012, was reportedly almost entirely owned by Dart Management, a fund that had already held out in Brazil’s 1992
Brady exchange and, recently, in Argentina (see Schumacher et al. 2013).

15
6-month notes that compensated investors for accrued interest, and the 1 and 2 year
notes in the amount of 15 per cent of the old face value).26
The main message from Figure 2 is that although the exchange significantly lowered the
flows to investors as a whole, they did not significantly shift the payment profile into the
future, as the longer maturities of Greece’s new bonds (compared to most of the old
ones) was offset by a bunching of payments due to the EFSF notes at the short end of the
maturity profile. In addition, Greece’s debts to non-participating investors – holdouts
(€6.4 billion) and the ECB and national central banks (€56.7 billion) -- were bunched at
the short end (see Figure 3), and continued to exceed Greece’s new long term bonds
(€62.4 billion) in face value.
Figure 3. Post-Exchange Debt Service
Note: In € billions, by type of creditor Sources: Hellenic Republic (Ministry of Finance and Public
Debt Management Agency), Bloomberg, and authors’ calculations.
3.2. CDS settlement
Credit Default Swaps (CDS) held by investors seeking to protect themselves from a
Greek default caught much attention in the initial phases of the Greek debt crisis. There
was a fear that triggering CDS contracts would lead to bankruptcies of the institutions
that had written CDS protection, much like the subprime crisis in the U.S. triggered the
collapse of institutions that had written CDS protection on collateralised debt obligations
backed by subprime loans. Many market participants interpreted the initial insistence of
26 Payments associated with the GDP linked-security are ignored in the figures because of their small expected
amount and the uncertainty surrounding them.

16
the official sector on a purely voluntary debt exchange (presumed not to trigger the
CDS) in this light.
When it became clear, in January of 2012, that the exchange was unlikely to be purely
voluntary, fears of contagion via the triggering of CDS contracts resurfaced. On March
9th
, 2012 – the day Greece announced that the participation thresholds for amending the
Greek sovereign bonds had been met – the Determinations Committee of the
International Swaps and Derivatives Association (ISDA) declared a triggering credit
event, citing the use of CACs to bind in non-participating creditors.
However, the consequences were anticlimactic: there was no contagion, and even some
relief that the restructuring had been recognized as a credit event.27
A CDS settlement
auction was announced for March 19th
, resulting in pay-outs of €2.5 billion to protection
buyers – a very small amount compared to the total size of the restructuring (less than 2
per cent). CDS exposure had dropped sharply over the course of the crisis, as the costs
of buying CDS protection kept rising. According to data compiled by the Depository
Trust & Clearing Corporation (DTTC), the net notional volume of Greek CDS
outstanding fell from more than €7 billion in end-2009 to below €2.5 billion in early
2012.
Although contagion was limited, the CDS settlement process posed a challenge, for two
reasons. First, there was still limited experience in settling sovereign CDS contracts,
since this was the first major case apart of Ecuador in 2009. Second, the Greek credit
event occurred after a pre-emptive debt restructuring, as the credit event was not
triggered by an outright payment default. CDS contracts are typically settled through an
auction in which bid and offer prices quoted by dealers and requests to buy or sell a
defaulted reference bond (the “cheapest-to-deliver” bond) are used to determine a final
settlement price. In a cash settlement, a buyer of CDS protection then receives the
difference between the auction price and the par value of the defaulted bond.28
In the case of Greece, however, the CDS auction took place after the bond exchange.
This meant that most of the old bonds had already been exchanged by March 19th
and
those remaining were insufficient for the purposes of the auction. The ISDA Committee
therefore decided to base the auction on the 20 new English-law instruments issued by
Greece on 12 March. This resulted in a final auction price of 21.5 cents, consistent with
the price of the 2042 new bond (the cheapest new bond), in secondary markets prior to
the auction.
It is remarkable that things worked out well eventually (Gelpern and Gulati, 2012). In
particular, the settlement price derived from the par value of the new 2042 bond (only
31.5 per cent of original principal), turned out to be the same as the par value of the new
27
Against the fear of contagion via triggering the CDS, there was a countervailing fear that not triggering the CDS in
a situation that to the holders of Greek sovereign bonds looked and felt like a default would have had even worse
contagion consequences, by demonstrating the futility of CDS protection in high-profile sovereign default cases.
This, it was felt, might lead to a flight out of the bond markets of other highly indebted southern European
countries, and perhaps “kill the CDS market” for the sovereign asset class more generally. 28
Alternatively, there can be a “physical settlement” in which a bond holder with CDS protection delivers the
defaulted bond to the seller and receives the par value in return.

17
bundle received by investors per 100 cents of original principal. Holders of CDS
protection thereby received roughly the difference between the face value of the original
bonds and the value they received through the PSI, as they should have. Had the ratio of
ESFS bills to new bonds in the package received by investors been considerably lower
(higher) than it was, then the CDS pay-outs would have been considerably lower
(higher) than the amounts needed to make investors “whole”.29
It is difficult to say to what extent this happy outcome reflected luck or design. Given
what was at steak – the credibility of sovereign CDS and of the ISDA settlement process
- it is conceivable that some features of the debt exchange were chosen to facilitate the
settlement of the CDS contracts. This may have affected the unusual design of the new
package of securities offered to investors, in particular the large cash portion and the fact
that Greece issued 20 new bonds across a long maturity range, including the 2042 bond
that was ultimately used for CDS settlement.
3.3. Distributional implications
We now compute the distributional implications of the restructuring, from three angles:
First, aggregate investor losses; second, distributional implications across investors, and
third, total debt relief received by Greece.30
Investor losses in the aggregate
As already mentioned in the discussion of the July 2011 financing offer, there are
several ways to compute the loss, or “haircut”, suffered by a representative investor
holding sovereign bonds. Market practitioners define haircuts as 100 minus the present
value of the new bonds offered. For the reasons explained above, this measure tends to
exaggerates creditor losses, as it implies that so long as the value of the new bonds is
below par, creditors suffer a haircut – even in an entirely voluntary debt management
operation in which the new bonds have higher market value than the old bonds. We
therefore take an alternative approach that follows our previous work (Sturzenegger and
Zettelmeyer 2008, Cruces and Trebesch, 2013), but also private sector economists such
as Ghezzi, Aksu and Garcia Pascual (2011) and Kopf (2011), namely, to compute
present value haircuts as the percentage difference between the present value of the new
and old bonds, both evaluated at the exit yield observable immediately after the
exchange. This definition has two useful interpretations:
29
As argued by Duffie and Thukral, (2012) the results of future CDS settlements could be made less arbitrary, if the
settlement amount were based not on the post-exchange value of either the defaulted bond or a new sovereign bond,
but rather on the value of the entire bundle of securities and cash received by an investor that has been subjected to
an amendment of the original payment terms. 30 Important distributional angles that are not covered in the analysis that follows include redistribution from the
official sector to Greece as a result of change in bailout terms in March 2012, and the distributional implications of
the restructuring within Greece. For example, Greek pension funds were hard hit (like other private sector creditors
of the government), whereas banks and bank creditors were not hit at all, as banks were effectively compensated for
losses on their sovereign bond holdings through a bank recapitalisation scheme. Establishing the overall
distributional implications of the Greek crisis, bailout and restructuring is an area for future research.

18
First, it measures the loss suffered by a participating creditor compared to a
situation in which he or she had been allowed to keep the old bonds and have
them serviced with the same probability as the new bonds that were issued in the
exchange. In other words, it compares the value of the old and new bonds in a
hypothetical situation in which there would have been no discrimination against
the holders of the old bonds.
In actual fact, participating creditors of course chose the new bonds, suggesting
that – if the haircut was positive – there must have been discrimination against
holdouts in some form. Hence, the present value haircut can equivalently be
interpreted as measuring the strength of the incentives that the debtor must have
offered to prevent free riding – by threatening to default, or perhaps through
other means. This leads to the question of what those incentives were in the case
of Greece, and how they compare to previous exchanges. We take this up in the
next section.
Although the present value haircut is conceptually simple, computing it in practice is not
always straightforward. One problem is that the risk characteristics of the new bonds,
and hence the exit yields, can be specific to the maturity of the new bonds (or more
generally, the timing of the promised payment stream), which may differ from those of
the old bonds. This was the case in Greece, where exit yields are available for bonds of
10 year maturity and up (Figure 1), but it is not clear what rate to use to discount old
bonds of shorter maturity. Another problem is that the market on the first day of trading
after a debt exchange may not be very liquid (for example, because some institutional
investors are not yet in the market pending some rating action). Hence, the exit yield
may not be entirely representative for the yield that establishes itself in the market
shortly after the exchange, even if there is no new information about fundamentals in the
intervening period.
We seek to address these problems by computing alternative aggregate haircut estimates
based on three approaches (Table 3).
The first column of Table 3 calculates the value of the old bonds using the
average discount rate corresponding to the prices of the new bonds (15.3 per
cent). For the purposes of discounting shorter old bonds, this is likely too low.
The second and third columns show the sensitivity of these results to using yields
on two alternative dates: 19 March – one week after the first date of trading;
which incidentally coincides with the date on which the result of the CDS
settlement was announced (16.3 per cent); and 25 April, the date on which the
final exchange results were announced (18.7 per cent).
Finally, the last column of Table 3 shows the average haircut using a different
discount rate for each bond depending on its maturity. For this purpose, we
construct a yield curve which is based on observed data at the longer end (based
on the exit yields of the newly issued bonds) as well as imputed yield curve
values for the shorter end where no exit yields are observed. The latter are
derived using a simple valuation model which assumes that the high observed
long-term yields are driven by some combination of a continued fear of default
in the short run and the expectation of lower (but higher than pre-crisis)
sovereign yields in the long run if a new default is avoided. Combinations of

19
these parameters – the short- and medium-run cumulative default probability,
and the long-run yield – are calibrated to reproduce the observed high but falling
exit yields at the longer end. Yields at shorter end of the curve are then
calculated using these calibrated parameters and the actual cash flows of the
shorter bonds Appendix 4 explains this procedure in more detail and undertakes
some sensitivity analyses.
Computing the haircut also requires valuing the GDP-linked securities that were part of
the offer. Each investor received the same number of units of these securities as
principal units of new bonds, that is, 31.5 per cent of the outstanding old principal. On
the first day of trading, the price of each unit was 0.738 per 100 units of the new bonds;
hence, the value for 100 units of the old bonds was 0.315*0.738 = 0.232. Put differently,
we find that the GDP warrants were nearly worthless, less than 0.3 per cent of original
principal. No matter which valuation approach is chosen, we find that their value is
below 0.3 per cent of original principal.
Table 3. Creditor “haircut” in Greek debt restructuring
Assumed discount rate (per cent)1/
15.3 16.3 18.7 Curve2/
Value of new securities received (PVnew) 23.1 22.5 21.2 22.8
Haircut in market convention (100-PVnew) 76.9 77.5 78.8 77.2
Value of old bonds (PVold) 2/ 65.3 63.3 59.0 56.5
Present value haircut (100*(1-PVnew/PVold) 64.6 64.4 64.0 59.6
Notes: In per cent of outstanding principal. New securities consisted of cash-like EFSF notes
(valued at 15 per cent of ‘old’ outstanding principal), new English-law government bonds (valued
at 6-7.9 per cent of old principal, depending on the discount rate applied) and GDP warrants
(valued at 0.23 per cent of old principal, corresponding to the issue price of 0.738 per cent of the
principal of new bonds issued).
1/ Used for discounting payment streams of both new and old Greek government bonds.
2/ Based on an imputed yield curve, see online appendix for details. The case shown is the one with
assumed peak default probability after 2 years; 12 month standard deviation.
Sources: Authors’ calculations based on Bloomberg and Hellenic Republic (Ministry of Finance).
Table 3 shows that the present value haircut of the Greek debt exchange was in the range
of 59 – 65 per cent. Using a fixed discount rate for all of the old bonds leads to estimates
close to 65 per cent regardless of whether we use the exit yield of 15.3 per cent or the
somewhat higher rates at which yields stabilised in subsequent weeks (16.3). However,
the yield curve approach produces an average haircut that is notably lower; at around 59
per cent (sensitivity analysis suggests a range from about 55 to 61 per cent). The reason
for this is that the valuation model used to construct discount rates for maturities of less
than 10 years assumes that as of March 2012, much of the sovereign risk in Greece was
concentrated in the period between the May 2012 election and mid-2015, as a result of
election uncertainty, the continuing recession, and large debt repayment obligations to
the ECB and (in 2014 and 2015) the IMF. As a result, the constructed discount rates in
the maturity spectrum between 1 and 8 years, in which the bulk of Greece’s old bonds

20
were set to mature, are significantly higher than the average exit yield of 15.3 per cent,
resulting in a lower value of these bonds, and hence lower haircut estimates.
How did the losses suffered by Greek bondholders compare to previous debt
restructurings? The answer is in Figure 4, which compares the current offer with
virtually all debt restructuring cases involving private creditors since 1975, based on
estimates by Cruces and Trebesch (2013). For the purposes of historical comparison, we
stick to the 64.6 per cent haircut that is obtained by using the average exit yield for
discounting, since the same approach was also used by Cruces and Trebesch.
Figure 4: Haircut and Size of the Greek Exchange in Historical Perspective
Note: The figure plots the size of the present value haircut, using the methodology described in the text, for Greece
(2012) and 180 restructuring cases from 1975 until 2010. The circle sizes represent the volume of debt restructured in
real US$, deflated to 1980 (excluding holdouts). For Greece, we use the haircut estimate of 64.6% (column 1 in Table
2) and the exchange volume of US$ 199.2 billion (excluding holdouts).
Sources: Cruces and Trebesch (2013, all other deals) and authors’ calculations (Greece).
Within the class of high- and middle-income countries, only three restructuring cases
were harsher on private creditors: Iraq in 2006 (91%), Argentina in 2005 (76%) and
Serbia and Montenegro in 2004 (71%). There are a number of cases of highly indebted
poor countries, such as Yemen, Bolivia, and Guyana, that imposed higher losses on their
private creditors. However, the Greek haircut exceeds those imposed in the Brady deals
of the 1990s (the highest was Peru 1997, with 64 per cent), and it is also higher than
Russia’s coercive 2000 exchange (51%).
The figure also shows that the 2012 Greek exchange was exceptional in size, exceeding
the next largest sovereign credit event in modern history, which to our knowledge was
JAM
PAN
DOM
GINMWI
ARG
PHL
KEN
SRB
GRD
BRA
ECU
CIVNIC
COD
BRA
JAM
MDG
UKR
SVN
MDG
SRB
DZA
CHL
JAM
POL
COD
JOR
NER
SRB
MOZ
MDG
TUR
SEN
NGA
MKD
UKR
PRY
NER
COD
COD
PHL
JAM
NGA
MDA
TUR
DOM
NIC
PER
CUB
BGR
NGACHLMEX
UKR
TUR
PER
RUS
HND
MAR
ZAF
JAM
POL
COD
ARGMDG
TGOPHL
POL
POL
SYC
URY
CUBPOL
DOM
UKRPAN
NIC
TTO
BRA
ECU
ECU
SEN
BIH
LBR
POL
MEX
MAR
VEN
BRA
VEN
VENDOM
CRI
CHLNGA
POL
ZAF
MEX
ROU
GAB
PER
ARG
NGA
RUSNIC
MAR
BRANGA
NGA
URY
ECU PAK
CRI
SEN PAN
IRQ
TUR
ECUCHL
MEX
MEX
BLZ
HRV
ROU
ZAF
CHL
CRI
VNM
COD
JAM
CUB
URYDZA
GMB
SRB
POL
JAM
URY
MWI
URY
ECU
PHL
MDA
PAK
RUS
RUSCOD
BOL
GAB
ROUARG
SDN
MEX
BRA
SRB
ETH
TZA
NER
UGA
YEM
COG
ALB
CMR
GUY
CIV
TGOSENSTP
GIN
BOL
GUYMRT
CMR
NICMOZ
SLE
HND
ZMB
GRC
05
01
00
Hair
cut in
%
1975m1 1980m1 1985m1 1990m1 1995m1 2000m1 2005m1 2010m1
21
Russia’s default on 1.7 billion British pounds in 1918, equivalent to just under 100
billion in 2011 Euros. The Greek exchange also easily surpasses the German default of
1932-33, the largest depression-era default on foreign bonds, comprising 2.2bn US$ at
the time, or approximately 26 billion in 2011 Euros.
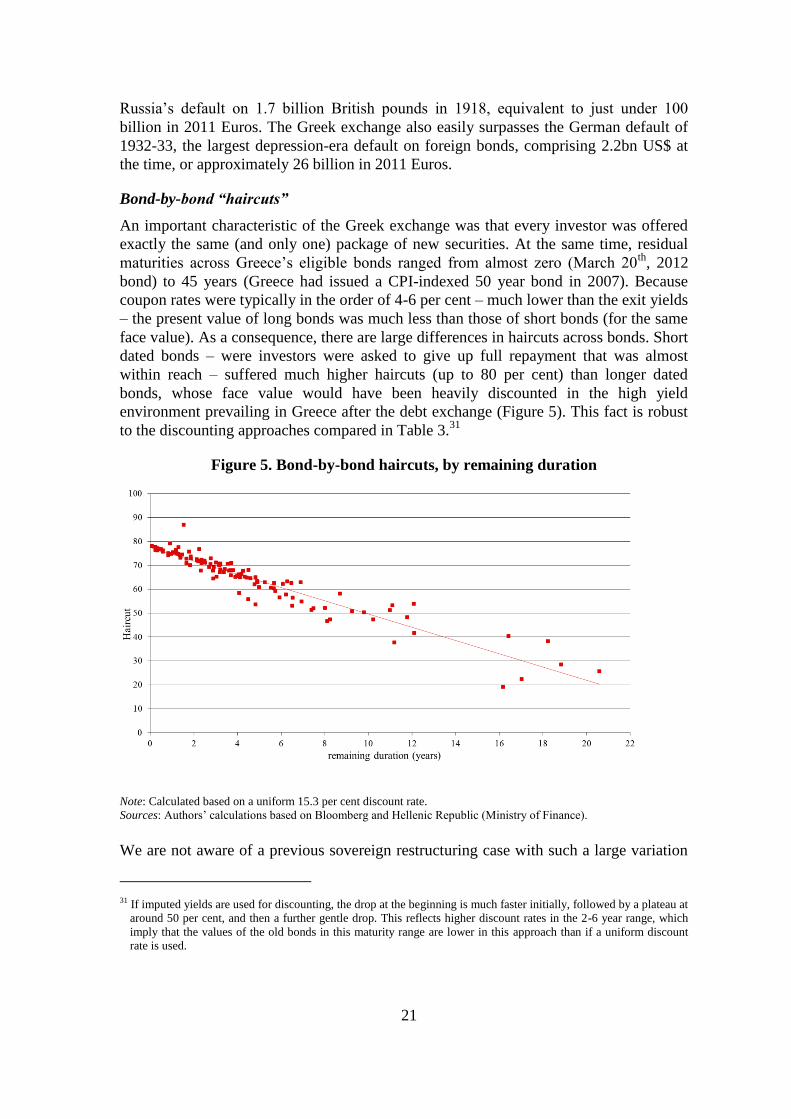
Bond-by-bond “haircuts”
An important characteristic of the Greek exchange was that every investor was offered
exactly the same (and only one) package of new securities. At the same time, residual
maturities across Greece’s eligible bonds ranged from almost zero (March 20th
, 2012
bond) to 45 years (Greece had issued a CPI-indexed 50 year bond in 2007). Because
coupon rates were typically in the order of 4-6 per cent – much lower than the exit yields
– the present value of long bonds was much less than those of short bonds (for the same
face value). As a consequence, there are large differences in haircuts across bonds. Short
dated bonds – were investors were asked to give up full repayment that was almost
within reach – suffered much higher haircuts (up to 80 per cent) than longer dated
bonds, whose face value would have been heavily discounted in the high yield
environment prevailing in Greece after the debt exchange (Figure 5). This fact is robust
to the discounting approaches compared in Table 3.31
Figure 5. Bond-by-bond haircuts, by remaining duration
Note: Calculated based on a uniform 15.3 per cent discount rate.
Sources: Authors’ calculations based on Bloomberg and Hellenic Republic (Ministry of Finance).
We are not aware of a previous sovereign restructuring case with such a large variation
31 If imputed yields are used for discounting, the drop at the beginning is much faster initially, followed by a plateau at
around 50 per cent, and then a further gentle drop. This reflects higher discount rates in the 2-6 year range, which
imply that the values of the old bonds in this maturity range are lower in this approach than if a uniform discount
rate is used.
22
in present value haircuts across instruments. There are a few examples of selective
defaults, in which countries discriminate between domestic and foreign creditors as a
group, or across types of debt instruments.32
But within these groups, sovereigns
typically tried to limit the variation of haircuts across bondholders by adapting the terms
of the new instruments to the terms of the old instruments.33
While there have been a
number of previous exchanges with “one-size-fits-all” offers – such as in Pakistan 1999,
Moldova 2002 or Cote D'Ivoire 2010 – these tended to be simple operations directed at
just a few outstanding instruments.
What explains the large variation in haircuts across bondholders? According to
individuals close to the exchange, one motivation for the one-size-fits all approach was
to keep it simple in order to get the deal done before March 20, 2012 when the next very
large bond was coming due (€14.4 billion). It is also likely that the members of the
creditor committee were mostly invested in longer-dated Greek instruments. Moreover,
the Troika, Greece and the creditor committee may all have been sympathetic to taking a
tough approach against short-term creditors, because many of these were distressed debt
investors that had deliberately bought short-dated instruments at large discounts in the
hope of still being repaid in full.
Debt relief
The present values and haircuts presented in Table 3 may not be a good estimate of the
debt relief received by the Greek sovereign, for three reasons. First, as already
discussed, from the perspective of a debtor country it may be appropriate to apply a
discount rate that reflects expected future borrowing rates over the lifetime of the new
bonds, rather than the yields prevailing immediately after a debt exchange. Second,
Greece borrowed the quasi-cash portion of the “PSI consideration” (€29.7 billion in
short term EFSF notes) from the EFSF. As a long-term liability with relatively low
interest rates (namely, the funding costs of the EFSF plus a small mark-up), its present
value can be expected to be lower than the value of the EFSF notes to investors (except
at very low discount rates). Third, Greece borrowed €25 billion from the EFSF to
compensate Greek banks for PSI related losses.34
The present value of this restructuring-
related liability must be taken into account when computing the overall debt relief.
It is very difficult to say when, and at what rate, the government will be able to return to
capital markets on a regular basis. While there are estimates for OECD countries linking
debt, deficits and growth to borrowing rates (for example, Ardagna, Caselli and Lane,
32 Recent examples include Russia’s 1998-2000 defaults and restructuring, and Jamaica’s 2010 sovereign
debt swap, which both involved domestically issued debt but left Eurobonds untouched. See Sturzenegger
and Zettelmeyer (2007a) and Erce (2012). 33 In Ecuador’s 2000 debt exchange, for example, shorter dated instruments were exchanged at par while holders of
longer dated bonds suffered a face value haircut; in addition, shorter-term bondholders were given preferential
access to a shorter maturity new bond. In Argentina’s 2001 “Phase 1” exchange and Uruguay’s 2003 exchange, the
maturities of the new bonds depended on the residual maturities of the original bonds, i.e. bondholders with shorter
instruments were offered shorter new bonds. 34 An IMF report of March 16, 2012: http://www.imf.org/external/pubs/cat/longres.aspx?sk=25781.0 states that the
Greek “PSI deal will trigger impairments of about €22 billion.” However, in April 2012, Greece borrowed €25 from
the EFSF for bank recapitalisation purposes. To avoid overestimating the debt relief associated with the Greek PSI,
we go with the higher number.

23
2007), these variables are themselves extremely difficult to forecast for Greece. We
therefore compute debt relief based on three alternative assumptions about borrowing
conditions in the long term.
1. The average nominal interest rate on public debt assumed by the IMF at the outer end
(for 2030) of its March 2012 debt sustainability analysis, namely 5 per cent.
2. The expected long run yield on the new Greek bonds implicit in the prices at which
these bonds traded after issue, which is about 8 per cent.35
3. A rate of 3.5 per cent, which can be rationalised as corresponding roughly to Greece’s expected borrowing rate from the official sector. This would be appropriate in a
scenario in which Greece remains dependent on official sector support in the medium
term.
For reference purposes, we also show the debt relief that would be implied by the exit
yield of 15.3 per cent (Table 4).
Table 4. Debt Relief Attributable to March-April 2012 Debt Restructuring
Assumed discount rate (per cent)
3.5 5.0 8.0 15.3
Present value (PV) of €199.2 bn old bonds (PVold) 217.2 199.5 171.9 130.1
PV of €29.7 bn EFSF PSI sweetener (PVefsf)1/ 31.4 25.3 17.2 8.2
Present value of €62.4 new bonds (PVnewb) 61.9 49.8 33.6 15.7
Present value debt relief (%)2/
57.1 62.4 70.5 81.7
PV of €25 bn EFSF bank recap loan (PVbnk)1/ 25.7 21.5 15.3 7.6
PV debt relief net of recap costs (%)3/ 45.3 51.6 61.6 75.9
PV debt relief net of recap costs (€ billion)4/ 98.3 103.0 105.9 98.7
in percent of GDP 5/
50.7 53.1 54.6 50.9
Notes: In € billion unless otherwise stated.
1/ Present value of Greece's liabilities to the EFSF, see http://www.efsf.europa.eu/about/operations/ for details. Uses
Bloomberg and the IMF World Economic Outlook forecasts to project EFSF funding costs and assumes that Greece
pays a 100 basis point spread over funding costs.
2/ 100*(PVold-PVnewb-PVefsf-PVgdp)/PVold where PVgdp denotes the present value of the GDP kicker, valued at €0.45
billion (0.738 per 100 unit of new principal, consistent with valuation assumption in Table 3)
3/ 100*(PVold-PVnewb-PVefsf-PVbnk -PVgdp)/PVold where PVgdp is valued at €0.45 billion (see note 2/)
4/ PVold-PVnewb-PVefsf-PVbnk -PVgdp, where PVgdp is valued at €0.45 billion (see note 2/)
5/ Using preliminary 2012 GDP of Greece from Eurostat, €193.75 billion
Sources: Authors’ calculations based on Bloomberg and Hellenic Republic (Ministry of Finance).
The first line of Table 4 shows the present value, at various discount rates, of Greece’s
€199.2 billion old bonds that were restructured in the exchange. The next two lines show
35 To rationalise the exit yield curve mapped out by Greece’s new bonds, one needs to assume not only high default
probability in the short run, but also a long term yield (in the event that default in short-medium term can be
avoided), which turns out to be about 8 per cent (see Appendix 4 for details). If Greece remains in the Eurozone,
this would imply long-term real interest rates of about 6 per cent, which is not implausible for a high-debt OECD
country (for example, Italy borrowed at long term real interest rates of 6½ - 7 per cent between the late 1980s and
the mid-1990s).

24
the present values of the two new liabilities incurred by Greece as a result of the
exchange – to the holders of the new bonds, and to the EFSF. The following line,
“present value debt relief (%)” is the mirror image of the “present value haircut” line in
Table 3. At a discount rate of 15.3 per cent, this is much higher than the haircut
computed for the same discount rate in Table 3, reflecting the fact that at this discount
rate, Greece effectively obtained debt relief from two sources – the private bondholders,
but also the EFSF, from which it had borrowed the €29.7 billion in quasi-cash given to
investors at much more favourable rates than 15.3. However, at the lower discount rates
that meant to reflect Greece’s future borrowing costs, percentage debt relief – ignoring
bank recapitalisation costs – are about in line with the haircuts suffered by investors.
Next, the table computes debt relief net of bank recapitalisation costs in both percentage
and absolute terms. The main result is that the restructuring resulting in debt relief of
€98 - €106 billion in present value, or about 51-55 per cent of GDP, very close to the
face value reduction of €107 billion. This is very large in historical comparison. The
next largest operation to restructure privately held debt, Argentina’s 2005 debt
exchange, achieved less than half that amount as a share of GDP, namely, about 22.5 per
cent of GDP, based on a discount rate of 7.7 per cent (Sturzenegger and Zettelmeyer
(2007b).
3.4. How the free rider problem was overcome
Every holder of Greek bonds, even members of the steering committee that negotiated
the terms of the exchange offer with Greece, was in principle free to accept or reject
Greece’s exchange offer. Furthermore, every creditor was a potential free rider in the
sense that no individual creditor was large enoughto “sink” the exchange on its own (in
the sense that Greece would have missed the 90 per cent participation threshold). This
leads to the question of what ultimately induced the high creditor participation of almost
97 per cent, notwithstanding a present value haircut of more than 50 per cent for all but
the most long-term creditors.
Creditor composition and political pressure are an important part of the answer. The
majority of Greek bonds were in the hands of large Greek and other European banks and
insurance companies. This meant that European governments and regulators, i.e.
Greece’s official creditors, were able to exert pressure on these banks to participate. As
famously remarked by Commerzbank’s Chief Executive Martin Blessing, the
participation of large European banks in the restructuring was “as voluntary as a
confession during the Spanish inquisition”.36
The same is probably true for domestic
Greek banks, which were asked by the Greek sovereign to participate. Hence, it is not
surprising that on March 6th, just prior to the exchange deadline, the major members of
the creditor committee released press statements reiterating their commitment to
participate in the offer.37
36 WSJ.com, 24 February 2012 37 Financial Times, March 6, “Greece inches closer to €206bn debt deal.”
25
However, the members of the creditor committee held at most 40 per cent of the debt
eligible for the exchange. Additional debt may have been in the hands of other
institutions amenable to official pressure, but according to market estimates in early
2012, these institutions together held at most €120 billion out of the almost €200 billion
that were eventually exchanged. The problem was how to deal with the remaining €80
billion (at least) of potential free riders that might be tempted to hold out in the hope of
being repaid in full or receiving a better deal.
In solving this problem, Greece and its legal and financial advisors could look to the
experience of previous distressed debt exchanges. Following the return to bonds as the
predominant form of emerging market finance in the early 1990s, there was a
widespread fear that the dispersion of these bonds in the hands of many creditors would
make it virtually impossible to achieve orderly debt restructuring. Yet, history by and
large proved these fears wrong: almost all debt exchange offers since the Brady deals of
the 1990s have been successes in the sense that creditor participation has been high, and
restructurings much quicker than in the era of bank finance (see Bi et al, 2011 and Das et
al, 2012 for details). To deter free riding among dispersed bondholders, countries used a
combination of three mechanisms:
Most frequently, threatening potential holdouts with non-payment – an approach
that is particularly credible when an exchange offer follows a default, as
happened in Russia (2000), Argentina (2005) and a number of other cases – or
undertaking actions to weaken their legal position in the event of litigation. In
some exchanges, such as Ecuador (2000) and Uruguay (2003), countries used
consent solicitations (”exit consents”) to weaken the legal protections in the
bonds of holdout creditors, taking advantage of the fact that the non-payment
clauses of bond contracts can generally be changed with simple majority
(Buchheit and Gulati, 2000).
Less frequently, “collective action clauses” that allow a qualified majority of
creditors to change the payment terms of the bonds against the opposition of a
group of holdouts, if such clauses were present.38
Finally, legal devices or financial enhancements that put tendering bondholders
at advantage in future sovereign debt crises.39
This can be achieved through the
already mentioned “exit consents”, which weaken the position of holdouts in
absolute and relative terms, or by offering creditors cash, collateralised
securities, securities issued by a more creditworthy borrower, or securities that
are harder to restructure and hence de facto senior. Examples include the
38 Prior to Greece (2012), collective action clauses had been used in Ukraine (2000), Moldova (2002), to restructure
Uruguay’s Yen-denominated bond (2003), in Belize (2007), and in Seychelles (2009). However, in the first three
cases they were used for only one bond, and in the last two the number of bonds involved was small. Possible
reasons include the fact that bonds issued in New York tended to lack such clauses prior to 2003, and that CACs are
of limited utility in restructurings involving multiple bond issues, because they have to be voted on bond-by-bond,
and holdouts can acquire blocking positions in individual bond issues. 39 This effect can lead an individual creditor to accept even when suffering a large haircut, and even conditional on all
other creditors accepting, because it implies that the original instrument is riskier, and hence needs to be discounted
at a higher rate, following a successful exchange. This is true even in a “voluntary” setting in which the debtor
genuinely would continue servicing a holdout’s instrument so long as it has the funds to do so. See Gulati and
Zettelmeyer (2012a) for details.

26
collateralised “Brady bonds” offered to bank creditors that had suffered default
in the 1980s and the Russian 2000 debt exchange, which replaced debt owed by
a state-owned bank with Eurobonds owed directly by the Russian sovereign and
issued under foreign law.
The July 2011 proposal was an attempt to deal with free riding only through the last
mechanism, by offering an upgrade from Greek law to English law combined with
collateralised principal. Even after the official creditors had decided on “stronger PSI” in
October 2011, the idea of undertaking a “purely voluntary” debt exchange relying only
on positive participation incentives lingered on. By January 2012, however, it became
clear that there was a problem with this approach: offering a combination of cash
incentives and a safer instrument would not, by itself, address the free rider incentive for
creditors holding sufficiently short-term bonds. Conditional on a successful voluntary
exchange, short term bondholders are very likely to be repaid in full even if the claim is
junior to the new debt, as the chance of a new debt crisis in the (short) period between
the exchange and the maturity date is very low. Hence, it seemed very unlikely that the
holders of a €14.5 March bond, whose participation was considered essential, would
agree to tender (Gulati and Zettelmeyer, 2012a).
The end result was that Greece relied on all three of the above mechanisms, although
with different emphasis, and in new ways:
First, and most importantly, it introduced a powerful collective action mechanism into
domestic law bonds. In February 2012, the Greek parliament enacted the Greek
Bondholder Act, which allowed it to impose the new payment terms on holdouts with
the agreement of two-thirds of face value weighted votes. Unlike the English-law bonds,
this threshold applied across bonds rather than just bond-by bond, subject only to a
participation quorum of at least 50 per cent of face value. In the end, this aggregation
feature turned out to be pivotal for the results of the debt exchange, as it allowed the
restructuring of 100 per cent of the Greek-law sovereign bonds, which themselves made
up over 86 per cent of the bonds covered by the restructuring.
Second, the bundle of new securities was designed to be as attractive as possible, for a
given haircut, to bondholders who feared (correctly) that Greek sovereign risk would
remain high even after a successful debt exchange. Three features of the “PSI
consideration” made it particularly valuable to investors in these circumstances:
Bondholders were offered an exceptionally large cash sweetener, in the form of
highly rated EFSF notes – worth 15 per cent of the ‘old’ bond’s face value and
due to mature in 2013 and 2014.40
These notes turned out to be by far the most
valuable component of the securities bundle offered to creditors, representing
almost two-thirds of its value (15 out of 23; see Table 3). Regardless of what
happened to Greece, participating investors would have this “bird in hand”.
The new bonds were issued under English law, and included standard creditor
protections such as pari passu, negative pledge, and cross-default clauses. Greek-
40 To our knowledge, this was the largest cash sweetener ever offered in a sovereign debt restructuring (aside from
outright cash buybacks). According to data by Cruces and Trebesch (2013), the average cash sweetener across 180
debt restructurings since 1975 amounted to only 3.6 per cent.

27
law sovereign bonds contained almost none of these protections. However, the
contract provisions were arguably less important than the governing law itself.
Greek-law bondholders who had just experienced the power of the local
legislature to change contract provisions retroactively would find some comfort
in the fact that English law bonds would preclude a change of their contractual
rights through legislative fiat.
Furthermore, the new bonds were issued under a “co-financing agreement” that
created an exact symmetry between Greece’s debt service to the new
bondholders and its debt service to the EFSF related to the EFSF notes and bills
that it had received for the purposes of the debt exchange. In the event of a
shortfall in payments by Greece, a common paying agent committed to
distributing this shortfall pro rata between the EFSF and the bondholders.
Hence, the co-financing agreement made it difficult for Greece to default on its
bondholders without also defaulting on the EFSF. The co-financing agreement
also stipulates that the payment terms of the new bonds cannot be amended
without the consent of the EFSF, and imposed a cap on new bond issues.
Apart from making the “PSI consideration” more attractive to risk-averse investors, the
implication of the last two features was to commit Greece to an aggressive stance vis-a-
vis holdouts in the event of a future default. Faced with the choice of defaulting on “old”
Greek-law bonds whose terms could be changed through an act of parliament or on new
bonds that exposed the Greek sovereign to litigation in foreign courts and forced it to
also default on the EFSF, Greece would surely opt for the latter.
Finally, although the Greek government went out of its way to appear non-coercive
before and during the exchange offer – for example, the February 24 invitation refers to
the exchange as a “voluntary liability management transaction by way of a voluntary
bond exchange” – it did, at the last minute, adopt a harsher tone towards potential
holdouts. On March 5, three days before the expiry of the exchange deadline, Greece
issued a press release stating that “Greece’s economic programme does not contemplate
the availability of funds to make payments to private sector creditors that decline to
participate in PSI.” On the same day, Greek finance minister Evangelos Venizelos was
quoted as saying that “Whoever thinks that they will hold out and be paid in full, is
mistaken” (Reuters, March 5, 2012).41
Although it is impossible to say exactly how much either the upgrade in “safety” or fear
of discrimination contributed to the success of the exchange offer, it is clear that the
safety upgrade was viewed as essential ex ante and that one or both played a significant
role ex post. Even a solid commitment by members of the creditor committee would not
have been enough to ensure that the two-thirds majority threshold specified by the Greek
Bondholder Act would be met. With hindsight, we know that over 82 per cent of Greek
law bondholders exchanged their bonds and an additional 3.3 per cent voted in favour of
the amendment, far exceeding the holdings of the institutions that were either members
41 Even so, an analysis of Greece’s behaviour using an index of government coerciveness developed by Enderlein et
al. (2012) indicates that the Greek government’s actions were among the least coercive in a sample that includes all
distressed debt exchanges since 1990. Only Uruguay 2003 was less coercive as far as debtor behaviour is
concerned. See Appendix 5.

28
of the creditor committee or otherwise susceptible to regulatory pressure. Thus, there
must have been a significant contingent of potential free riders (perhaps 20 to 30 per
cent of old principal) that opted in favour of the offer or amendment as a result of some
combination of sweeteners and fear of discrimination.
4. From Debt Exchange to Buyback
Despite the success of the debt exchange and the associated approval of a second official
bailout programme for Greece on March 14 2012, high yields on the new bonds
signalled the market’s view that a second default in Greece continued to be a clear and
imminent danger. Part of this had to do with domestic political and social opposition to
the adjustment programme, which materialized in the general elections in May with the
unexpected rise of the left-wing Syriza party. The ensuing political deadlock receded
only after a second election in June enabled a pro-bailout coalition government under a
new Prime Minister, Antonis Samaras (Figure 6).
Figure 6. Yields of New Greek Sovereign Bonds from Issue Date until Buyback
Source: Bloomberg
However, continued high default risk also had to do with the design of the March debt
exchange and the associated second bailout programme itself. Greece had received a
high degree of debt relief, but only at the price of promising more austerity and
structural reform which – given its economic and social troubles – did not seem
plausible to many outside observers. At the same time, debt service after the exchange
continued to be surprisingly high in the short term. This reflected the compromise that
had made the debt exchange possible in the first place: getting official Europe and the
ECB to agree to a restructuring required exempting the ECB and national central banks
from a haircut, and also taking a soft approach vis-a-vis free riders. At the same time

29
disproportionately high haircuts discouraged particularly short term bondholders from
taking part in the exchange. As a result of all these factors, the debts to ECB, national
central banks and holdouts implied payments of more than €10 billion in each year
between 2012 and 2015 (see Figure 3). This meant that there was no room for slippage:
if official disbursements under the programme stopped or were delayed, a default on the
ECB, in particular, was very much in the cards, and with it, potential exit from the Euro.
In the event, programme payments were delayed, as the programme ran off track almost
immediately as result of the May and June elections and protracted negotiations with the
new government. An initial set of disbursements under the March programme €75.6
billion in total, three quarters of which was financing for the debt restructuring and the
associated bank recapitalisation – took place between March and June, but over €36
billion in additional EFSF and IMF payments promised for the second and third quarter
were withheld. Greece coped by continuing to cut spending, accumulating arrears on
other government liabilities and selling T-bills to its banks. A critical moment came on
August 20th
when Greece repaid over €3 billion to the ECB, using ad-hoc financing from
the ECB through the Emergency Liquidity Assistance (ELA) mechanism.42
At the same time, the economic news was not encouraging, especially with respect to
growth. As summarized by the IMF (2013, p. 11) “the deepening recession created
further headwinds for fiscal adjustment, increased the burden of Greece’s debt, and
raised substantially the probability that Greece would get stuck in a weak-confidence,
high-debt, low-growth trap”. The privatization program came to a near-complete halt,
yields on Greek bonds remained high even after the political crisis had been resolved,
and by September 2012, it became clear that the budget shortfall was even larger than
expected, up to €30 billion, thus substantially increasing the Greek Debt/GDP ratio for
2012.
Against this backdrop, the IMF began to demand further debt relief for Greece as a
condition for further IMF disbursements. Given that by far the largest creditor of Greece
at this point was the EU – both through the EFSF, and through the “Greek Loan
Facility” (GLF) that had financed the first bailout programme – meaningful debt relief
could only come from the official sector. At the same time, Eurozone leaders balked at
the idea of large scale debt relief so soon after large scale official lending had been made
available to Greece at terms that were already significantly more favourable than the
first package. There was particular resistance against politically highly visible cuts in the
face value of debt owed by Greece.
The result was a compromise within the Troika, involving four elements. First, longer
maturities and lower interest rates on GLF and EFSF lending (but no face value
reduction). Second, a commitment to return profits made in connection with ECB
42 According to press reports, on August 2, 2012 the ECB governing council approved a request from the Bank of
Greece to raise the ceiling of short-term paper that it could accept as collateral for emergency liquidity assistance to
Greek banks from €3 to €7 billion. This allowed the Greek government to raise the money to repay the ECB by
selling €4 billion in T-Bills to Greek banks on August 14. See “ECB saves Greece from bankruptcy by securing
emergency loans paper”, Reuters, 3. August 2012; “Greece avoids default ... for now”, CNN Money, 17. August
2012.

30
purchases of Greek bonds to Greece. Third, EFSF funding for a partial buyback of
Greece’s newly issued bonds, which were still trading at a large discount (prior to the
announcement, about 28 cents for each Euro of face value). Finally, a commitment by
the Eurogroup to “consider further measures and assistance, including inter alia lower
co-financing in structural funds and/or further interest rate reduction of the Greek Loan
Facility, if necessary, for achieving a further credible and sustainable reduction of Greek
debt-to-GDP ratio, when Greece reaches an annual primary surplus, as envisaged in the
current MoU, conditional on full implementation of all conditions contained in the
programme.”43
The latter was likely important to the IMF, which was concerned that the
debt relief granted by the EU was not going far enough.44
4.1. The December buyback: a boondoggle?
The most controversial element of the November package, and the only one involving
private creditors, was the proposed buyback of Greek sovereign bonds issued only 9
months earlier. From the perspective Eurozone leaders, the appeal of this proposal was
that it allowed a face value reduction of Greek debt without requiring an unpopular
nominal write down on the official debt. Indeed, when the buyback was carried out on
12 December 2012, it used €11.3 billion in EFSF financing to retire €31.9 billion of
Greek bonds, hence reducing the face value of Greece’s debt by €20.6 billion.45
On this
basis, it was declared an important success in the quest to put Greece’s debt on a
sustainable path,46
and cleared the way for the next instalments of EFSF and IMF
disbursements.
At the same time, the average price at which Greece had bought back its debt, 34 cents
per Euro of face value, had increased by over 20 per cent since the buyback was
announced in late November. This seemed to confirm a problem with voluntary
buybacks that economists had been pointing out for some time, triggered by the
experience of the Bolivian buyback of 1988:47
namely, that their benefits tend to be
appropriated by the creditors, in the form of a higher market value of debt, rather than by
the debtor country.
The question is to what extent this is true for the case of Greece, and whether and to
what extent Greece improved its debt sustainability as a result of the buy back. To
answer these questions, it is necessary to briefly recall the essence of the “buyback
43 See Eurogroup statement on Greece, 27. November 2012. 44 In its January 2013 report on Greece, the IMF states that, if macro risks played out, “additional debt relief and
financing would be needed from Greece’s European partners”. Specifically, this “would require an upfront haircut
of about 25 per cent on EFSF loans, GLF loans, and ECB SMP bond holdings.” (IMF 2013, p. 39). 45 Initially, a ceiling of €10 EFSF financing had been set for the buyback, but following the buyback auction, the EU
agreed to finance a slightly higher amount. 46 See Eurogroup statement on Greece, 13. December 2012. 47 Key contributions include Bulow and Rogoff (1988) who coined the term “buyback boondoggle”, Krugman (1989),
Froot (1989), Dooley (1989), and Krugman et al. (1991). For summaries and commentaries in the context of the
Eurozone crisis see Claessens and Dell'Ariccia (2011), Manasse (2011) , Adam (2012), Sterne (2012) and various
FT Alphaville blogs; for example “The return of the Greek buyback (boondoggle)”, 19 October 2012.

31
boondoggle” argument – that is, the claim that voluntary debt buybacks are generally a
waste of public funds. The argument consists of two parts.48
The first is that the reduction in debt service obligations expected from the buyback –
and hence the increase in the probability that a distressed sovereign will actually be able
to service the remaining debt – will also result in a secondary market increase of the
debt, after the buyback is announced. The average buyback price will therefore be
generally higher than the initial price of the debt. This result is an inescapable
consequence of the voluntary nature of the buyback. If debtors expect the debt to decline
as a result of the buyback, they will no longer be willing to sell at the initial price,
because this no longer reflects the true value of the debt. As a result, “negotiated
buybacks”, which cap the extent of the price rise (or try to lock in the pre-announcement
price), are always preferable to voluntary buybacks, at least from the perspective of debt
reduction.
Note, however, that the extent to which the price actually rises in a voluntary buyback
will depend on the circumstances. For example, compare a situation where the cash used
in the buyback is a gift from donors (as in the famous 1988 Bolivian case) with another
where it is borrowed from a senior lender such as the IMF. In both cases, the expected
net reduction in the face value of debt service obligations will tend to push the price up.
But in the case of the IMF-financed buyback, there is a countervailing effect: private
borrowers realise that if there is a debt problem, they will be last in line. This means that
the buyback price will rise less compared to the pre-buyback price (it is even possible to
construct examples where it would fall).
The second part of the argument, which is more controversial,49
assumes that the
benefits of the buyback to the country can be judged by the change in its net asset
position as a result of the buyback, with debt measured at market prices. For example,
the buyback critics of the late 1980s would feel that a situation in which the market
value of the debt is unchanged after the buyback – because the reduction in face value is
offset by an increase in the price of the debt, as happened in Bolivia – is clear waste of
public money. Implicit in this view is the assumption that debt repayment involves a
zero-sum game between a debtor country and external creditors in which the value of the
debt reflects the expected resource flow from debtors to creditors.50
However, this may
not be true in situation in which a default has large domestic costs, or involves a
deadweight loss. In such cases, a buyback that helps the country avoid default may well
be welfare improving even when it leaves the market value of the debt unchanged
(indeed, even if it increases the market value of the debt).
In the case of Greece, which had large domestic creditors and undertook the buyback in
the context of a broader deal with its official creditors, it is almost surely wrong to use
48 See Claessens and Dell’Ariccia (2011) for a slightly different and more detailed rendering of the same two points,
and an overview of the pros and cons of buybacks. 49 See, for example, Cline (1995), pp. 187-93, in the context of the Bolivian buyback debate; or the discussion section
of Bulow and Rogoff’s 1988 paper. 50 The classic papers written during the buyback debate of the late 1980s all model the costs of default in terms of
creditors seizing debtor resources. That is, in these papers, all costs arising to the country from either debt
repayment or default involve a corresponding gain to creditors, and vice versa.

32
the change in the market value of its net assets as the yardstick for whether the buyback
should be considered a success. Nonetheless, since the literature used this yardstick for
other famous cases, it is interesting to see how the Greek exchange would fare by
comparison. To do this, it is necessary to select a “pre-buyback price”. The most
obvious candidate is the price on 23 November 2012, just before the official buyback
announcement.51
Note that this could be wrong in either direction. In particular, the
change in price between 23 November and 12 December could well overstate the impact
of the buyback announcement because it was a reaction not just to the buyback but also
to the other elements of the November package (including the resumption of EU-IMF
disbursements, and official sector debt relief); but it is also possible that it understates
the impact of the buyback, as the latter may have been priced in to some extent,
following remarks by ECB Board member Jörg Asmussen in mid-October.52
As an
alternative, one can hence use the secondary market price of 11. October (just before Mr
Asmussen’s remarks became public); this would generate an upper bound on the price
change that may have been driven by the buyback.
Based on the November 23 reference price (27.8 cents/Euro), the market value of Greek
bonds dropped by €7 billion as a result of the buyback: from €17.1 billion to €10.1 after
the operation was completed on 12 December. To finance this debt reduction, Greece’s
debt to the EFSF went up by €11.3 billion in face value. There are, of course, no
observable market prices for this debt; but it is a fair assumption that the default risk
faced by the EFSF following the buyback is no longer very different from that of the
private sector: given what little privately held debt Greece has left at this point (see
below), it is hard to imagine a scenario where Greece would again restructure its debts to
private creditors and not also to the EU. Using the average bond yield prevailing
immediately after the buyback (11.75 per cent) to discount debt service flows to the
EFSF leads to a present value of just €2.7 billion – reflecting the low interest rates and
very long maturity of this EFSF loan (it amortises linearly between 2023 and 2042).
Hence, the market value of Greece’s net asset position would have improved by €7 -
€2.7 = €4.3bn, a net return of 157 per cent on the €2.7 billion value of extra borrowing
from the EFSF.
What if the price of October 11 is used as the reference? In this case, the initial market
value of the debt that was bought back would be much smaller, namely just €13.7
billion, but this still implies a drop of €3.5 billion in market value as a result of the
buyback, which exceeds the €2.7 billion increase in the value of the EFSF borrowing by
€0.8 billion. The net return is 31 per cent.
These calculations are obviously sensitive to the way in which the EFSF debt is
discounted. If it is discounted at a sufficiently lower discount rate than the market yield
of 11¾ per cent, the improvement in Greece’s net asset position due to the buyback goes
51 The Eurogroup statement of November 27, 2012 itself seems to view the price November 23 as the relevant pre-
buyback reference: “The Eurogroup was informed that Greece is considering certain debt reduction measures in the
near future, which may involve public debt tender purchases of the various categories of sovereign obligations. If
this is the route chosen, any tender or exchange prices are expected to be no higher than those at the close on Friday,
23 November 2012.” 52 See Reuters, “ECB's Asmussen says Greece could buy back own debt”, October 12, 2012.

33
away. Using the 23 November reference price, that threshold discount rate would be
about 6 per cent; using the 11 October reference price, it would be 10 per cent. But the
point here is merely that based on a market value yardstick, it is not possible to condemn
this buyback unless one assumes that the risk of a Greek default to the EFSF is
significantly lower than that of a new default to the private sector.
We next move to the question whether the buyback achieved debt relief that made it
easier for Greece to repay its remaining debt in full. Given that this was the stated
purpose of the buyback, this strikes us as the key issue. To answer this question, we
compute the impact of the buyback on the Greek debt burden use the same discount
rates as in the previous section – 3.5, 5 and 8 per cent – to discount both the old flow
(Greek bonds bought back) and the new one (new debt service to the EFSF). As
explained before, the justification for using these rates is that they represent different
guesses for the rates at which Greece might be able to transfer revenues over time, based
on borrowing from either the market after it reopens or from the EFSF.
Table 5. Debt Relief Attributable to December Debt Buyback
Discount rate (per cent)
3.5 5.0 8.0
Reduction in Greek government bonds
Face value 31.9 31.9 31.9
Present value 31.7 25.4 17.0
Increase in debt to the EFSF
Face value 11.3 11.3 11.3
Present value 10.8 8.2 4.9
Debt relief
Face value 20.6 20.6 20.6
Present value 20.9 17.1 12.1
Present value (per cent of GDP)1/
10.8 8.8 6.2
Notes: In € billion unless otherwise stated.
1/ Using preliminary 2012 GDP of Greece from Eurostat, €193.75 billion
Sources: Authors’ calculations based on Bloomberg and Greek Ministry of Finance.
The main result, given in the bottom two rows of Table 5, is that in addition to a face
value reduction of €20.6 billion, the buyback operation did in fact achieve a reasonable
volume of present value debt relief, ranging from €12 billion for the highest of the three
discount rates to just under €21 billion for the lowest discount rate, or 6.2 to 10.8 per
cent of 2012 GDP. These are not very large amounts, but respectable, given Greece’s
dire situation and the limited scale of the operation.53
53 One might ask at this point whether these amounts need to be adjusted by public money used to compensate Greek
banks which, according to IMF information, contributed €14.1 billion of the €31.9 bought back in the operation.

34
The finding that the buyback did in fact reduce Greece’s debt burden does not, of
course, imply that this was the best to use the extra EFSF financing. Leaving aside the
fact that the EFSF money might have been better spent addressing social needs,
preparing privatisation or supporting structural reforms, there could have been more
effective ways of using the extra financing even from the narrow vantage point of
reducing Greece’s debt burden – in particular, by conducting the buyback at a negotiated
price that would not have distributed the buyback induced appreciation of Greek bonds
back to investors. In the next section, we show some counterfactual calculations that
illustrate this point.
Figure 7: Change in composition of Greek sovereign debt
Note: The Figure shows Greek government and government-guaranteed debt owed to private creditors (brown, bonds
and T-bills only as well as guaranteed debt issued by banks) and official creditors (blue) in € billion as of end-
December 2012. ECB/NCB debt refers to ECB SMP holdings as well as holdings by national central banks in the
Eurozone. EU/EFSF loans include the bilateral GLF loans as well as the EFSF loans. T-bills are privately held short-
term debt instruments. Sources: Authors’ calculations based on Bloomberg and Hellenic Rep. (Ministry of Finance).
Figure 7 shows the overall effect of the Greek restructuring on Greece’s creditor
structure. In less than a year, the structure of Greek government debt was turned upside
down, with privately held debt (bonds and T-Bills) now accounting for only about 20
The answer is no: although the EFSF subsequently released a €16 billion loan tranche to Greece that was earmarked
for recapitalisation, this was motivated by the generally poor asset quality of banks, not by the buyback. There is no
reason why the buyback, even if it was not fully voluntary, would have inflicted a loss on Greek banks. In economic
sense, banks made a capital gain, since they received the bonds for an average price of 25 cents/€ or less, and were
selling it for 34 cents/€. In accounting terms, banks were either marking their holdings to market, in which case the
buyback made no difference or were holding them to maturity, in which case the would have been valued at the
initial 25 cents/€ price, in which case banks realised a profit.
EU/EFSF
52.9
ECB/
NCBs
56.7
IMF,
20.1
Bonds:
205.6
T-Bills;
15
EU/
EFSF
161.1 ECB/
NCBs;
45.3
IMF,
22.1
New
Bonds
29.6
T-Bills;
23.9
Holdouts
5.5
February 2012:
Before debt exchange December 2012:
After debt exchange and buyback

35
per cent of total. Most strikingly, there was a near elimination of privately held
sovereign bonds. In mid-February 2012, banks and other investors still held almost €206
billion of Greek bonds. But after the March/April exchange and the subsequent buyback
this figure had shrunk to a mere €35 billion (€29.5 billion in the form of new bonds and
€5.5 billion of old GGBs held by holdouts). At the same time, official loans by other
Eurozone governments increased from €58 billion in early 2012 to more than €160 in
late 2012, with a further €35 billion committed for 2013. We are not aware of any other
similarly drastic case of “credit migration” from private into official hands in the history
of sovereign debt.
Finally, what was the combined effect of the debt exchange and buyback on Greece’s
creditors? A creditor participating in both would have received 15 cents in quasi-cash
and 31.5 cents of new face value per old unit of face value of quasi-cash in March or
April, followed by 34 cents per unit of new face value in December. This sums to
15+0.315*34 = 25.7 cent per original face value. The creditor’s alternative was to keep
the original debt. Discounted at the 11¾ per cent yield prevailing in the market after the
buyback, this would have been worth just under 74 cents on the Euro, implying a haircut
of (1-25.7/73.9) = 65 per cent – almost exactly the same result as obtained in Table 3
using the exit yield of 15.3. We conclude that participating investors lost about 65 per
cent of the value of their claims on average as a result of both restructuring operations,
with wide difference between holders of short maturities, who lost up to 74 per cent, and
of longer maturities, who lost far less, as indicated in Figure 5.
5. Assessment and Outlook
For students of debt restructurings, there were many aspects of the Greek restructuring
that were, to use the technical term, cool. The retrofit CACs, the size of the exchange
and the size of the haircut have all received attention from the financial press. The Greek
deal also hit firsts (or near firsts) in terms of the use of aggregation provisions, the
attempt to link repayments of new bonds and repayments to a multilateral, and in giving
official creditors a veto over changes in bond payment terms or new debt issues beyond
a specified maximum.
For the people of Greece and Europe, however, it is not legal and financial pyrotechnics
that count, but what the restructuring ultimately delivered. In this section, we draw some
normative implications from our case study. Was the decision to restructure Greek debt
the right one? Could Greece (and/or its official creditors and the taxpayers they
represent) have gotten a better deal? Will the restructuring make future debt
restructuring in Europe easier or more difficult? And to what it extent does Greece’s
restructuring provide a template for other Eurozone countries seeking to restructure their
debts?
5.1. Was the restructuring a good idea?
Economic theory answers the question of when it is optimal for countries to default
roughly the same as common sense would. In the presence of default costs – financial
disruptions and output costs – defaults should be rare events, but can be desirable when
countries face high debt and large solvency shocks (see Adam and Grill (2012) and

36
references therein). The presence of collateral damage on other countries – contagion –
changes the interpretation of default costs, but does not change the answer; except for
one key complication: it implies that there may be a second instrument – transfers across
countries – as an alternative to default. This may help ex post, but creates a moral
hazard problem ex ante, since debtor countries have control over their debt levels, the
contracts they enter into and ultimately, their resilience to shocks.
Deciding whether the Greek restructuring was the right decision hence involves two
questions. First, had Greece reached the threshold level of distress and high debt which
would justify a debt restructuring purely from a domestic standpoint, abstracting from
contagion? Second in light of the collateral damage that the Greek restructuring was
likely to inflict on other countries – and arguably did– was there a better alternative?
With respect to the first question, a first pass are the IMF’s debt sustainability analyses
(DSAs), conducted every 3-6 months since the beginning of the May 2010 programme.
While for the first year or so IMF staff reluctantly concluded that Greek debt was
sustainable (although it consistently refused to say that this was true “with high
probability”) the Fund gave up by October 2011, when its DSA noted a more severe
drop in output than expected (projected at -5.5 per cent in -2011 and 3 per cent in 2012),
a slower expected recovery, continued exclusion from capital markets, and lower
privatization proceeds. Under the baseline scenario, the debt to GDP ratio would rise to
184 per cent by 2014 and remain above 130 per cent even in 2030, despite a continued
primary surplus of at least 3.5 per cent.
Was the IMF’s take on Greece too pessimistic? In an analysis conducted a month earlier,
Cline (2011) argued that the preliminary PSI agreement of July 2011 greatly helped debt
sustainability and would suffice if Greece only stuck to its fiscal adjustment targets. In
his baseline scenario the Greek debt ratio would peak at 175 per cent in 2012 and then
fall to 113 per cent by 2020. Several reasons explain Cline’s more favourable view. He
assumed a more optimistic growth path (of +0.6 per cent in 2012, and +2.1 per cent in
2013), as well as higher privatization receipts than the IMF. He also predicted a primary
surplus of 6 to 7 per cent from 2014 onwards. With hindsight, these assumptions do not
seem plausible, particularly for a country with a weak fiscal track record. Between 1990
and 2007, the average Greek primary surplus was 0.6 per cent or GDP despite the
economic prosperity of these two decades.54
This leads to the second question: accepting that the debt was unsustainable; might a
better approach have been to deal with the Greek debt problem through a mixture of
conditionality and large transfers – genuine transfers, not just loans? The Greek PSI
decision arguably contributed to the widening of the Eurozone turmoil in mid-2011,
when the crisis spread to Italy and Spain (see Ardagna and Caselli, 2012). Given the
enormous costs of a Eurozone break-up and the risk of disorderly defaults in larger
countries, would it have been better to resolve the Greek crisis through official transfers
rather than PSI? We do not think so, for three main reasons:
54 See also Cline (2013), in which he takes a darker view of sovereign debt sustainability in Greece.

37
Even after a €100 billion transfer from the private sector and a maturity
extension and interest reduction in its official loans, Moody’s (2012) continues to
consider the Greek debt unsustainable, and the IMF continues to suggest that
further “official sector involvement” in Greece might be needed. Hence, to both
substitute for the private restructuring and address the Greek debt sustainability
issue, the official transfer (not just loan) to Greece would have had to be
enormous. Cross-country transfers of this magnitude should not occur outside a
fiscal union which exercises centralised control.
Even though the decision to restructure was risky, the Eurozone had instruments
to contain these risks – primarily, vested in the European Central Bank – and
eventually exercised them, albeit reluctantly and after an initial learning period.
Finally, the outcome of the March-April exchange itself proved many critics
wrong, some of which had gone as far as arguing that there could be no such a
thing as an orderly debt restructuring (Bini-Smaghi, 2011). Not only was it
orderly, but it took place swiftly (within 6 months since the start of negotiations),
with high participation and no significant legal disputes. The losses imposed by
the restructuring did not trigger knock-on insolvencies of systemically important
institutions. And the much-feared triggering of CDS contracts in March of 2012
went by with barely a whimper (Section 3.2).
We conclude that even if the alternative of a large-scale official transfer had been
politically feasible – which it was not – the debt restructuring was the right thing to do.
It was a necessary, albeit not sufficient, step towards ending the debt crisis.
5.2. Could the restructuring have been handled better?
The Greek restructuring was both unavoidable and successful in the sense of being
orderly, reasonably quick, and in providing significant debt relief. At the same time, it
can be subjected to a battery of criticisms. Most importantly, it was too little, too late, or
both; hence failing to clearly restore Greece’s debt sustainability. The question is
whether this reflected avoidable policy mistakes or unavoidable trade-offs – in the sense
that Greece and its official creditors faced difficult choices, and did their best given what
was feasible. To answer this question, it is helpful to step back and recall the constraints
faced by policymakers at the time.
The design of the Greek restructuring can be interpreted as an attempt to treat creditors
as gently as possible subject to two important Troika-imposed constraints: to reach the
ambitious nominal debt reduction target set in October 2011, and to exclude the holdings
of central banks. Granted, the exchange may not have felt very “gentle” to bondholders
suffering losses of 65 per cent or more, particularly if they were among the majority
whose bond contracts had been retroactively changed by the Greek parliament to make
them easier to restructure. Subject to this, however, the authorities went out of their way
to maximise carrots and minimise sticks in almost every conceivable way, including:
Offering exceptionally high cash “sweeteners” (15% of the value of old debt, the
largest such sweetener ever recorded);
Offering an upgrade of governing law for most creditors (from old Greek law
bonds to new English law bonds), as well as the “co-financing agreement” with

38
the EFSF which tried to align the priority of bondholders with that of some
official loans;
Leaving sovereign guaranteed bonds untouched and outside the reach of the 23.
February bondholder law.
Using domestic law merely to introduce a collective action provision rather than
to change payment terms;
Eschewing legal techniques such as exit consents to discourage potential
holdouts among the holders of English law bonds;
Offering unsuccessful holdouts exactly the same bundle as participating creditors
(as opposed to keeping their old bonds with modified payment terms, for
example, which would have put them at a disadvantage);
Avoiding default threats directed at potential holdouts (with few last-minute
exceptions, see section 3), hence giving the impression that except for the use of
collective action provisions, the exchange was indeed voluntary – and indeed
confirming that impression ex post by repaying holdouts in full and on time;
Carrying out the December buyback at market prices, rather than using a fixed
negotiated buyback price.
Using this approach, the exchange succeeded in meeting the conditions imposed by the
Troika and in avoiding financial collapse in Greece and beyond (with one significant
glitch: the large damage inflicted on Cypriot banks, which unlike their Greek counter-
parts were not compensated for restructuring-related losses). This was no small feat.
At the same time, a number of costly policy mistakes were made with respect to the
timing, design and execution of the exchange – that is, costs to Greece and/or Europe
that cannot be justified either by overall success of the exchange or the objective of
minimising contagion.
First, the restructuring was delayed until it was (almost) too late. Notwithstanding
Greece’s exceptionally dire debt situation, the decision not to seek a restructuring
immediately in April of 2010 (when Greece lost market access) may have been
defensible. It gave Greece a chance to adjust and reform so as to avoid default, and it
gave the remainder of Europe time to bring their fiscal and financial houses in order to
as to minimise the necessary contagion. What cannot be defended, however, is the
continuing delay after the Greek programme had gone off track in early 2011. Time was
wasted on fruitless “soft PSI” discussions, while bonds were continuously being repaid
in full. Implementing a deep restructuring by mid-2011 could have saved at least €10
billion in bond amortisations between July 2011 and early 2012.
Second, the design of the exchange left money on the table, in very large sums.
Appendix 6 presents a number of alternative ways in which the exchange could have
been carried out that could have been used either to significantly increase debt relief or
to reduce the large volume of EFSF financed cash incentives. The costliest mistake in
this regard was the “one size fits all” approach of offering the same bundle of new bonds
and cash to all investors, irrespective of the maturity of their old bonds, and with no
distinction between foreign law bonds and Greek law bonds. Appendix 6 shows that
imposing the same 70 per cent haircut on all investors would have resulted in an
additional debt relief of almost €30 billion in face value terms and €23 billion in present
value terms. A 70 per cent haircut would have been lower than the haircut that was

39
deemed to be acceptable for short term creditors, and hence surely feasible. A
differentiation by governing law, by imposing an additional 5% haircut on Greek law
bondholders, could have achieved a further €24 billion in face value debt relief.
Alternatively it could have been used to reduce official cash incentives by almost €15
billion, or some combination of the two. Of course, implementing this approach would
have meant tougher negotiations – particularly with banks that held longer-dated
instruments – which may well have required more time. But Greece and its official
creditors could have taken that time, either by starting negotiations earlier or by
imposing a moratorium on amortisations so as to push back the March 20th
bond
repayment that effectively became the deadline for the actual negotiations.
Third, the soft approach to private sector holdouts was costly not just for Greece but also
for future European crisis management. For Greece, full private sector participation
could have achieved a further €3 billion in debt relief. More importantly, the decision to
continue servicing the bonds of holdouts on time and in full set a bad precedent for
future debt restructurings in Europe. Given the success of holdouts in the Greek
exchange, small investors will feel encouraged to reject future debt exchange offers. In
addition, larger investors will be emboldened to acquire blocking positions in foreign
law bonds – a strategy that worked well for distressed debt funds in the case of Greece.
The fourth policy error was to conduct the December buyback at market prices (via an
auction mechanism), instead of opting for a negotiated buyback at predetermined prices.
This decision consumed an additional €11 billion in official financing for modest gain.
Appendix 6 shows that a negotiated approach could have achieved significantly higher
debt relief, or required significantly less cash financing, without necessarily making
private creditors worse off relative to where they would have stood in October or the
first half of November. More generally, it would have been better to conduct the March
debt exchange as a full negotiated buyback from the start. Compared to the actual debt
restructuring and buyback, this could have achieved deeper relief, in the order of €40
billion in face value, while saving the official sector cash.
What explains these bad decisions? In our interpretation, they had to do with the huge
distance that the European official sector had to travel between denying the need for any
sovereign debt restructuring in Greece (or anywhere else in Europe) as late as early
2011, and the necessity to implement a deep restructuring. To climb down from its
initial position, the Eurogroup and the ECB resorted to the notion of a voluntary
exchange as an intellectual and political compromise. Unfortunately, this compromise
critically hurt both the timing of the eventual restructuring – via fruitless discussions on
soft PSI options – and weighed negatively on its design.
Other aspects of the restructuring were also problematic – in particular, the decisions to
exempt the central banks from the exchange, and not to bail-in bank bondholders. The
ECB exemption perpetuated the mutual dependency between Greece and its official
creditors and contributed to its continuing debt burden. The full compensation of Greek
banks for PSI-related losses led to a large discrepancy between the treatment of
sovereign bond holders and bank bondholders. It is nonetheless difficult to pass

40
judgment on these decisions, as they involved real trade-offs. Political and legal
constraints with respect to ECB participation could have prevented the debt restructuring
from happening in the first place.55
And combining a sovereign restructuring with a bail-
in of bank bondholders clearly would have made the restructuring operation more
difficult to manage and perhaps more risky with respect to contagion.
To summarise, the debt restructuring could have been handled better, even without
involving the ECB or bailing in bank bondholders. In particular, it should have been
conducted earlier and used a different design, involving modestly higher average present
haircuts applied consistently to all bondholders. The combination of earlier timing (for
example, conducting an exchange in June of 2011 rather than March/April of 2012) and
different design would have achieved additional debt relief of perhaps €60 billion in face
value terms and €45 billion in present value terms – almost 25 per cent of GDP. This
would almost surely have been sufficient to make the remaining Greek debt sustainable.
5.3. Implications for future sovereign debt restructurings in Europe
What does the Greek case teach us for future sovereign debt restructurings in Europe?
At first glance, it would appear that the techniques used with Greece would be readily
applicable elsewhere in the monetary union. After all, most Eurozone nations share the
key characteristic that enabled Greece’s restructuring – over 90 per cent of their debt
stock is governed by local law. Greece also used a new bargaining approach, which
combined a classic creditor committee with a take-it-or-leave-it exchange offer. This
two-part negotiation scheme proved to be suitable vehicle in a context in which banks
are the main type of creditors, as is the case in many other European countries.
Moreover, the Greek deal showed that having local law debt instruments can ease
restructuring ex post. Countries like Italy, Spain and Ireland, could use retrofit CACs to
restructure sovereign debt and achieve high creditor participation just the way Greece
did. Local law also opens the option to offer a seniority upgrade, meaning that creditors
can be offered new foreign law bonds as a sweetener to dissuade free riders in a debt
exchange. More generally, in a situation of debt distress, countries may exploit the fear
of local law instruments by swapping them against foreign law bonds at a discount – a
purely voluntary operation, but one that might achieve a haircut (Gulati and Zettelmeyer,
2012b). So the Greek deal did contain some elements that are worth imitating.
However, there are at least four reasons why the approach chosen in Greece will be
difficult to imitate elsewhere in Europe:
First, in many countries, bond contracts and/or the legal environment are not as
restructuring-friendly as in Greece. The U.S. constitution, for example, guarantees the
payment of the federal government’s debts. A similar example is Cyprus, where the
constitution envisages that government debt payments take priority over most other
obligations of the state. Removing a constitutional protection is possible, but harder than
a simple legislative action. Cyprus also has a much higher share of foreign-law bonds
55 Importantly, this argument rationalises some form of special treatment for the ECB, but not the fact that the ECB
was excluded from the restructuring entirely, without (until late November 2012) making any commitment to
returning profits on Greek bondholdings to Greece.
41
(close to half were issued under English jurisdiction). The same is true for Estonia,
Slovakia and Slovenia and many emerging market economies. In these contexts, retrofit
CACs via parliamentary legislation are not a solution.
Second, we expect that more creditors will be encouraged to hold out and litigate instead
of accepting future exchange offers, for two reasons. First, due to the precedent of
treating holdouts so gently in Greece, as already discussed; and second, two major court
decisions unrelated to Greece, Assenagon Asset Management SA v. Irish Bank
Resolution Corporation Ltd. and NML Capital Ltd. v. Republic of Argentina (the former
under English law and the latter under New York law) which have arguably enhanced
the ability of holdout creditors to block restructurings.56
Holdouts and legal disputes are
therefore likely to become a more serious stumbling block than they were in Greece.57
Third, the Greek restructuring approach required large volumes of official financing. In
total, about €87 billion, 45 per cent of 2012 GDP, were transferred in cash and
underwritten by the European taxpayer, who became the main holder of Greek sovereign
risk. As a result, there is no private “buffer” left at this point that could protect the
European taxpayer from the consequences of a deterioration of the crisis. In future
restructurings, some cash transfers may be avoided by bailing in bank creditors, but the
rest is the price of the idea of implementing “voluntary” debt restructurings and of
taking a soft approach to dissuading free riding. Cash transfers of this scale could be
spent otherwise – for example, on crisis lending that helps sustain public investment or
social spending while a country is adjusting. Moreover, rescue money is becoming
scarce in the Eurozone, both because of public and political opposition to further
bailouts and because the pool of available resources is shrinking, as demand continues to
increase and the potential roles of the EFSF/ESM are being expanded (most recently to
direct recapitalisation of banks).
Finally and perhaps most importantly, a large fraction of the bonds issued by the weaker
Eurozone sovereigns have been moving out of the hands of foreign investors and into
the hands of local banks and other domestic institutions (Brutti and Sauré, 2013). That
means that any significant restructuring of the government’s debt will present the danger
of causing an internal banking crisis. Of course, this is the very reason why the
migration of sovereign debt to domestic holders, and banks in particular, could be
happening. Domestic banks are relatively immune from restructurings because they
expect to be recapitalised, for financial stability reasons, if their losses from domestic
sovereign bond holdings are sufficiently high. Indeed, if the holdings of the banking
system as a whole are high enough, the restructuring will likely not happen at all (see
Broner et al. 2010).
Hence, we conclude that the Greek debt restructuring approach can be useful in specific
cases, but it falls far short of providing a template that could be a permanent fixture of
the European financial architecture.
56 The cases are at [2012] EWHC 2090 and 699 F.3d 246 (2d. Cir. 2012) respectively. See Gelpern (2013). 57 Schumacher et al. (2013) document the rise of creditor litigation in sovereign debt markets since the 1970s. In
recent years, about 50 per cent of debt restructurings involved legal disputes.
42
Is help already on the way? Eurozone countries have recently agreed to introduce CACs
into all new sovereign debt from January 2013 on, regardless of governing law.
However, as the case of Greece illustrates, CACs are no panacea, as they need to be
voted on bond by bond (see Gelpern and Gulati, 2013). It is telling that distressed debt
investors explicitly targeted Greek bonds with English-law CACs: these holdout
investors succeeded by purchasing blocking minorities in individual bond series, which
could not be offset by pro-restructuring majorities elsewhere. While Eurozone CACs
contain an “aggregation feature” that allows changes at the individual bond level to be
decided with a lower majority if enough investors across all bonds vote for a
restructuring, this feature is weak. First, the aggregate voting threshold is higher than in
the Greek “retrofit” CAC (75 rather than 66.67 per cent). Second, Euro-CACs require at
least a 66.67 per cent vote in each individual bond issuance, while in Greece it was
sufficient to reach this threshold in aggregate.58
This means that the holdout problem
faced by Greece would not be avoided.59
Against this backdrop, it may be time for setting up a more systematic mechanism to
deal with restructurings in Europe. One solution would be to reform the newly
introduced Euro-CACs in a way that they allow aggregation across bond series, without
bond-by-bond voting. However, even if this happened, it will take another 5 to 10 years
until they will be contained in the majority of Eurozone sovereign bonds. Until then,
there will be a mixed regime of pre-2013 bonds (mostly without CACs), and post-2013
bonds (with Euro-CACs). All of this does not inspire confidence that European
sovereigns will have an easier time in future restructurings, especially if there is less
public money to finance cash incentives or collateral to minimise holdouts.
A more ambitious but immediate solution could be achieved in a fairly straightforward
fashion by modifying the treaty of the European Stability Mechanism to say that the
assets and revenues of any Eurozone member nation that is undertaking an ESM-
endorsed debt restructuring will be immune from attachment by holdout creditors (see
Buchheit, Gulati and Tirado, 2013). A template for doing so exists already, and has
worked in the context of Iraq’s post-war restructuring of 2006.60
Such a restructuring
approach, in pre-agreed circumstances and based on pre-agreed principles, could have
more political and legal legitimacy than the current system, with its ad hoc debt
exchanges that rely either on threats towards creditors or on retroactive changes in
domestic law.
Whatever the specific approach, it is essential to make it less likely that the day of
reckoning will again be postponed at great social and economic cost, as happened in
Greece.
58 Details on the Euro-CACs are provided by the following note. Clifford Chance – Briefing Note, 2012. Euro Area
Member States Take Collective Action to Facilitate Sovereign Debt Restructuring, December
(http://www.cliffordchance.com/publicationviews/publications/2012/12/euro_area_me). 59 In the 17 out of the 18 bonds for which amendments were voted on bond-by-bond in the Greek restructuring, the
blocking majority was well above the 33.34 threshold required to block an amendment attempt under Euro-CACs. 60 United Nations Resolution 1483 (May 22, 2003) put into place instructions to enable the restructuring of Iraq’s
debts after Saddam Hussein’s removal. In response to the resolution, legislation was passed in both the EU and US
and, as a result, Iraq was able to obtain close to a 90 NPV reduction of its external long-term debts.

43
References
Adam, Klaus. 2012. “Greek Bond Buyback Boondoggle”, Wall Street Journal, October
22, 2012.
Adam, Klaus and Michael Grill. 2012. Optimal Sovereign Default, mimeo; University of
Mannheim.
Aguiar, Mark and Manuel Amador, 2013. “Sovereign Debt”, chapter prepared for the
Handbook of International Economics, Vol. 4.
Aitor Erce, 2012. "Selective Sovereign Defaults," Globalization and Monetary Policy
Institute Working Paper 127, Federal Reserve Bank of Dallas.
Ardagna, Silvia, Caselli, Francesco and Timothy Lane, 2007. "Fiscal Discipline and the
Cost of Public Debt Service: Some Estimates for OECD Countries," The B.E. Journal
of Macroeconomics, 7(1).
Ardagna, Silvia, and Francesco Caselli, 2012. “The Political Economy of the Greek
Debt Crisis: A Tale of Two Bailouts”, Centre for Economic Performance Special Paper
No. 25, March, London School of Economics.
Barclays, 2011. “Euro: Greek Top 40 and the ‘Voluntary’ Question “Global Rates
Strategy Report, 17 June 2011
Bi, Ran, Marcos Chamon, and Jeromin Zettelmeyer, 2011. “The Problem that Wasn't:
Coordination Failures in Sovereign Debt Restructurings”, IMF Working Paper 11/265.
Bini Smaghi, Lorenzo. 2011. “Private sector involvement: From (good) theory to (bad)
practice”. Speech at the Reinventing Bretton Woods Committee, Berlin, 6 June 2011
(http://www.ecb.int/press/key/date/2011/html/sp110606.en.html)
Broner, Fernando, Martin, Alberto, and Jaume Ventura, 2006. "Sovereign Risk and
Secondary Markets," American Economic Review, 100(4): 1523-55.
Brutti, Filippo and Philip Sauré, 2013. “Repatriation of Debt in the Euro Crisis.
Evidence for the Secondary Market Theory.” mimeo, University of Zurich.
http://papers.ssrn.com/sol3/papers.cfm?abstract_id=2253404
Buchheit, Lee C., and Mitu Gulati, 2000. “Exit Consents in Sovereign Bond
Exchanges”, 48 UCLA Law Review 59-89.
Buchheit, Lee C., and Mitu Gulati, 2010. “How to Restructure Greek Debt”, Duke Law
School Working Paper (http://papers.ssrn.com/sol3/papers.cfm?abstract_id=1603304).
Buchheit, Lee, Gulati, Mitu and Ignacio Tirado, 2013. “The Problem of Holdout
Creditors in Eurozone Sovereign Debt Restructurings,” Duke Law School Working
Paper (http://ssrn.com/abstract=2205704).
Bulow, Jeremy, and Kenneth Rogoff, 1988. “The Buyback Boondoggle”, Brookings
Papers on Economic Activity, 675-697.
Cabral, Ricardo, 2011. “Greece’s 2nd bailout: Debt restructuring with no debt
reduction?” http://www.voxeu.org/article/how-much-will-new-greek-bailout-cost-
private-bondholders

44
Chalk, Nigel and Richard Hemming, 2000. “Assessing Fiscal Sustainability in Theory
and Practice.” IMF Working Paper No. 00/81.
Claessens, Stijn and Giovanni Dell’Ariccia, 2011. “Are Buybacks an Efficient Way to
Reduce Sovereign Debt?, Vox, March (http://www.voxeu.org/article/are-buybacks-
efficient-way-reduce-sovereign-debt).
Cline, William, 1995. International Debt Reexamined. Washington, DC: Institute for
International Economics.
Cline, William, 2011. “Sustainability of Greek Public Debt” Peterson Institute Policy
Brief 11-15, October 2011.
Cline, William, 2013. “Debt Restructuring and Economic Prospects in Greece” Peterson
Institute Policy Brief 13-3, February 2013.
Cruces, Juan J., and Christoph Trebesch. 2013, “Sovereign Defaults: The Price of
Haircuts,” American Economic Journal: Macroeconomics, 5(3): 86–118.
Das, Udaibir, Papaioannou, Michael, and Christoph Trebesch, 2012.“Sovereign Debt
Restructurings 1950–2010: Literature Survey, Data, and Stylized Facts.” IMF Working
Paper 12/203.
Dias, Daniel, Richmond, Christine and Mark L.J. Wright, 2012. “In for a Penny, In for
100 Billion Pounds: Quantifying the Welfare Benefits from Debt Forgiveness.”
mimeo, UCLA.
Dooley, Michael. 1989. “Buybacks, Debt-Equity Swaps, Asset Exchanges and Market
Prices of External Debt”, in Jacob Frenkel and others (eds.), Analytical Issues in Debt,
International Monetary Fund.
Duffie, Darrell and Mohit Thukral. 2012. “Redesigning Credit Derivatives to Better
Cover Sovereign Default Risk”, Stanford University Rock Center Working Paper 118.
Enderlein, Henrik, Christoph Trebesch, and Laura von Daniels, 2012. “Sovereign Debt
Disputes. A Database on Government Coerciveness in Debt Crises.” Journal of
International Money and Finance, vol. 31(2), pp. 250-266.
Froot, Kenneth A. 1989. “Buybacks, Exit Bonds, and the Optimality of Debt and
Liquidity Relief.” International Economic Review, 30(1): 49-70.
Gelpern, Anna, 2013. “Sovereign Damage Control.” Peterson Institute for International
Economics Policy Brief, May.
Gelpern, Anna, and Mitu Gulati. 2012. “CDS Zombies.” European Business
Organization Law Review, forthcoming
(http://papers.ssrn.com/sol3/papers.cfm?abstract_id=2138901&download=yes).
Gelpern, Anna and Mitu Gulati. 2013. “The Wonder Clause.” Forthcoming, Journal of
Comparative Economics.
Ghezzi, Piero, Aksu, Cagdas and Antonio Garcia Pascual, 2011. “Euro Themes: Greece
- Assessing the new debt proposal” Barclays Capital Research Note, 26 July 2011.
Gulati, Mitu, and Jeromin Zettelmeyer. 2012a. “Making a Voluntary Greek Debt
Exchange Work.” CEPR Discussion Paper 8754, January, forthcoming Capital
Markets Law Journal. (http://papers.ssrn.com/sol3/papers.cfm?abstract_id=1979474).
45
Gulati, Mitu, and Jeromin Zettelmeyer. 2012b. “In the Slipstream of the Greek Debt
Exchange,” VoxEU, March 2012. (http://www.voxeu.org/article/slipstream-greek-
debt-exchange)
IMF, 2011. Greece: Fourth Review Under the Stand-By Arrangement and Request for
Modification and Waiver of Applicability of Performance Criteria. IMF Country
Report No. 11/175, July.
IMF, 2012. World Economic Outlook, April 2013.
IMF, 2013. “Greece: First and Second Reviews Under the Extended Arrangement Under
the Extended Fund Facility” IMF Country Report No. 13/20, January 2013
http://www.imf.org/external/pubs/ft/scr/2013/cr1320.pdf
Kopf, Christian, 2011. “An Evaluation of the French Proposal for a Restructuring of
Greek debt.” CEPS Policy Brief, No. 247, July 2011.
Krugman, Paul. 1989. “Market-Based Debt Reduction Schemes”, in Jacob Frenkel and
others (eds.), Analytical Issues in Debt, International Monetary Fund.
Krugman, Paul, Kenneth Froot, Stijn Claessens, and Ishac Diwan. 1991. “Market-Based
Debt Reduction: Principles and Prospects”, World Bank Policy Research Paper 16.
Lane, Philip R. 2012. “The European Sovereign Debt Crisis,” Journal of Economic
Perspectives, 26(3): 49-68.
Manasse, Paolo. 2011. “Unilateral Restructuring, Buybacks and Euro Swaps: An
Example”, VoxEU.org, 5 February.
Panizza, Ugo, Federico Sturzenegger, and Jeromin Zettelmeyer, 2009. “The Economics
and Law of Sovereign Debt and Default” Journal of Economic Literature, 47(3): 653–
700.
Porzecanski, Arturo, 2013. “Behind the Greek Default and Restructuring of 2012.
Forthcoming in Sovereign Debt and Debt Restructuring: Legal, Financial and
Regulatory Aspects, ed. by Eugenio A. Bruno (London: Globe Business Publishing,
2013).
Reinhart, Carmen, and Kenneth Rogoff, 2009. This Time is Different: Eight Centuries of
Financial Folly, Princeton: Princeton University Press.
Schumacher, Julian, Trebesch, Christoph and Henrik Enderlein. 2013. “Sovereign
Defaults in Court: The Rise of Creditor Litigation.“ available at:
http://papers.ssrn.com/sol3/papers.cfm?abstract_id=2189997
Sterne, Gabriel, 2012. “Greek Debt Proposals: Hanging on to Hope or Off a
Rope?”Exotix Sovereign Research Note, November 8, 2012.
Sturzenegger, Federico, and Jeromin Zettelmeyer, 2007a. Debt Defaults and Lessons
from a Decade of Crises. Cambridge, MA: MIT Press.
Sturzenegger, Federico, and Jeromin Zettelmeyer, 2007b. “Creditors Losses Versus
Debt Relief: Results from a Decade of Sovereign Debt Crises.” Journal of the
European Economic Association, 5(2): 343–351.

46
Sturzenegger, Federico, and Jeromin Zettelmeyer, 2008. “Haircuts: Estimating Investor
Losses in Sovereign Debt Restructurings, 1998-2005.” Journal of International Money
and Finance, 27(5): 780–805.
Tomz, Michael and Mark L.J. Wright, 2013. "Empirical Research on Sovereign Debt
and Default," NBER Working Paper 18855.
Weidemaier, Mark, Robert Scott, and Mitu Gulati, 2012. “Origin Myths, Contracts and
the Hunt for Pari Passu,” (forthcoming Law and Social Inquiry)
(http://papers.ssrn.com/sol3/papers.cfm?abstract_id=1633439)
Wright, Mark L. J., 2011. The Theory of Sovereign Debt and Default, Paper prepared
for the Encyclopedia of Financial Globalization.

APPENDIX
47
Appendix 1. New Instruments Issued in the March/April Greek Debt Exchange
The Hellenic Republic offered eligible creditors a bundle of three new instruments.
Specifically, participating investors received the following bundle for every old bond:
1) 15% of face value in the form of EFSF notes in two separate series. 50% will be
due in March 2013 and carry a coupon of 0.4%. The other 50% are due in March
2014 with a coupon of 1%.
2) 31.5% of face value in the form of new English-law bonds with a maturity of up
to 30 years (until 2042). Rather than issuing one bond, Greece issued a bundle of
20 new bonds each maturing in a different year starting in 2023. This replicates
an (almost even) amortisation schedule of 5 per cent per cent per annum between
2023 and 2042. The coupon on the new bonds will be 2% from February 2012
until February 2015, 3% from February 2015 until February 2020, 3.65% in
2021 and 4.3% from February 2020 until February 2042.
3) A set of detachable GDP-linked securities, which offer a modest increase in the
coupon on the new principal of up to 1% provided that real growth and nominal
GDP exceed a specified path from 2015 onwards. These targets closely resemble
IMF GDP projections as of early 2012.
Any accrued interest (due from 24 February 2012 until the exchange date) was paid in
the form of a six-month EFSF zero coupon note.
The EFSF Notes
Issuance Amounts to 15% of face value of the old bonds
Final Maturity
12 March 2013 and 12 March 2014, respectively, for each of the
two series
Coupon Fixed at 0.4% for the 2013 Notes and 1% for the 2014 Notes.
Start of interest payments 12 March 2012
Issue Price 100 per cent. of the Aggregate Nominal Amount
Form Global Bearer Note deposited with Clearstream, Frankfurt
Listing Luxembourg
Clearing
The Notes will clear through Clearstream, Frankfurt
Governing law English law
Source: Credit Suisse (2012) and Greek Ministry of Finance (Press Releases and Offering Memoranda)

APPENDIX
48
The new Greek government bonds
Issuance Amounts to 31.5% of face value of the old bonds. 20 series of
equal nominal value due between 2023 and 2042.
Final Maturity 2042
Coupon Fixed at
2.0 % per year for payment dates in 2012, 2013, 2014, 2015
3.0% per year for payment dates in 2016, 2017, 2018, 2019, 2020
3.65% per annum for payment date in 2021
4.3% per annum for payment dates in 2022 and thereafter
Amortization
Starts in on the eleventh anniversary of the issue date
(12.03.2023) with equal principal repayment across 20 years. In
practice this is achieved because the first of the 20 bonds matures
in 2023 and the last in 2042
Start of interest payments 12 March 2012
Listing Athens Stock Exchange and the Electronic Secondary Securities
Market Listing (HDAT) operated by the Bank of Greece
Clearing All New Bonds will clear through the Bank of Greece (BOGs)
clearing system
Negative Pledge Yes
Collective Action Clause The New Bonds will contain new Euro-CACs, based on the draft
collective action clause published by the EU Economic and
Financial Committee’s Sub-Committee on EU Sovereign Debt
Markets.
Co-financing agreement Holders of the New Bonds will be entitled to the benefit of, and
will be bound by, a Co-Financing Agreement among, inter alios,
the Republic, the New Bond Trustee and the European Financial
Stability Facility (the “EFSF”) linking the New Bonds to the
Republic’s loan from the EFSF of up to EUR30 billion in a
variety of ways, including the appointment of a common paying
agent, the inclusion of a turnover covenant and the payment of
principal and interest on the New Bonds and the EFSF loan on
the same dates and on a pro rata basis
Source: Credit Suisse (2012) and Greek Ministry of Finance (Press Releases and Offering Memoranda)
GDP warrant
A detachable GDP warrant was issued along with each new government bond. Each
warrant has a face value which initially equals the face value of the new bond and is
reduced by about 5% per year from 2024 to 2042 (replicating the bond amortization
schedule). The notional amount is only used to calculate the annual payments (see
below). Holders are not entitled to receive principal.

APPENDIX
49
Dates of potential payment are on Oct. 15th
every year, starting from 2015 until the final
payment date in 2042. The payments depend upon and are determined on the basis of
GDP performance in the following way:
Condition for Payments: Annual payments are only made if each of the following
three conditions is met:
o Nominal GDP in the year preceding any payment must equal or exceed
the Reference Nominal GDP (see Table A1)
o Real GDP Growth must equal or exceed the Reference Real GDP Growth
Rate (Table A1)
o Real GDP Growth must equal or exceed 0
The Nominal GDP and the Real GDP Growth Rate (year on year changes) are
those published by EUROSTAT.61
Table A1: Reference GDP path for warrant payments
Source: Greek Ministry of Finance
Size of Payments: The warrants pay a maximum of 1% of the initial notional.
More specifically, the size of the payments is computed as follows:
Payment Amount = GDP Index Per cent Per cent age x Notional
where the GDP Index Per cent Per cent age equals
1.5 x [Real GDP Growth Rate – Reference Real GDP Growth Rate],
and the Notional in each year is determined as shown in Table A2.
The GDP Index Per cent Per cent age is set to zero if the real growth rate is below
0 or below the reference real growth rate (see above).
61 The Offering Memoranda notes the following: “From and including 2021, if the Real GDP Growth Rate for any
calendar year preceding the Reference Year is negative, the Real GDP Growth Rate for Reference Year shall be
deemed to be the sum of the Real GDP Growth Rates for both such years”
Reference YearReference Nominal
GDP level (€ mn)
Reference Real
GDP growth (yoy)
2014 210.1014 2.345000%
2015 217.9036 2.896049%
2016 226.3532 2.845389%
2017 235.7155 2.796674%
2018 245.4696 2.596544%
2019 255.8822 2.496864%
2020 266.4703 2.247354%
2020-2041 266.4703 2.000000%

APPENDIX
50
Table A2: Notional for each Reference Year
Source: Source: Greek Ministry of Finance
Finally, it should be noted that the Greek Government can “call” the warrants anytime
from 2020 on, based on a trailing 30 day market price.
Date
Fraction of
Original
Notional
Original
Notional
Notional
(%)
Up to 15-Oct-23 315 315 100.00%
15-Oct-24 300 315 95.24%
15-Oct-25 285 315 90.48%
15-Oct-26 270 315 85.71%
15-Oct-27 255 315 80.95%
15-Oct-28 240 315 76.19%
15-Oct-29 224 315 71.11%
15-Oct-30 208 315 66.03%
15-Oct-31 192 315 60.95%
15-Oct-32 176 315 55.87%
15-Oct-33 160 315 50.79%
15-Oct-34 144 315 45.71%
15-Oct-35 128 315 40.63%
15-Oct-36 112 315 35.56%
15-Oct-37 96 315 30.48%
15-Oct-38 80 315 25.40%
15-Oct-39 64 315 20.32%
15-Oct-40 48 315 15.24%
15-Oct-41 32 315 10.16%
15-Oct-42 16 315 5.08%
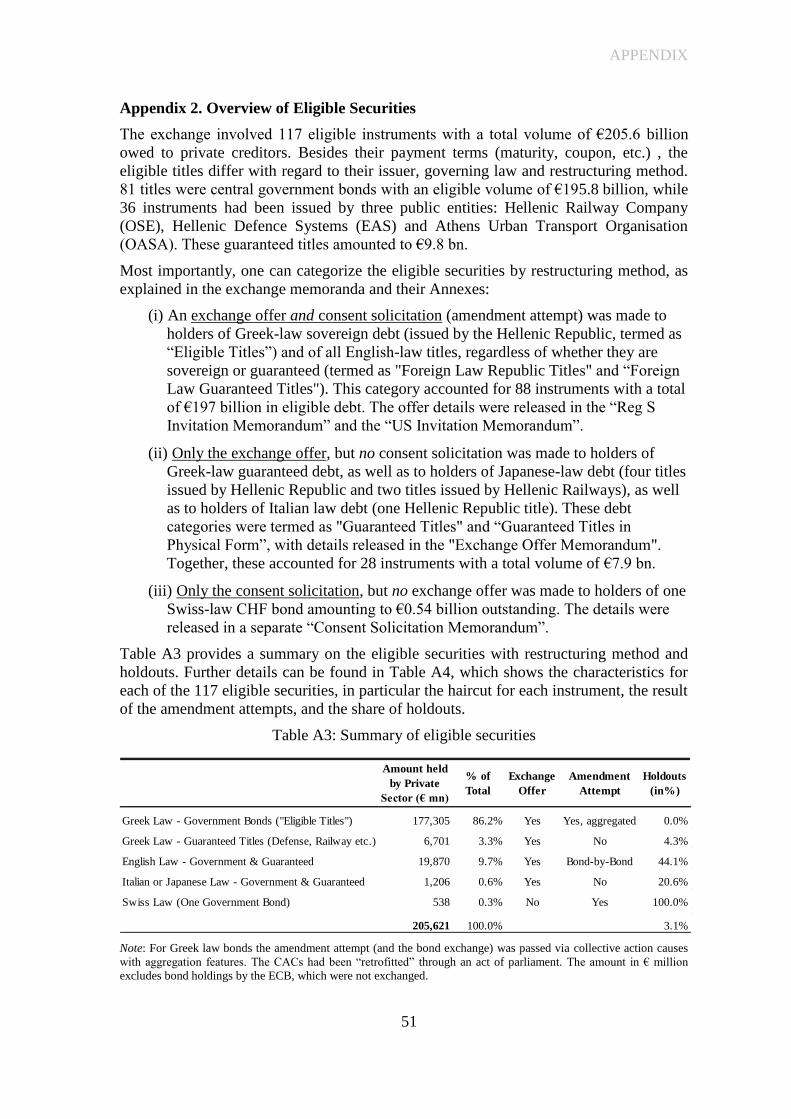
APPENDIX
51
Appendix 2. Overview of Eligible Securities
The exchange involved 117 eligible instruments with a total volume of €205.6 billion
owed to private creditors. Besides their payment terms (maturity, coupon, etc.) , the
eligible titles differ with regard to their issuer, governing law and restructuring method.
81 titles were central government bonds with an eligible volume of €195.8 billion, while
36 instruments had been issued by three public entities: Hellenic Railway Company
(OSE), Hellenic Defence Systems (EAS) and Athens Urban Transport Organisation
(OASA). These guaranteed titles amounted to €9.8 bn.
Most importantly, one can categorize the eligible securities by restructuring method, as
explained in the exchange memoranda and their Annexes:
(i) An exchange offer and consent solicitation (amendment attempt) was made to
holders of Greek-law sovereign debt (issued by the Hellenic Republic, termed as
“Eligible Titles”) and of all English-law titles, regardless of whether they are
sovereign or guaranteed (termed as "Foreign Law Republic Titles" and “Foreign
Law Guaranteed Titles"). This category accounted for 88 instruments with a total
of €197 billion in eligible debt. The offer details were released in the “Reg S
Invitation Memorandum” and the “US Invitation Memorandum”.
(ii) Only the exchange offer, but no consent solicitation was made to holders of
Greek-law guaranteed debt, as well as to holders of Japanese-law debt (four titles
issued by Hellenic Republic and two titles issued by Hellenic Railways), as well
as to holders of Italian law debt (one Hellenic Republic title). These debt
categories were termed as "Guaranteed Titles" and “Guaranteed Titles in
Physical Form”, with details released in the "Exchange Offer Memorandum".
Together, these accounted for 28 instruments with a total volume of €7.9 bn.
(iii) Only the consent solicitation, but no exchange offer was made to holders of one
Swiss-law CHF bond amounting to €0.54 billion outstanding. The details were
released in a separate “Consent Solicitation Memorandum”.
Table A3 provides a summary on the eligible securities with restructuring method and
holdouts. Further details can be found in Table A4, which shows the characteristics for
each of the 117 eligible securities, in particular the haircut for each instrument, the result
of the amendment attempts, and the share of holdouts.
Table A3: Summary of eligible securities
Note: For Greek law bonds the amendment attempt (and the bond exchange) was passed via collective action causes
with aggregation features. The CACs had been “retrofitted” through an act of parliament. The amount in € million
excludes bond holdings by the ECB, which were not exchanged.
Amount held
by Private
Sector (€ mn)
% of
Total
Exchange
Offer
Amendment
Attempt
Holdouts
(in%)
Greek Law - Government Bonds ("Eligible Titles") 177,305 86.2% Yes Yes, aggregated 0.0%
Greek Law - Guaranteed Titles (Defense, Railway etc.) 6,701 3.3% Yes No 4.3%
English Law - Government & Guaranteed 19,870 9.7% Yes Bond-by-Bond 44.1%
Italian or Japanese Law - Government & Guaranteed 1,206 0.6% Yes No 20.6%
Swiss Law (One Government Bond) 538 0.3% No Yes 100.0%
205,621 100.0% 3.1%

APPENDIX
52
Table A4: Characteristics and haircut of each bond
Part A: Greek law government bonds
Source: Greek Ministry of Finance (exchange offer memoranda). Note: The amount in € million excludes bond
holdings by the ECB, which were not exchanged. The haircut estimates with “uniform rate” are based on a 15.3%
discount rate. The imputed yield curve rates used for computing the alternative “yield curve” haircut measure is
discussed in Appendix 4 below.
Issuer ISIN CurrencyGoverning
LawMaturity
Amount held
by Private
Sector (€ mn)
Haircut
(uniform
rate)
Haircut
(yield
curve)
Amendment
Outcome
Holdouts
(in %)
Hellenic Republic GR0110021236 EUR Greek Law 20/03/2012 9765.6 69.1 78.2 passed 0%
Hellenic Republic GR0124018525 EUR Greek Law 18/05/2012 4665.7 69.1 77.7 passed 0%
Hellenic Republic GR0124020547 EUR Greek Law 20/06/2012 413.7 68.6 77.2 passed 0%
Hellenic Republic GR0106003792 EUR Greek Law 30/06/2012 140.3 67.3 76.3 passed 0%
Hellenic Republic GR0114020457 EUR Greek Law 20/08/2012 4586.0 68.4 76.8 passed 0%
Hellenic Republic GR0326042257 EUR Greek Law 22/12/2012 2026.3 65.7 73.9 passed 0%
Hellenic Republic GR0508001121 EUR Greek Law 31/12/2012 22.9 67.2 75.6 passed 0%
Hellenic Republic GR0512001356 EUR Greek Law 20/02/2013 5376.7 66.8 74.2 passed 0%
Hellenic Republic GR0110022242 EUR Greek Law 31/03/2013 36.4 67.8 76.1 passed 0%
Hellenic Republic GR0124021552 EUR Greek Law 20/05/2013 4490.6 67.7 73.8 passed 0%
Hellenic Republic GR0128001584 EUR Greek Law 20/05/2013 1492.7 69.4 75.2 passed 0%
Hellenic Republic GR0124022568 EUR Greek Law 03/07/2013 326.0 66.8 72.1 passed 0%
Hellenic Republic GR0110023257 EUR Greek Law 31/07/2013 64.3 72.5 78.6 passed 0%
Hellenic Republic GR0114021463 EUR Greek Law 20/08/2013 3680.2 67.5 72.2 passed 0%
Hellenic Republic GR0124023574 EUR Greek Law 30/09/2013 149.4 83.4 85.5 passed 0%
Hellenic Republic GR0326043263 EUR Greek Law 22/12/2013 1853.8 62.9 65.2 passed 0%
Hellenic Republic GR0128002590 EUR Greek Law 11/01/2014 2699.0 67.5 69.2 passed 0%
Hellenic Republic GR0124024580 EUR Greek Law 20/05/2014 4368.7 66.6 65.9 passed 0%
Hellenic Republic GR0124025595 EUR Greek Law 01/07/2014 394.0 66.2 63.9 passed 0%
Hellenic Republic GR0112003653 EUR Greek Law 25/07/2014 155.4 65.7 69.1 passed 0%
Hellenic Republic GR0114022479 EUR Greek Law 20/08/2014 8541.2 66.9 64.2 passed 0%
Hellenic Republic GR0112004669 EUR Greek Law 30/09/2014 85.7 71.0 75.7 passed 0%
Hellenic Republic GR0514020172 EUR Greek Law 04/02/2015 2020.0 65.9 59.1 passed 0%
Hellenic Republic GR0124026601 EUR Greek Law 20/07/2015 6093.5 64.1 54.5 passed 0%
Hellenic Republic GR0114023485 EUR Greek Law 20/08/2015 4811.7 67.0 58.9 passed 0%
Hellenic Republic GR0114024491 EUR Greek Law 30/09/2015 171.4 69.4 72.2 passed 0%
Hellenic Republic GR0124027617 EUR Greek Law 10/11/2015 375.0 67.5 57.3 passed 0%
Hellenic Republic GR0516003606 EUR Greek Law 21/05/2016 170.3 65.3 66.5 passed 0%
Hellenic Republic GR0124028623 EUR Greek Law 20/07/2016 5442.4 62.7 50.4 passed 0%
Hellenic Republic GR0116002875 EUR Greek Law 13/09/2016 142.9 65.4 65.2 passed 0%
Hellenic Republic GR0326038214 EUR Greek Law 27/12/2016 334.3 53.3 32.8 passed 0%
Hellenic Republic GR0118014621 EUR Greek Law 01/03/2017 342.9 66.1 67.0 passed 0%
Hellenic Republic GR0528002315 EUR Greek Law 04/04/2017 4937.0 61.4 48.1 passed 0%
Hellenic Republic GR0118012609 EUR Greek Law 20/04/2017 3646.2 66.6 57.5 passed 0%
Hellenic Republic GR0518072922 EUR Greek Law 01/07/2017 415.5 62.1 60.8 passed 0%
Hellenic Republic GR0518071916 EUR Greek Law 01/07/2017 71.6 64.6 59.3 passed 0%
Hellenic Republic GR0124029639 EUR Greek Law 20/07/2017 7562.5 62.9 51.0 passed 0%
Hellenic Republic GR0118013615 EUR Greek Law 09/10/2017 214.3 59.6 57.3 passed 0%
Hellenic Republic GR0120003141 EUR Greek Law 03/04/2018 440.0 66.1 65.7 passed 0%
Hellenic Republic GR0124030645 EUR Greek Law 20/07/2018 5875.8 63.7 52.4 passed 0%
Hellenic Republic GR0122002737 EUR Greek Law 27/02/2019 112.0 64.4 59.7 passed 0%
Hellenic Republic GR0122003743 EUR Greek Law 04/03/2019 425.0 67.4 64.1 passed 0%
Hellenic Republic GR0124031650 EUR Greek Law 19/07/2019 11747.6 65.2 55.2 passed 0%
Hellenic Republic GR0120002135 EUR Greek Law 17/09/2019 350.0 65.0 58.6 passed 0%
Hellenic Republic GR0133001140 EUR Greek Law 22/10/2019 6175.0 65.0 54.5 passed 0%
Hellenic Republic GR0124032666 EUR Greek Law 19/06/2020 3633.7 65.7 56.1 passed 0%
Hellenic Republic GR0133002155 EUR Greek Law 22/10/2022 7623.3 64.7 53.8 passed 0%
Hellenic Republic GR0133003161 EUR Greek Law 20/03/2024 9156.9 59.4 48.1 passed 0%
Hellenic Republic GR0338001531 EUR Greek Law 25/07/2025 8584.9 56.5 41.0 passed 0%
Hellenic Republic GR0133004177 EUR Greek Law 20/03/2026 6063.3 61.0 50.5 passed 0%
Hellenic Republic GR0338002547 EUR Greek Law 25/07/2030 8244.8 46.5 27.0 passed 0%
Hellenic Republic GR0138001673 EUR Greek Law 20/09/2037 8867.2 49.9 34.6 passed 0%
Hellenic Republic GR0138002689 EUR Greek Law 20/09/2040 7920.0 39.3 35.2 passed 0%

APPENDIX
53
Table A4 (Ct’d) - Part B: Foreign law titles
Notes: The entry “not attempted” means that no consent solicitation (amendment attempt) was made to the holders.
The amount in € million excludes bond holdings by the ECB, which were not exchanged. The haircut estimates with
“uniform rate” are based on a 15.3% discount rate. The imputed yield curve rates used for computing the alternative
“yield curve” haircut measure is discussed in in Appendix 4 below.
1/ Inquorate (and not adjourned) according to April 2 press release and April 3 "Notice of Result I-W". However, an
April 11 press release suggests that a special deal with these bondholders was struck.
2/ Inquorate according to April 2 press release. Since only consents had been solicited (no exchange solicitation)
this presumably means no outstanding principal was exchanged.
Issuer ISIN CurrencyGoverning
LawMaturity
Amount held
by Private
Sector (€ mn)
Haircut
(uniform
rate)
Haircut
(yield
curve)
Amendment
Outcome
Holdouts
(in %)
Hellenic Republic XS0147393861 EUR English law 15/05/2012 450.0 67.4 76.4 not passed 97%
Hellenic Republic XS0372384064 USD English law 25/06/2013 1083.9 67.5 73.2 not passed 79%
Hellenic Republic XS0097596463 EUR English law 21/05/2014 69.0 66.1 65.3 passed 0%
Hellenic Republic XS0165956672 EUR English law 08/04/2016 400.0 65.1 55.0 passed 0%
Hellenic Republic XS0357333029 EUR English law 11/04/2016 5547.2 62.5 50.0 passed 0%
Hellenic Republic XS0071095045 JPY English law 08/11/2016 376.6 63.5 51.9 not passed 53%
Hellenic Republic XS0078057725 JPY English law 03/07/2017 282.4 62.5 50.2 not passed 79%
Hellenic Republic XS0079012166 JPY English law 08/08/2017 470.7 60.9 47.3 not passed 92%
Hellenic Republic XS0260024277 EUR English law 05/07/2018 2086.0 58.9 43.7 passed 0%
Hellenic Republic XS0286916027 EUR English law 22/02/2019 280.0 60.6 46.9 passed 0%
Hellenic Republic XS0097010440 JPY English law 30/04/2019 235.4 57.0 42.2 passed 0%
Hellenic Republic XS0097598329 EUR English law 03/06/2019 110.0 59.8 46.6 passed 0%
Hellenic Republic XS0224227313 EUR English law 13/07/2020 250.0 58.2 43.5 passed 0%
Hellenic Republic XS0251384904 EUR English law 19/04/2021 250.0 54.9 39.7 passed 0%
Hellenic Republic XS0255739350 EUR English law 31/05/2021 100.0 59.2 45.3 passed 0%
Hellenic Republic XS0256563429 EUR English law 09/06/2021 150.0 56.1 40.3 passed 0%
Hellenic Republic XS0223870907 EUR English law 07/07/2024 250.0 58.7 45.1 passed 0%
Hellenic Republic XS0223064139 EUR English law 06/07/2025 400.0 53.8 37.4 passed 0%
Hellenic Republic XS0260349492 EUR English law 10/07/2026 130.0 62.9 52.3 passed 0%
Hellenic Republic XS0110307930 EUR English law 14/04/2028 200.0 63.7 54.1 not passed 100%
Hellenic Republic XS0192416617 EUR English law 10/05/2034 1000.0 47.5 29.7 passed 0%
Hellenic Republic XS0191352847 EUR English law 17/07/2034 1000.0 56.6 44.1 not passed 31%
Hellenic Republic XS0292467775 EUR English law 25/07/2057 1778.4 -9.4 -5.5 inquorate /1 0%
Athens Urban Transport XS0354223827 EUR English Law 26/03/2013 240.0 67.7 74.6 not passed 100%
Athens Urban Transport XS0198741687 EUR English Law 12/08/2014 160.0 65.8 62.7 not passed 100%
Athens Urban Transport XS0308854149 EUR English Law 18/07/2017 200.9 64.3 53.4 passed 0%
Hellenic Railways FR0000489676 EUR English law 13/09/2012 190.0 67.9 76.3 not passed 97%
Hellenic Railways XS0208636091 EUR English law 21/12/2012 250.0 66.9 74.8 not passed 100%
Hellenic Railways XS0165688648 EUR English law 02/04/2013 412.5 67.8 74.3 not passed 89%
Hellenic Railways XS0142390904 EUR English law 30/01/2014 197.0 66.5 68.2 not passed 100%
Hellenic Railways FR0010027557 EUR English law 29/10/2015 200.0 64.8 54.6 not passed 87%
Hellenic Railways XS0193324380 EUR English law 24/05/2016 250.0 62.8 50.5 not passed 100%
Hellenic Railways XS0215169706 EUR English law 17/03/2017 450.0 63.3 52.1 not passed 100%
Hellenic Railways XS0160208772 EUR English law 27/12/2017 165.0 63.1 50.9 not passed 76%
Hellenic Railways XS0280601658 EUR English law 20/12/2019 255.0 59.4 45.5 passed 0%
Hellenic Republic CH0021839524 CHF Swiss law 05/07/2013 538.4 65.6 71.1 inquorate /2 100%
Hellenic Republic JP530000CR76 JPY Japanese law 14/07/2015 188.3 65.9 57.5 not attempted 58%
Hellenic Republic JP530000BS19 JPY Japanese law 01/02/2016 282.4 64.7 51.7 not attempted 44%
Hellenic Republic JP530000CS83 JPY Japanese law 22/08/2016 376.6 64.0 52.5 not attempted 61%
Hellenic Republic IT0006527532 EUR Italian law 11/03/2019 182.9 63.8 53.6 not attempted 19%
Hellenic Railways JP530005AR32 JPY Japanese law 03/03/2015 94.1 68.4 63.1 not attempted 84%
Hellenic Railways JP530005ASC0 JPY Japanese law 06/12/2016 81.9 63.2 51.4 not attempted 100%
English Law Titles
Italian, Japanese and Swiss Law Titles

APPENDIX
54
Table A4 (Ct’d) - Part C: Greek law guaranteed titles
Note: The entry “not attempted” means that no consent solicitation (amendment attempt) was made to the holders.
The haircut with “uniform rate” is based on a 15.3% discount rate. The imputed yield curve rates used for
computing the alternative haircut measure is discussed in Appendix 4 below.
Issuer ISIN CurrencyGoverning
LawMaturity
Amount held
by Private
Sector (€ mn)
Haircut
(uniform
rate)
Haircut
(yield
curve)
Amendment
Outcome
Holdouts
(in %)
Athens Urban Transport GR2000000106 EUR Greek Law 13/07/2012 350.0 68.2 76.8 not attempted 0%
Athens Urban Transport GR2000000072 EUR Greek Law 16/09/2015 200.0 63.2 52.7 not attempted 0%
Athens Urban Transport GR2000000080 EUR Greek Law 03/02/2016 149.5 62.8 50.6 not attempted 0%
Athens Urban Transport GR1150001666 EUR Greek Law 19/09/2016 320.0 64.4 53.1 not attempted 50%
Athens Urban Transport GR2000000098 EUR Greek Law 09/08/2018 340.0 61.0 47.9 not attempted 0%
Hellenic Defence Systems GR2000000221 EUR Greek Law 05/05/2014 3.6 68.2 59.6 not attempted 0%
Hellenic Defence Systems GR2000000239 EUR Greek Law 22/06/2014 14.3 61.5 58.4 not attempted 0%
Hellenic Defence Systems GR2000000304 EUR Greek Law 12/08/2014 162.5 65.2 61.9 not attempted 0%
Hellenic Defence Systems GR2000000247 EUR Greek Law 20/12/2014 6.5 64.1 57.8 not attempted 0%
Hellenic Defence Systems GR2000000254 EUR Greek Law 24/03/2015 17.5 64.4 56.7 not attempted 0%
Hellenic Defence Systems GR2000000262 EUR Greek Law 30/06/2015 32.3 62.9 52.7 not attempted 0%
Hellenic Defence Systems GR2000000270 EUR Greek Law 25/04/2018 125.4 61.5 49.2 not attempted 0%
Hellenic Defence Systems GR2000000296 EUR Greek Law 16/05/2023 213.0 59.6 47.2 not attempted 0%
Hellenic Defence Systems GR2000000288 EUR Greek Law 18/05/2027 175.0 56.0 42.6 not attempted 0%
Hellenic Railways GR2000000064 EUR Greek Law 11/10/2013 635.0 63.4 67.1 not attempted 0%
Hellenic Railways GR2000000023 EUR Greek Law 27/12/2014 157.6 64.3 57.9 not attempted 0%
Hellenic Railways GR1150003688 EUR Greek Law 28/08/2015 700.0 66.5 58.2 not attempted 0%
Hellenic Railways GR2000000049 EUR Greek Law 04/03/2016 265.0 55.9 37.6 not attempted 0%
Hellenic Railways GR2000000056 EUR Greek Law 25/08/2016 800.0 54.5 34.8 not attempted 0%
Hellenic Railways GR2000000031 EUR Greek Law 02/06/2018 713.7 61.5 49.0 not attempted 0%
Hellenic Railways GR2000000015 EUR Greek Law 12/08/2020 520.0 57.5 43.0 not attempted 0%
Hellenic Railways GR1150002672 EUR Greek Law 14/06/2037 800.5 55.2 42.6 not attempted 0%

APPENDIX
55
Appendix 3: Historical Comparison of Exit Yields
Table A5: Exit Yields following previous distressed debt exchanges, 1990-2010
Date Exit yield
unadjusted Exit yield
adjusted 1/ Subsequent default or
debt restructuring? Debt restructuring case
Mexico (Brady deal) 4.2.90 22.3 12.2 No
Nigeria (Brady deal) 1.12.91 22.6 13.4 Yes, in 2001
Venezuela (Brady deal) 5.12.90 17.9 7.5 No
Philippines (Brady deal) 1.12.92 14.1 5.3 No
Argentina (Brady deal) 7.4.93 15.0 6.9 Yes, in 2001
Jordan (Brady deal) 23.12.93 10.9 3.2 No
Brazil (Brady deal) 15.4.94 18.2 9.6 No
Bulgaria (Brady deal) 29.6.94 23.5 14.9 No
Dom. Rep. (Brady deal) 1.8.94 17.0 8.3 Yes, in 2005
Poland (Brady deal) 27.10.94 13.5 4.3 No
Ecuador (Brady deal) 1.2.95 28.1 19.2 Yes, in 1999
Panama (Brady deal) 1.5.96 12.0 3.7 No
Croatia 31.7.96 9.8 1.4 No
Peru (Brady deal) 1.3.97 11.5 3.4 No
Russia (Soviet-era debt) 1.12.97 12.4 5.1 Yes, in 1998
Cote d'Ivoire (Brady deal) 1.3.98 11.7 4.4 Yes, in 2000
Pakistan (Bond debt) 13.12.99 21.4 13.2 No
Ukraine (Global Exchange) 7.4.00 28.6 20.2 No
Ecuador 23.8.00 22.2 13.9 Yes, in 2008
Russia (PRINs & IANs) 25.8.00 16.4 8.1 No
Moldova (External bonds) 1.10.02 21.0 13.3 No
Uruguay 29.5.03 12.2 5.8 No
Argentina (External debt) 1.4.05 8.2 2.2 No
Dom. Rep. (Bond debt) 11.5.05 9.6 3.5 No
Grenada 15.11.05 9.1 2.7 No
Iraq 1.1.06 11.9 5.7 No
Belize 20.2.07 8.4 2.1 No
Ecuador 5.6.09 16.0 8.5 No
Cote d'Ivoire 16.4.10 11.1 4.9 No
AVERAGE 15.7 7.8
Greece 9.3.12 15.3 10.2 n.a.
1/ Exit yield minus average yield on Baa rated corporate bonds according to Moody's
Source: Database underlying Cruces and Trebesch (2010).

APPENDIX
56
Appendix 4. Imputation of Short- and Medium Term Exit Yields
Following the exchange, Greece lacked a yield curve for short and medium residual
maturities. This makes it difficult to value the old bonds for the purposes of
constructing a present value haircut as defined in Section III – that is, conditional on a
hypothetical scenario in which Greece would have kept servicing these bonds in the
same way as the new ones. Discounting at the average yield of the new bonds may not
be the best approach, because sovereign risk may have been greater or smaller at the
shorter maturities.
To construct valuations for the shorter maturities, one can combine assumptions about
the distribution of default probability in Greece following the exchange with the
information expressed in the observed exit yields. Commentary immediately after the
announcement of the initial exchange results indicates that markets believed that the
risk of a new default would remain high for the foreseeable future after the exchange,
driven by Greece’s continued high debt, the worsening recession, political uncertainty,
and the repayments due to the official sector, which were set to rise sharply in 2014.62
As a way of quantifying these risks, we assumed a normal distribution of default risk
with a left-truncated probability density function (pdf). That is, we assume, the
probability of a new default is assumed to start at some level immediately after the
exchange, then continue to rise until a peak, and then tail off. We experimented with
two alternative assumptions on where the peak might be located:
6 months after the exchange time (taken to be 24 February). This
corresponds to an interpretation where default would be triggered by the March
programme going off track soon, perhaps as a result of political changes
following the April 2012 parliamentary elections;
24 months after the exchange: this is a story where the March
programme is either implemented or renegotiated, but the default probability
nonetheless rises and peaks in 2014 as a result of the increasing official
repayment burden at around that time.
Given these assumptions, we experimented with different assumptions about the
standard deviation of default risk to see how this would affect the results (3 months, 6
months and 12 months for the distribution with peak density after six months; and 6
months, 12 months and 18 months for the distribution with peak density after 24
months).
Finally, given the assumed means and standard deviations of the default pdf, we used
the observed prices of the new bonds on March 12, 2012 to calibrate two additional
parameters, namely, the total cumulative probability of default over the short and
medium term (i.e. the area under the assumed pdf), and the long-run borrowing cost of
Greece. These two parameters were set to reproduce both the level and the falling
62 “Market Looks to Next Day of Reckoning”, Wall Street Journal, 10. March 2012; “Greece’s New Bonds Yield
More Than Portugal’s on Growth, Repayment Concern”, Bloomberg News, March 9, 2012; “Doubting traders
unpersuaded by Athens debt deal”, Reuters, March 9, 2012). Some of these worries have in the meantime been
confirmed by events.
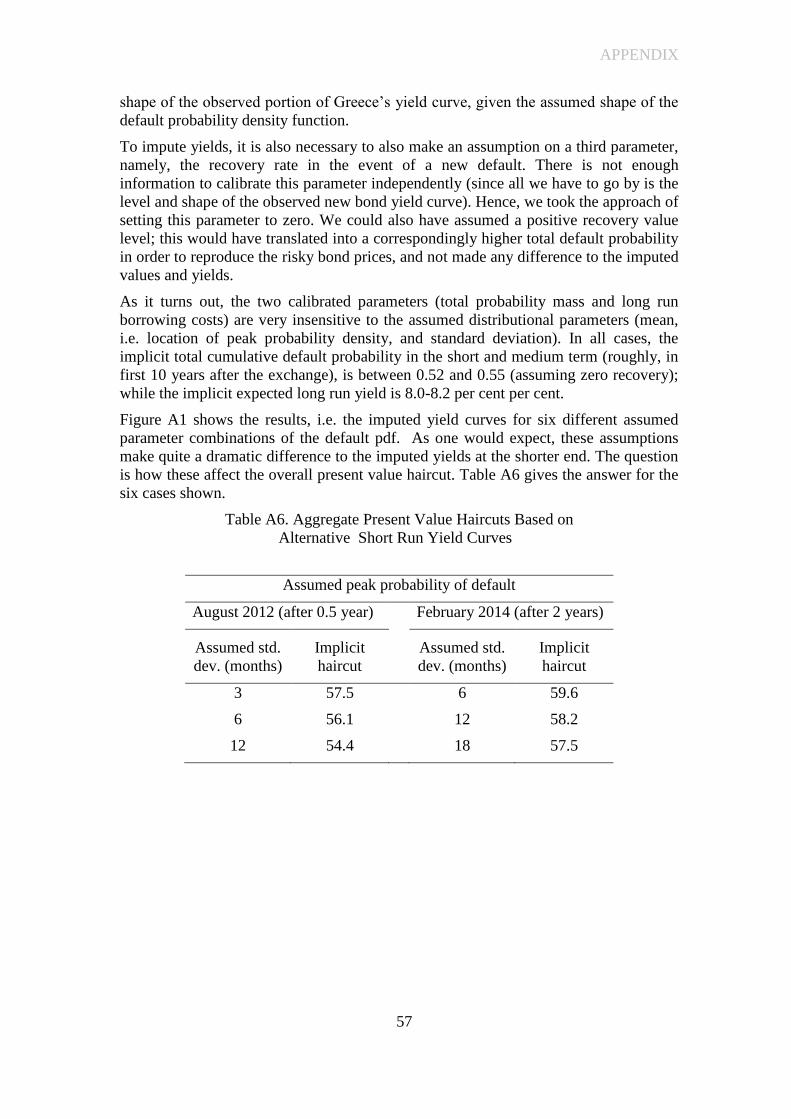
APPENDIX
57
shape of the observed portion of Greece’s yield curve, given the assumed shape of the
default probability density function.
To impute yields, it is also necessary to also make an assumption on a third parameter,
namely, the recovery rate in the event of a new default. There is not enough
information to calibrate this parameter independently (since all we have to go by is the
level and shape of the observed new bond yield curve). Hence, we took the approach of
setting this parameter to zero. We could also have assumed a positive recovery value
level; this would have translated into a correspondingly higher total default probability
in order to reproduce the risky bond prices, and not made any difference to the imputed
values and yields.
As it turns out, the two calibrated parameters (total probability mass and long run
borrowing costs) are very insensitive to the assumed distributional parameters (mean,
i.e. location of peak probability density, and standard deviation). In all cases, the
implicit total cumulative default probability in the short and medium term (roughly, in
first 10 years after the exchange), is between 0.52 and 0.55 (assuming zero recovery);
while the implicit expected long run yield is 8.0-8.2 per cent per cent.
Figure A1 shows the results, i.e. the imputed yield curves for six different assumed
parameter combinations of the default pdf. As one would expect, these assumptions
make quite a dramatic difference to the imputed yields at the shorter end. The question
is how these affect the overall present value haircut. Table A6 gives the answer for the
six cases shown.
Table A6. Aggregate Present Value Haircuts Based on
Alternative Short Run Yield Curves
Assumed peak probability of default
August 2012 (after 0.5 year) February 2014 (after 2 years)
Assumed std.
dev. (months)
Implicit
haircut
Assumed std.
dev. (months)
Implicit
haircut
3 57.5 6 59.6
6 56.1 12 58.2
12 54.4 18 57.5
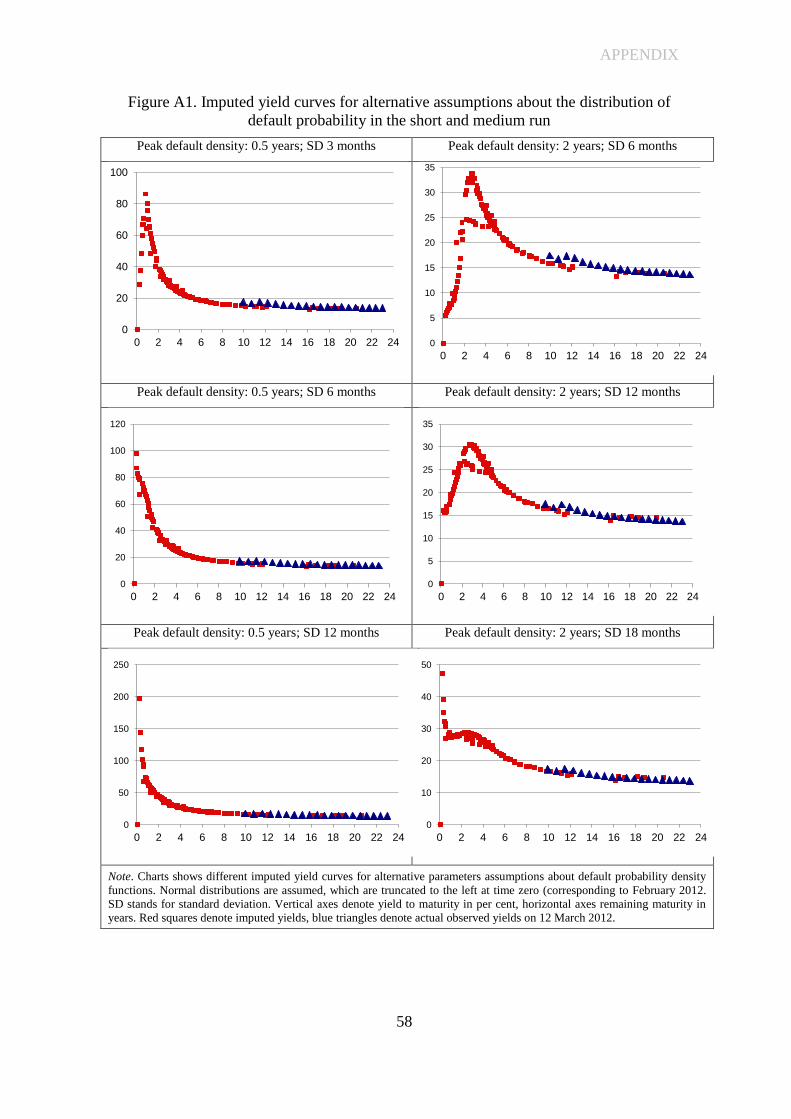
APPENDIX
58
Figure A1. Imputed yield curves for alternative assumptions about the distribution of
default probability in the short and medium run
Peak default density: 0.5 years; SD 3 months Peak default density: 2 years; SD 6 months
Peak default density: 0.5 years; SD 6 months Peak default density: 2 years; SD 12 months
Peak default density: 0.5 years; SD 12 months Peak default density: 2 years; SD 18 months
Note. Charts shows different imputed yield curves for alternative parameters assumptions about default probability density
functions. Normal distributions are assumed, which are truncated to the left at time zero (corresponding to February 2012.
SD stands for standard deviation. Vertical axes denote yield to maturity in per cent, horizontal axes remaining maturity in
years. Red squares denote imputed yields, blue triangles denote actual observed yields on 12 March 2012.
0
20
40
60
80
100
0 2 4 6 8 10 12 14 16 18 20 22 24
0
5
10
15
20
25
30
35
0 2 4 6 8 10 12 14 16 18 20 22 24
0
20
40
60
80
100
120
0 2 4 6 8 10 12 14 16 18 20 22 24
0
5
10
15
20
25
30
35
0 2 4 6 8 10 12 14 16 18 20 22 24
0
50
100
150
200
250
0 2 4 6 8 10 12 14 16 18 20 22 24
0
10
20
30
40
50
0 2 4 6 8 10 12 14 16 18 20 22 24

APPENDIX
59
The main result is that the aggregate present value haircut corresponding to the
imputed yield curves varies between about 55 and 60 per cent per cent, against an
aggregate haircut of 65 per cent per cent if a flat yield curve of 15.3 per cent per cent is
assumed. The reason for these lower estimates is that the imputation results for the
most part results in higher yields at the short and medium end, where most of the old
bonds were concentrated. Hence, the present value of these bonds is deemed to have
been lower, and hence also the losses from giving up these bonds. In effect, the
imputed yield curve approach acknowledges the fact that investors with shorter old
bonds would have faced an extremely risky environment in the first two years after the
exchange, even under a successful exchange and even if the Greek government had
continued to give their repayments equal priority to the payments on the new bonds.

APPENDIX
60
Appendix 5. Historical comparison of government coerciveness
Source: Enderlein, Trebesch and von Daniels (2012), except for coding of Greece. The column on “Overall Coerciveness” shows the total index value for each agreement. The table also shows the binary coding results of four sub-indicators: “Post-default“ captures whether the country missed any payments prior to the exchange, or not. “Full Moratorium” captures whether the country fully suspends interest and principal payments, even refusing to make token payments. “Forced exchanges” are cases without formal or informal negotiations between the government and its creditors. The criterion on “Explicit threats” is fulfilled whenever a key government actor publicly threatens to repudiate on debt, e.g., via an indefinite moratorium.
Table A6 benchmarks the procedural approach in the Greek exchange to that of previous
cases of the 1990s and 2000s, using an index of government coerciveness during sovereign
debt crises developed by Enderlein et al. (2012). The index captures nine dimensions of
payment and negotiation behaviour vis-à-vis creditors and is additive, so that the maximum
degree of debtor coerciveness is 10 (all criteria fulfilled in the run-up to a restructuring).
Table A6. Debtor coerciveness in previous distressed debt exchanges, 1990-2010
Date
Overall
Coerciveness
(max. 10)
Post-
Default
Full
Mora-
torium?
Forced
Exchange Explicit
Threats
Mexico (Brady deal) 4.2.90 3 Yes No No Yes
Nigeria (Brady deal) 1.12.91 8 Yes No Yes Yes
Venezuela (Brady deal) 5.12.90 5 Yes No No Yes
Philippines (Brady deal) 1.12.92 3 No No No Yes
Argentina (Brady deal) 7.4.93 6 Yes Yes No Yes
Jordan (Brady deal) 23.12.93 7 Yes Yes Yes Yes
Brazil (Brady deal) 15.4.94 7 Yes Yes No Yes
Bulgaria (Brady deal) 29.6.94 6 Yes Yes No Yes
Dom. Rep. (Brady deal) 1.8.94 7 Yes Yes No Yes
Poland (Brady deal) 27.10.94 5 Yes Yes No No
Ecuador (Brady deal) 1.2.95 7 Yes Yes No Yes
Panama (Brady deal) 1.5.96 5 Yes Yes No No
Peru (Brady deal) 1.3.97 9 Yes Yes No Yes
Russia (Soviet-era debt) 1.12.97 5 Yes Yes No No
Pakistan (Bond debt) 13.12.99 3 No No No Yes
Ukraine (Global Exch.) 7.4.00 2 No No No Yes
Ecuador 23.8.00 6 Yes No Yes No
Russia (PRINs & IANs) 25.8.00 6 Yes Yes No No
Moldova (Bond debt) 1.10.02 2 No No No Yes
Uruguay 29.5.03 1 No No No No
Argentina (Ext. debt) 1.4.05 9 Yes Yes Yes Yes
Dom. Rep. (Bond debt) 11.5.05 2 No No No No
Grenada 15.11.05 2 Yes No No No
Belize 20.2.07 2 Yes No No No
AVERAGE 4.9
Greece 9.3.12 2 No No No Yes

APPENDIX
61
Appendix 6. Counterfactual Scenarios
Table A7 presents the counterfactual implications, in terms of either additional debt
relief or lower official financing (cash transfers), of designing the Greek debt
restructuring differently along a number of dimensions: (1) a tougher approach to
holdouts and involvement of central banks, leading to higher participation; (2) a
uniform present value haircut of 70 per cent for all creditors, regardless maturity; (3)
an additional 5 per cent haircut for holders of Greek law bonds, as these benefitted
from the seniority upgrade into new English-law bonds; (4) a negotiated rather than
voluntary buyback in late 2012. We also compute what would have happened if the
March 2012 deal would have been a negotiated buyback right from the start, instead of
the two-step restructuring that was actually implemented.63
To keep the analysis simple, we assume that in each of these scenarios, creditors would
have received either cash or the same bundle of bonds (in terms of maturities and
coupons) as were offered in the actual exchange, except possibly in different amounts.
For example, in the scenario that equalises present value haircuts we assume that all
investors would have received the same face value of new bonds, with short term
investors receiving more cash, in addition to bonds, than longer term investors (unlike
the actual exchange, were all investors received the same amount of bonds and cash
per unit of face value)
The results can be summarised as follows.
(i) Higher participation. Our first counterfactual broadens the base of participating
bondholders, either by taking a tougher approach on potential holdouts (full
participation of private creditors) or by additionally including the holdings of
central banks. Row 2 of Table 6 shows that binding in the approximately 3 per
cent of private sector holdouts would have implied approximately €3 billion in
additional debt relief in face value terms and almost €4 billion in present value.
Including Eurozone central banks would have increased the present value debt
relief by €31 billion, assuming central banks would have been given the same
bundle of cash and new bonds as private investors (row 3). However, it would
also have required almost €10 billion in extra cash.
(ii) Uniform haircut of 70 per cent for all maturities. Our second counterfactual is
to impose the same present value haircut on all bondholders. The haircut of 70
per cent is only somewhat higher than the actual average haircut of about 65
per cent, and lower than the haircut that was deemed to be acceptable for short
term creditors. Assuming that official cash would have remained capped at €30
billion as in the actual debt exchange, a uniform 70 per cent haircut would have
created additional debt relief of almost 30 billion in face value terms and 23
billion in present value terms (row 5). Alternatively, one can fix debt relief
63 One counterfactual not addressed in the table is the bail-in of bank bond holders. Assuming no compensation of
banks for PSI related losses, this could have saved up to €25 billion in official financing and led to additional debt
relief for Greece in the amount given by the fifth row of Table 4. However, some recapitalisation might have been
needed even with a bond holder bail-in, requiring a fuller analysis of how a bail-in of Greek bank creditors might
have played out for the public purse. This analysis beyond the scope of our paper.

APPENDIX
62
(€103 billion in present value terms, as in the actual exchange) and compute the
minimum of cash that would have been needed to implement this debt relief
target, namely, just under €23.9 billion, €6 billion less than was actually used
(see row 6, and Appendix 7 for the formula used).
Table A7. Debt Relief and Official Cash Use in Counterfactual Restructuring Scenarios
Debt reduction Official
cash
used
Face value
Present
value Row
Counterfactuals with respect to March/April debt exchange
(1) Benchmark: actual March/April debt exchange 107.1 103.0 29.7
Identical haircuts as in actual restructuring
(2) Full participation of private sector1/
110.0 106.6 30.8
(3) Full participation of both private sector and central banks1/
140.4 144.1 39.4
Uniform haircut of 70 per cent
(4) Same cash use, actual participation 134.2 122.8 29.7
(5) Using €30 billion cash, full private participation 136.1 125.6 30.0
(6) Using minimum cash,2/
full private participation 115.6 103.0 23.9
Haircut of 75% for Greek law and 70% for foreign law, full private participation
(7) Using €30 billion cash 160.2 143.2 30.0
(8) Using minimum cash2/
130.5 103.0 15.5
(9) Using €30 billion cash, with central bank participation 172.0 169.8 30.0
Counterfactuals with respect to December buyback
(10) Benchmark: actual buyback 20.6 17.1 11.3
Buyback at negotiated prices
(11) Secondary market prices of 23.11.2012 27.8 22.9 11.3
(12) Secondary market prices of 11.10.2012 38.0 31.0 11.3
(13) Secondary market prices of 12.03.2012 31.8 26.1 11.3
Combined counterfactuals: full negotiated buyback at the time of the March/April restructuring
(14) Benchmark: cumulative effect of debt exchange and actual buyback 127.7 120.1 41.0
Full buyback in March/April
(15) Identical haircuts and participation as in actual exchange 153.1 138.8 46.1
(16) Uniform haircut of 70%, full private participation 165.6 148.6 40.0
Notes: In € billion. Haircuts evaluated at average exit yield of 15.3 per cent, debt relief at a discount rate of 5 per cent.
Scenarios involving higher average haircuts assume that PSI-related recapitalisation costs of Greek banks would have
been proportionally higher.
1/ Creditors assumed to receive same bundle of cash and new bonds as in actual restructuring.
2/ Minimum cash needed consistent with maintaining the same present value debt reduction as achieved in the actual
exchange; assuming discount rate of 5 per cent. See Appendix 6 for formula used.

APPENDIX
63
(iii) 75 per cent haircut on Greek law bonds, 70 per cent on foreign law bonds.
Another thought experiment assumes a modestly higher haircut on Greek-law
bonds compared to English-law bonds, reflecting the fact that the former
benefitted from an upgrade in governing law that makes them harder to
restructure in the future. Row 7 shows that compared to the actual restructuring,
this would have translated into additional debt relief of €53 billion in face value
and €40 billion in present value terms. Alternatively the official cash used in
the exchange could have reduced by nearly €15 billion (row 8).
(iv) December 2012 buyback based on negotiated prices. Our fourth
counterfactual relates to the December buyback. The table shows what could
have been gained if the buyback had been conducted at negotiated (ex-ante)
prices rather than market prices, so as to minimize the boondoggle effect of
increasing bond prices once the buyback is announced. If the buyback had
happened at the reference price mentioned in the Eurogroup statement of 27.
November – the price of 23. November 2012, just before the buyback was
officially announced – Greece would have obtained an extra debt €6 billion in
debt relief in present value terms (or over 7 billion in face value terms, see row
11). If it had been conducted at the price that prevailed just before the
possibility of a buyback was first mentioned in the press, around 11 of October,
the debt relief would have been €14 billion higher than what was actually
achieved (row 12). Finally, if the issue price of March 12 had been used –
which could have been justified by the fact that it would have implied no
further losses for investors beyond those already sustained in the debt exchange
– debt relief would have exceeded that in the actual buyback by about €9
billion in present value terms (row 13).
(v) Full cash buyback in March/April; no bond exchange. Finally, it is interesting
to ask what would have happened if the Greek debt restructuring had been
designed as a pure negotiated buyback from the outset – that is, if bondholders
would have exclusively received cash, rather than a package of cash and new
bonds, during the March-April exchange. Row 15 shows that, on the
assumption that both participation and bond-by-bond haircuts would have been
exactly the same as in the actual debt exchange, the cash needed for this full
buyback operation would have been €46 billion, only €5 billion more than what
the official sector actually spent for the cash sweetener in March and the cash-
buyback in December (a combined €41 billion). This additional cash would
have “bought” an extra €25 billion debt relief in face value terms (€19 billion in
present value). Conducting the full buyback in a way that would have led to a
uniform 70 per cent present value haircut for all maturities would both have led
to both much higher debt relief than in the actual exchange – an extra €39
billion in face value and €29 billion in present value – and used €1 billion less
in cash than was actually used for the March/April debt exchange and
December buyback combined (row 16).

APPENDIX
64
Appendix 7. Computing the cash minimising debt restructuring
This appendix derives the formulas used in section 5 of the paper (and in Appendix 6
above) to establish the minimum volumes of official cash that would have been needed
to restructure the Greek debt subject to the following assumptions:
1) Either a uniform PV haircut across all bonds (assumption used in row 6 of
Table 6) , or within Greek law bonds and foreign law bonds (assumption used
in row 8 of Table 6).
2) Debt relief at least as high as Greece received in the actual restructuring.
3) A higher haircut must lead to proportionally higher bank recapitalisation.
4) Same bundle of bonds would have been used as in the actual restructuring.
That is, for each unit of face value of each old bond , we seek the units of cash and
units of the new bond “bundle” to minimize total cash use, subject to 1), 2) and 3).
In a first step, we write down a constraint that incorporates 2) and 3). Let ( ) denote
the present value debt burden for Greece associated with new bonds of face value
and discount rate (e.g. 5 per cent), ( ) the present value debt burden for Greece
of borrowing total cash sweetener in the amount from the EFSF, and the present
value of Greece’s old bonds exchanged in the actual exchange,
the present
value of Greece’s debt obligations to the EFSF resulting from actual PSI related bank
recapitalisation, and h the assumed uniform present value haircut (for example, 0.7).
Then, 2) and 3) imply:
(1)
( ) ( )
{∑ } {∑ ( ) }
where the left side of the inequality denotes the debt relief received by Greece in the
actual restructuring, and the right hand side the debt relief it would obtain in a
counterfactual restructuring which applies a uniform present value haircut h to all
bonds regardless of maturity (0.646 is the average haircut achieved in the actual
restructuring, using the exit yield as the uniform discount rate, and the coefficient
reflects an upward adjustment to the bank recapitalisation cost in the event that
.
Using the notation ( ) to denote the value of , discounted at exit yield , from the
perspective of the holder of old bond , the value of one unit of old bond
discounted at the same exit yield and the uniform haircut (e.g. 0.7), the minimisation
problem can then be written as:
(2) ∑
(i) ( ) ( )
(ii) {∑ } ∑ ( )
where (
)
( ) ( ) (from equation (1)).

APPENDIX
65
It is clear from the present value formula that all value functions that appear in the
constraints (i) and (ii) are linear in their arguments: the present value of units of face
value equals times the present value of one unit of face value, which is just a
constant. Using lower case notation to denote the present values associated with one
unit of face value for each of the value functions in (i) and (ii), the constraints can be
rewritten as:
( ) ( )
( ) ∑
∑
After solving (i) for and substituting into (ii) this means that the minimisation
simplifies to ∑ ∑
∑ {( )
} or
equivalently:
∑
[
]∑
( )∑
Now, observe that
for relevant assumptions about cash flows and
discount rates (as an empirical matter, one unit of face value of cash sweetener
borrowed from the EFSF implies a burden of about 0.86 when discounted at 5 per cent,
one unit of face value of new Greek bonds a burden of about 0.8, and one unit of new
Greek bonds a value of investors of about 0.25 when discounted at the exit yield of
15.3). This implies that minimisation of ∑ implies that the term [
]∑
must be maximised, which means that the constraint must hold with equality. Hence,
the minimum cash sweetener needed, subject to the assumptions made, is given by:
∑ ( )
∑
.
Now suppose that Greece had decided to treat Greek law and foreign law bondholders
differently. In that case, assumption 1) is replaced by:
1) (alt) Uniform PV haircut within Greek law bonds and within foreign law
bonds
and constraint (i) is replaced by:
( ) ( ) ( )
( ) ( ) ( )
where the subscripts and now refer to foreign law and Greek law bondholders,
respectively. Adding (i.g) and (i.f) over all and , respectively, and substituting into
(2) after exploiting the linearity of the present values in the face values results in a new
expression for the minimum cash needed to meet the assumptions,
∑
{( )∑
( )∑
}
.