The Greater Des Moines Metro Area Regional Analysis of Impediments
101
The Greater Des Moines Metro Area Regional Analysis of Impediments to Fair Housing Choice Prepared for: Neighborhood Development Division City of Des Moines and Des Moines Area Metropolitan Planning Organization’s The Tomorrow Plan By: Department of Community and Regional Planning Iowa State University IOWA STATE UNIVERSITY Department of Community and Regional Planning
Transcript of The Greater Des Moines Metro Area Regional Analysis of Impediments
The Greater Des Moines Metro Area Regional Analysis of Impediments to Fair Housing Choice
Prepared for: Neighborhood Development Division
City of Des Moines
and
Des Moines Area Metropolitan Planning Organization’s The Tomorrow Plan
By: Department of Community and Regional Planning
Iowa State University
IOWA STATE UNIVERSITY Department of Community and Regional Planning

This report was prepared by Jane Rongerude, PhD and Anuprit Minhas,
Department of Community and Regional Planning, Iowa State University. Eric
Christianson provided additional research assistance.

TABLE OF CONTENTS
EXECUTIVE SUMMARY ........................................................................................................... 1
1. INTRODUCTION .............................................................................................................. 7
1.1 THE PURPOSE OF THE REPORT ..................................................................................................... 7
1.2 REGIONAL FOCUS OF THE STUDY ................................................................................................. 9
1.3 STUDY AREA BOUNDARIES .......................................................................................................... 10
1.4 PROCESS AND METHODOLOGY .................................................................................................. 12
2. REGIONAL DEMOGRAPHIC PROFILE .............................................................................. 15
2.1 POPULATION AND RACE ............................................................................................................. 17
2.2 NATIONAL ORIGIN ....................................................................................................................... 22
2.3 FAMILIES WITH CHILDREN .......................................................................................................... 22
2.4 PERSONS WITH DISABILITIES ...................................................................................................... 24
2.5 SENIORS ...................................................................................................................................... 26
2.6 OTHER COMMUNITY CHARACTERISTICS ..................................................................................... 26
2.7 SEGREGATION ............................................................................................................................. 28
2.8 SUMMARY OF CHAPTER .............................................................................................................. 42
3. HOUSING MARKET ANALYSIS ........................................................................................ 43
3.1 HOUSING CHARACTERISTICS ....................................................................................................... 43
3.2 RENTAL MARKET CHARACTERISTICS ........................................................................................... 45
3.3 HOME PURCHASE MARKET CHARACTERISTICS ........................................................................... 47
3.4 SUMMARY OF CHAPTER .............................................................................................................. 48
4. AFFORDABLE AND SUBSIDIZED HOUSING ...................................................................... 49
4.1 SECTION 8 RENTAL ASSISTANCE ................................................................................................. 49
4.2 PUBLIC HOUSING ........................................................................................................................ 50
4.3 LOW-INCOME HOUSING TAX CREDIT DEVELOPMENTS .............................................................. 53
4.4 AFFORDABLE HOMEOWNDERSHIP ............................................................................................. 54
4.5 SUMMARY OF CHAPTER .............................................................................................................. 55
5. ANALYSIS OF ZONING CODES ........................................................................................ 56
5.1 ZONING AND BARRIERS TO THE CREATION OF AFFORDABLE HOUSING .................................... 56
5.2 MANUFACTURED AND MOBILE HOUSING .................................................................................. 62
5.3 VARIANCES AND EXCEPTIONS ..................................................................................................... 63
5.4 SUMMARY OF CHAPTER .............................................................................................................. 63
6. COMMUNITY INPUT & QUALITATIVE ASSESSMENT OF IMPEDIMENTS ........................... 64
6.1 SURVEYS ...................................................................................................................................... 64
6.2 FOCUS GROUP DISCUSSIONS ...................................................................................................... 69
6.3 INTERVIEWS ................................................................................................................................ 70
6.4 SUMMARY OF CHAPTER .............................................................................................................. 72
7. REGIONAL FAIR HOUSING LAWS AND PROGRAMS ........................................................ 73
7.1 A FRAMEWORK FOR FAIR HOUSING ENFORCEMENT ................................................................. 73
7.2 LOCAL AGENCIES SUPPORTING FAIR HOUSING .......................................................................... 74
7.3 COMPLAINTS OF HOUSING DISCRIMINATION ............................................................................ 77
7.4 RECENT COURT CASES IN FAIR HOUSING ................................................................................... 79
7.5 SUMMARY OF CHAPTER .............................................................................................................. 79
8. SUMMARY OF IMPEDIMENTS & RECOMMENDATIONS .................................................. 80
8.1 AFFORDABILITY ........................................................................................................................... 80
8.2 GEOGRAPHIC CONCENTRATIONS OF SUBSIDIZED AND AFFORDABLE HOUSING ....................... 94
8.3 CHANGING DEMOGRAPHICS ....................................................................................................... 95
8.4 NEED FOR EDUCATION OF FAIR HOUSING LAWS, RIGHTS AND PROCESSES .............................. 96
8.5 INCREASED LANDLORD SCREENING REQUIREMENTS ................................................................. 96
8.6 LACK OF ADEQUATE SUPPORTIVE SERVICES FOR HOMEOWNERS & PROPERTY OWNERS ........ 97
8.7 ZONING BARRIERS ....................................................................................................................... 98
8.8 HOMELESSNESS........................................................................................................................... 98
8.9 THIS REPORT AND ON-GOING AND FUTURE PLANNING EFFORTS ............................................. 99
APPENDIX A: Survey Questionnaire ................................................................................... 102
APPENDIX B: Housing-related services in the Greater Des Moines Metro Area ................... 103
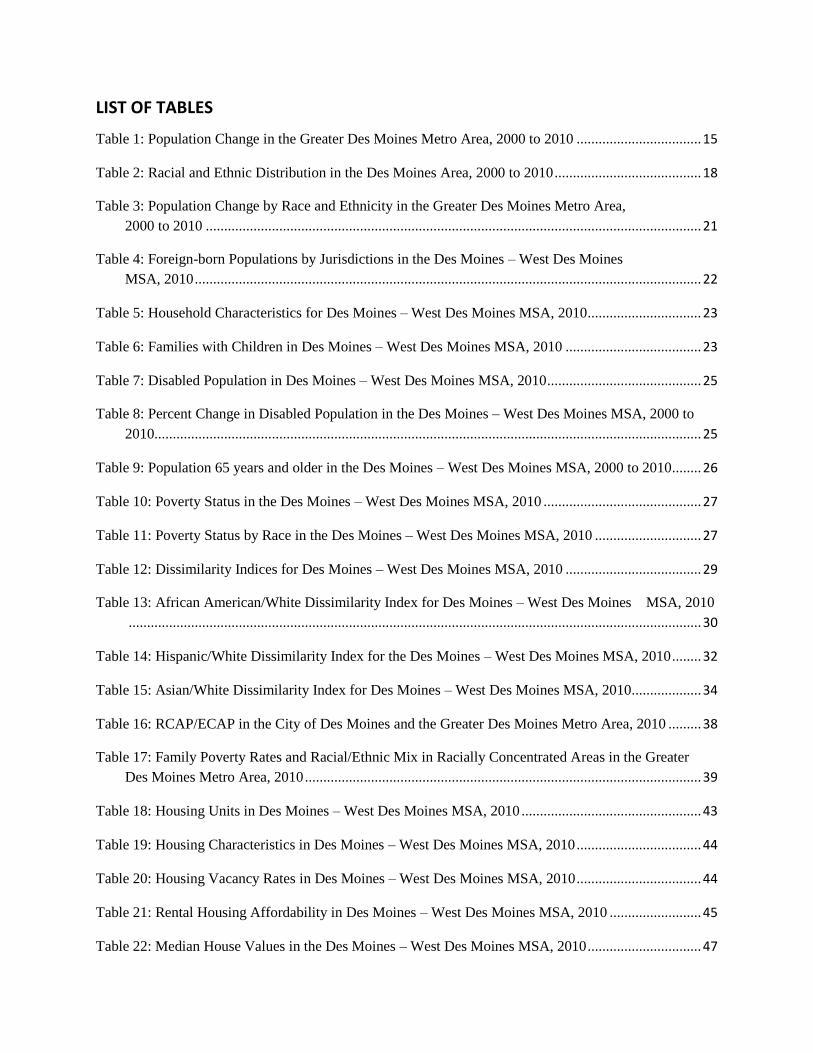
LIST OF TABLES
Table 1: Population Change in the Greater Des Moines Metro Area, 2000 to 2010 .................................. 15
Table 2: Racial and Ethnic Distribution in the Des Moines Area, 2000 to 2010 ........................................ 18
Table 3: Population Change by Race and Ethnicity in the Greater Des Moines Metro Area,
2000 to 2010 ....................................................................................................................................... 21
Table 4: Foreign-born Populations by Jurisdictions in the Des Moines – West Des Moines
MSA, 2010 .......................................................................................................................................... 22
Table 5: Household Characteristics for Des Moines – West Des Moines MSA, 2010 ............................... 23
Table 6: Families with Children in Des Moines – West Des Moines MSA, 2010 ..................................... 23
Table 7: Disabled Population in Des Moines – West Des Moines MSA, 2010 .......................................... 25
Table 8: Percent Change in Disabled Population in the Des Moines – West Des Moines MSA, 2000 to
2010..................................................................................................................................................... 25
Table 9: Population 65 years and older in the Des Moines – West Des Moines MSA, 2000 to 2010 ........ 26
Table 10: Poverty Status in the Des Moines – West Des Moines MSA, 2010 ........................................... 27
Table 11: Poverty Status by Race in the Des Moines – West Des Moines MSA, 2010 ............................. 27
Table 12: Dissimilarity Indices for Des Moines – West Des Moines MSA, 2010 ..................................... 29
Table 13: African American/White Dissimilarity Index for Des Moines – West Des Moines MSA, 2010
............................................................................................................................................................ 30
Table 14: Hispanic/White Dissimilarity Index for the Des Moines – West Des Moines MSA, 2010 ........ 32
Table 15: Asian/White Dissimilarity Index for Des Moines – West Des Moines MSA, 2010 ................... 34
Table 16: RCAP/ECAP in the City of Des Moines and the Greater Des Moines Metro Area, 2010 ......... 38
Table 17: Family Poverty Rates and Racial/Ethnic Mix in Racially Concentrated Areas in the Greater
Des Moines Metro Area, 2010 ............................................................................................................ 39
Table 18: Housing Units in Des Moines – West Des Moines MSA, 2010 ................................................. 43
Table 19: Housing Characteristics in Des Moines – West Des Moines MSA, 2010 .................................. 44
Table 20: Housing Vacancy Rates in Des Moines – West Des Moines MSA, 2010 .................................. 44
Table 21: Rental Housing Affordability in Des Moines – West Des Moines MSA, 2010 ......................... 45
Table 22: Median House Values in the Des Moines – West Des Moines MSA, 2010 ............................... 47

Table 23: Affordable Home Ownership in Des Moines – West Des Moines MSA, 2010 ......................... 48
Table 24: Cost Burden Analysis in the Greater Des Moines Metro Area, 2012 ......................................... 57
Table 25: Occupancy Standards for Maximum Number of Unrelated Adults ............................................ 60
Table 26: Fair Housing Complaints in Des Moines, 2008 – 2012 .............................................................. 78
LIST OF FIGURES
Figure 1: Housing Value (in Thousands) by Percent in Des Moines and West Des Moines, 2010 ............ 58
Figure 2: Construction Cost per Unit in Des Moines and West Des Moines, 2010 .................................... 61
Figure 3: Barriers to Affordable Housing in the Region ............................................................................. 65
Figure 4: Barriers to Home Ownership in the Region ................................................................................ 66
Figure 5: Barriers to Fair Housing in the Region ........................................................................................ 67
Figure 6: Housing Cases Docketed by Basis of Claim, State of Iowa ........................................................ 78
LIST OF MAPS
Map 1: Regional Analysis of Impediments Study Boundaries, 2012 ......................................................... 11
Map 2: Total Population in the Greater Des Moines Metro Area, 2010 ..................................................... 16
Map 3: Population Distribution in the Greater Des Moines Metro Area by Race, 2010 ............................ 19
Map 4: Population Distribution by Race in Des Moines and West Des Moines by Race, 2010 ................ 20
Map 5: Single Female Headed Households with Children as a Proportion of all Households in the Greater
Des Moines Metro Area, 2010 ............................................................................................................ 24
Map 6: Concentration of African American Population in the Greater Des Moines Metro Area, 2010..... 31
Map 7: Concentration of Hispanic Population in the Greater Des Moines Metro Area, 2010 ................... 33
Map 8: RCAPs as defined by HUD for the Greater Des Moines Metro Area, 2010 .................................. 36
Map 9: Analysis of RCAPs/ECAPs Based on Local Demographic Patterns in the Greater Des Moines
Metro Area, 2010 ................................................................................................................................ 37
Map 10: Distribution of Non-White Population as a Percent of Total Census Tract Population in the
Greater Des Moines Metro Area, 2010 ............................................................................................... 40
Map 11: Family Poverty Rate in the Greater Des Moines Metro Area, 2010............................................. 41
Map 12: Renter Occupied Properties in the Greater Des Moines Metro Area, 2010.................................. 46
Map 13: Public Housing in the Greater Des Moines Metro Area, 2010 ..................................................... 51
Map 14: Concentration of Public Housing in Des Moines, 2010 ............................................................... 52
Map 15: Low Income Housing Tax Credit Developments in the Greater Des Moines Metro Area, 2012 . 53
The Greater Des Moines Metro Area Regional Analysis of Impediments to Fair Housing Choice
1
EXECUTIVE SUMMARY
The Greater Des Moines Metro Area, repeatedly recognized for its high quality of life and
moderate cost of living, is home to approximately 18% of the population of the State of Iowa.
While the region’s overall growth rate is modest, the diversity of residents, especially in terms of
racial and cultural backgrounds, is increasing dramatically in some areas. In order to ensure that
the benefits of the region are made available to all its inhabitants, civic leaders must ensure that
an environment exists where equal access to housing opportunities is treated as a fundamental
right. In order to maintain the region’s high quality of life and ability to attract new residents and
new economic opportunity, the issue of fair housing choice must have a place on the regional
agenda.
Overview of the Report
HUD requires that all cities and counties eligible for Community Development Block Grant
funding (entitlement communities) conduct an assessment of impediments to fair housing to
certify compliance with the Consolidated Plan Final Rule, published in the Federal Register (24
CFR 91.225). The Cities of Des Moines and West Des Moines are entitlement communities that
receive annual CDBG allotments from the U.S. Department of Housing and Urban Development
(HUD) based on an established formula. As a result, they are required to carry out periodic
analyses of impediments to fair housing choice.
Recently, HUD has encouraged entitlement cities to look at housing issues through a regional
lens and to conduct a regional assessment of impediments to fair housing. HUD envisions that a
regional assessment exercise will bring together the varied jurisdictions and entities within a
given region around the issue of fair housing and encourage collaboration in the design and
implementation of solutions to impediments. The entitlement communities in the Greater Des
Moines Metro Area have decided to adopt this regional approach. In May 2012, the City of Des
Moines contracted with the Department of Community and Regional Planning at Iowa State
University to conduct the first regional analysis of impediments to fair housing in the Greater
Des Moines Metro Area. The regional study area included fifteen cities and jurisdictions in
addition to the entitlement cities of Des Moines and West Des Moines. The study was completed
in consultation with Des Moines city staff and the team from the Des Moines Area Metropolitan
Planning Organization’s The Tomorrow Plan.
The primary question guiding the study was: What are the impediments to fair housing in the
Greater Des Moines Metro Area? This report identifies specific impediments to fair housing in
the region and suggests action steps to overcome these barriers. This analysis is expected to
guide housing policy decisions in the region and feed into the region’s ongoing planning efforts.
For example, the City of Des Moines’ Comprehensive Plan and Zoning Code updates,
neighborhood revitalization plans, and DMAMPO’s “The Tomorrow Plan”.
The Greater Des Moines Metro Area Regional Analysis of Impediments to Fair Housing Choice
2
Impediments and Possible Solutions
The following list provides the primary impediments identified through this study. It is important
to remember that some issues relate to more than one impediment, for example the changing
demographics in the region involve populations that bring cultural and language differences.
This can lead to barriers for households in accessing fair housing information, securing financial
resources, or finding culturally sensitive housing options.
The study also provides a series of recommendations that can act as a starting place for further
discussion about fair housing issues in the region. It analyzes demographic and housing
characteristics that impact housing choice and fair housing in the region. This analysis is only a
beginning. It provides an opportunity to begin a regional conversation about housing and fair
housing choice. Current local planning efforts as well as planning efforts associated with The
Tomorrow Plan provide a forum for continuing these conversations.
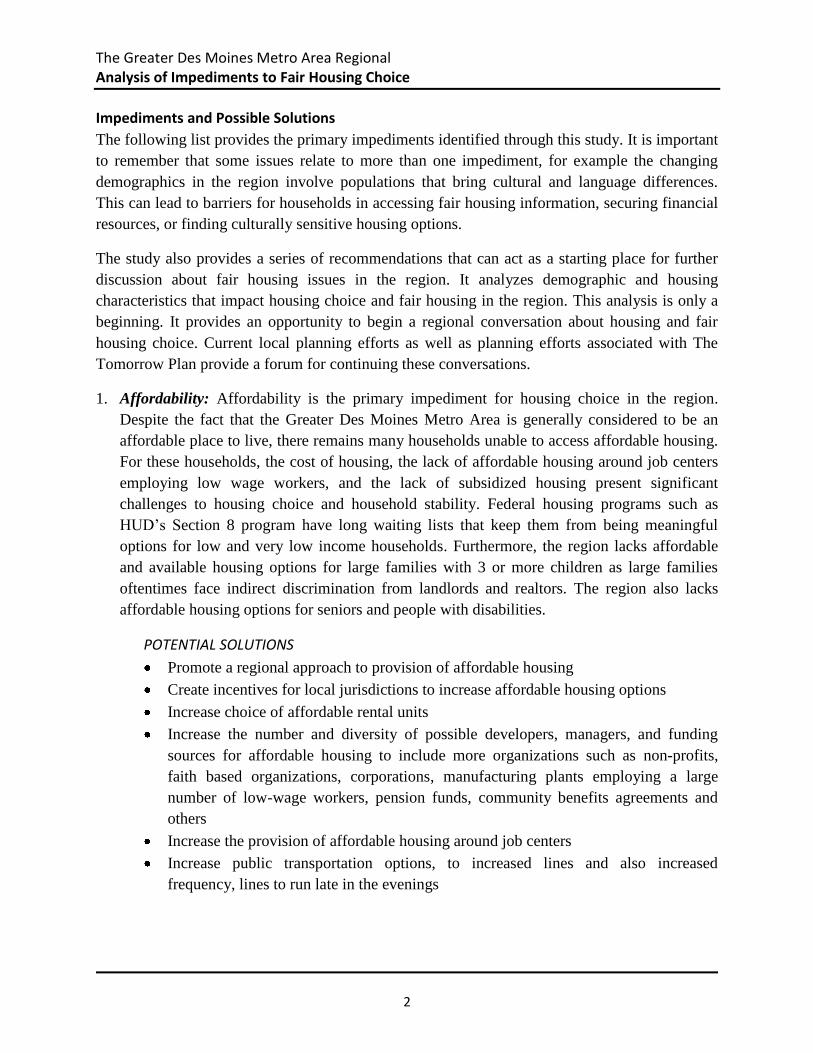
1. Affordability: Affordability is the primary impediment for housing choice in the region.
Despite the fact that the Greater Des Moines Metro Area is generally considered to be an
affordable place to live, there remains many households unable to access affordable housing.
For these households, the cost of housing, the lack of affordable housing around job centers
employing low wage workers, and the lack of subsidized housing present significant
challenges to housing choice and household stability. Federal housing programs such as
HUD’s Section 8 program have long waiting lists that keep them from being meaningful
options for low and very low income households. Furthermore, the region lacks affordable
and available housing options for large families with 3 or more children as large families
oftentimes face indirect discrimination from landlords and realtors. The region also lacks
affordable housing options for seniors and people with disabilities.
POTENTIAL SOLUTIONS
Promote a regional approach to provision of affordable housing
Create incentives for local jurisdictions to increase affordable housing options
Increase choice of affordable rental units
Increase the number and diversity of possible developers, managers, and funding
sources for affordable housing to include more organizations such as non-profits,
faith based organizations, corporations, manufacturing plants employing a large
number of low-wage workers, pension funds, community benefits agreements and
others
Increase the provision of affordable housing around job centers
Increase public transportation options, to increased lines and also increased
frequency, lines to run late in the evenings
The Greater Des Moines Metro Area Regional Analysis of Impediments to Fair Housing Choice
3
Create incentives for private developers to invest in developing and rehabilitating
affordable housing. This can be done by creating programs that provide flexibility in
meeting code compliance requirements while ensuring health and safety of its
residents.
Education and technical resources for low skilled individuals
Educational resources on how to maintain and keep homes
More programs for emergency services when households are at risk of losing housing
Consider new forms of affordable rental units, such as co-op options that can help
reduce the rent-burden for individual households
Promote the use of universal design in new construction to increase housing options
for seniors and people with disabilities
Educational resources towards financial management of household income
Educational resources on how to buy and maintain a house
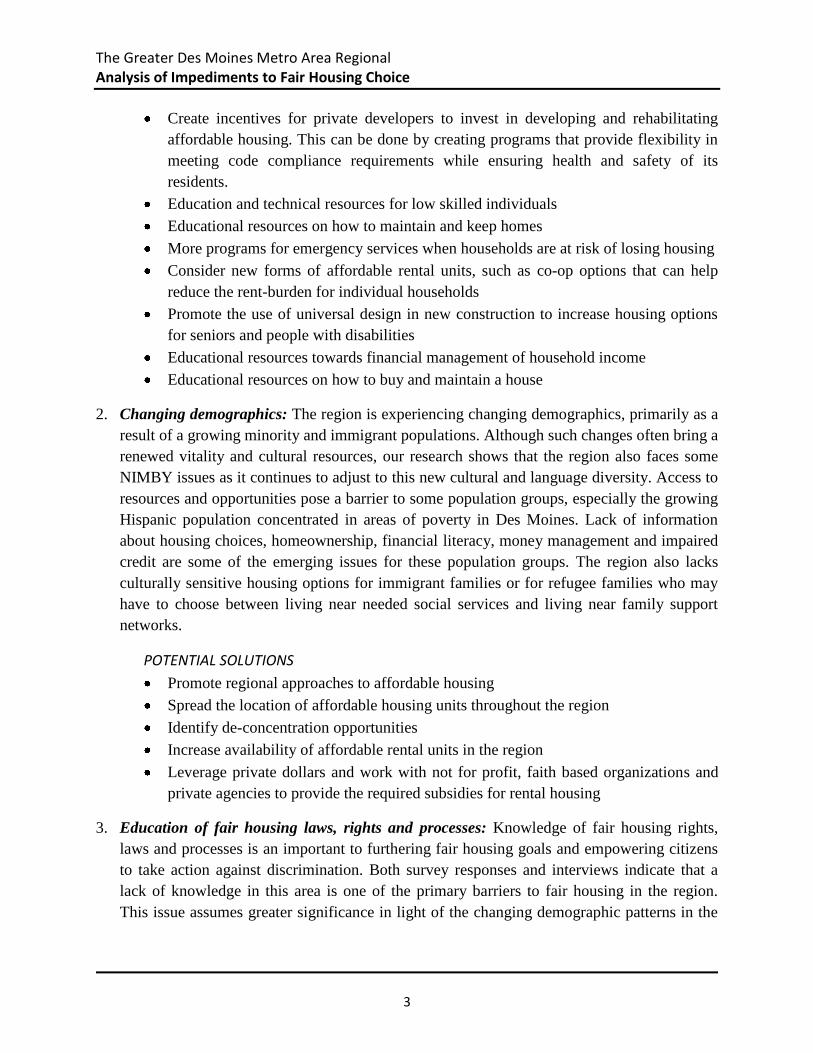
2. Changing demographics: The region is experiencing changing demographics, primarily as a
result of a growing minority and immigrant populations. Although such changes often bring a
renewed vitality and cultural resources, our research shows that the region also faces some
NIMBY issues as it continues to adjust to this new cultural and language diversity. Access to
resources and opportunities pose a barrier to some population groups, especially the growing
Hispanic population concentrated in areas of poverty in Des Moines. Lack of information
about housing choices, homeownership, financial literacy, money management and impaired
credit are some of the emerging issues for these population groups. The region also lacks
culturally sensitive housing options for immigrant families or for refugee families who may
have to choose between living near needed social services and living near family support
networks.
POTENTIAL SOLUTIONS
Promote regional approaches to affordable housing
Spread the location of affordable housing units throughout the region
Identify de-concentration opportunities
Increase availability of affordable rental units in the region
Leverage private dollars and work with not for profit, faith based organizations and
private agencies to provide the required subsidies for rental housing
3. Education of fair housing laws, rights and processes: Knowledge of fair housing rights,
laws and processes is an important to furthering fair housing goals and empowering citizens
to take action against discrimination. Both survey responses and interviews indicate that a
lack of knowledge in this area is one of the primary barriers to fair housing in the region.
This issue assumes greater significance in light of the changing demographic patterns in the
The Greater Des Moines Metro Area Regional Analysis of Impediments to Fair Housing Choice
4
region, as minority and immigrant population groups continue to grow. Language barriers
add an additional dimension to this issue.
POTENTIAL SOLUTIONS
Increase outreach within the minority and immigrant population groups
Partner with faith based organizations to reach these population groups
Provide educational resources of laws and rights, and available housing options
Increase community education clarifying myths around public and low income
housing
Increase community exposure to various cultures, norms, differences and
dissimilarities among population groups
Support the creation of a regional minority and ethnic representative taskforce to
provide recommendations with housing related issues
Partner with existing minority and ethnic groups and encourage links between
housing and existing services
Investigate options to assist foreign born population groups who may not be eligible
for federal assistance.
Provide certified and registered translation services to immigrant populations. Provide
language services within various city departments.
4. Geographic concentration of subsidized and affordable housing: Most affordable and
subsidized housing is currently concentrated in Des Moines. The concentration of subsidized
housing especially in predominantly poor neighborhoods raises concerns of disparity in
access to opportunities and lack of access to jobs. Racial and ethnic segregation in the region
is perpetuated and continued through this concentration of subsidized housing.
POTENTIAL SOLUTIONS
Increased outreach region-wide.
Identify and partner with grassroots, citizen groups, minority groups, faith based
organizations, merchant association, and minority and immigrant lending
organizations. Faith based organizations can play an important role in this effort.
Partner with Institutions and schools to increase outreach and seek volunteers to seek
most vulnerable population groups.
Increase resources for existing human rights commissions
The Greater Des Moines Metro Area Regional Analysis of Impediments to Fair Housing Choice
5
5. Landlord screening requirements: Landlords, property managers and owners are
increasingly using tenant selection criteria that result in exclusion of certain populations like
seniors, disabled population, and low-income individuals. These restrictive conditions
include criminal background checks, credit history, and eviction history and do not allow for
a case-by-case consideration of tenants.
POTENTIAL SOLUTIONS
Increased education of fair housing laws and rights for landlords, property owners
and developers
Increased education of fair housing laws, rights and responsibilities for tenants
Work with landlords and property owners to create a tenant reentry program that
allows individuals and families avail housing if they meet certain criteria to establish
credibility as a tenant
Work with landlords and property managers/owners to look at tenants on a case by
case basis and be flexible with the tenant screening requirements
6. Support services for homeowners: Most affordable housing is concentrated in Des Moines
and is part of an aging housing stock. Little of this existing housing stock meets the
requirements of the elderly, disabled and large and multi-generational families. The high cost
of rehabilitating old houses and absence of private developer interest in bringing some of
these units up to code creates a further shortage of safe, accessible and affordable housing for
seniors and people with disabilities. In addition, many of the region’s low-income
homeowners are in need of resources that will allow them to maintain their homes and stay in
compliance with code regulations. There are few programs in the region for households that
require more extensive assistance, such as case management, to maintain housing that they
own in the face of on-going or unexpected challenges. In the current fiscally constrained
climate, city and county agencies are unlikely to increase the services they offer, but more
households are likely to be in need of services. This creates a challenging situation for low-
income homeowners struggling to maintain their housing.
POTENTIAL SOLUTIONS
Create partnerships with non-governmental service providers and private sector
partners
Create or expand programs to provide supportive services to low income, senior, and
disabled home owners
The Greater Des Moines Metro Area Regional Analysis of Impediments to Fair Housing Choice
6
7. Zoning: Land use and development policies and zoning provisions affect the range of
housing choices available across jurisdictions. The region includes little inclusionary zoning,
and variance in zoning laws across jurisdictions pushes populations from more restrictive
jurisdictions and into cities that have more permissive codes. This inconsistency across city
lines leads to concentrations of poverty in the urban core and tends to exclude lower income
populations from suburban communities.
POTENTIAL SOLUTIONS
Implement inclusionary zoning for municipalities within the region or on a case by
case basis for new Planned Unit Development projects
Increase zoning areas that allow the development of multifamily developments
Create an affordable housing overlay to minimize barriers to affordable housing
within local zoning codes
8. Homelessness: Chronic homelessness and near homelessness remain a cause for concern in
the region. The homeless population includes individuals and families unable to find housing
they could afford as well as individuals with mental health issues, substance abuse, chemical
dependency, and sex offenders. The lack of adequate support services to help these groups
find and maintain suitable housing in a timely manner, prohibits these individuals from
seeking appropriate, safe and affordable housing.
POTENTIAL SOLUTIONS
Add more emergency shelter beds in more locations across the region to the current
homeless sheltering system
Create additional transitional housing options for each homeless subgroup
Expand the mandate of the Homeless Coordinating Council to include coordination
with regional planning efforts
The Greater Des Moines Metro Area Regional Analysis of Impediments to Fair Housing Choice
7
1. INTRODUCTION
The Greater Des Moines Metro Area, repeatedly recognized for its high quality of life and
moderate cost of living, is home to approximately 18% of the population of the State of Iowa.
While the region’s overall growth rate is modest, the diversity of residents, especially in terms of
racial and cultural backgrounds, is increasing dramatically in some areas. In order to ensure that
the benefits of the region are made available to all its inhabitants, civic leaders must ensure that
an environment exists where equal access to housing opportunities is treated as a fundamental
right. In order to maintain the region’s high quality of life and ability to attract new residents and
new economic opportunity, the issue of fair housing choice must have a place on the regional
agenda.
1.1 THE PURPOSE OF THE REPORT
Fair access to housing is a fundamental right recognized by the U.S federal government and the
State of Iowa. Discrimination in housing denies material opportunities as well as opportunities of
growth to individuals and communities, limiting their full potential and undermining their ability
to be resilient in the face of change. HUD defines impediments to fair housing choice as:
Any actions, omissions, or decisions that restrict, or have the effect of restricting,
the availability of housing choices, based on race, color, religion, sex, disability,
familial status, or national origin (HUD, 2012).
The seventeen jurisdictions within the Greater Des Moines Metro Area including Des Moines
and West Des Moines are working to ensure that fair housing choice is a reality for all the
region’s residents. This report will inform the planning and implementing of that work.
CDBG Reporting Requirements
The City of Des Moines annually receives federal entitlement funds through the U.S. Department
of Housing and Urban Development (HUD) to further national goals that include:
Provide decent, safe, and sanitary housing,
Provide a suitable living environment, and to
Expand economic opportunities
Community-wide programs and activities are supported through the Community Development
Block Grant (CDBG) program which focuses program benefits to low- and moderate-income
households, the Home Investment Partnership (HOME) program for construction and
rehabilitation of affordable housing, and the Emergency Solutions Grant (ESG) program which
The Greater Des Moines Metro Area Regional Analysis of Impediments to Fair Housing Choice
8
is part of the Federal HEARTH Act funding to deal with homelessness and assist households at-
risk of homelessness.
This report fulfills CDBG regulations [24 CFR Subtitle A §91.225(a)(1)], which state that in
order to receive CDBG funds, each entitlement community must certify that it “actively furthers
fair housing choice” through the following:
Completion of an Analysis of Impediments to Fair Housing Choice (AI);
Actions to eliminate identified impediments; and
Maintenance of fair housing records.
The analysis identifies factors that affect the availability of a wide range of housing choices and
the barriers that limit those housing choices. An analysis of impediments must therefore involve
the following:
A review of a state or entitlement jurisdiction’s laws, regulations, and
administrative policies, procedures, and practices;
An assessment of how those laws affect the location, availability, and
accessibility of housing;
An evaluation of the conditions, both public and private, affecting fair housing
choice for all protected classes; and
An assessment of the availability of affordable, accessible housing in a range of
unit sizes.
The HUD Consolidated Plan
The HUD Consolidated Plan (ConPlan) is a five-year Strategic Plan for Affordable Housing,
with yearly progress reports. It describes how a city’s entitlement funds are coordinated with
non-federal resources and other planning strategies to tackle priority need and specific goals at
the local level for the purpose of achieving a greater impact.
To provide a framework for identifying housing and community development priorities, the
ConPlan references several data resources; housing market conditions, demographic profiles,
housing affordability and economic data. The Analysis of Impediments to Fair Housing Choice
(AI) is a key report required by HUD to provide informed guidance about local barriers to fair
housing.
This report will be an update to the City of Des Moines’ 2009 Analysis of Impediments prepared
for the 2010-2014 HUD Consolidated Plan. As Des Moines gets ready to outline its next five-
year Strategic Plan, the information presented in the AI for Des Moines and the surrounding
region will add depth to their understanding of housing equity needs and priorities for low- and
moderate-income households.
The Greater Des Moines Metro Area Regional Analysis of Impediments to Fair Housing Choice
9
1.2 REGIONAL FOCUS OF THE STUDY
HUD has begun to encourage entitlement districts to take a regional approach when evaluating
impediments to fair housing and to conduct a unified Regional Analysis of Impediments
(Regional AI). Fair housing issues are oftentimes best addressed on a regional level since
housing choice implies mobility. As a result, a Regional AI, because it provides a comprehensive
picture of the status of fair housing at the local, regional and state levels, allows jurisdictions to
tackle issues more effectively.
Fair housing choice is a regional issue that extends beyond the jurisdictional boundaries of Des
Moines and West Des Moines, the region’s two entitlement communities. However, this report
marks the first time impediments to fair housing choice has been analyzed at a regional rather
than a jurisdictional level in the Des Moines area. It is our expectation that this report will serve
as a baseline for future investigations and planning efforts regarding fair housing choice in the
region. The findings from this report will inform the upcoming consolidated plans for the
entitlement cities of Des Moines and West Des Moines as well as the Des Moines Metropolitan
Planning Organization’s larger The Tomorrow Plan initiative.1
An important component of the Regional AI is the engagement of participating jurisdictions in
the analysis of impediments and the collaboration between them in designing and implementing
appropriate solutions. HUD terms this engagement as the ‘bridge’ in regional planning from
analysis to engagement to decision making for all participating jurisdictions. For the Greater Des
Moines Metro Area, The Tomorrow Plan efforts will take on the role of the bridge. Their success
in this area can be measured by future regional AI reports.
The study was initiated in response to HUD’s requirement for a regional perspective to housing
issues. This regional perspective is expected to enable local governments to make knowledgeable
policy decisions to tackle fair housing issues in the region. It is also more cost efficient since
multiple jurisdictions can use the same regional analysis of impediments or its components rather
than creating individual reports. West Des Moines conducted their previous analysis of
impediments study in 2008 and Des Moines conducted their study in 2009. The regional analysis
builds from the earlier studies and takes them further by incorporating all jurisdictions located
within the MPO boundaries.
1 The Tomorrow Plan is a regional planning effort for the Greater Des Moines Region that incorporates several
elements of sustainability and looks out to the year 2050.
The Greater Des Moines Metro Area Regional Analysis of Impediments to Fair Housing Choice
10
1.3 STUDY AREA BOUNDARIES
Although the Regional AI covers all jurisdictions located within the Des Moines – West Des
Moines Metropolitan Statistic Area (MSA), the formal boundaries for this study are the
boundaries used by the Des Moines Area Metropolitan Planning Organization (DMMAPO). This
area is referred to as the Greater Des Moines Metro Area. It includes a majority of Polk County
and extends into Dallas, Warren, and Madison Counties. Although these boundaries represent a
smaller subset of the MSA, they allow this study to better coordinate with existing planning
efforts in the region.
The following seventeen local jurisdictions are included in the study area:
1. Des Moines
2. West Des Moines
3. Ankeny
4. Johnston
5. Urbandale
6. Clive
7. Windsor Heights
8. Grimes
9. Waukee
10. Altoona
11. Bondurant
12. Cumming
13. Carlisle
14. Pleasant Hill
15. Norwalk
16. Polk City
17. Mitchellville
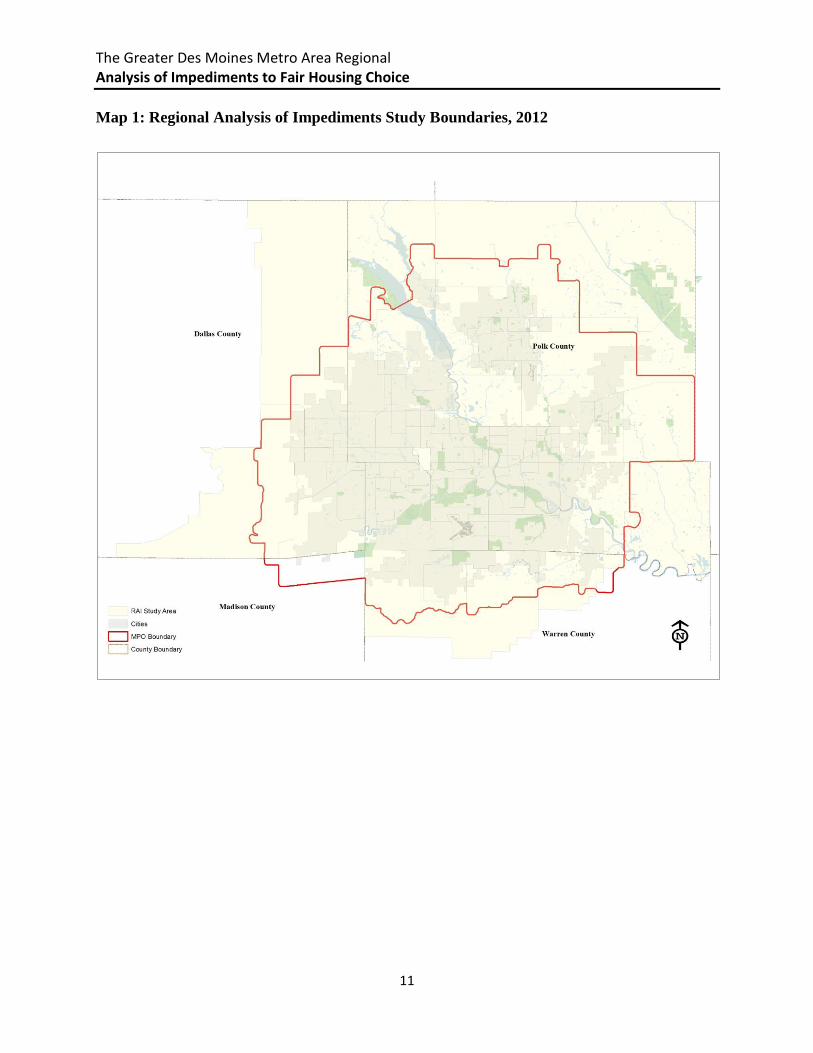
The Greater Des Moines Metro Area includes parts of three census tracts that extend beyond the
MPO boundaries into predominantly rural county areas. For purposes of comprehensiveness,
these census tracts are included in the analysis for this report. The portions of these tracts that
extend outside the study area are not heavily inhabited and are unlikely to skew demographic and
housing data. Excluding them could result in the underestimation of data because the portions of
these census tracts that are within the MPO boundaries that have seen steady growth. See Map 1
for the boundaries of the Greater Des Moines Metro Area as well as Polk, Dallas, Warren, and
Madison counties.
The Greater Des Moines Metro Area Regional Analysis of Impediments to Fair Housing Choice
11
Map 1: Regional Analysis of Impediments Study Boundaries, 2012

The Greater Des Moines Metro Area Regional Analysis of Impediments to Fair Housing Choice
12
1.4 PROCESS AND METHODOLOGY
In May 2012, the City of Des Moines contracted with the Department of Community and
Regional Planning at Iowa State University to conduct a regional assessment of impediments to
fair housing choice in the Greater Des Moines Metro Area. The Iowa State team conducted
research from June 2012 to September 2012 and through this study, identified specific barriers to
fair housing in the region. This report details the findings of that study.
Framing the Study
The study asks one central question: What are the impediments to fair housing choice in the
Greater Des Moines Metro Area?
This study investigates these barriers by exploring a set of HUD-suggested inquiries related to
segregation and racial/ethnic concentrations in housing. An analysis of impediments must
identify segregation by answering the following questions:
1. Is the area segregated? Is the segregation by race? By one or more forms of national
origin?
2. Are particular racial/ethnic minorities more segregated than others?
3. Are particular jurisdictions or areas within a jurisdiction far below their predicted
racial/ethnic population based on their current economic profile?
The analysis must also identify racial and/or ethnic concentration in the region by asking the
following questions:
1. Does the region contain racially concentrated areas of poverty (RCAPs) or ethnically
concentrated areas of poverty (ECAPs)? If so, what percentage of the regional
population resides in RCAPs or ECAPs?
2. Are particular racial/ethnic minorities acutely concentrated in RCAPs/ECAPs?
3. Do certain jurisdictions have the majority of the region’s RCAPs/ECAPs?
4. How much HUD subsidized housing/assisted housing/Low Income Housing Tax Credit
(LIHTC) housing is in each concentrated area?
Geographic Aggregations
Entitlement cities and jurisdictions involved in a regional assessment of impediments study have
the discretion to decide what kind of geographic aggregations make most sense. In the present
case, the U.S. Census and American Community Survey data is collected and analyzed at census
tract level. While the MPO boundaries are used as a reference to identify census tracts to be
included in the study (Map 1), the data for entitlement cities and jurisdictions is compared with
the MSA aggregates to identify regional trends and patterns. The MPO and MSA boundaries do

The Greater Des Moines Metro Area Regional Analysis of Impediments to Fair Housing Choice
13
not differ much from each other, with the MPO boundaries being a subset of the MSA. The MPO
boundaries are used to keep the data manageable.
Research Techniques
The study adopted a mixed methods approach that incorporated both quantitative and qualitative
research techniques. This included an in-depth analysis of both the historical trends and existing
demographics, socio-economic characteristics, spatial distribution of population and services,
semi-structured and open-ended interviews, surveys, focus group discussions and archival and
document research.
This study used a web-based survey to maximize stakeholder input within the allotted time
frame. The survey questionnaire included a total of nine questions (see Appendix A) and was
designed to ask the most pertinent and important questions related to provision of and access to
fair housing in the region including barriers to affordable housing, homeownership, and fair
housing. We sent the survey to representatives from a mix of city jurisdictions, housing
providers, regional housing agencies, lenders, developers, social and support service providers,
non-profit citizen groups, neighborhood associations and the Neighborhood Review Board
(NRB).
Participants for the survey were identified from a number of sources. The MPO identified
representatives from city jurisdictions and agencies and the sample was then expanded using the
‘snowball’ method. Staff from the City of Des Moines suggested an initial set of contacts from
non-profit organizations and these contacts were asked to refer and identify other people with
interest and association with housing in the region. This method was successful in identifying
participants who work with fair and/or affordable housing and groups and individuals working
with immigrant and minority populations. The web survey was administered using the Survey
Monkey tool, and participants received the survey link via email. After we sent out a survey link,
we followed up with reminder emails and individual phone calls that helped increase the overall
response rate. This process continued for approximately two months, as new and important
participants were identified.
We received a total of 61 survey responses representing a range of organizations including: city
agencies, regional housing agencies, housing providers, lenders, for-profit developers, social
service providers and advocate groups, and citizen representatives. Eight neighborhood
associations participated in the survey. We also saw good response from all city jurisdictions,
planning departments and citizen support groups; however, we only received a single response
from the for-profit developer group.
The Greater Des Moines Metro Area Regional Analysis of Impediments to Fair Housing Choice
14
In addition to the surveys, we conducted a total of 12 interviews with individuals from a variety
of organizations related to the provision of housing in the region. These included funding
agencies and lenders, housing developers and providers, non-profit community service providers,
social service providers, citizen representative groups and research agencies. We also used two
focus groups as part of the research process, one with affordable housing providers and one with
developers working in the region. These focus groups were conducted in conjunction with The
Tomorrow Plan team.

The Greater Des Moines Metro Area Regional Analysis of Impediments to Fair Housing Choice
15
2. REGIONAL DEMOGRAPHIC PROFILE
This chapter provides the demographic background for the Greater Des Moines Metro Area by
race, national origin, disability status, families with children and the elderly. The demographic
profile analyzes data from 2000 and 2010 in order to identify patterns of change in the region.
The steady increase in the overall population in the state and the Des Moines Metropolitan
Statistical Area (MSA) includes a corresponding increase in minority and foreign born
populations. In order to further evaluate this dynamic, the chapter also includes a section on
segregation of different population groups by race.
Table 1: Population Change in the Greater Des Moines Metro Area, 2000 to 2010
Jurisdiction
Total
population
2010
Total
population
2000
Population
change from
2000 to 2010
Percent
change from
2000 to 2010
Entitlement Jurisdictions
Des Moines 203,433 198,682 4,751 2.4
West Des Moines 56,609 46,403 10,206 22.0
Others
Altoona 14,541 10,345 4,196 40.6
Ankeny 45,582 27,117 18,465 68.1
Bondurant 3,860 1,846 2,014 109.1
Carlisle 3,876 3,497 379 10.8
Clive 15,447 12,855 2,592 20.2
Cumming 351 162 189 116.7
Grimes 8,246 5,098 3,148 61.7
Johnston 17,278 8,649 8,629 99.8
Mitchellville 2,254 1,715 539 31.4
Norwalk 8,945 6,884 2,061 29.9
Pleasant Hill 8,785 5,070 3,715 73.3
Polk City 3,418 2,344 1,074 45.8
Urbandale 39,463 29,072 10,391 35.7
Waukee 13,790 5,126 8,664 169.0
Windsor Heights 4,860 4,805 55 1.1
Total 450,738 369,670 81,068 21.9 Source: Analysis of 2000 and 2010 Census data

The Greater Des Moines Metro Area Regional Analysis of Impediments to Fair Housing Choice
16
Map 2: Total Population in the Greater Des Moines Metro Area, 2010
Source: Analysis of Census 2010 data
The Greater Des Moines Metro Area Regional Analysis of Impediments to Fair Housing Choice
17
2.1 POPULATION AND RACE
Des Moines is the largest and most densely populated jurisdiction in the region, but it saw a very
small growth of 2.4 percent in the past decade. On the other hand, the growth rate in West Des
Moines from 2000 to 2010 was 22 percent (Table 1). Most suburbs followed patterns similar to
West Des Moines, particularly the western suburbs of Clive, Johnston, Urbandale, Grimes and
Waukee. In the last ten years, the population of Johnston doubled and the population of Waukee
increased 169 percent. Ankeny, a growing community to the east of Des Moines, saw the largest
increase in terms of absolute numbers at 18,465 persons. Map 2 shows the distribution of the
total population in the Greater Des Moines Metro Area in 2010.
Historically, the State of Iowa has been racially homogenous and continues to have more than 90
percent white inhabitants. Table 2 shows the racial and ethnic distribution in 2000 and 2010 for
the State of Iowa, the entitlement communities of Des Moines and West Des Moines, and the
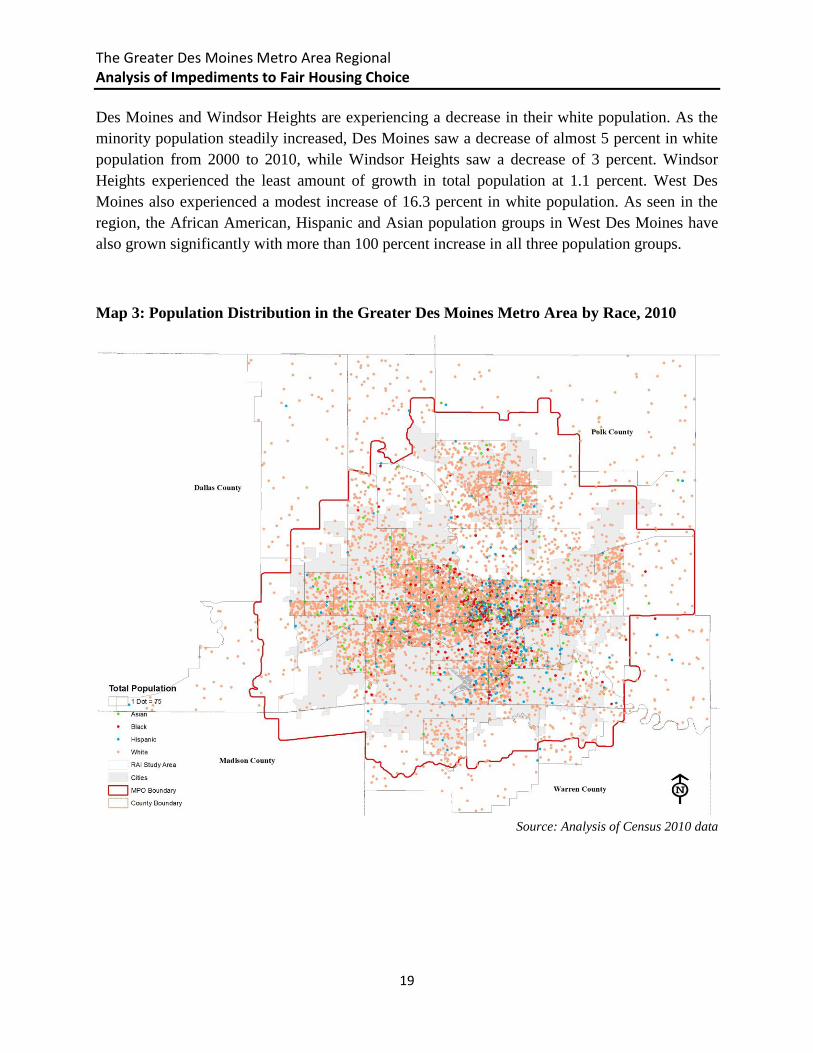
additional jurisdictions in the Greater Des Moines Metro Area. Map 3 shows the population
distribution by race in the Greater Des Moines Metro Area for 2010 and Map 4 shows the same
information, but specifically for Des Moines and West Des Moines.
These data reveal a changing region. The minority population in the state has increased slightly
in the past decade, with the biggest change in the Hispanic population that increased from 2.8 to
5.0 percent. Although the highest concentrations of minority groups are still found within the
jurisdictional boundaries of Des Moines, the distribution of population groups by race is
changing slightly across the region. Slowly, the region is becoming more diverse.
Although Des Moines is predominantly white, it is more racially diverse than the state and more
racially diverse than its suburbs. In 2010, almost 24 percent of the city was non-white compared
to less than 9 percent in the State of Iowa. Between 2000 and 2010, the city’s Hispanic
population nearly doubled, going from 6.6 percent to 12 percent. Des Moines also saw an
increase in its African American population in this time period.
The Greater Des Moines Metro Area Regional Analysis of Impediments to Fair Housing Choice
18
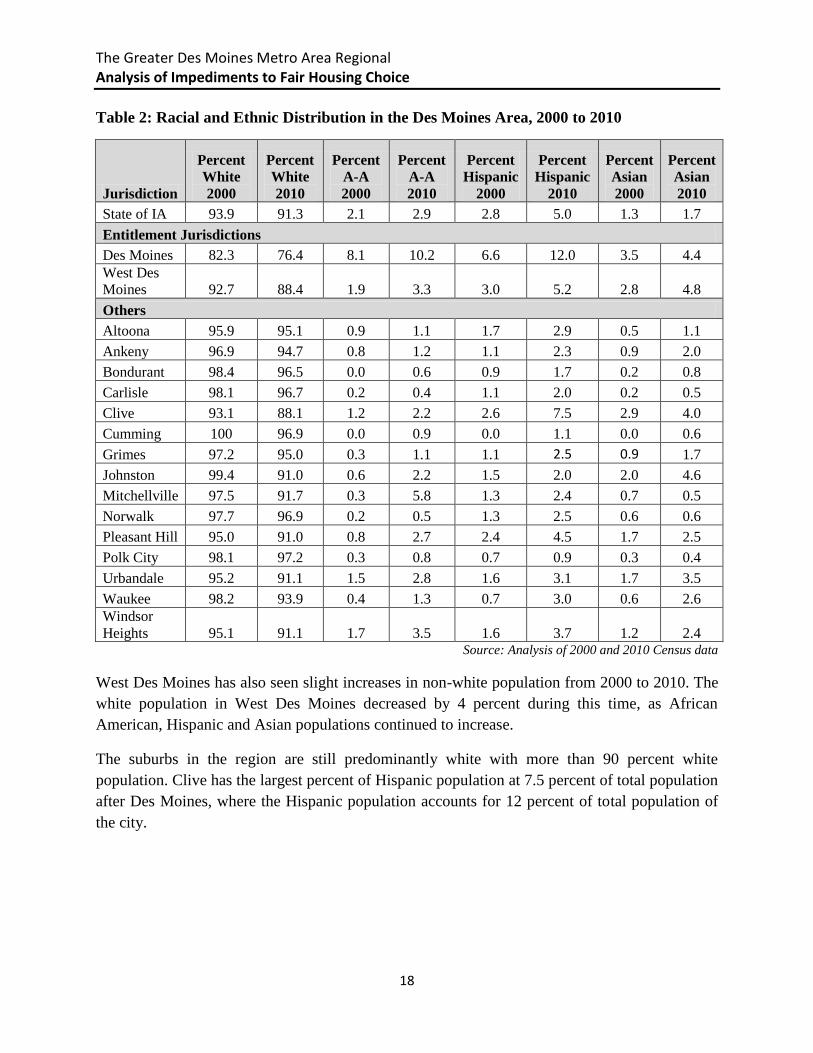
Table 2: Racial and Ethnic Distribution in the Des Moines Area, 2000 to 2010
Jurisdiction
Percent
White
2000
Percent
White
2010
Percent
A-A
2000
Percent
A-A
2010
Percent
Hispanic
2000
Percent
Hispanic
2010
Percent
Asian
2000
Percent
Asian
2010
State of IA 93.9 91.3 2.1 2.9 2.8 5.0 1.3 1.7
Entitlement Jurisdictions
Des Moines 82.3 76.4 8.1 10.2 6.6 12.0 3.5 4.4
West Des
Moines
92.7
88.4 1.9 3.3 3.0 5.2 2.8 4.8
Others
Altoona 95.9 95.1 0.9 1.1 1.7 2.9 0.5 1.1
Ankeny 96.9 94.7 0.8 1.2 1.1 2.3 0.9 2.0
Bondurant 98.4 96.5 0.0 0.6 0.9 1.7 0.2 0.8
Carlisle 98.1 96.7 0.2 0.4 1.1 2.0 0.2 0.5
Clive 93.1 88.1 1.2 2.2 2.6 7.5 2.9 4.0
Cumming 100 96.9 0.0 0.9 0.0 1.1 0.0 0.6
Grimes 97.2 95.0 0.3 1.1 1.1 2.5 0.9 1.7
Johnston 99.4 91.0 0.6 2.2 1.5 2.0 2.0 4.6
Mitchellville 97.5 91.7 0.3 5.8 1.3 2.4 0.7 0.5
Norwalk 97.7 96.9 0.2 0.5 1.3 2.5 0.6 0.6
Pleasant Hill 95.0 91.0 0.8 2.7 2.4 4.5 1.7 2.5
Polk City 98.1 97.2 0.3 0.8 0.7 0.9 0.3 0.4
Urbandale 95.2 91.1 1.5 2.8 1.6 3.1 1.7 3.5
Waukee 98.2 93.9 0.4 1.3 0.7 3.0 0.6 2.6
Windsor
Heights 95.1 91.1 1.7 3.5 1.6 3.7 1.2 2.4 Source: Analysis of 2000 and 2010 Census data
West Des Moines has also seen slight increases in non-white population from 2000 to 2010. The
white population in West Des Moines decreased by 4 percent during this time, as African
American, Hispanic and Asian populations continued to increase.
The suburbs in the region are still predominantly white with more than 90 percent white
population. Clive has the largest percent of Hispanic population at 7.5 percent of total population
after Des Moines, where the Hispanic population accounts for 12 percent of total population of
the city.
The Greater Des Moines Metro Area Regional Analysis of Impediments to Fair Housing Choice
19
Des Moines and Windsor Heights are experiencing a decrease in their white population. As the
minority population steadily increased, Des Moines saw a decrease of almost 5 percent in white
population from 2000 to 2010, while Windsor Heights saw a decrease of 3 percent. Windsor
Heights experienced the least amount of growth in total population at 1.1 percent. West Des
Moines also experienced a modest increase of 16.3 percent in white population. As seen in the
region, the African American, Hispanic and Asian population groups in West Des Moines have
also grown significantly with more than 100 percent increase in all three population groups.
Map 3: Population Distribution in the Greater Des Moines Metro Area by Race, 2010
Source: Analysis of Census 2010 data

The Greater Des Moines Metro Area Regional Analysis of Impediments to Fair Housing Choice
20
Map 4: Population Distribution by Race in Des Moines and West Des Moines by Race,
2010
Source: Analysis of Census 2010 data
Table 3 shows the percent change in the population by race. It provides a helpful snapshot of the
changing and increasing minority population across all suburbs in the region. The minority
population in most areas in the region was very small to begin with in 2000, and while the
numbers still form a considerably small percentage of the total population, these groups area
growing at a rapid pace. This can be seen in the example of Johnston. Johnston saw the biggest
percent increase in the African American population at 652 percent, yet this group forms only
2.2 percent of the total population in Johnston. Similarly, while Waukee saw an increase of
1155.2 percent in its Asian population, this group forms 2.6 percent of the total population in
Waukee.
The Greater Des Moines Metro Area Regional Analysis of Impediments to Fair Housing Choice
21
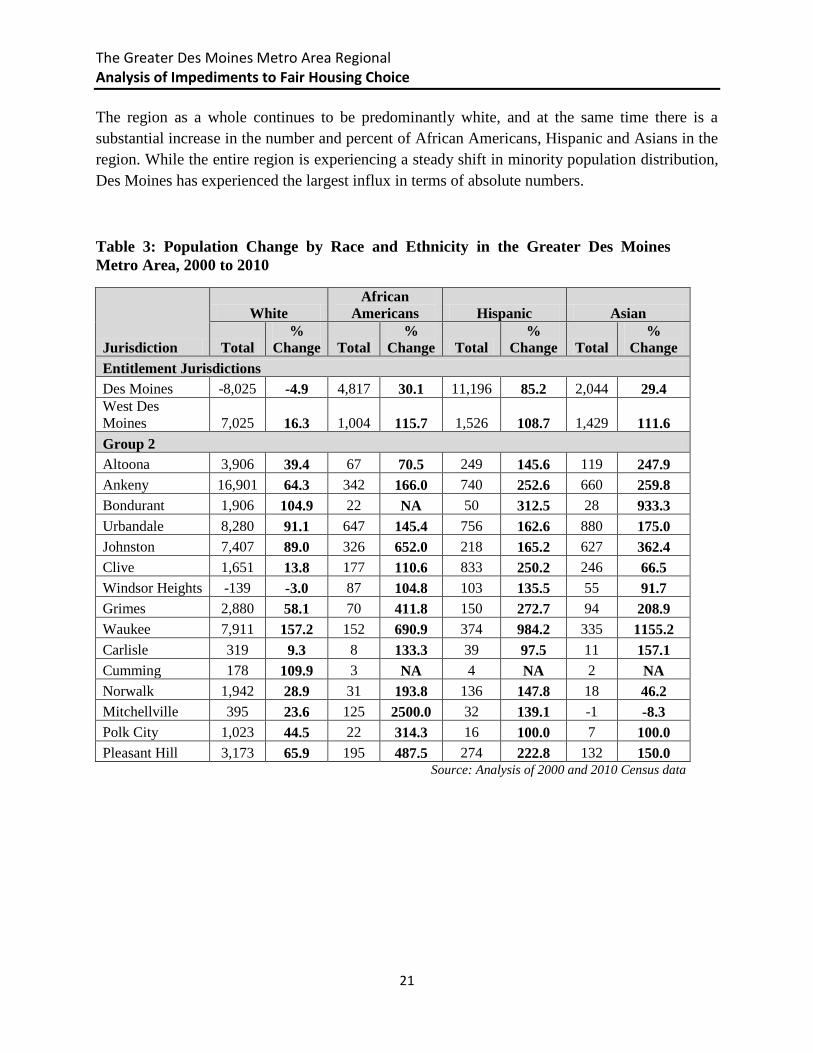
The region as a whole continues to be predominantly white, and at the same time there is a
substantial increase in the number and percent of African Americans, Hispanic and Asians in the
region. While the entire region is experiencing a steady shift in minority population distribution,
Des Moines has experienced the largest influx in terms of absolute numbers.
Table 3: Population Change by Race and Ethnicity in the Greater Des Moines
Metro Area, 2000 to 2010
Jurisdiction
White
African
Americans Hispanic Asian
Total
%
Change Total
%
Change Total
%
Change Total
%
Change
Entitlement Jurisdictions
Des Moines -8,025 -4.9 4,817 30.1 11,196 85.2 2,044 29.4
West Des
Moines 7,025 16.3 1,004 115.7 1,526 108.7 1,429 111.6
Group 2
Altoona 3,906 39.4 67 70.5 249 145.6 119 247.9
Ankeny 16,901 64.3 342 166.0 740 252.6 660 259.8
Bondurant 1,906 104.9 22 NA 50 312.5 28 933.3
Urbandale 8,280 91.1 647 145.4 756 162.6 880 175.0
Johnston 7,407 89.0 326 652.0 218 165.2 627 362.4
Clive 1,651 13.8 177 110.6 833 250.2 246 66.5
Windsor Heights -139 -3.0 87 104.8 103 135.5 55 91.7
Grimes 2,880 58.1 70 411.8 150 272.7 94 208.9
Waukee 7,911 157.2 152 690.9 374 984.2 335 1155.2
Carlisle 319 9.3 8 133.3 39 97.5 11 157.1
Cumming 178 109.9 3 NA 4 NA 2 NA
Norwalk 1,942 28.9 31 193.8 136 147.8 18 46.2
Mitchellville 395 23.6 125 2500.0 32 139.1 -1 -8.3
Polk City 1,023 44.5 22 314.3 16 100.0 7 100.0
Pleasant Hill 3,173 65.9 195 487.5 274 222.8 132 150.0 Source: Analysis of 2000 and 2010 Census data
The Greater Des Moines Metro Area Regional Analysis of Impediments to Fair Housing Choice
22
2.2 NATIONAL ORIGIN
The Fair Housing Act prohibits housing discrimination on the basis of an individual’s national
origin. This means that an individual seeking housing cannot be discriminated against based on
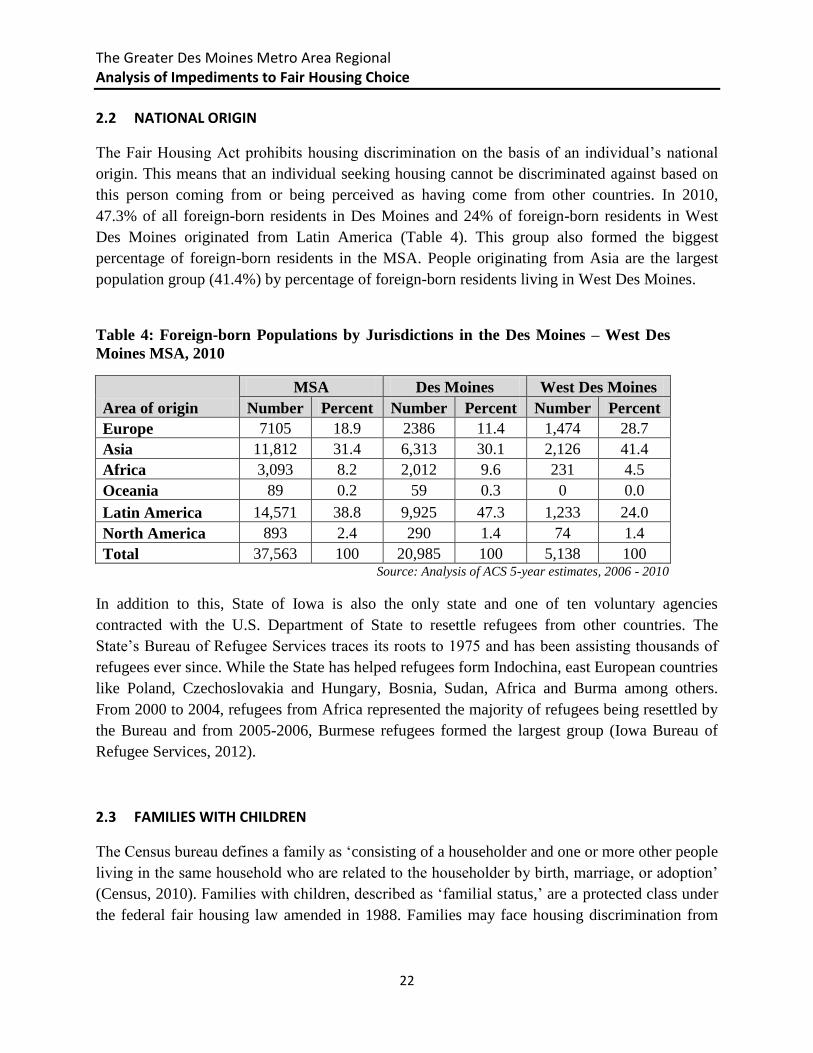
this person coming from or being perceived as having come from other countries. In 2010,
47.3% of all foreign-born residents in Des Moines and 24% of foreign-born residents in West
Des Moines originated from Latin America (Table 4). This group also formed the biggest
percentage of foreign-born residents in the MSA. People originating from Asia are the largest
population group (41.4%) by percentage of foreign-born residents living in West Des Moines.
Table 4: Foreign-born Populations by Jurisdictions in the Des Moines – West Des
Moines MSA, 2010
Area of origin
MSA Des Moines West Des Moines
Number Percent Number Percent Number Percent
Europe 7105 18.9 2386 11.4 1,474 28.7
Asia 11,812 31.4 6,313 30.1 2,126 41.4
Africa 3,093 8.2 2,012 9.6 231 4.5
Oceania 89 0.2 59 0.3 0 0.0
Latin America 14,571 38.8 9,925 47.3 1,233 24.0
North America 893 2.4 290 1.4 74 1.4
Total 37,563 100 20,985 100 5,138 100 Source: Analysis of ACS 5-year estimates, 2006 - 2010
In addition to this, State of Iowa is also the only state and one of ten voluntary agencies
contracted with the U.S. Department of State to resettle refugees from other countries. The
State’s Bureau of Refugee Services traces its roots to 1975 and has been assisting thousands of
refugees ever since. While the State has helped refugees form Indochina, east European countries
like Poland, Czechoslovakia and Hungary, Bosnia, Sudan, Africa and Burma among others.
From 2000 to 2004, refugees from Africa represented the majority of refugees being resettled by
the Bureau and from 2005-2006, Burmese refugees formed the largest group (Iowa Bureau of
Refugee Services, 2012).
2.3 FAMILIES WITH CHILDREN
The Census bureau defines a family as ‘consisting of a householder and one or more other people
living in the same household who are related to the householder by birth, marriage, or adoption’
(Census, 2010). Families with children, described as ‘familial status,’ are a protected class under
the federal fair housing law amended in 1988. Families may face housing discrimination from
The Greater Des Moines Metro Area Regional Analysis of Impediments to Fair Housing Choice
23
landlords or neighbors who fear that children may create noise in the neighborhood or cause
damage to property.
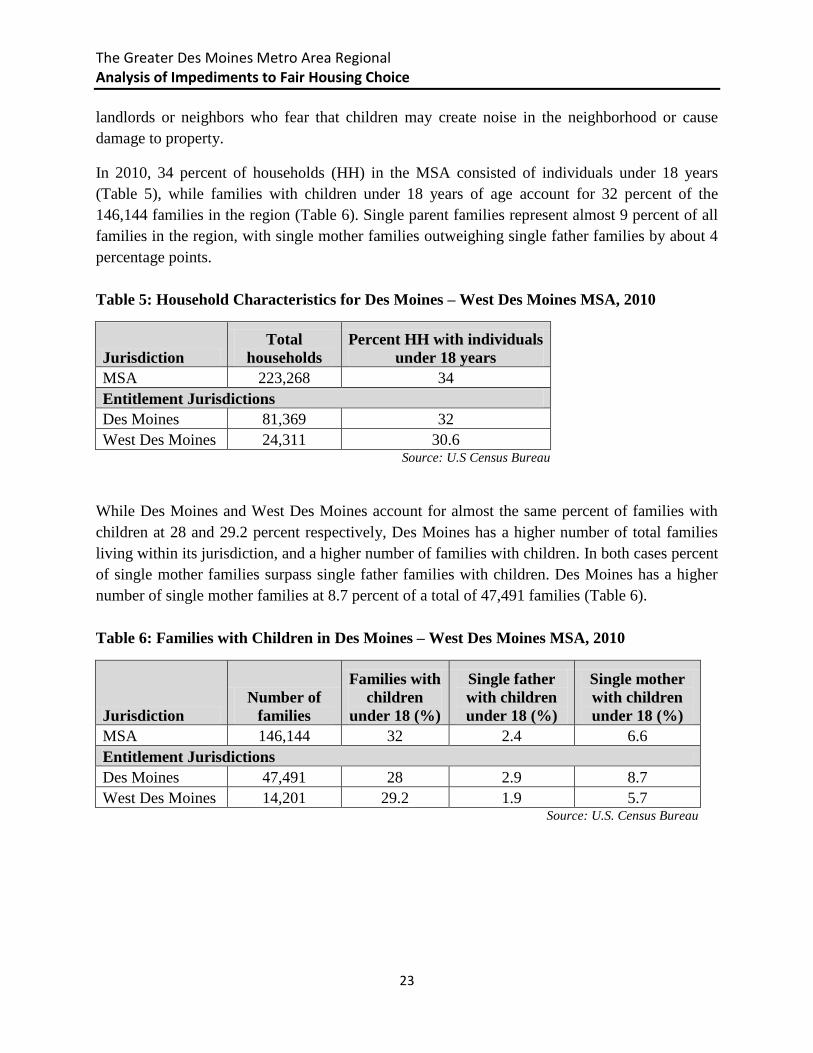
In 2010, 34 percent of households (HH) in the MSA consisted of individuals under 18 years
(Table 5), while families with children under 18 years of age account for 32 percent of the
146,144 families in the region (Table 6). Single parent families represent almost 9 percent of all
families in the region, with single mother families outweighing single father families by about 4
percentage points.
Table 5: Household Characteristics for Des Moines – West Des Moines MSA, 2010
Jurisdiction
Total
households
Percent HH with individuals
under 18 years
MSA 223,268 34
Entitlement Jurisdictions
Des Moines 81,369 32
West Des Moines 24,311 30.6 Source: U.S Census Bureau
While Des Moines and West Des Moines account for almost the same percent of families with
children at 28 and 29.2 percent respectively, Des Moines has a higher number of total families
living within its jurisdiction, and a higher number of families with children. In both cases percent
of single mother families surpass single father families with children. Des Moines has a higher
number of single mother families at 8.7 percent of a total of 47,491 families (Table 6).
Table 6: Families with Children in Des Moines – West Des Moines MSA, 2010
Jurisdiction
Number of
families
Families with
children
under 18 (%)
Single father
with children
under 18 (%)
Single mother
with children
under 18 (%)
MSA 146,144 32 2.4 6.6
Entitlement Jurisdictions
Des Moines 47,491 28 2.9 8.7
West Des Moines 14,201 29.2 1.9 5.7 Source: U.S. Census Bureau
The Greater Des Moines Metro Area Regional Analysis of Impediments to Fair Housing Choice
24
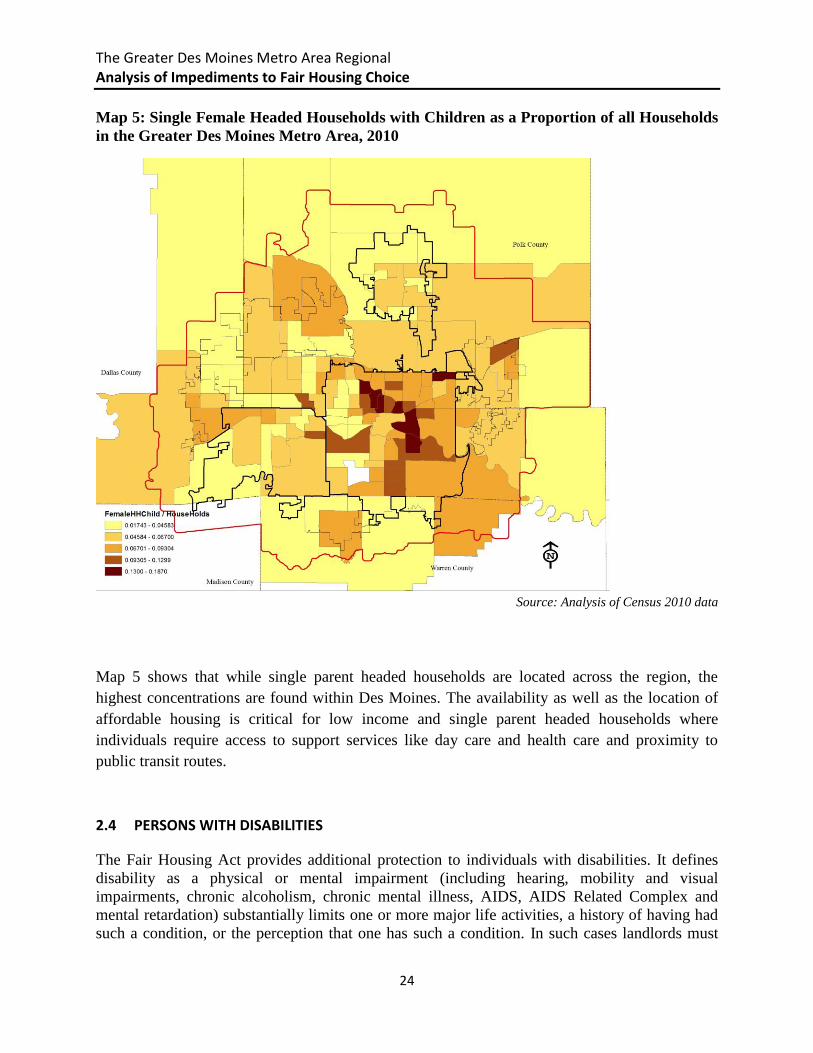
Map 5: Single Female Headed Households with Children as a Proportion of all Households
in the Greater Des Moines Metro Area, 2010
Source: Analysis of Census 2010 data
Map 5 shows that while single parent headed households are located across the region, the
highest concentrations are found within Des Moines. The availability as well as the location of
affordable housing is critical for low income and single parent headed households where
individuals require access to support services like day care and health care and proximity to
public transit routes.
2.4 PERSONS WITH DISABILITIES
The Fair Housing Act provides additional protection to individuals with disabilities. It defines
disability as a physical or mental impairment (including hearing, mobility and visual
impairments, chronic alcoholism, chronic mental illness, AIDS, AIDS Related Complex and
mental retardation) substantially limits one or more major life activities, a history of having had
such a condition, or the perception that one has such a condition. In such cases landlords must
The Greater Des Moines Metro Area Regional Analysis of Impediments to Fair Housing Choice
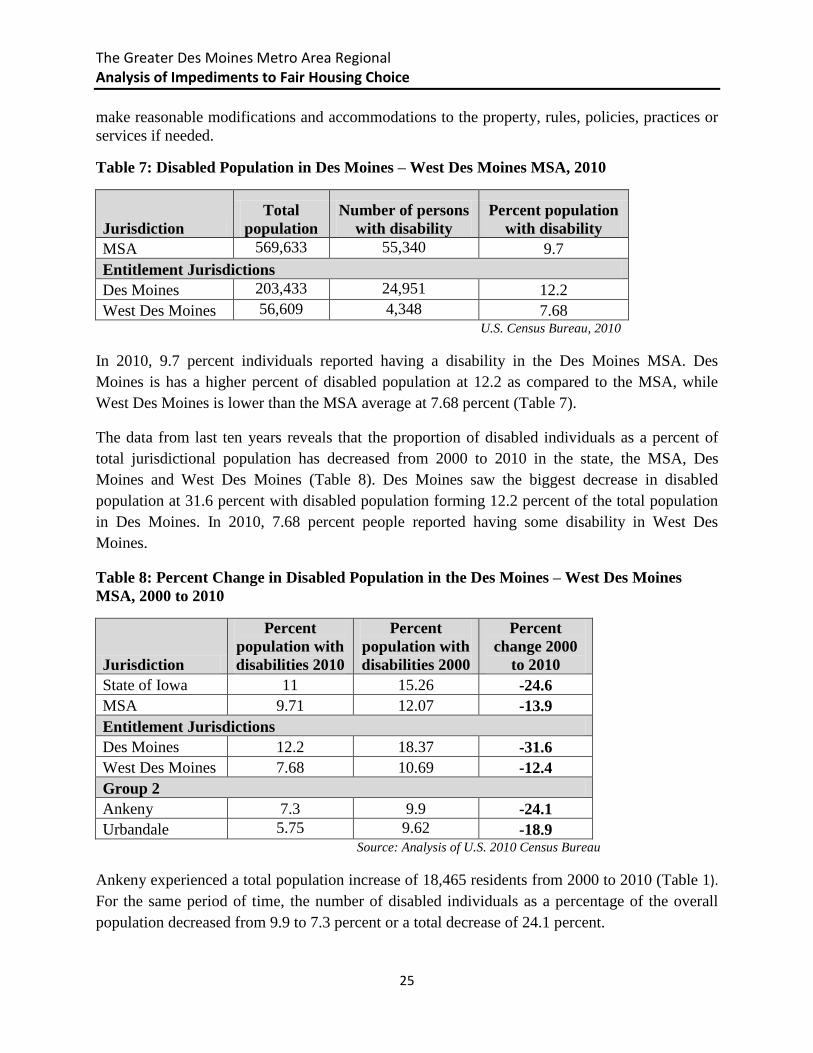
25
make reasonable modifications and accommodations to the property, rules, policies, practices or
services if needed.
Table 7: Disabled Population in Des Moines – West Des Moines MSA, 2010
Jurisdiction
Total
population
Number of persons
with disability
Percent population
with disability
MSA 569,633 55,340 9.7
Entitlement Jurisdictions
Des Moines 203,433 24,951 12.2
West Des Moines 56,609 4,348 7.68 U.S. Census Bureau, 2010
In 2010, 9.7 percent individuals reported having a disability in the Des Moines MSA. Des
Moines is has a higher percent of disabled population at 12.2 as compared to the MSA, while
West Des Moines is lower than the MSA average at 7.68 percent (Table 7).
The data from last ten years reveals that the proportion of disabled individuals as a percent of
total jurisdictional population has decreased from 2000 to 2010 in the state, the MSA, Des
Moines and West Des Moines (Table 8). Des Moines saw the biggest decrease in disabled
population at 31.6 percent with disabled population forming 12.2 percent of the total population
in Des Moines. In 2010, 7.68 percent people reported having some disability in West Des
Moines.
Table 8: Percent Change in Disabled Population in the Des Moines – West Des Moines
MSA, 2000 to 2010
Jurisdiction
Percent
population with
disabilities 2010
Percent
population with
disabilities 2000
Percent
change 2000
to 2010
State of Iowa 11 15.26 -24.6
MSA 9.71 12.07 -13.9
Entitlement Jurisdictions
Des Moines 12.2 18.37 -31.6
West Des Moines 7.68 10.69 -12.4
Group 2
Ankeny 7.3 9.9 -24.1
Urbandale 5.75 9.62 -18.9 Source: Analysis of U.S. 2010 Census Bureau
Ankeny experienced a total population increase of 18,465 residents from 2000 to 2010 (Table 1).
For the same period of time, the number of disabled individuals as a percentage of the overall
population decreased from 9.9 to 7.3 percent or a total decrease of 24.1 percent.

The Greater Des Moines Metro Area Regional Analysis of Impediments to Fair Housing Choice
26
2.5 SENIORS
Des Moines has a slightly higher percent of households with elderly citizens at 20.5 percent than
West Des Moines where households where elderly citizens accounted for 17.5 percent of total
households in the jurisdiction (Table 9).
Table 9: Population 65 years and older in the Des Moines – West Des Moines
MSA, 2000 to 2010
Jurisdiction
Total
households
Percent HH with individuals
65 years and over
MSA 223,268 20.3
Entitlement Jurisdictions
Des Moines 81,369 20.5
West Des Moines 24,311 17.5 Source: Analysis of U.S. 2010 Census Bureau
Senior and elderly citizen households form a significant percent of population groups in both
entitlement cities. This population group may often need special consideration due to limited
income resources, health care costs, limited mobility and likely prevalence of some form of
disability. This huge population group is expected to have a specific set of needs for both
housing and the neighborhood.
2.6 OTHER COMMUNITY CHARACTERISTICS
Other characteristics that may impact housing choice options for individuals and households
include poverty, homelessness, and criminal justice status. Within the ex-convict population, sex
offenders in particular have difficulty securing housing.
Poverty
The City of Des Moines has the highest percentage of population living in poverty in the region
at 17.7 percent, which is twice of the MSA average of 9.9 percent (Table 10). The percentage of
people living under poverty in West Des Moines is much lower than the MSA average at 5.7
percent. These numbers speak to a regional concentration of extremely low income households
in Des Moines.

The Greater Des Moines Metro Area Regional Analysis of Impediments to Fair Housing Choice
27
Table 10: Poverty Status in the Des Moines – West Des Moines MSA, 2010
Jurisdiction
Total
population*
Population
below Poverty
Percent of population
below poverty
MSA 558,811 55,519 9.9
Entitlement Jurisdictions
Des Moines 198,682 35,167 17.7
West Des Moines 55,409 3,137 5.7 * Population for whom poverty is determined
Source: Analysis of U.S. 2010 Census Bureau
The absolute number of people below poverty is highest for the white population group in all
three areas of comparison – the MSA, Des Moines and West Des Moines. However, these
numbers account for only 7.3, 12.4 and 4.6 percent of the total white population in these
jurisdictions. In contrast, 36.1 percent of all African American households, 22.7 percent of all
Hispanic households, and 10.7 percent of all Asian households living in the MSA fall under the
poverty level (Table 11).
Table 11: Poverty Status by Race in the Des Moines – West Des Moines MSA, 2010
Jurisdiction
White
African
American Hispanic Asian
Number % Number % Number % Number %
MSA 35,676 7.3 9,285 36.1 8,449 22.7 1,856 10.7
Entitlement Jurisdictions
Des Moines 19,275 12.4 8,024 40.8 7,199 30.9 1,313 14.4
West Des
Moines 2,259 4.6 N N 466 13.7 N N N indicates that data for this geographic area cannot be displayed because the number of sample case is too small
Source: Analysis of U.S. 2010 Census Bureau
Again in this category, Des Moines has the highest concentration of people living below the
poverty line, with 40.8 percent of its African American population belonging to this group. There
are high levels of poverty within the Hispanic population in Des Moines as well, where 30.9
percent living below poverty level. These numbers reveal that instances of poverty are much
higher in the African American and Hispanic populations than in the white and Asian
populations in both the entitlement jurisdictions and the region as a whole.

The Greater Des Moines Metro Area Regional Analysis of Impediments to Fair Housing Choice
28
The total number of individuals living below poverty level accounts for 5.7 of the population in
West Des Moines. These are predominantly white individuals with 2,259 of the 3,137 total
population living below poverty levels. The remaining 878 individuals belong to various other
races, but the number of people from each race is too small to be captured by the Census
calculation methods. One of the reasons for this observation could be that African Americans
account for only 3.3% of the total jurisdictional population in West Des Moines as opposed to
10.2 percent in Des Moines (Table 11).
Homelessness
The City Council of Des Moines and the Polk County Board of Supervisors established the
Homeless Coordinating Council in April 2010. The Homeless Coordinating Council consists of
representatives from the City of Des Moines, Polk County, United Way, Greater Des Moines
Community Foundation, Polk County Housing Trust Fund and Greater Des Moines Partnership
besides representative from the City of West Des Moines and other agencies. It works to address
the issue of homelessness in central Iowa and Polk County by developing a long range plan to
designed to eliminate homelessness besides identifying policies and objectives to improve
existing service delivery, allocation of funds and develop housing alternatives for camps existing
along riverbanks and other locations across the region.
Sex offenders
While sex offenders are not covered as a protected class under the Fair Housing Act, housing for
this population groups is a cause for concern in the housing circles in the region. State and
federal laws prohibit sex offenders from being within a 2000 feet distance of all public facilities
and are federally banned for life from receiving government assistance. Most of this population
is considered to live on riverbanks and in homeless encampments. Sometimes they may not
reveal their background and may live with family or friends. The issue with housing for sex
offenders has caught the attention of city officials and agencies and has been deliberated upon at
various times.
2.7 SEGREGATION
Racial segregation can be measured using three indices – index of dissimilarity, exposure index
and isolation index. This report uses dissimilarity index to measure the distribution of various
population groups. A dissimilarity index is a micro level statistics and summarizes segregation or
integration of two groups by measuring whether a particular population group is distributed
across the census tracts in the same way as another group. It is based on a scale of 1 to 100, with
0 being perfect integration and 100 being complete segregation. A value of 60 or above is
considered very high, 40-50 is considered moderate and values of 30 or below are considered to
be fairly low levels of segregation.
The Greater Des Moines Metro Area Regional Analysis of Impediments to Fair Housing Choice
29
The national index of dissimilarity from 2010 census showed that African American – white
segregation was 62.7 percent, down from 65.2 in 2000, Hispanic – white segregation was 50.0
down from 51.6 in 2000 and Asian – white segregation was 45.9, up from 42.1 in 2000 (HUD,
2012).
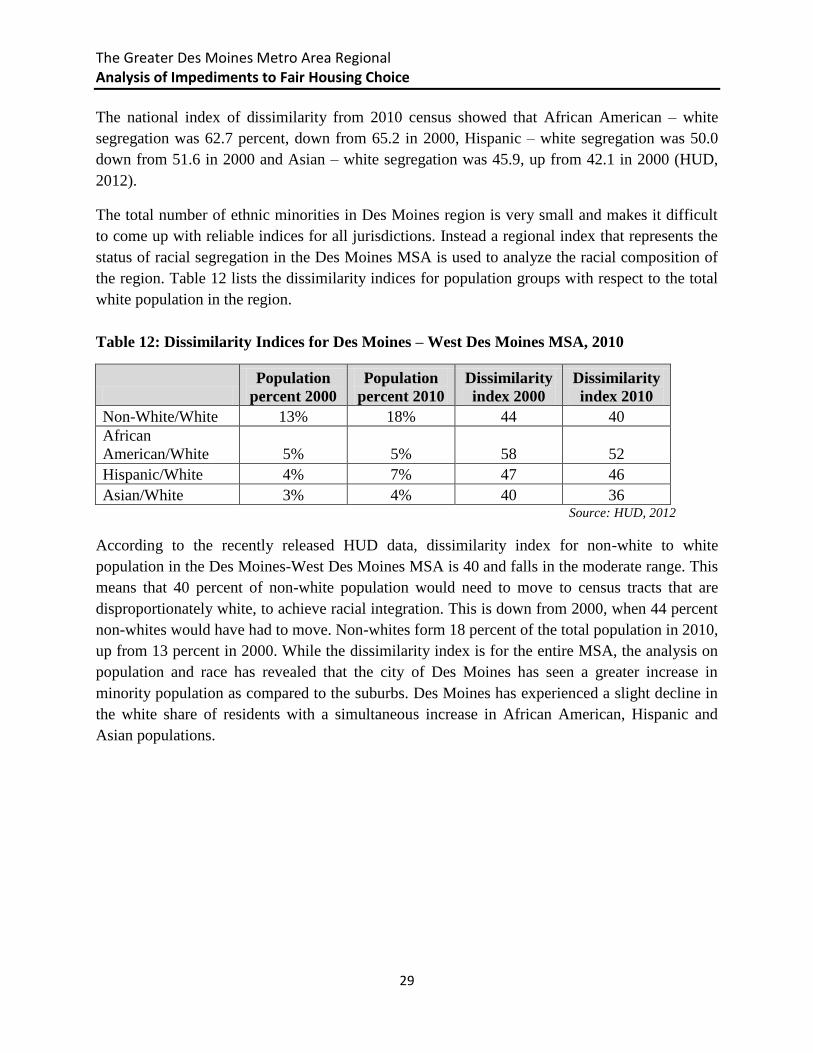
The total number of ethnic minorities in Des Moines region is very small and makes it difficult
to come up with reliable indices for all jurisdictions. Instead a regional index that represents the
status of racial segregation in the Des Moines MSA is used to analyze the racial composition of
the region. Table 12 lists the dissimilarity indices for population groups with respect to the total
white population in the region.
Table 12: Dissimilarity Indices for Des Moines – West Des Moines MSA, 2010
Population
percent 2000
Population
percent 2010
Dissimilarity
index 2000
Dissimilarity
index 2010
Non-White/White 13% 18% 44 40
African
American/White 5% 5% 58 52
Hispanic/White 4% 7% 47 46
Asian/White 3% 4% 40 36 Source: HUD, 2012
According to the recently released HUD data, dissimilarity index for non-white to white
population in the Des Moines-West Des Moines MSA is 40 and falls in the moderate range. This
means that 40 percent of non-white population would need to move to census tracts that are
disproportionately white, to achieve racial integration. This is down from 2000, when 44 percent
non-whites would have had to move. Non-whites form 18 percent of the total population in 2010,
up from 13 percent in 2000. While the dissimilarity index is for the entire MSA, the analysis on
population and race has revealed that the city of Des Moines has seen a greater increase in
minority population as compared to the suburbs. Des Moines has experienced a slight decline in
the white share of residents with a simultaneous increase in African American, Hispanic and
Asian populations.
The Greater Des Moines Metro Area Regional Analysis of Impediments to Fair Housing Choice
30
Segregation of African American Population
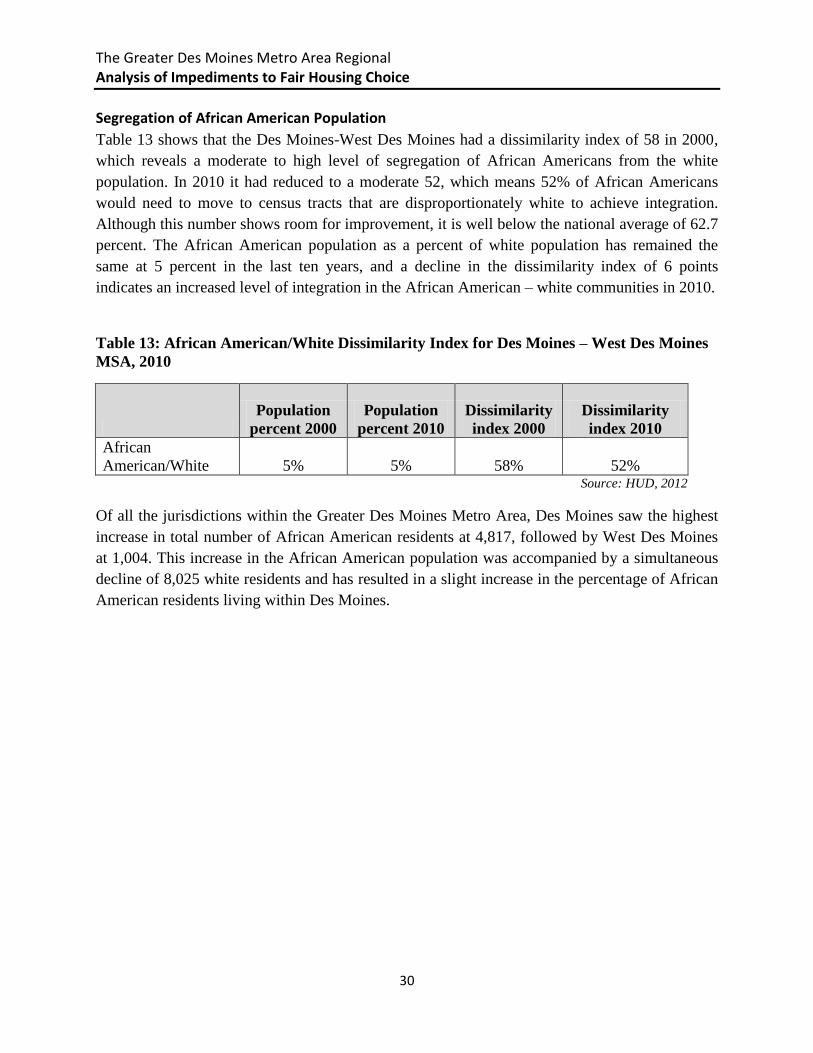
Table 13 shows that the Des Moines-West Des Moines had a dissimilarity index of 58 in 2000,
which reveals a moderate to high level of segregation of African Americans from the white
population. In 2010 it had reduced to a moderate 52, which means 52% of African Americans
would need to move to census tracts that are disproportionately white to achieve integration.
Although this number shows room for improvement, it is well below the national average of 62.7
percent. The African American population as a percent of white population has remained the
same at 5 percent in the last ten years, and a decline in the dissimilarity index of 6 points
indicates an increased level of integration in the African American – white communities in 2010.
Table 13: African American/White Dissimilarity Index for Des Moines – West Des Moines
MSA, 2010
Population
percent 2000
Population
percent 2010
Dissimilarity
index 2000
Dissimilarity
index 2010
African
American/White 5% 5% 58% 52% Source: HUD, 2012
Of all the jurisdictions within the Greater Des Moines Metro Area, Des Moines saw the highest
increase in total number of African American residents at 4,817, followed by West Des Moines
at 1,004. This increase in the African American population was accompanied by a simultaneous
decline of 8,025 white residents and has resulted in a slight increase in the percentage of African
American residents living within Des Moines.
The Greater Des Moines Metro Area Regional Analysis of Impediments to Fair Housing Choice
31
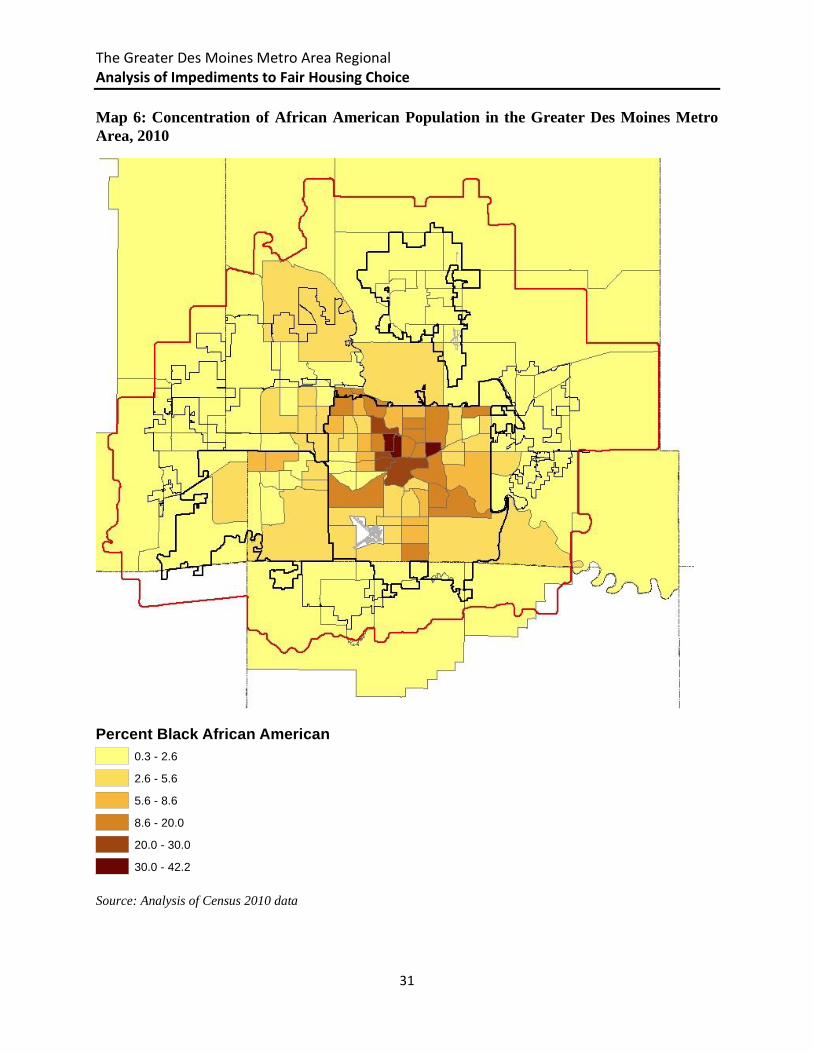
Map 6: Concentration of African American Population in the Greater Des Moines Metro
Area, 2010
Source: Analysis of Census 2010 data
Percent Black African American
0.3 - 2.6
2.6 - 5.6
5.6 - 8.6
8.6 - 20.0
20.0 - 30.0
30.0 - 42.2
The Greater Des Moines Metro Area Regional Analysis of Impediments to Fair Housing Choice
32
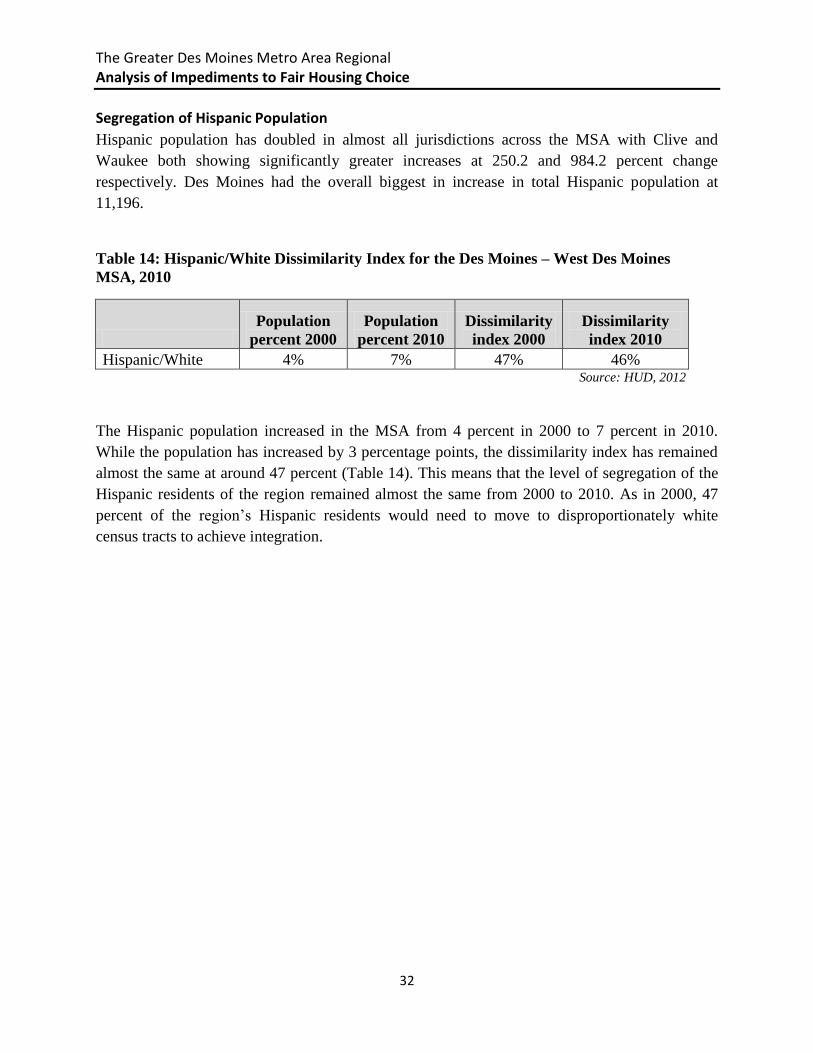
Segregation of Hispanic Population
Hispanic population has doubled in almost all jurisdictions across the MSA with Clive and
Waukee both showing significantly greater increases at 250.2 and 984.2 percent change
respectively. Des Moines had the overall biggest in increase in total Hispanic population at
11,196.
Table 14: Hispanic/White Dissimilarity Index for the Des Moines – West Des Moines
MSA, 2010
Population
percent 2000
Population
percent 2010
Dissimilarity
index 2000
Dissimilarity
index 2010
Hispanic/White 4% 7% 47% 46% Source: HUD, 2012
The Hispanic population increased in the MSA from 4 percent in 2000 to 7 percent in 2010.
While the population has increased by 3 percentage points, the dissimilarity index has remained
almost the same at around 47 percent (Table 14). This means that the level of segregation of the
Hispanic residents of the region remained almost the same from 2000 to 2010. As in 2000, 47
percent of the region’s Hispanic residents would need to move to disproportionately white
census tracts to achieve integration.
The Greater Des Moines Metro Area Regional Analysis of Impediments to Fair Housing Choice
33
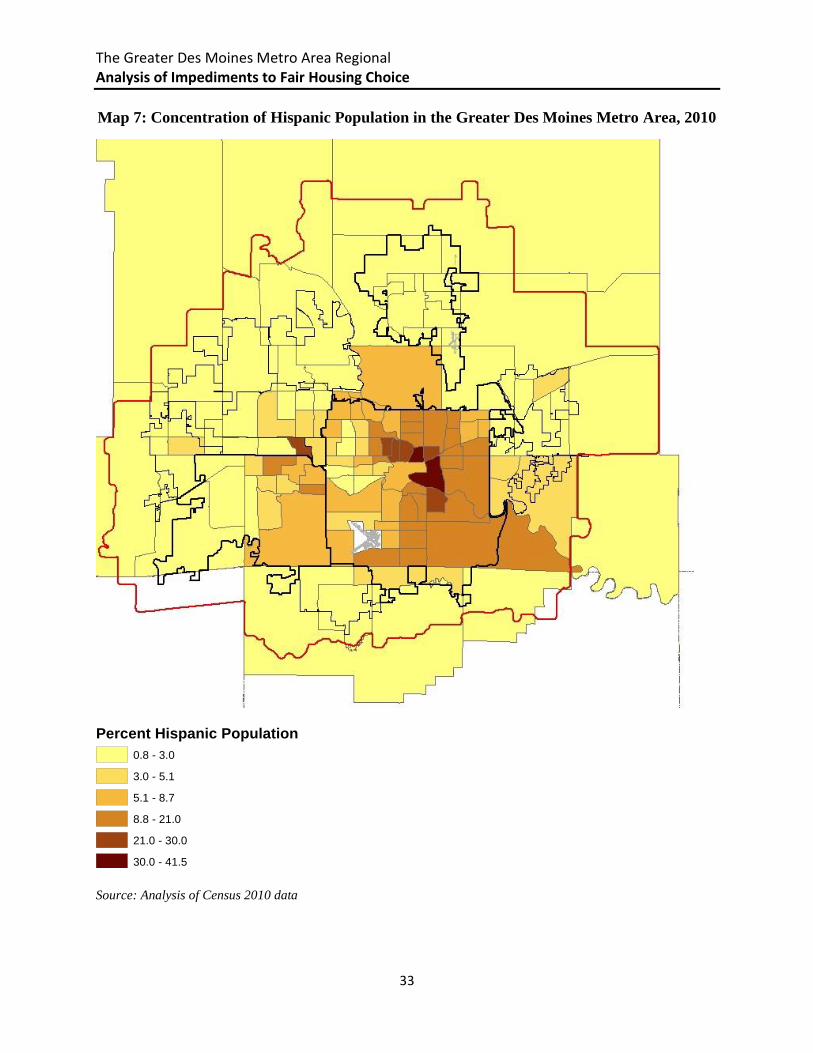
Map 7: Concentration of Hispanic Population in the Greater Des Moines Metro Area, 2010
Source: Analysis of Census 2010 data
Percent Hispanic Population
0.8 - 3.0
3.0 - 5.1
5.1 - 8.7
8.8 - 21.0
21.0 - 30.0
30.0 - 41.5

The Greater Des Moines Metro Area Regional Analysis of Impediments to Fair Housing Choice
34
Segregation of Asian Population
The Asian population is the most integrated of all minority populations in the MSA with respect
to white residents. The dissimilarity index in 2010 is 36 percent and is in the lower to moderate
range (Table 15). An index of 30 percent or lower is considered to be very low with greater
levels of integration within the area. The index in 2010 decreased by 4 percent points from 2000
even as the Asian population grew slightly as a percent of total population. In the region, the City
of Waukee saw the biggest percent increase in Asian population since 2000 at 1155.2 percent
with the overall share of population being 2.6 percent.
Table 15: Asian/White Dissimilarity Index for Des Moines – West Des Moines MSA, 2010
Population
percent 2000
Population
percent 2010
Dissimilarity
index 2000
Dissimilarity
index 2010
Asian/White 3% 4% 40% 36% Source: HUD, 2012
Racially Concentrated Area of Poverty/ Ethnically Concentrated Area of Poverty
(RCAPs/ECAPs)
An analysis of impediments study must not only identify segregation based on race, ethnicity,
national origin or other characteristics, but it must also suggest action steps to address this
segregation and promote the transition to more integrated communities. A concentration of racial
and ethnic groups in poor neighborhoods further aggravates the problems of segregation.
Oftentimes, the concentration of existing affordable housing in inner city neighborhoods or older
parts of a region perpetuates the isolation of low-income residents and people of color from the
life opportunities available to suburban residents. Some impacts of this isolation can be seen in
the low levels of academic and occupational achievement of children who grow up in these poor
neighborhoods, high crime rates, and also in health disparities as a result of concentrations of
environmental hazards, stress, inadequate health care facilities, and inadequate access to good
quality fresh food.
Racial and ethnic segregation and poverty share a very close link in today’s world, and it is
important to identify if a region contains racially or ethnically concentrated areas of poverty. An
investigation into available affordable housing, resources, and amenities in these areas can help
identify patterns of segregation and assist jurisdictions to take a regional approach in tackling
segregation.

The Greater Des Moines Metro Area Regional Analysis of Impediments to Fair Housing Choice
35
HUD uses census tract characteristics to define a Racially Concentrated Area of Poverty
(RCAPs) or Ethnically Concentrated Areas of Poverty (ECAPs) as a census tract with:
A family poverty rate >= 40% or
A family poverty rate >= 300% of the metro Tract average (whichever is lower)
AND a majority non-white population (>50%)
A spatial analysis of race and poverty using HUD’s criteria for defining RCAP/ECAP reveals
that all census tracts with racial and ethnic concentrations are located in the city of Des Moines
(Map 8). Three census tracts are concentrated by race and ethnicity (non-white population more
than 50%) and one census tract by extremely high levels of poverty (family poverty rate more
than 40%). Currently there are no racially or ethnically concentrated areas of poverty as per
HUD’s definition.
This absence of RCAPs/ECAPs in the region can be explained by the fact that non-white
population forms a very small percentage of the overall population in the region. However, an
analysis of the demographic changes in the region explained in Chapter 2 shows that while still a
small percentage of total population, minority and immigrant population both have increased
steadily in the region. By changing the threshold of non-white population to 35% in HUD’s
definition, we can identify eleven census tracts that see extreme concentration of non-white
population. Overlaying it with poverty information allows us to identify one census tract as
RCAP/ECAP (Map 9).
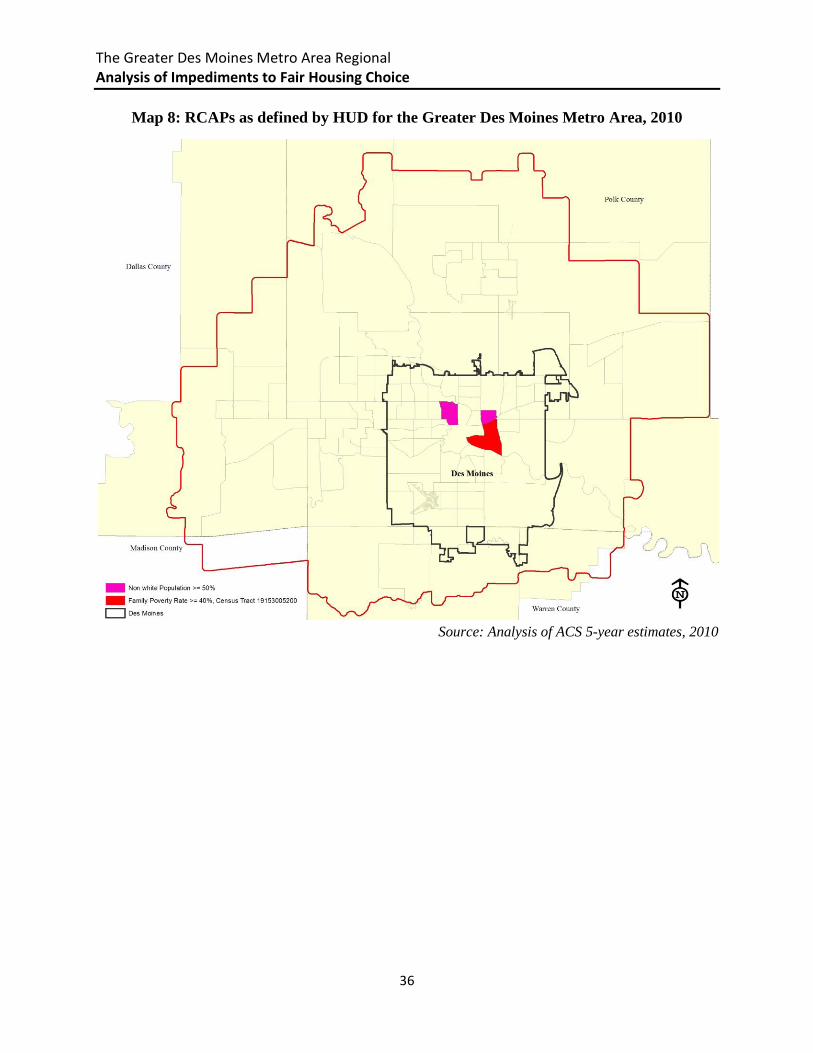
The Greater Des Moines Metro Area Regional Analysis of Impediments to Fair Housing Choice
36
Map 8: RCAPs as defined by HUD for the Greater Des Moines Metro Area, 2010
Source: Analysis of ACS 5-year estimates, 2010
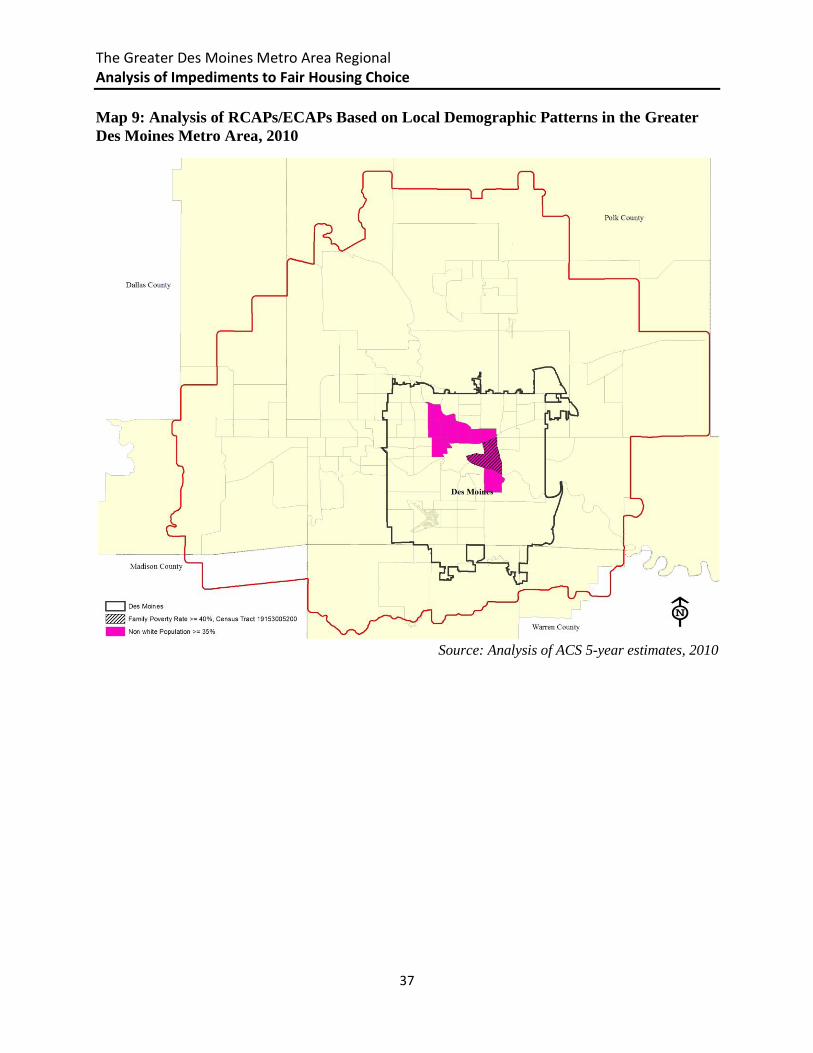
The Greater Des Moines Metro Area Regional Analysis of Impediments to Fair Housing Choice
37
Map 9: Analysis of RCAPs/ECAPs Based on Local Demographic Patterns in the Greater
Des Moines Metro Area, 2010
Source: Analysis of ACS 5-year estimates, 2010

The Greater Des Moines Metro Area Regional Analysis of Impediments to Fair Housing Choice
38
Census tract 52 is an ECAP or Ethnically Concentrated area of Poverty due to high
concentration of Hispanic population. About 1,095 residents or 34.6% of non-white population
in the census tract is Hispanic followed by 404 residents or 12.8% of the African American
population group (Table 16).
Table 16: RCAP/ECAP in the City of Des Moines and the Greater Des Moines
Metro Area, 2010
RCAPs/ECAPs in Des Moines
Count Percent
Total Tracts 56 100.0
RCAP Tracts 1 1.8
Non RCAP Tracts 55 98.2
Total Population in RCAP 3162 100.0
African American in RCAP Tracts 404 12.8
Hispanic in RCAP Tracts 1095 34.6
Asian in RCAP Tracts 70 2.2
RCAPs/ECAPs in Greater Des Moines Metro Area
Count Percent
Total Tracts 110 100.0
RCAP Tracts 1 0.9
Non RCAP Tracts 109 99.1
Total Population in RCAP 3162 100.0
African American population in
RCAP Tracts 404 12.8
Hispanic population in RCAP
Tracts 1095 34.6
Asian population in RCAP Tracts 70 2.2 Source: Analysis of ACS 5-year estimates, 2010

The Greater Des Moines Metro Area Regional Analysis of Impediments to Fair Housing Choice
39
While eleven census tracts meet the racial concentration criteria of 35% or more of non-white
population, the family poverty rate in these concentrated areas is less than 40%. At the same
time, a quick investigation of poverty rates in these tracts reveals that most of these are still quite
poor neighborhoods with family poverty rates that are significantly above those found in the
region as a whole (Table 17).
The second highest poverty rate of 35.10% is seen in Census Tract 48, again a census tract with a
high concentration of Hispanic residents. The Hispanic population of 1324 residents makes up
41.54% of the tract population. There is a clear correlation between racial and ethnic
concentration and high poverty levels in these census tracts.
Table 17: Family Poverty Rates and Racial/Ethnic Mix in Racially Concentrated Areas in
the Greater Des Moines Metro Area, 2010
Census Tract Population White A-A Hispanic Asian
Family
poverty rate
Census Tract 7.01 3219 1642 862 295 438 21.20
Census Tract 11 5276 3389 890 1054 371 22.10
Census Tract 12 3474 962 1466 884 288 26.00
Census Tract 26 2222 1146 610 407 138 28.50
Census Tract 27 3477 2094 946 176 122 30.10
Census Tract 49 2159 1172 400 607 161 23.50
Census Tract 50 4076 1303 1523 982 494 22.60
Census Tract 17 2584 803 1048 661 286 19.60
Census Tract 48 3187 1724 415 1324 263 35.10
Census Tract 52 3162 1939 404 1095 70 43.10
Census Tract 39.01 3722 2289 525 998 238 15.40 Source: Analysis of ACS 5-year estimates, 2010

The Greater Des Moines Metro Area Regional Analysis of Impediments to Fair Housing Choice
40
Map 10 shows the distribution of non-white populations as percent of the total census tract
population in the region. The population range is divided into five classes of 15 – 20%, 20 –
25%, 25 – 30%, 30 – 35% and greater than 35% on non-white population. The map shows that
most racially and ethnically concentrated areas are located in Des Moines, and this concentration
decreases as one moves out from the center of the city. West Des Moines, Clive and Carlisle all
see the beginnings of racial/ethnical concentrations. This analysis can help identify future trends
to an extent, and see where the next concentrations are most likely to occur. For example, the
census tract in Clive currently has 25 to 30% of non-white population and could see an increase
in this concentration in the future.
Map 10: Distribution of Non-White Population as a Percent of Total Census Tract
Population in the Greater Des Moines Metro Area, 2010
Source: Analysis of U.S. Census data, 2010
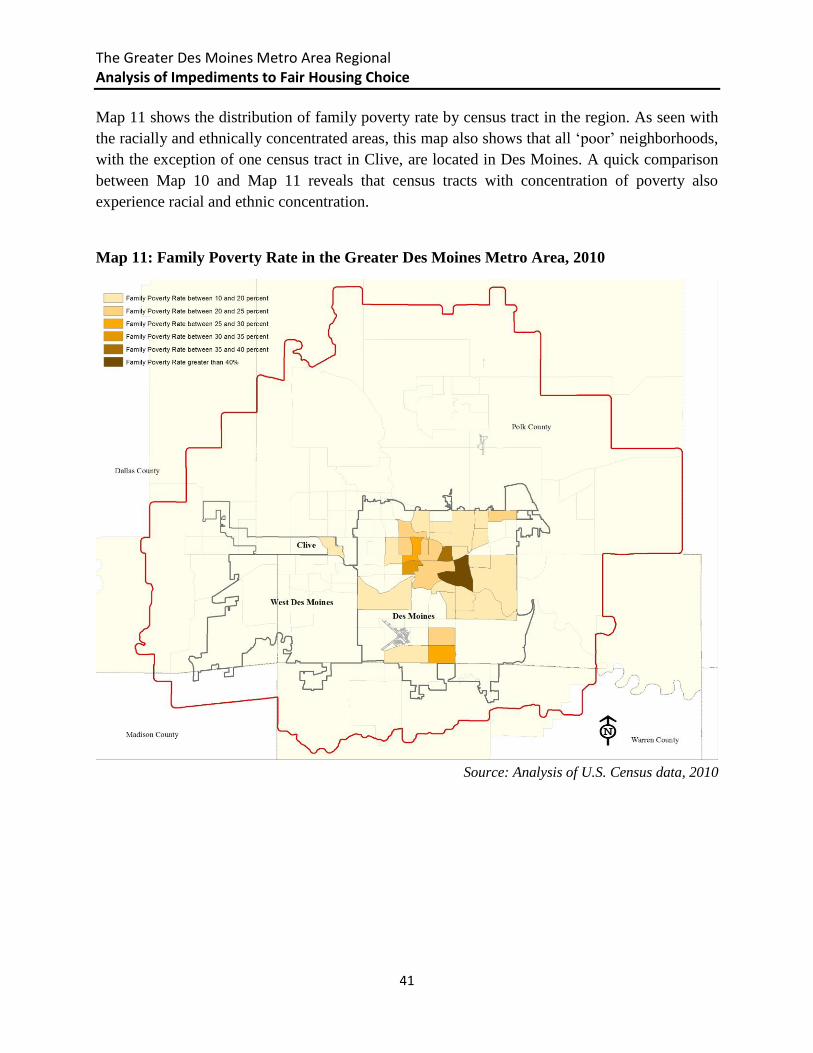
The Greater Des Moines Metro Area Regional Analysis of Impediments to Fair Housing Choice
41
Map 11 shows the distribution of family poverty rate by census tract in the region. As seen with
the racially and ethnically concentrated areas, this map also shows that all ‘poor’ neighborhoods,
with the exception of one census tract in Clive, are located in Des Moines. A quick comparison
between Map 10 and Map 11 reveals that census tracts with concentration of poverty also
experience racial and ethnic concentration.
Map 11: Family Poverty Rate in the Greater Des Moines Metro Area, 2010
Source: Analysis of U.S. Census data, 2010

The Greater Des Moines Metro Area Regional Analysis of Impediments to Fair Housing Choice
42
This analysis should help the policy makers in taking a long-term approach to guiding actions
and strategies not only in areas that currently see racial and poverty concentrations but also in
areas that potentially may be become concentrated in the near future.
2.8 SUMMARY OF CHAPTER
Des Moines is the most racially diverse city in the MSA region. It sees the highest concentration
of people of various race and ethnicities, along with a high concentration of single parent
families with children, single mother families, families living under poverty level, individuals
with disabilities and concentration of poverty in African Americans, Hispanics and Asians. There
is a significant homeless population concentrated along riverbanks and encampments in the
region. Oftentimes this population group may be chronically homeless with issues like mental
health, disability, lack of adequate health care, substance abuse, and chemical dependency.
Des Moines is home to the only Ethnically Concentrated Area of Poverty (ECAP) in the region.
Racial and ethnic concentration and poverty is increasing outward from the core of the city and is
expected to increase and spread across into East Clive, north eastern parts of West Des Moines
and portions of Carlisle and Polk County on the south east of Des Moines.
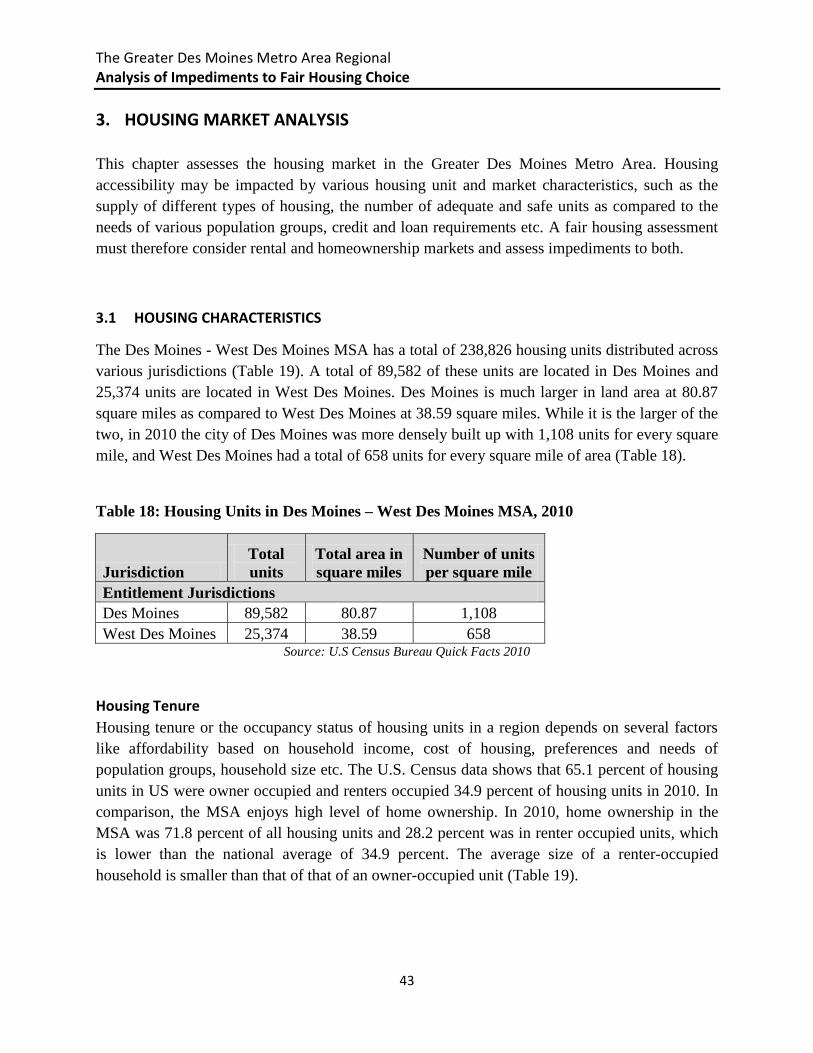
The Greater Des Moines Metro Area Regional Analysis of Impediments to Fair Housing Choice
43
3. HOUSING MARKET ANALYSIS
This chapter assesses the housing market in the Greater Des Moines Metro Area. Housing
accessibility may be impacted by various housing unit and market characteristics, such as the
supply of different types of housing, the number of adequate and safe units as compared to the
needs of various population groups, credit and loan requirements etc. A fair housing assessment
must therefore consider rental and homeownership markets and assess impediments to both.
3.1 HOUSING CHARACTERISTICS
The Des Moines - West Des Moines MSA has a total of 238,826 housing units distributed across
various jurisdictions (Table 19). A total of 89,582 of these units are located in Des Moines and
25,374 units are located in West Des Moines. Des Moines is much larger in land area at 80.87
square miles as compared to West Des Moines at 38.59 square miles. While it is the larger of the
two, in 2010 the city of Des Moines was more densely built up with 1,108 units for every square
mile, and West Des Moines had a total of 658 units for every square mile of area (Table 18).
Table 18: Housing Units in Des Moines – West Des Moines MSA, 2010
Jurisdiction
Total
units
Total area in
square miles
Number of units
per square mile
Entitlement Jurisdictions
Des Moines 89,582 80.87 1,108
West Des Moines 25,374 38.59 658 Source: U.S Census Bureau Quick Facts 2010
Housing Tenure
Housing tenure or the occupancy status of housing units in a region depends on several factors
like affordability based on household income, cost of housing, preferences and needs of
population groups, household size etc. The U.S. Census data shows that 65.1 percent of housing
units in US were owner occupied and renters occupied 34.9 percent of housing units in 2010. In
comparison, the MSA enjoys high level of home ownership. In 2010, home ownership in the
MSA was 71.8 percent of all housing units and 28.2 percent was in renter occupied units, which
is lower than the national average of 34.9 percent. The average size of a renter-occupied
household is smaller than that of that of an owner-occupied unit (Table 19).
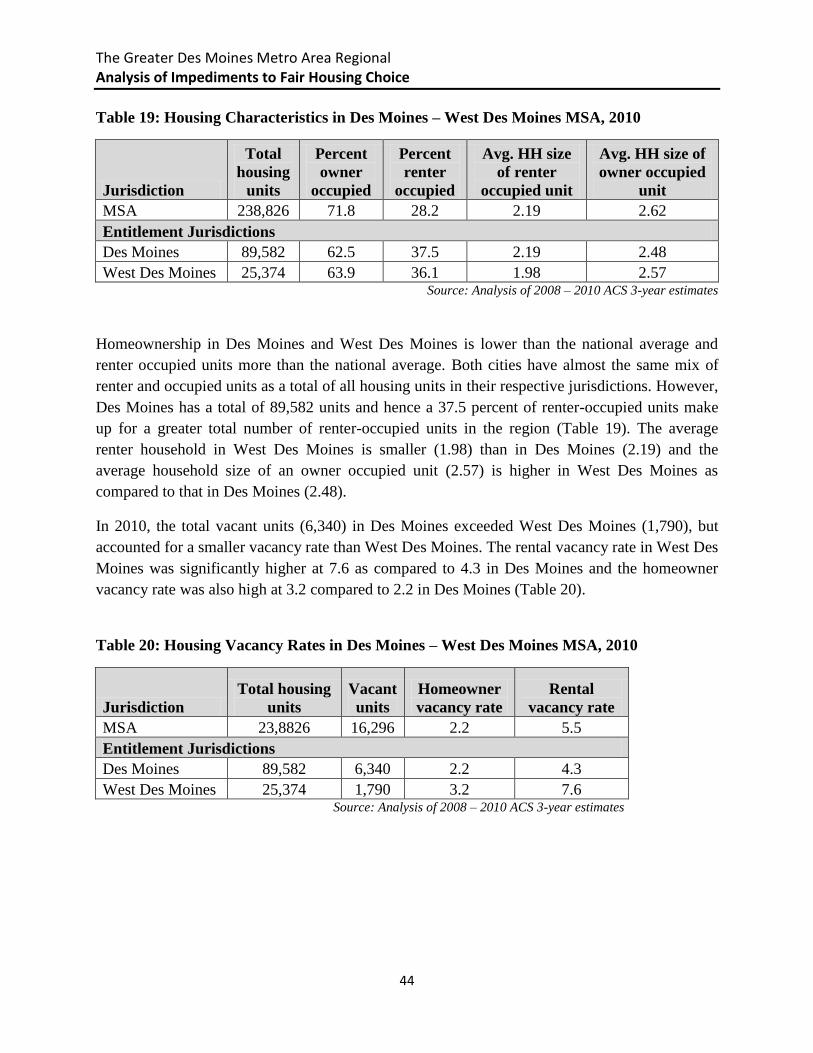
The Greater Des Moines Metro Area Regional Analysis of Impediments to Fair Housing Choice
44
Table 19: Housing Characteristics in Des Moines – West Des Moines MSA, 2010
Jurisdiction
Total
housing
units
Percent
owner
occupied
Percent
renter
occupied
Avg. HH size
of renter
occupied unit
Avg. HH size of
owner occupied
unit
MSA 238,826 71.8 28.2 2.19 2.62
Entitlement Jurisdictions
Des Moines 89,582 62.5 37.5 2.19 2.48
West Des Moines 25,374 63.9 36.1 1.98 2.57 Source: Analysis of 2008 – 2010 ACS 3-year estimates
Homeownership in Des Moines and West Des Moines is lower than the national average and
renter occupied units more than the national average. Both cities have almost the same mix of
renter and occupied units as a total of all housing units in their respective jurisdictions. However,
Des Moines has a total of 89,582 units and hence a 37.5 percent of renter-occupied units make
up for a greater total number of renter-occupied units in the region (Table 19). The average
renter household in West Des Moines is smaller (1.98) than in Des Moines (2.19) and the
average household size of an owner occupied unit (2.57) is higher in West Des Moines as
compared to that in Des Moines (2.48).
In 2010, the total vacant units (6,340) in Des Moines exceeded West Des Moines (1,790), but
accounted for a smaller vacancy rate than West Des Moines. The rental vacancy rate in West Des
Moines was significantly higher at 7.6 as compared to 4.3 in Des Moines and the homeowner
vacancy rate was also high at 3.2 compared to 2.2 in Des Moines (Table 20).
Table 20: Housing Vacancy Rates in Des Moines – West Des Moines MSA, 2010
Jurisdiction
Total housing
units
Vacant
units
Homeowner
vacancy rate
Rental
vacancy rate
MSA 23,8826 16,296 2.2 5.5
Entitlement Jurisdictions
Des Moines 89,582 6,340 2.2 4.3
West Des Moines 25,374 1,790 3.2 7.6 Source: Analysis of 2008 – 2010 ACS 3-year estimates
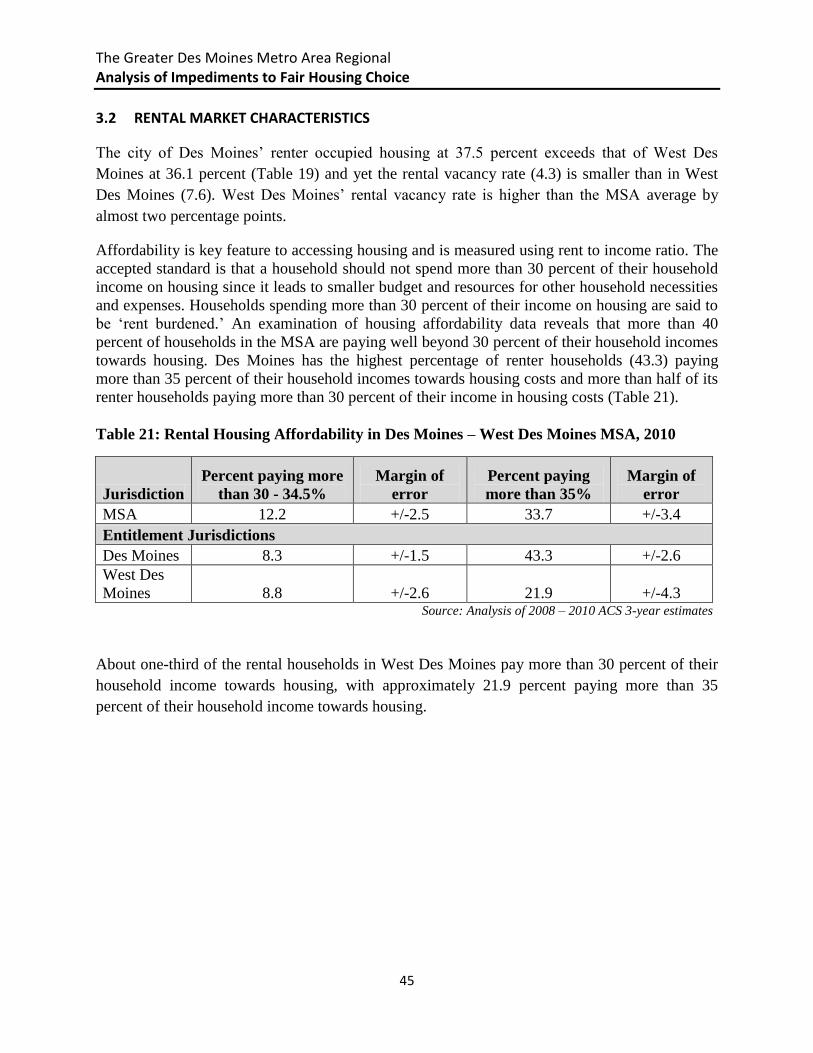
The Greater Des Moines Metro Area Regional Analysis of Impediments to Fair Housing Choice
45
3.2 RENTAL MARKET CHARACTERISTICS
The city of Des Moines’ renter occupied housing at 37.5 percent exceeds that of West Des
Moines at 36.1 percent (Table 19) and yet the rental vacancy rate (4.3) is smaller than in West
Des Moines (7.6). West Des Moines’ rental vacancy rate is higher than the MSA average by
almost two percentage points.
Affordability is key feature to accessing housing and is measured using rent to income ratio. The
accepted standard is that a household should not spend more than 30 percent of their household
income on housing since it leads to smaller budget and resources for other household necessities
and expenses. Households spending more than 30 percent of their income on housing are said to
be ‘rent burdened.’ An examination of housing affordability data reveals that more than 40
percent of households in the MSA are paying well beyond 30 percent of their household incomes
towards housing. Des Moines has the highest percentage of renter households (43.3) paying
more than 35 percent of their household incomes towards housing costs and more than half of its
renter households paying more than 30 percent of their income in housing costs (Table 21).
Table 21: Rental Housing Affordability in Des Moines – West Des Moines MSA, 2010
Jurisdiction
Percent paying more
than 30 - 34.5%
Margin of
error
Percent paying
more than 35%
Margin of
error
MSA 12.2 +/-2.5 33.7 +/-3.4
Entitlement Jurisdictions
Des Moines 8.3 +/-1.5 43.3 +/-2.6
West Des
Moines 8.8 +/-2.6 21.9 +/-4.3 Source: Analysis of 2008 – 2010 ACS 3-year estimates
About one-third of the rental households in West Des Moines pay more than 30 percent of their
household income towards housing, with approximately 21.9 percent paying more than 35
percent of their household income towards housing.
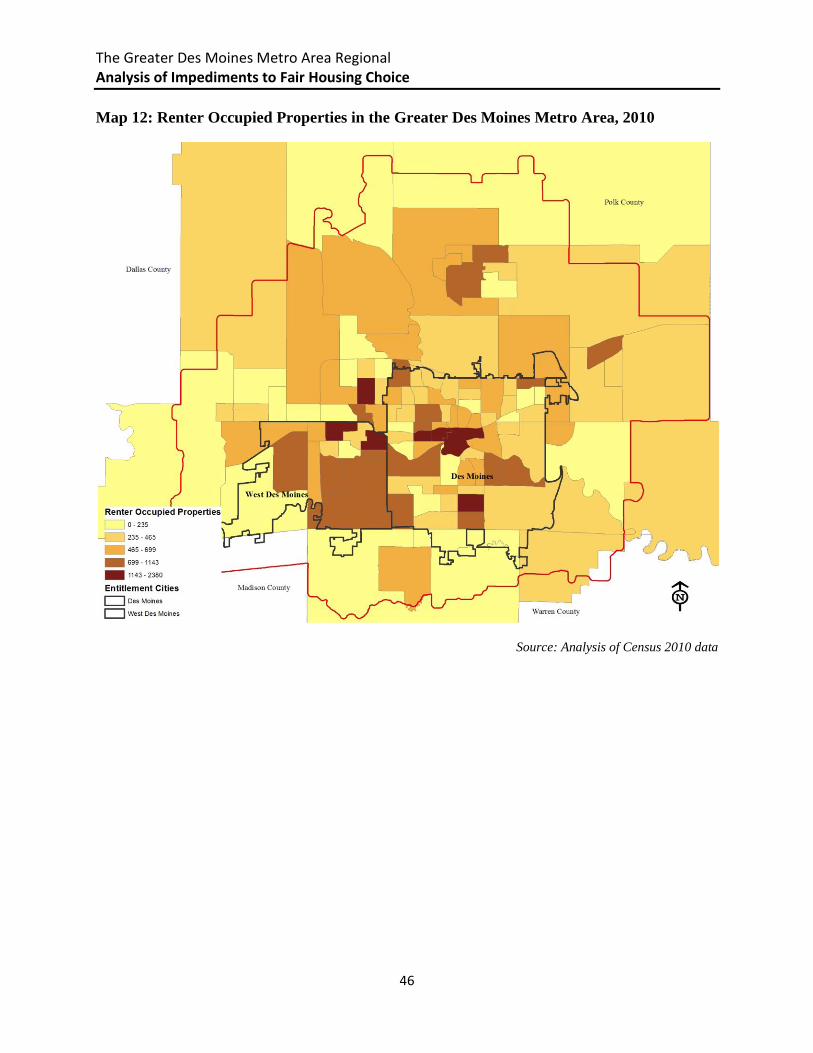
The Greater Des Moines Metro Area Regional Analysis of Impediments to Fair Housing Choice
46
Map 12: Renter Occupied Properties in the Greater Des Moines Metro Area, 2010
Source: Analysis of Census 2010 data
The Greater Des Moines Metro Area Regional Analysis of Impediments to Fair Housing Choice
47
3.3 HOME PURCHASE MARKET CHARACTERISTICS
Data from the U.S. Census shows that 65.1 percent of housing units in US were owner occupied
and renters occupied 34.9 percent of housing units in 2010. Des Moines and West Des Moines
both enjoy relatively high home ownership with 62.5 percent owner occupied units in Des
Moines and 63.5 percent of total housing units in West Des Moines (Table 19).
Home Values
The median value of home in West Des Moines is amongst the highest in the region at $184,100.
This is well beyond the MSA average of $151,900 and $119,800 in Des Moines (Table 22). Des
Moines has the lowest median home value in the region.
Table 22: Median House Values in the Des Moines – West Des Moines MSA, 2010
Jurisdiction
Median value in
dollars
MSA 151,900
Entitlement Jurisdictions
Des Moines 119,800
West Des
Moines 184,100 Source: 2008 – 2010 ACS 3-year estimates
Affordable Home Ownership
As seen in case of rental housing, Des Moines also leads in the number of owner-occupied
households paying more than 30% of their household income towards housing costs.
Approximately one third of Des Moines owner occupied households pay more than 30 percent
and 23.34 percent pay more than 35% of their household income towards housing costs. While
the number of owner occupied households in West Des Moines paying more than 30 and 35% of
their income towards housing is smaller than that in Des Moines, this percentage is also high at
9.4 and 12.4 percent respectively (Table 23).
The Greater Des Moines Metro Area Regional Analysis of Impediments to Fair Housing Choice
48
Table 23: Affordable Home Ownership in Des Moines – West Des Moines MSA, 2010
Jurisdiction
Percent paying more
than 30 - 34.5%
Margin of
error
Percent paying
more than 35%
Margin of
error
MSA 7.8 +/-1.0 20.1 +/-1.8
Entitlement Jurisdictions
Des Moines 6.7 +/-1.0 23.4 +/-1.7
West Des
Moines 9.4 +/-3.0 12.4 +/-2.4 Source: 2008 – 2010 ACS 3-year estimates
3.4 SUMMARY OF CHAPTER
Des Moines is more densely built than West Des Moines and the surrounding suburbs. Des
Moines has a higher number of total renter-occupied units in the region. Larger sized households
seek and are able to avail rental housing in Des Moines as compared to West Des Moines. On the
other hand, West Des Moines has attracted larger families to buy houses in its jurisdiction. West
Des Moines has a higher vacancy rate for both rental as well as owner occupied units as
compared to Des Moines. A greater percentage of renter households and homeowners area rent
burdened in Des Moines. More than half of Des Moines renter households are ‘rent burdened’.
The Greater Des Moines Metro Area Regional Analysis of Impediments to Fair Housing Choice
49
4. AFFORDABLE AND SUBSIDIZED HOUSING
The location and availability of affordable and public housing plays an important role in fair
housing practices in a region. Historically, regulations and practices limiting the location and
availability of housing were used to segregate certain population groups within cities. Although
fair housing law has resulted in significant changes in these discriminatory policies and practices,
the housing patterns today are oftentimes rooted in past housing decisions and can continue to
have an impact on concentration of population groups.
This chapter looks at the affordable housing market and situation in the Des Moines region and
identifies patterns that may give rise to accessibility of affordable housing in the region. The
region has a total of 3 public housing authorities or agencies that administer HUD programs: Des
Moines Municipal Housing Authority (DMMHA), and the Central Iowa Regional Housing
Authority (CIRHA), and Warren County Housing Authority. See Appendix B for a more
extensive list of agencies and organizations providing housing services in the Greater Des
Moines Metro Area.
4.1 SECTION 8 RENTAL ASSISTANCE
DMMHA administers the Section 8 program throughout Polk County and has cooperative
agreements with suburban jurisdictions to serve the County. So any individual Section 8 voucher
holder must go through DMMHA to get assistance. The Section 8 Housing Voucher program
provides rental assistance to low-income families, the elderly and the disabled based on
guidelines developed by the U.S, Department of Housing and Urban Development.
Approximately 3,200 households are served through Section 8 programs. Currently, 80 percent
of the issued Section 8 program vouchers are located in the city of Des Moines and 20 percent
are located outside its corporate city limits.
The Des Moines region’s Section 8 program has 4,600 households on the waiting list.
Administrators expect it to take 4 to 6 years to move through the list and in the meantime, no
new households can apply for Section 8 assistance. The Section 8 list was last opened up in July
2011.
DMMHA believes that supply of affordable housing is adequate in the region. However, the
department lacks enough financial resources to subsidize this housing. Section 8 clients may not
have issues identifying the affordable housing they want or the private landlords, non-profits and
housing agencies that accept vouchers, but there aren’t enough financial resources to provide the
required subsidies.
The Greater Des Moines Metro Area Regional Analysis of Impediments to Fair Housing Choice
50
Individuals with mental disabilities may require regular case management and this may pose as a
barrier to housing. DMMHA does not offer a support services program but works regularly with
non-profits in the region. It refers clients in need of mental health care to the Shelter Care Plus
program and currently issues 141 vouchers to families with mental health issues to access the
Shelter Plus Care program. Anawim Housing, YMCA and Primary Health Care Center run most
of the Shelter Care Plus programs in the region.
The DMMHA does not have a homeless preference but instead offers a Shelter Plus Care
preference for Section 8 program. This means those individuals who have been with the Shelter
Care Plus program for three consecutive years and are in good standing like paying their rent on
time and having no arrests are moved to the top of the waiting list. In August 2012, the
department has identified 61 individuals that meet the three-year requirement and are moving
them to the top of the list. This enables DMMHA to free up the Shelter Care Plus program to
take in new clients in need of housing and case management together.
CIRHA also provides rental assistance through the Section 8 or Housing Choice Voucher
program. They currently are providing voucher rental assistance for 318 families in Dallas
County. The communities are Adel (28), Dallas Center (2), Granger (1), Linden (1), Minburn
(2), Perry (30), Redfield (1), Van Meter (2), Waukee (131), West Des Moines (88), and
Woodward (2). CIRHA also provides Section 8 rental assistance for 46 families in Madison
County. The communities are Earlham (1), St Charles (5), and Winterset (40). The Warren
County Housing Authority does issue Section 8 vouchers, but we were unable to verify how
many participants they have in their program.
4.2 PUBLIC HOUSING
DMMHA owns and manages all public housing units in Polk County. This includes 5
developments with a total of 390 units. The developments are Royal View Manor for singles,
elderly and the disabled, East View and Southview Manors and Highland Park and Oak Park
Plazas, all for the elderly. Additionally, DMMHA owns approximately 400 scattered site units in
single-family homes and duplexes (Map 13). As of August 2010, there were about 800 people on
the public housing waiting list.
DMMHA is not the only agency in the region that owns public housing units, but they do
represent the largest number of units. CIRHA owns no public housing units in Madison County
and 40 units in Dallas County, which are located in Adel (1), Perry (34), Redfield (4), and
Woodward (1). The Warren County Housing does not own any physical housing units.

The Greater Des Moines Metro Area Regional Analysis of Impediments to Fair Housing Choice
51
The two key issues with public housing in the Greater Des Moines Metro Area are geographic
concentration and supply. For the region, most of the public housing units are currently located
within the boundaries of Des Moines (Map 14). Furthermore, the agency is decreasing their
physical housing portfolio. In 2012, they sold units to non-profit housing agencies serving low-
income population groups and put up approximately 10 units up for demolition. The principal
reason cited for this demolition is the poor condition of housing stock. DMMHA plans to rebuild
the 10 units and put them back on the housing inventory (Interview). They are also currently
strategizing ways to leverage additional resources to help support and plan for this rebuilding
process. The agency partners and collaborates with non-profit housing agencies in the region
periodically on various housing projects.
Map 13: Public Housing in the Greater Des Moines Metro Area, 2010
Source: Analysis of Des Moines Housing Services, 2010

The Greater Des Moines Metro Area Regional Analysis of Impediments to Fair Housing Choice
52
Map 14: Concentration of Public Housing in Des Moines, 2010
Source: Analysis of DART and Des Moines Housing Services data, 2010

The Greater Des Moines Metro Area Regional Analysis of Impediments to Fair Housing Choice
53
4.3 LOW-INCOME HOUSING TAX CREDIT DEVELOPMENTS
The Low Income Housing Tax Credit Program (LIHTC) is a federally funded affordable housing
program that provides income tax credit to developers to encourage construction of low-income
housing. Iowa Finance Authority (IFA) administers the LIHTC development programs in the
State of Iowa.
While LIHTC projects are located across the Des Moines – West Des Moines MSA, a large
number of these developments are concentrated within the jurisdictional boundaries of Des
Moines (Map 15).
Map 15: Low Income Housing Tax Credit Developments in the Greater Des Moines Metro
Area, 2012
Source: Analysis of Des Moines Housing Services, 2010
The Greater Des Moines Metro Area Regional Analysis of Impediments to Fair Housing Choice
54
4.4 AFFORDABLE HOMEOWNDERSHIP
Homeownership can be an important asset to a family, serving as a way to pay for education, and
secure loans for business ventures besides others. A high level of homeownership is considered
to be an indicator of community health. To be a successful investment, a home must increase in
value and the homeowner must be able to maintain the home. Oftentimes homeowners may not
have the educational or financial resources required to maintain the house. This can be an issue
especially with the near-homeless population.
The Greater Des Moines metro region sees relatively high home ownership as discussed in
Chapter 3. The City of Des Moines sees relatively low median home values in the region at
$119,800 and yet approximately 30 percent of homeowners in Des Moines pay more than 30%
of their household income towards housing. About 20 percent of homeowners in West Des
Moines pay more than 30% of their household income towards housing.
There is an increasing need for more affordable home ownership in the region and the DMMHA
and Iowa Finance Authority (IFA) both play a key role in providing towards affordable home
ownership in the region. DMMHA sells its homes and former public housing rentals located
across the city through the 5(h) Affordable Homeownership Program. Currently, the DMMHA is
selling single-family homes with two, three or four bedrooms, at two thirds of its appraised
values to eligible families.
Homes in neighborhoods establish informal and social networks important to families. This
makes stabilization of existing housing an important component of any housing strategy.
Housing agencies in the Des Moines area work with non-profit agencies and support service
groups to fulfill some of these needs. Community Action Agencies (CAAs) form one of the most
active agencies that provide home support services to low-income households in Central Iowa.
The Community Action Agency (CAA) of the Des Moines Housing Services is one such agency.
CAA offers several low-income assistance programs and services to help keep and maintain
housing. These programs provide crisis assistance low-income families and help them gain
personal and economic self-sufficiency. Most of these programs are available to households with
gross incomes at or below 150% of federal poverty guidelines. Some the included programs are:
1. Assessment and Resolution (A & R) – The program helps low income households
experiencing credit problems with MidAmerican Energy to establish bill payment plans
and negotiate with the company. It also provides some financial assistance to reestablish
service and prevent disconnection.
2. Cooling Program – The Cooling program helps households with cooling equipment
during extremely hot weather and runs through June to August.
3. Furnace Repairs and Replacement – This is a year around program offered to eligible
homeowners and buyers with preference given to the elderly and families with children.
The Greater Des Moines Metro Area Regional Analysis of Impediments to Fair Housing Choice
55
4. Low-Income Home Energy Assistance Program (LIHEAP) – The program runs
November through April and assists almost 6,800 households every year with a one-time
payment towards heating costs.
5. Weatherization Applications – This program is offered to the approximately 150 homes
in the City of Des Moines and helps with attic and sidewall insulation, furnace repair or
replacement and energy efficiency measures.
4.5 SUMMARY OF CHAPTER
There is an unmet need for affordable housing in the region. This includes subsidized units,
housing subsidies for existing units, as well as opportunities for affordable homeownership.
While there may be units available for rental, there are not enough vouchers available through
Section 8 to subsidize every family in need. Furthermore, plans to decrease the number of
physical public housing units in the region combined with long waiting lists for Section 8
vouchers mean that this problem is unlikely to improve in the near future.
The distribution of either new or existing affordable units within the region also needs to be
addressed. Currently, most of the affordable and public housing units (public housing, Section 8
and LIHTC housing) in the region are located within Des Moines. LIHTC developments are
more dispersed across the region than public housing, providing housing options to low income
households in many of the region’s jurisdictions. Local jurisdictions have the opportunity to
build on the successes of this program while addressing regional needs for affordable housing.
The Greater Des Moines Metro Area Regional Analysis of Impediments to Fair Housing Choice
56
5. ANALYSIS OF ZONING CODES
Zoning can play a significant role in impeding or encouraging fair housing choice across a
region. By restricting land use, zoning codes can obstruct fair access to in a specific area or
mandate its inclusion. Iowa state law does not mandate that municipalities, when creating zoning
plans, take into account fair housing or affordability. The closest that the state comes in this
regard are the “Local Comprehensive Planning and Development Guidelines” (State Code
Chapter 18b.2) which states that a municipality may include affordability in a comprehensive
plan. Housing affordability and fairness are generally not considered significant issues in the
Midwest due in part to overall low median housing prices. The lack of state direction in this
matter leaves decisions about fair and affordable housing almost entirely to the cities themselves
to decide.
5.1 ZONING AND BARRIERS TO THE CREATION OF AFFORDABLE HOUSING
The greatest direct impact of zoning regulations in the Greater Des Moines Metro can be
observed in the distribution of affordable housing. The unfortunately reality is that low-income
housing is fairly concentrated in certain areas in the City of Des Moines. The current zoning
codes of the metro area contribute to this concentration in the core while impeding low-income
housing in certain higher income suburbs.
In addition to restricting where affordable housing may be built, zoning codes can restrict the
siting of certain facilities such as group homes or mobile dwellings. The law may also
discriminate against certain groups through occupancy requirements. The legal environment
created by these factors contributes to the exclusionary nature of certain neighborhoods and the
isolation of communities that the fair housing act was intended to protect in others.
Impact of Subdivision Requirements
Excessive subdivision requirements can raise overall housing cost. When a disparity is seen in
zoning codes across the region, the areas with a higher regulatory burden will push lower income
residents out. Zoning codes often define minimum standards to which dwellings must conform.
These minimum standards can have an important effect on the price of housing in the area.
Quantifying the real impact that these regulations have on housing prices is not easy. A study
performed for the National Association of Homebuilders (NAHB) tries to do just that. To
calculate the financial burden that housing regulation places on residents, they determined fair
minimum benchmarks. For example, the panel determined that a reasonable minimum lot size
for Single-Family Detached Dwelling (SFDD) in a “more dense” zone would be 4250 square
feet. According to their results, 65% of the additional cost of a home due to regulation comes

The Greater Des Moines Metro Area Regional Analysis of Impediments to Fair Housing Choice
57
from minimum lot size. Minimums for floor size, lot width and front setback also contributed
significantly to the overall cost burden.
To examine the effect of subdivision requirements as a regulatory barrier in the Greater Des
Moines Area, we compared the regulations from the densest residential zones which allow
SFDD.2 Their formula for calculating the cost burden of regulations gives these results in the ten
largest communities in the Des Moines metropolitan area. All communities studied exceeded the
recommended standards in every standard except minimum floor area. Not all zoning codes have
a required minimum floor area, and only Altoona exceeded the 925 square foot recommended
minimum (Table 24).
Table 24: Cost Burden Analysis in the Greater Des Moines Metro Area, 2012
Zoning district Min. lot size
in square
feet
Floor area
in square
feet
Front
setback
in feet
Lot
width in
feet
Cost burden
in dollars
Recommended 4250 981 13 30 0.00
Des Moines 6000 NA 30 60 6,357.50
West Des Moines 5300 NA 20 50 3,422.50
Altoona 9000 1150 30 70 27,139.64
Ankeny 8000 NA 30 65 10,082.50
Clive 7500 900 30 60 8,682.50
Indianola 7200 600 25 60 7,917.50
Johnston 7500 NA 30 60 8,682.50
Urbandale 7350 NA 30 70 9,700.00
Waukee 10000 750 30 75 14,432.50
Windsor Heights 7200 NA 35 60 8,517.50 Source: National Association of Home Builders, 2010
Although this is by no means a precise measure, it helps illustrate the burden that these
regulations put on residents in real dollar terms. It is easy to see how the Greater Des Moines
Metro Area could push poorer families into areas with less restrictive zoning laws and out of
areas where the zoning code effectively raises the minimum price of housing. Still the narrow
scope of this measure excludes many other important factors such as the amount of land actually
zoned for the kind of dense single-family units on which this study focuses. For example, based
solely upon these figures, West Des Moines would seem to be the most affordable place to live
in the metro area. The figures however tell a different story. Examining home values in 2010 we
see that West Des Moines tends to have higher priced units while Des Moines trends more
toward affordability.
2 This study like many (see Patterson, HOME) uses SFDDs as a benchmark to simplify analysis across jurisdictions.
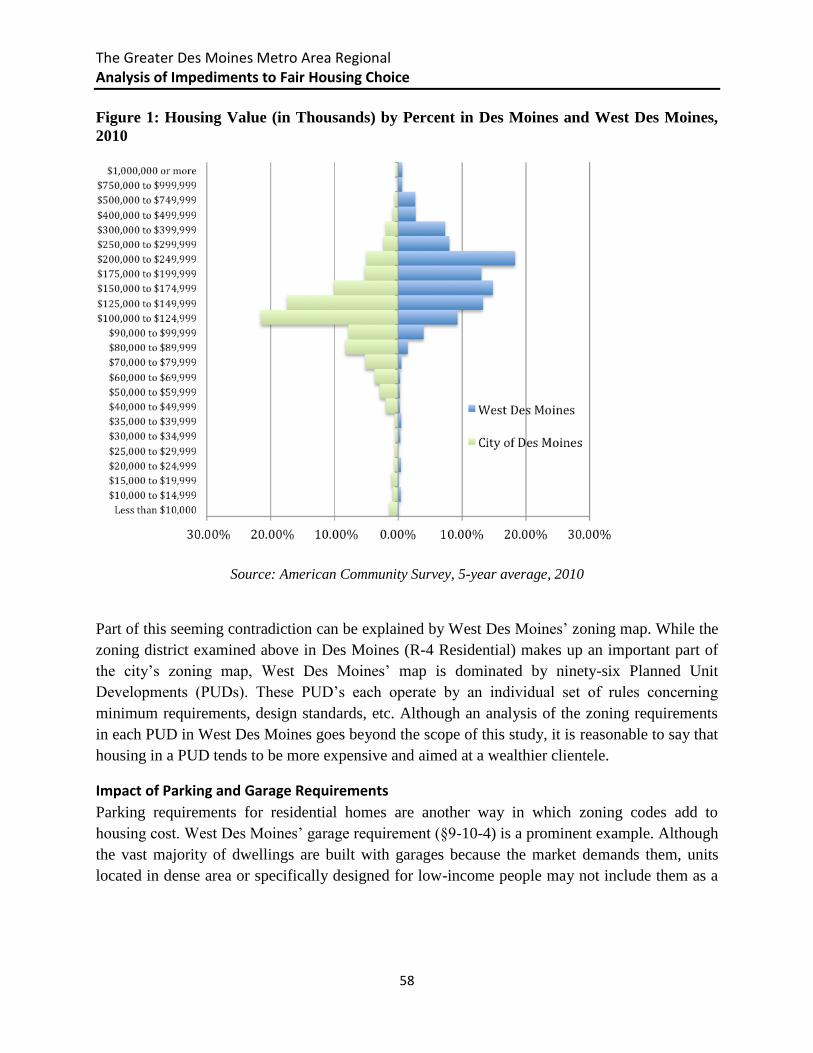
The Greater Des Moines Metro Area Regional Analysis of Impediments to Fair Housing Choice
58
Figure 1: Housing Value (in Thousands) by Percent in Des Moines and West Des Moines,
2010
Source: American Community Survey, 5-year average, 2010
Part of this seeming contradiction can be explained by West Des Moines’ zoning map. While the
zoning district examined above in Des Moines (R-4 Residential) makes up an important part of
the city’s zoning map, West Des Moines’ map is dominated by ninety-six Planned Unit
Developments (PUDs). These PUD’s each operate by an individual set of rules concerning
minimum requirements, design standards, etc. Although an analysis of the zoning requirements
in each PUD in West Des Moines goes beyond the scope of this study, it is reasonable to say that
housing in a PUD tends to be more expensive and aimed at a wealthier clientele.
Impact of Parking and Garage Requirements
Parking requirements for residential homes are another way in which zoning codes add to
housing cost. West Des Moines’ garage requirement (§9-10-4) is a prominent example. Although
the vast majority of dwellings are built with garages because the market demands them, units
located in dense area or specifically designed for low-income people may not include them as a
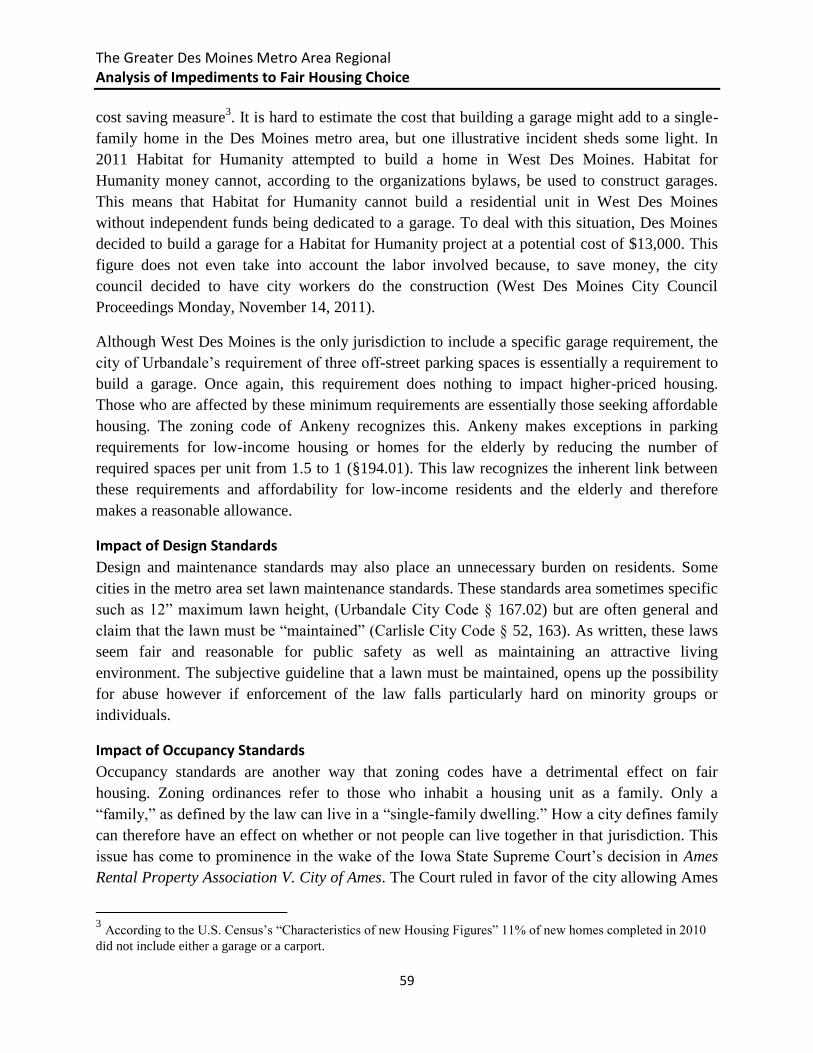
The Greater Des Moines Metro Area Regional Analysis of Impediments to Fair Housing Choice
59
cost saving measure3. It is hard to estimate the cost that building a garage might add to a single-
family home in the Des Moines metro area, but one illustrative incident sheds some light. In
2011 Habitat for Humanity attempted to build a home in West Des Moines. Habitat for
Humanity money cannot, according to the organizations bylaws, be used to construct garages.
This means that Habitat for Humanity cannot build a residential unit in West Des Moines
without independent funds being dedicated to a garage. To deal with this situation, Des Moines
decided to build a garage for a Habitat for Humanity project at a potential cost of $13,000. This
figure does not even take into account the labor involved because, to save money, the city
council decided to have city workers do the construction (West Des Moines City Council
Proceedings Monday, November 14, 2011).
Although West Des Moines is the only jurisdiction to include a specific garage requirement, the
city of Urbandale’s requirement of three off-street parking spaces is essentially a requirement to
build a garage. Once again, this requirement does nothing to impact higher-priced housing.
Those who are affected by these minimum requirements are essentially those seeking affordable
housing. The zoning code of Ankeny recognizes this. Ankeny makes exceptions in parking
requirements for low-income housing or homes for the elderly by reducing the number of
required spaces per unit from 1.5 to 1 (§194.01). This law recognizes the inherent link between
these requirements and affordability for low-income residents and the elderly and therefore
makes a reasonable allowance.
Impact of Design Standards
Design and maintenance standards may also place an unnecessary burden on residents. Some
cities in the metro area set lawn maintenance standards. These standards area sometimes specific
such as 12” maximum lawn height, (Urbandale City Code § 167.02) but are often general and
claim that the lawn must be “maintained” (Carlisle City Code § 52, 163). As written, these laws
seem fair and reasonable for public safety as well as maintaining an attractive living
environment. The subjective guideline that a lawn must be maintained, opens up the possibility
for abuse however if enforcement of the law falls particularly hard on minority groups or
individuals.
Impact of Occupancy Standards
Occupancy standards are another way that zoning codes have a detrimental effect on fair
housing. Zoning ordinances refer to those who inhabit a housing unit as a family. Only a
“family,” as defined by the law can live in a “single-family dwelling.” How a city defines family
can therefore have an effect on whether or not people can live together in that jurisdiction. This
issue has come to prominence in the wake of the Iowa State Supreme Court’s decision in Ames
Rental Property Association V. City of Ames. The Court ruled in favor of the city allowing Ames
3 According to the U.S. Census’s “Characteristics of new Housing Figures” 11% of new homes completed in 2010
did not include either a garage or a carport.
The Greater Des Moines Metro Area Regional Analysis of Impediments to Fair Housing Choice
60
to restrict occupancy of single-family dwellings to no more than three unrelated adults. In Ames
the stated purpose of the law was to exclude groups of students from moving into the residential
area of the city. It is possible that this law could also have a negative impact on groups protected
by the Fair Housing Act especially recent immigrants who often live several to a house in order
to conserve resources.
Table 25: Occupancy Standards for Maximum Number
of Unrelated Adults
Jurisdiction
Maximum number of
unrelated adults
Entitlement Jurisdiction
Des Moines 4
West Des Moines 3
Others
Windsor Heights 4
Urbandale 3
Johnston 4
Ankeny 5
Clive 5 Source: Analysis of zoning codes for above cities, 2010
In the Greater Des Moines Metro Area, definitions of family range wildly and it is difficult to
give an overview briefly, but Table 25 shows the maximum number of unrelated people
permitted in a family unit. Altoona for example defines family simply as a group “living as a
household unit.” On the other extreme, Windsor Heights defines family as exclusively a group of
related people. A group of up to four non-related people living together is defined as “group
residential.” Group residence, unlike family residence is only allowed by right in one high-
density zone. In West Des Moines, the code explicitly does not allow by right sororities or
fraternities, temporary or seasonal residents, or transitional living facilities for former criminals.
Group housing refers generally to licensed facilities in which up to eight unrelated people live
together for therapy, special assistance, counseling, rehabilitation, or special needs stemming
from disability. The codes differed greatly with regards to group homes with some making
specific provisions for them and referencing the Fair Housing Act (ex. Windsor Heights
(§167.05)) and others making no mention of them at all (ex. Waukee). Des Moines exempts
Group homes from many building code requirements, lowering cost and increasing the
attractiveness of Des Moines as a site for these homes (§60-5). Des Moines also makes specific
allowances for shelters for the homeless as normal use in zoning (§134-589). One negative
aspect of the zoning code of Des Moines however is that new group residences, foster homes,
correctional transitional residence or homeless shelter cannot be located within one quarter mile

The Greater Des Moines Metro Area Regional Analysis of Impediments to Fair Housing Choice
61
of any other such facility (§134-552 9f & 13; §134-307.7; §134-342.7). Because certain aspects
of zoning have a tendency to push groups that may need these services into certain areas, this can
present a serious problem. The facilities cannot sometimes exist by right in the areas where need
is greatest.
West Des Moines’ code allows for up to eight unrelated handicapped individuals to live in the
same dwelling but explicitly excludes those “currently using or addicted to a ‘controlled
substance.’” It also makes the same allowance for licensed residential care facilities (§ 9-2-2).
On the other hand, the zoning code makes absolutely no mention of homeless shelters. In cities
that do regulate homeless shelters, the regulations placed on them seem fair and make it clear
what is acceptable. Other cities with less clear laws put more of a burden on those wishing to
construct such homes. They must gain an exemption from the specific use regulations of the zone
in which they want to open the shelter.
Pyramid Zoning
Pyramid zoning, allowing lower density housing in all zoning districts, can affect general
affordability in multiple ways. Allowing low-density housing in areas zoned for high-density
reduces the overall supply of dwellings in, more affordable, high-density buildings. Based on
construction costs, new housing in multi-unit buildings are vastly more affordable than single-
family dwellings. In West Des Moines in 2010 the average cost of a single-family dwelling was
more than four times that of a unit in a larger building.
Figure 2: Construction Cost per Unit in Des Moines and West Des Moines, 2010
Source: Analysis of U.S. Census Data, 2010
The Greater Des Moines Metro Area Regional Analysis of Impediments to Fair Housing Choice
62
Pyramid zoning, by reducing the overall density of the neighborhood can also prevent the
construction of new high-density housing. Many zoning codes take into consideration the
density of all properties within a certain radius in decisions about density. This means
that a large number of low-density units in a neighborhood could actually prevent the
construction of higher density units in the future.
5.2 MANUFACTURED AND MOBILE HOUSING
Manufactured and mobile housing provide an important supply of affordable housing, but zoning
limitations can restrict their construction and push them to less desirable areas. The average sale
price of a new manufactured home in 2010 was $62,000 much lower than the cost of a new site
built dwelling ($272,900). The Iowa Supreme Court in a 2006 decision, “Bahl v. The City of
Ashbury” decreed that manufactured homes, homes built off-site but otherwise immobile, cannot
be excluded from residential zones. As long as they meet the other qualifications of a SFDD they
must be allowed. However, excessive square footage requirements and design standards could
make it difficult to install a lower cost manufactured unit in a residential zone. For example the
average singlewide manufactured home built in 2010 was 1,100 square feet, smaller than
Altoona’s minimum square footage requirement. Although manufactured homes are legally
protected from discrimination, protections for mobile home residents are much weaker.4
Iowa’s state laws protecting residents of mobile home parks are among the weakest in the
country. According to the state’s 1978 “Mobile Home Parks Residential Landlord and Tenant
Act,” landlords can evict mobile home residents for almost any reason giving them only three
days to vacate their lot (IA Code §562B.25.2). Additionally in Iowa, cities do not have the
authority to establish further protections of mobile home residents such as rent controls or boards
to determine the fairness of fees paid by the residents (IA Code § 331.304). This lack of
protection for residents of mobile homes makes Iowa as a whole a less attractive state for mobile
home owners. Mobile home parks in the Greater Des Moines Metro Area are heavily
concentrated within Des Moines itself. Most of the higher income suburbs have two or fewer
parks, and a few have none. All of the cities we surveyed have some kind of zoning which would
permit the building of manufactured housing parks (IA Code § 414.28), but some have
restrictions that would make the construction of new parks quite difficult. Urbandale, for
instance, allows manufactured housing parks only as a “conditional use” in one low-density rural
residential zone.
4 US Census Bureau.“Cost & Size Comparisons: New Manufactured Homes and New Single-Family Site-Built
Homes (2006 - 2010)” https://www.census.gov/const/mhs/sitebuiltvsmh.pdf.
The Greater Des Moines Metro Area Regional Analysis of Impediments to Fair Housing Choice
63
5.3 VARIANCES AND EXCEPTIONS
Variances and exceptions exist to allow residents and developers to deviate from the zoning
code. Each city establishes a Zoning Board of Adjustment to evaluate requested exceptions to the
zoning code. In Des Moines the board seems generally willing to approve such requests. This
eases some of the regulatory burden which zoning restrictions can create. For example, an
appellant may come to request the division of a lot 100 feet wide into two separate lots for the
construction of single-family dwellings. In the case of Des Moines, these resulting lots would be
in violation of the code that requires lots to be at least 60 feet wide. These kinds of situations
occur with some frequency and in Des Moines the proposals are usually accepted. In March of
2012 while discussing one potential variance, a member of the board expressed the fact that the
general policy of the board was to encourage the availability of housing. This attitude is
important as it can help create an environment that supports the development of affordable
housing. West Des Moines’ Zoning Adjustment Board in the survey we have done over the first
half of 2012 deals with far fewer requests, but seems as willing as the City of Des Moines’ to
grant adjustments and exceptions. During the time we examined however, no issues related to
new housing were raised during the meetings of the Zoning Board of Adjustment.
5.4 SUMMARY OF CHAPTER
The regulation of residential development through zoning is a very direct way in which cities can
affect the cost, availability, and location of housing. The Greater Des Moines Metro Area
includes very little inclusionary zoning, and in fact the variance in zoning law across
jurisdictions pushes populations from more restrictive jurisdictions and into cities that have more
permissive codes. Subdivision requirements, restrictions on mobile and manufactured homes,
and occupancy standards are all important contributors to this variation. Inconsistency across city
lines leads to concentrations of poverty in the urban core and tends to exclude lower income
populations from suburban communities.
The Greater Des Moines Metro Area Regional Analysis of Impediments to Fair Housing Choice
64
6. COMMUNITY INPUT & QUALITATIVE ASSESSMENT OF IMPEDIMENTS
The regional analysis of impediments study included stakeholder inputs from housing
professionals, service providers, citizen groups, and neighborhoods associations. These data were
gathered through targeted interviews, a fair housing survey, and focus group discussions. This
chapter describes findings from this community input effort. It discusses the Fair Housing
Survey, interviews, and focus groups that were included in this study and reports on the findings.
The summary of the chapter provides an analysis of these results and places them back in the
context of the report and the findings from other aspects of the study.
6.1 SURVEYS
The secondary data and spatial analysis that form the bulk of the research for this study provide
an important window into the conditions shaping fair housing choice in the region; however,
they provide little insight into the on-the-ground experience of city staff, housing agencies,
service providers, and neighborhood representatives. We wanted to hear directly from these
stakeholders regarding barriers to affordable housing, hone ownership, and fair housing in the
region. We also wanted to know what they saw as the major barriers to affordable housing in the
region over the next five years.
The Fair Housing Survey allowed us to maximize stakeholder input into the study. Surveys can
be a time and cost effective mechanism to seek feedback and inputs from a wide variety of
population groups. An online or web survey can be easy to administer and the survey instruments
can be sent out to participants quickly. Web based survey mediums can be analyzed through in-
built quantitative analytic functions, thereby reducing analysis time. The study’s survey helped
provide valuable public input, while addressing participant concerns through phone and email
clarifications.
We sent the survey to a mix of city jurisdictions, housing providers, regional housing agencies,
lenders, developers, social and support service providers, non-profit citizen groups,
neighborhood associations and the Neighborhood Review Board (NRB). We received a total of
61 responses. A copy of the survey is included in this report as Appendix A.
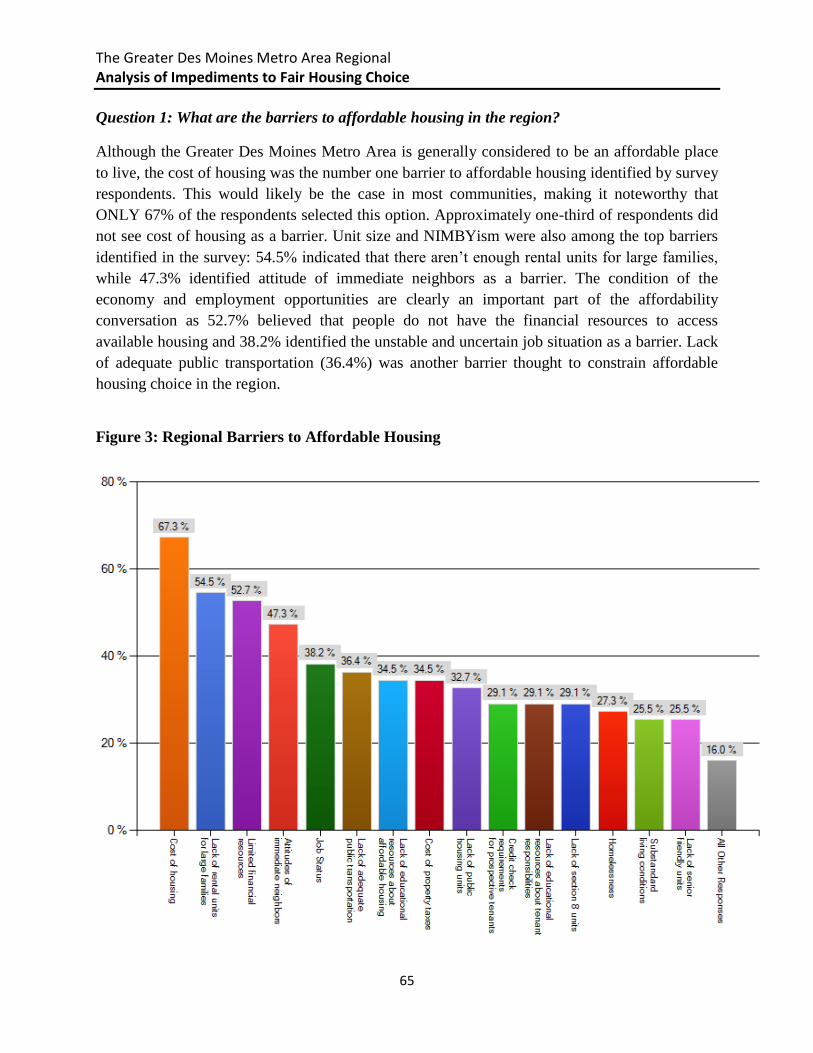
The Greater Des Moines Metro Area Regional Analysis of Impediments to Fair Housing Choice
65
Question 1: What are the barriers to affordable housing in the region?
Although the Greater Des Moines Metro Area is generally considered to be an affordable place
to live, the cost of housing was the number one barrier to affordable housing identified by survey
respondents. This would likely be the case in most communities, making it noteworthy that
ONLY 67% of the respondents selected this option. Approximately one-third of respondents did
not see cost of housing as a barrier. Unit size and NIMBYism were also among the top barriers
identified in the survey: 54.5% indicated that there aren’t enough rental units for large families,
while 47.3% identified attitude of immediate neighbors as a barrier. The condition of the
economy and employment opportunities are clearly an important part of the affordability
conversation as 52.7% believed that people do not have the financial resources to access
available housing and 38.2% identified the unstable and uncertain job situation as a barrier. Lack
of adequate public transportation (36.4%) was another barrier thought to constrain affordable
housing choice in the region.
Figure 3: Regional Barriers to Affordable Housing
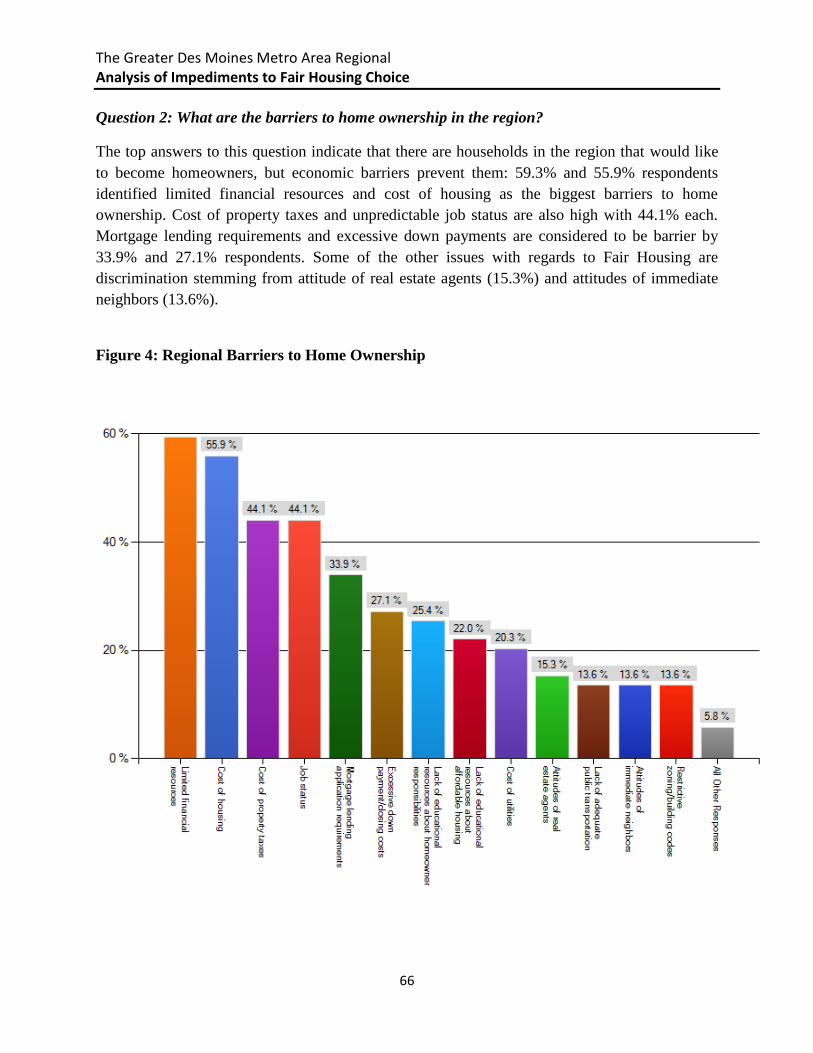
The Greater Des Moines Metro Area Regional Analysis of Impediments to Fair Housing Choice
66
Question 2: What are the barriers to home ownership in the region?
The top answers to this question indicate that there are households in the region that would like
to become homeowners, but economic barriers prevent them: 59.3% and 55.9% respondents
identified limited financial resources and cost of housing as the biggest barriers to home
ownership. Cost of property taxes and unpredictable job status are also high with 44.1% each.
Mortgage lending requirements and excessive down payments are considered to be barrier by
33.9% and 27.1% respondents. Some of the other issues with regards to Fair Housing are
discrimination stemming from attitude of real estate agents (15.3%) and attitudes of immediate
neighbors (13.6%).
Figure 4: Regional Barriers to Home Ownership

The Greater Des Moines Metro Area Regional Analysis of Impediments to Fair Housing Choice
67
Question 3: What are the barriers to fair housing in the region?
The findings from this question are perhaps the most telling of the fair housing situation in the
region. While affordability and issues with homelessness and near homelessness dominate most
housing conversations, fair housing is an important and growing concern in the region. Lack of
knowledge of fair housing rights and laws is cited as barrier by 42.1% and 40.4% of respondents
respectively. Another 40.4% of the respondents think that discomfort with cultural differences
and attitudes of immediate neighbors are one of the biggest barriers to fair housing.
Figure 5: Regional Barriers to Fair Housing
The Greater Des Moines Metro Area Regional Analysis of Impediments to Fair Housing Choice
68
Question: What is the most significant housing challenge facing your jurisdiction/service area
over the next 5 years?
This question was left open-ended and as a result, we received a range of answers. However,
many of these answers spoke to either problems with affordability or problems with the
availability of the particular kinds of units that a given household might need either due to family
size or disability. Respondents also raised concerns with technical barriers such as tenant
screening practices and population-specific barriers such as units accessible to people with
disabilities or culturally-specific housing needs. From these answers, we identified three main
themes: (1) affordability and quality of units; (2) technical barriers; and (3) diversity of housing
options.
1. Affordability and quality of units:
Increasing rents
Lack of quality, safe and affordable housing through the region
Lack of safe and affordable housing located near minimum or low wage paying and
service jobs.
Rising costs of houses coupled with inadequate household incomes and lack of rental
housing make it that much more difficult to access housing
A majority of affordable housing is in older homes in older neighborhoods. This
aging stock requires significant rehabilitation and weatherization and hence is
difficult to maintain and keep in good condition.
2. Technical barriers:
Increased landlord screening requirements and credit checks
An increase in regulatory requirements like fire sprinkler and energy efficiency
mandates which will continue to push up prices of affordable units
3. Diversity in housing options:
Lack of handicap accessible units
Lack of educational and financial resources for the increasing minority population.
Lack of diversity in housing choice especially for large families—there aren’t enough
clean and affordable large units to service large families.
Need for culturally sensitive and safe housing options
Need more units willing to accept low income families and extended (or large)
families
The Greater Des Moines Metro Area Regional Analysis of Impediments to Fair Housing Choice
69
6.2 FOCUS GROUP DISCUSSIONS
Two focus group discussions were conducted in conjunction with The Tomorrow Plan team to
gather inputs regarding housing in the region. The focus groups were conducted in the months of
July and August 2012 and involved representatives from housing service providers, lenders,
developers, non-profit housing providers and support service providers. One focus group brought
together affordable housing providers and advocates while the other focused on developers. The
intent of these two focus groups was to gather a diversity of perspectives regarding the needs and
issues related to housing in the region.
Findings from Focus Group Discussions
The focus groups discussions covered a range of topics and issues related to housing. Analysis of
those conversations revealed three central themes. The first is that a regional approach to housing
is needed. This theme includes, but is not limited to affordable housing; however, it does speak
directly to the issue of dispersal and concentration of affordable housing. The second theme
identifies a need for more affordable housing overall and addresses specific barriers that were a
concern to the participants in the focus groups. The final theme identifies housing needs that are
population specific such as more senior housing and more units for large families.
1. A regional approach to housing is needed.
Housing must be looked at from a regional lens
A regional approach to housing is currently missing in the Greater Des Moines Metro
Area
Most rehabilitation of housing is done by non-profit organizations and is concentrated in
the Des Moines region
There is need to locate subsidized housing near employment centers, especially the
Jordan Creek mall area.
2. The region needs more affordable housing. Barriers to housing affordability exist.
Availability of affordable units to lowest income residents remains a challenge
The community must be educated about low-income projects and its perceived impacts
(NIMBY issues)
There are barriers to mixing sizes of housing from both developers and community.
Some regulatory requirements like fire sprinklers, lead paint issues and energy efficiency
requirements pose a barrier to rehabilitation of affordable housing due to associated
prohibitive costs.
The Greater Des Moines Metro Area Regional Analysis of Impediments to Fair Housing Choice
70
3. Certain populations are facing higher barriers to housing choice than others
Mental health issues and disability pose a barrier to housing
Large families face growing discrimination, which is further increased due to lack of
adequate large units.
There is a gap in the demand and supply of senior friendly housing, with increased
demand in neighborhoods to ‘age in place’.
Multi-generational families have a tough time finding flexible housing options due to
lack of units and a negative community perception of multi-generational families.
6.3 INTERVIEWS
In addition to surveys and focus group discussions, interviews were conducted with several
public housing professionals, non-profit housing providers, support service providers, health
service providers, funders, citizen group representatives and urban and housing researchers
Interview findings
The themes raised in the interviews reflect many of the same themes raised in the survey and
focus groups. However, because of the one-on-one nature of interviews and the opportunities for
both the researcher and the respondent to ask questions and elaborate on ideas, the interview
responses add depth and detail to these themes.
1. There is a definite dearth of affordable housing in the region with a serious and growing
gap in the need and availability of safe and affordable housing units. This is considered as
one of the biggest barriers especially when dealing with persons below 50% or even 30%
of area median income (AMI) and asks for a redefinition of ‘affordable’ in the region.
2. Larger families with 3 or more children have a tough time finding adequately sized and
affordable housing due to lack of larger units in the region. The problem grows as a result
of negative public and landlord perception of these families.
3. There is a shortage of support services and programs available to help families and
individuals. People may get housing but don’t have the knowledge of or means to
maintain it. Many a times these people slide back into a state of homelessness.
4. There is a substantial ‘gray’ and unaccounted population group, usually falling below
30% AMI, who bounce from one alternate accommodation to other or double and triple
up with friends and relatives on a short time basis. The existing system is not equipped to
account for this population group and hence fails to investigate specific issues of concern.
This problem may be heightened by the presence of slumlords and less than responsible
landowners.
The Greater Des Moines Metro Area Regional Analysis of Impediments to Fair Housing Choice
71
5. Problem with de-concentration – Most public housing units are located in Des Moines.
This leads to issues of access to jobs and opportunities, when public transit lines are
unable to service specific groups at required time.
6. A major portion of the region’s affordable housing stock is located in the City of Des
Moines and is made up of very old homes in older neighborhoods. These properties
require a lot of maintenance and rehabilitation to comply with various code requirements
and are keeping developers away.
7. The rental properties located in the low end of the spectrum are not necessarily
maintained and can often house minorities and immigrants facing financial difficulties.
These populations do not have the necessary knowledge of fair housing laws and rights
and may not feel empowered enough to raise fair housing issues for fear of eviction or
legal repercussions.
8. There is a lack of affordable, handicap accessible units in the region
9. Mentally disabled form a substantial portion of the homeless and near homeless
population and may face housing discrimination. Many of these can be housed with
regular case management but face a tough challenge with dwindling resources for social
and support services.
10. Credit scores and criminal record history, frequently used screening criteria for rental
housing, make it difficult to avail housing irrespective of the scale or time of criminal
activity. Most of the screening requirements do not allow any flexibility to look at unique
cases or recovering individuals.
11. The homeless sheltering system in Des Moines serves as midterm, temporary housing for
many people instead of crisis housing, as there aren’t many affordable housing options in
the region. People continue to stay in shelters till a time they can navigate the housing
and support services system or move on to the alternate options. HUD’s ‘housing first’
policy has played into this situation, as shelters are required to get people rehabbed on a
priority basis, reflecting these as outcomes in periodic evaluations. While housing these
populations is essential, there isn’t enough supply to meet the current needs.
12. Long Section 8 waiting lists further point to lack of enough affordable and subsidized
housing units.
13. Language remains a barrier for many members of the immigrant communities.

The Greater Des Moines Metro Area Regional Analysis of Impediments to Fair Housing Choice
72
14. Renting without leases – This is especially prevalent in the rural areas, but is seen in the
metro region as well. The absence of a lease makes it difficult for individuals and
families to lodge complaints related to fair housing.
15. NIMBYism is prevalent in areas of the community and creates barriers when planning
and developing public and/or low-income housing. Lack of sufficient knowledge of low
and affordable housing is often cited as a reason for this NIMBY attitude.
6.4 SUMMARY OF CHAPTER
The findings from surveys, interviews, and focus group discussions have been incorporated into
this Regional AI Report. These data played an important role in assisting researchers to identify
the specific barriers to fair housing choice in the region. Surveys point to cost as a barrier to both
affordable housing as well as home ownership in the region. The most cited barriers to fair
housing included lack of knowledge about fair housing rights and laws, attitudes of neighbors,
and language barriers for non-English speaking households.
As discussed previously in this report, the population demographics of the region have changed
in the last decade and the number of minority and foreign born individuals is increasing. This is
reflected in concern of survey respondents that language poses as a barrier to non-English
speaking population and that attitudes of neighbors are creating a barrier to fair and affordable
housing. These data also reveal a number of technical aspects of affordable housing production
and tenant procedures for securing fair and affordable housing that are crating barriers to fair
housing choice in the region. The issues identified in this section provide a valuable starting
place for conversations about impediments to fair housing choice in the region and planning
processes to address those barriers.
The Greater Des Moines Metro Area Regional Analysis of Impediments to Fair Housing Choice
73
7. REGIONAL FAIR HOUSING LAWS AND PROGRAMS
This chapter provides an overview of the fair housing laws in the region and how these laws are
addressed by the various fair housing agencies. It forms an important piece in the fair housing
dialogue discussion as it describes the current situation with regards to discrimination in housing.
It provides a brief description of the various agencies responsible for governing fair housing
practices in the region and their individual roles within the local context. This role may be
limited to education and outreach or be expansive enough to include investigation of fair housing
complaints, mediation and conciliation. The chapter also provides a brief snapshot of housing
complaints filed in the state and the Greater Des Moines metro area.
7.1 A FRAMEWORK FOR FAIR HOUSING ENFORCEMENT
Fair housing law attempts to ensure that people have equal opportunities to access housing of
their choice. Discrimination in housing based on race, color, national origin, religion, sex,
familial status and disability status is prohibited by federal and state laws. The Fair Housing Act
of 1968 and the Fair Housing Amendments Act of 1988 (42 U.S. Code §§ 3601 – 3619) prohibit
discrimination in all aspects of housing, including the sale, rental, lease, or negotiation for real
property. Federal fair housing law prohibits discrimination based on race, color, national origin,
religion, sex, familial status or handicap (HUD, 2012). Familial status and people with
disabilities were added as protected classes through the Fair Housing Amendments Act of 1988.
The US Department of Housing and Urban Development (HUD) and the US Department of
Justice are the federal entities responsible for fair housing enforcement.
The Fair Housing Act of 1968 and Fair Housing Amendment Act of 1988 provide legal
protection to certain population groups, called ‘protected classes’, as they seek housing of their
choice. The 1968 law recognizes that minorities often experience unequal access to housing and
prohibited discrimination in housing transactions based on race, color, religion and national
origin. This law was amended in 1988 to include familial status, sex and handicap as protected
classes.
The act provides for an administrative process to investigate complaints and directs the
government to litigate cases on behalf of victims through enforcement agencies. The injured
parties may also file their own lawsuits. HUD and the Department of Justice are charged with
enforcing fair housing laws. HUD conducts regular reviews of its housing developments that
receive federal assistance and seeks to correct situations found to be violating fair housing law.
Local governments also play an important role in ensuring that its residents can have equal
access to housing. In Iowa, state law recognizes a larger set of protected classes than the federal
government. Effective July 1, 2007, the Iowa Civil Rights Act (Iowa Code Chapter 216) was

The Greater Des Moines Metro Area Regional Analysis of Impediments to Fair Housing Choice
74
expanded to add sexual orientation and gender identity to the list of protected classes. The
complete list of protected classes under Ch. 216 of the Iowa Code at this time are as follows: age,
color, creed, familial status, gender identity, mental disability, national origin, physical disability,
race, religion, retaliation, sex, and sexual orientation. Grievances must be filed through the state
grievance procedure to the Iowa State Civil Rights commission as outlined in Chapter 216.15 of
Title VI of the Iowa State Code.
The City of Des Moines’ fair housing laws are congruent with the state fair housing statutes.
Access to the sale, rental, lease, advertising, and financing of housing cannot discriminate based
on an individual’s race, religion, creed, color, sex, sexual orientation, national origin, ancestry,
family status, or physical or mental disability. Discrimination in refusing to sell or rent housing,
negotiation of the sale or rental of housing, or refusing to show or falsely denying the availability
of housing is illegal. The same terms, conditions and privileges of the sale or rental of a home
must be offered regardless of individual. Advertising must not indicate a preference, limitation,
or discrimination of potential buyer or renter of a home. Reasonable modification of a home,
rules, policies, practices or services for an individual with a disability must be accommodated.
Housing must meet accessibility standards for an individual with a disability. It is also illegal to
prevent the exercising of an individual’s full enjoyment of housing privileges through
intimidation, threat or force. Finally, it is illegal to falsify, refuse, or fail to provide information
regarding housing availability, application requirements, loan procedures and standards, or other
forms of financial assistance.
The responsibility of delivering a comprehensive set of fair housing services is strategically
divided among four public agencies the region. These include the Iowa Civil Rights
Commission, Des Moines Human Rights Commission, West Des Moines Human Rights
Commission and Urbandale Civil Rights Commission. The next few sections give an overview
of the role of these participating agencies in furthering the goal of fair housing and also describe
the current fair housing situation in the region.
7.2 LOCAL AGENCIES SUPPORTING FAIR HOUSING
This chapter identifies the primary agencies in the Greater Des Moines Metro Region that have
specific responsibilities related to the provision and enforcement of fair housing in the region. It
provides an overview of the responsibilities of each agency as they relate to fair housing as well
as their current education and outreach efforts.
Iowa Civil Rights Commission
The Iowa Civil Rights Commission is a neutral, fact-finding administrative agency that is
responsible for the enforcement of the Iowa Civil Rights Act of 1965. It enforces state and
federal laws that prohibit discrimination in employment, public accommodations, housing,
The Greater Des Moines Metro Area Regional Analysis of Impediments to Fair Housing Choice
75
education and credit. It provides conflict resolution services, mediation, education and training
and also undertakes testing to determine the presence of discrimination across the state. The
Commission is responsible for addressing fair housing queries and disputes in the Des Moines –
West Des Moines metro region in conjunction with the Des Moines Human Rights Commission.
The Iowa Civil Rights Commission (ICRC) conducts a variety of educational and training
programs to teach people about their rights and laws to prevent discrimination. In the fiscal year
2011, the Commission participated in 180 presentation or outreach events, reaching 18,758
participants and distributing 30,276 items (Iowa Civil Rights Commission Annual Report, 2011).
The Commission holds an outreach event at the State Fair, which is also one of its biggest
events. The Commission also uses social media like Facebook and Twitter to promote its
activities and increase visibility in the community.
The ICRC periodically prepares and publishes research and report related to fair housing. In
2010, ICRC prepared a report on the Design and Construction of Fair Housing units, detailing
statutory enforcement provisions to address violations under the state and deferral laws. It also
addressed the specifications on timeliness in reporting issues and proposed mechanisms to bring
more fair housing violations to the attention of the ICRC. The other studies covered parking
regulations for a housing provider providing housing for persons with disabilities (2010), an
overview on lending discrimination and predatory lending practices and finally one on the use of
assistance animals (2010).
Finally, the ICRC conducts testing exercises in various parts of the State to test discrimination
based on various protected classes. The ICRC released reports on several testing projects
conducted between 2007 and 2009. These included testing for discrimination on familial status
(October 2009) and housing advertisements (September 2008).
The 2009 Fair Housing study attempted to determine the presence and extent of discrimination
based on familial status in the six Iowa Communities of Ames, Ankeny, Des Moines, Council
Bluffs, Iowa City and Marshalltown. The cities of Ankeny and Des Moines are two of the major
jurisdictions in the Des Moines – West Des Moines MSA region. Testers posed as potential
applicants and contacted owners and managers of 35 properties in these selected cities. The study
showed no evidence of discrimination based on familial status (ICRC 2009) during the testing in
the selected cities.
Des Moines Human Rights Commission
The Des Moines Human Rights Commission is a neutral and impartial agency appointed by the
City Council to enforce the City’s Municipal code prohibiting discrimination on the basis of age,
race, color, creed, sexual orientation, national origin, ancestry, religion, physical and mental
disability or familial status in the areas of employment, public accommodation, housing and city

The Greater Des Moines Metro Area Regional Analysis of Impediments to Fair Housing Choice
76
government. It collaborates with federal, state and local organizations to accomplish the
following:
Increase awareness and enforce the laws regarding discrimination,
Initiate, receive, hear and investigate complaints of discrimination and
Provide human rights education/training to business and community groups
The Commission also helps with litigation if an appropriate remedy cannot be obtained through
conciliation. The city of Des Moines Human Rights Ordinance is found in Chapter 63 of the
City’s Municipal Code and provides details regarding filing, investigation, and conciliation of
complaints. The Commission addresses cases of discrimination from the City of Des Moines and
complaints outside the city may be directed to the Iowa Civil Rights Commission or the
appropriate local commission. The Commission will assist an aggrieved party in filing a
complaint to the state commission or court (within 300 days of the most recent incident). The
DMHRC will also offer mediation, investigative services, settlement negotiation, and litigation.
The Des Moines Human rights Commission undertakes a variety of education and outreach
initiatives by participating in events across the city. It also utilizes the city cable and radio to
reach various population groups. The Commission has tried to widen its reach by translating its
information material in many languages including Spanish and Mandarin. It continues to provide
services with limited resources as the Commission battles budget cuts experienced by all city
departments and agencies alike.
West Des Moines Human Rights Commission
The West Des Moines Human Rights Commission is a non-judicial Human Rights Commission
comprised of five residents of the City and appointed by the Mayor for a 3-year term. It
recognizes the authority of the Iowa Civil Rights Commission and works to prevent or eliminate
discrimination on the basis of race, color, creed, gender, family/marital status, religion, national
origin, age and disability. It aims to foster use of its programs and procedures to proclaim a
public policy of nondiscrimination.
The West Des Moines City Council passed the Human Rights Ordinance 2-9, on December 14th
,
1998. This Ordinance delineates the responsibilities of the Commission such as education and
outreach programs designed to prevent and eliminate discriminatory practices, employ and issue
research reports that study the existence, character, causes and extent of discrimination in the
city. Their mandate is primarily to educate for the purpose of eliminating discrimination and not
legislative. The Commission assists individuals with complaints of discriminatory practices and
refers them to the Iowa Civil Rights Commission for investigation and adjudication.

The Greater Des Moines Metro Area Regional Analysis of Impediments to Fair Housing Choice
77
Urbandale Civil Rights Commission
The Urbandale Civil Rights Commission is also a non-judicial, 5-member commission appointed
by the Mayor of Urbandale. The Commission works to prohibit discriminatory practices that
deny individuals rights and/or opportunities on the basis of race, age, creed, color, sex, national
origin, religion, ancestry, sexual identity or orientation, or disability. It works with the Iowa Civil
Rights Commission to address complaints filed by residents of Urbandale.
7.3 COMPLAINTS OF HOUSING DISCRIMINATION
In 2012, complaints involving disability basis followed by race formed the largest proportion of
all fair housing complaints received by the Des Moines Human Rights Commission. The number
of housing related complaints involving race as the primary basis decreased from 2010-2011 to
2012 period.

The Greater Des Moines Metro Area Regional Analysis of Impediments to Fair Housing Choice
78
Table 26: Fair Housing Complaints in Des Moines, 2008 – 2012
Basis
# of complaints
2008-2009
# of complaints
2010-2011
# of complaints
2012
Disability 0 4 7
Race 5 11 4
Retaliation 0 2 2
Religion 0 3 1
Race/Sex 2 0 0
Race, Nat'l Origin 1 0 0
Sex 1 0 0
Unknown 1 0 0 Source: Des Moines Human Rights Commission
The Iowa Civil Rights Commission received a total of 207 complaints involving fair housing in
the State of Iowa. Disability was the most cited reason followed by race in the state. The state
saw an increase in the number of cases involving familial status, color, and sex. At the same time
the number of cases involving national origin and race decreased from the 2009/10 to the
2010/11 period.
Figure 6: Housing Cases Docketed by Basis of Claim, State of Iowa
Source: Iowa Civil Rights Commission Annual Report, Fiscal Year 2011
*Gender identity and sexual orientation were added to the Iowa Code as protected bases on July 1, 2007
The Greater Des Moines Metro Area Regional Analysis of Impediments to Fair Housing Choice
79
7.4 RECENT COURT CASES IN FAIR HOUSING
The Assistant Attorney General of Iowa handles cases from across the state with a fair housing
basis. This included a case against the Des Moines Municipal Housing agency in 2010. The
details of the case and court’s verdict are stated below.
State ex rel Henderson v. Des Moines Municipal Housing Agency, (Ia. App. 2010)
This is the most recent iteration of a case which the State originally filed in 2005 on behalf of a
resident of Des Moines public housing who was denied the reasonable accommodation of an
exception to the pet rules which restricted the size of a dog, so that she could have her
assistance/companion dog. The district court directed a verdict for the housing authority, from
which the State appealed. In reversing the trial court, the court of appeals held that the person
with a disability is not required to show that the accommodation alleviates the disability, itself.
The purpose of the reasonable accommodation is to afford the person equal opportunity to use
and enjoy a dwelling, and the state’s evidence presented a jury question that the requested
accommodation of having her assistance alleviated the effects of her post-traumatic stress
disorder such that Henderson could feel secure and enjoy a basic sense of well-being. The court
of appeals addressed the issue of the lack of certification of the assistance animal, citing
decisions under the Fair Housing Act to the effect that such a requirement has no basis in law or
fact. Whether a companion animal is an appropriate and reasonable accommodation for a
disability is a question of fact, not a matter of law.
7.5 SUMMARY OF CHAPTER
Local agencies that support fair housing education and enforcement in the Greater Des Moines
Metro Region include the Iowa Human Rights Commission, the Des Moines Human Rights
Commission, the West Des Moines Human Rights Commission, and the Urbandale Human
Rights Commission. While each of these agencies is actively engaged in furthering their mission
to improve access to fair housing choice in the region, they are also understaffed and under
resourced. The proliferation of new monolingual ethnic communities within the region as well as
the push to address these issues on a regional scale will require additional resources as well as
systems to coordinate regionally. Fair housing complaints, in particular fair housing complaints
regarding race, have increased since the City of Des Moines completed its last AI report in 2009.
Given the increasing diversity in racial and ethnic demographics in the region, these trends have
the likelihood of continuing without intervention.

The Greater Des Moines Metro Area Regional Analysis of Impediments to Fair Housing Choice
80
8. SUMMARY OF IMPEDIMENTS & RECOMMENDATIONS
This chapter provides an overview of the findings of the study and identifies specific
impediments to fair housing in the greater Des Moines metro region. Each impediment is
followed by a set of suggested solutions. Because this report serves as the baseline for a regional
analysis of impediments in the greater Des Moines region, this list is offered as a starting place
and should not be considered as the only possible solutions available for consideration.
Jurisdictions are encouraged to offer feedback and additional suggestions for addressing the
impediments to fair housing in the region.
The study identified eight broad impediments to fair housing and housing choice in the region.
They are as follows:
1. Affordability
2. Geographic concentrations of subsidized and affordable housing
3. Changing demographics
4. Need for increased education of fair housing laws, rights and processes
5. Increases in landlord screening requirements
6. Lack of supportive services
7. Zoning barriers
8. Homelessness
Although this list is presented in discreet categories, it is important to remember that some issues
relate to more than one impediment, for example the changing demographics in the region
involve populations that bring cultural and language differences. This can lead to barriers for
households in accessing fair housing information, securing financial resources, or finding
culturally sensitive housing options.
8.1 AFFORDABILITY
Affordability comes across as the biggest concern impeding housing choice in the region. This
category can be further broken down into four sub-areas that include: the high cost of housing
compared to the incomes of many households, the lack of subsidized housing in the region, the
lack of affordable housing in close proximity to minimum to low wage job centers, the lack of
affordable housing for seniors and people with disabilities, and the lack of units for large and
extended family households.
Cost of Housing
Rising costs of housing and a tight supply rental housing coupled with inadequate household
incomes make it that much more difficult for many households to access housing that they can
The Greater Des Moines Metro Area Regional Analysis of Impediments to Fair Housing Choice
81
afford. In terms of barriers to home ownership, down payment requirements and property taxes
pose big hurdles to many households in accessing homeownership.
Lack of Subsidized Housing
There is a lack of housing for population groups making less than 60%, 50% or even 30% of
Area Median Income (AMI). Minimum wage is nowhere near a 'living wage', and a person could
be working full-time and still not earn enough money to afford rental housing in the area. Most
LIHTC housing development is not affordable to extremely and very low income people.
Data gathered from interviews and surveys identify lack of affordable housing as a barrier to fair
housing choice in the region. The solution to this shortfall is still up for debate. Some identify a
need to increase the production of affordable housing options. Others feel that enough units exist,
but not enough resources to provide subsidies for families who are still unable to afford this
housing. This is cited as the primary reason for a long Section 8 waiting list. The distribution of
either new or existing affordable units within the region also needs to be addressed.
Lack of Affordable Housing near Low Wage Job Centers
An often-cited concern is the issue of affordability and accessibility as a result of mismatch
between job centers and location of affordable housing. This problem is exacerbated by the need
for an increase in public transportation lines between minimum wage or low paying work and
affordable public housing.
Lack of Housing for Seniors and People with Disabilities
The increase in baby boomers and aging population requires accessible and senior friendly units,
properties and neighborhoods. Currently, the biggest issues with senior friendly housing are
accessible and affordable housing units, support services for seniors with mental and intellectual
disabilities, and sometimes – credit history. There is an increasing demand for ‘aging in place’
facilities, with senior friendly neighborhood infrastructure. An aging housing stock raises issues
with retrofitting to accommodate seniors and people with disabilities.
Lack of Affordable Units for Large and Extended Families
Another concern raised in the region is the lack of affordable and available housing options for
large families with 3 or more children. These families may face discrimination accessing housing
through landlords or realtors, sometimes in response to public concern of perceived problems
with large families. Multi-generational families and extended families face similar NIMBY
issues and this can be particularly difficult for immigrant and ethnic populations with varying
cultural differences in the concept of families and living.
The Greater Des Moines Metro Area Regional Analysis of Impediments to Fair Housing Choice
82
POTENTIAL SOLUTIONS
Promote a regional approach to provision of affordable housing
Create incentives for local jurisdictions to increase affordable housing options
Increase choice of affordable rental units
Increase the number and diversity of possible developers, managers, and funding sources
for affordable housing to include more organizations such as non-profits, faith based
organizations, corporations, manufacturing plants employing large number of low-wage
workers, pension funds, community benefits agreements and others
Increase the provision of affordable housing around job centers
Increase public transportation options, to increased lines and also increased frequency,
lines to run late in the evenings
Create incentives for private developers to invest in developing and rehabilitating
affordable housing. This can be done by creating programs that provide flexibility in
meeting code compliance requirements while ensuring health and safety of its residents.
Education and technical resources for low skilled individuals
Education resources on how to maintain and keep homes
More programs for emergency services when households are at risk of losing housing
Consider new forms of affordable rental units, such as co-op options that can help reduce
the rent-burden for individual households
Promote the use of universal design in new construction to increase housing options for
seniors and people with disabilities
Education resources towards financial management of household income
Educational resources on how to buy and maintain a house
8.2 GEOGRAPHIC CONCENTRATIONS OF SUBSIDIZED AND AFFORDABLE HOUSING
Historically, public housing has been located in the city of Des Moines. Section 8 vouchers
holders are also concentrated in Des Moines and areas just outside the city limits. While Section
8 trends may be a reflection of availability of affordable housing in the region, the growth of
suburbs in the recent decades demands a fresh investigation of the housing policies and an
increased regional approach to siting affordable housing.

The Greater Des Moines Metro Area Regional Analysis of Impediments to Fair Housing Choice
83
POTENTIAL SOLUTIONS
Promote regional approaches to affordable housing
Spread the location of affordable housing units throughout the region
Identify de-concentration opportunities
Increase availability of affordable rental units in the region
Leverage private dollars and work with not for profit, faith based organization and private
agencies to provide the required subsidies for rental housing
8.3 CHANGING DEMOGRAPHICS
The region has is experiencing a slow change in demographic makeup with a steadily increasing
minority and immigrant population. Currently, these populations groups are not adequately
represented through housing support or advocacy groups. This lack of representation makes it
difficult to capture specific challenges faced by the groups in accessing housing. There is a lack
of educational and financial counseling and resources for the increasing minority population.
Many first time immigrant homebuyers do not have sufficient credit history needed to qualify for
mortgages. There is also a gap between those that are interested in buying a home and those that
know how. Language poses as a significant barrier; there is a shortage of home buying
professionals, mortgage brokers and realtors that are bilingual/ bicultural.
Discomfort with cultural differences and attitudes of neighbors and realtors are some of the
emerging issues that must be addressed as the population continues to grow. At the same time,
there is lack of culturally sensitive and safe housing options for immigrant communities.
Landlords may not keep up with maintenance and many refugee, immigrant and minority
populations may not be aware of their options or available resources in these situations.
Des Moines is experiencing an increase in its Hispanic population. These households are
currently concentrated in poor neighborhoods and parts of Des Moines. This concentration of
ethnicity and poverty is set to increase in the coming years. Hispanic population faces language
and cultural barriers limiting equal access to opportunities.
POTENTIAL SOLUTIONS
Increase outreach within the minority and immigrant population groups
Partner with faith based organizations to reach these population groups
Provide educational resources of laws and rights, and available housing options
Increase community education clarifying myths around public and low income housing
Increase community exposure to various cultures, norms, differences and dissimilarities
among population groups
Support the creation of a regional minority and ethnic representative taskforce to provide
recommendations with housing related issues

The Greater Des Moines Metro Area Regional Analysis of Impediments to Fair Housing Choice
84
Partner with existing minority and ethnic groups and encourage links between housing
and existing services
Investigate options to assist foreign born population groups who may not be eligible for
federal assistance.
Provide certified and registered translation services to immigrant populations. Provide
language services within various city departments.
8.4 NEED FOR EDUCATION OF FAIR HOUSING LAWS, RIGHTS AND PROCESSES
Approximately 40 percent of survey respondents indicated lack of fair housing rights, laws and
processes as a barrier to fair housing. Lack of knowledge of how to file a complaints, receive
information and counseling comes across as a key challenge especially for low income
population groups, immigrants and people with limited English proficiency.
POTENTIAL SOLUTIONS
Increased outreach region-wide.
Identify and partner with grassroots, citizen groups, minority groups, faith based
organizations, merchant association, and minority and immigrant lending organizations.
Faith based organizations can play an important role in this effort.
Partner with Institutions and schools to increase outreach and seek volunteers to seek
most vulnerable population groups.
Increase resources for existing human rights commissions
8.5 INCREASED LANDLORD SCREENING REQUIREMENTS
Increased screening by landlords based on criminal background checks, credit history and
eviction history is a common reason to be excluded from housing options in the region,
irrespective of when the felony may have been committed. This becomes an issue in particular
for low-income individuals who may not have adequate credit histories and for intellectually, for
mentally disabled populations, and for people with minor felony charges such as loitering in
public places or public intoxication.
The Greater Des Moines Metro Area Regional Analysis of Impediments to Fair Housing Choice
85
POTENTIAL SOLUTIONS
Increased education of fair housing laws and rights for landlords, property owners and
developers
Increased educations of fair housing laws, rights and responsibilities for tenants
Work with landlords and property owners to create a tenant reentry program that allows
individuals and families avail housing if they meet certain criteria to establish credibility
as a tenant
Work with landlords and property managers/owners to look at tenants on a case by case
basis and be flexible with the tenant screening requirements
8.6 LACK OF ADEQUATE SUPPORTIVE SERVICES FOR HOMEOWNERS & PROPERTY OWNERS
Most rental assistance, public housing, and affordable homeownership programs require
complementary support services to assist residents when unexpected challenges occur that may
prevent them from making timely rent or mortgage payments or managing other demands related
to maintaining their housing. These programs may also target homeowners to ensure compliance
with code regulations. Certain population groups such as seniors, low income households,
refugees, individuals with criminal backgrounds, and individuals with intellectual, mental, or
physical disabilities may require more specialized case management services. The primary cause
cited for this gap is lack of resources.
Condition of Rental Units
Existing affordable rental housing is not always in a very good condition. Many low cost or
affordable rental units are in need of rehabilitation. Often these rental units may be in need of
competent property management.
Cost of Upgrading Existing Housing Stock
Increased code regulations like a 100% mandate for fire sprinklers, increased EPA regulatory
policies, and energy efficiency mandates have dramatic costs on all single family and multi-
family housing and are seen as deterrents by private developers. This works to eliminate or
reduce affordable housing especially in areas dominated by an aging housing stock.
POTENTIAL SOLUTIONS
Create partnerships with non-governmental service providers and private sector partners
Create or expand programs to provide supportive services to low income, senior, and
disabled home owners
The Greater Des Moines Metro Area Regional Analysis of Impediments to Fair Housing Choice
86
8.7 ZONING BARRIERS
Certain land use and development policies and zoning provisions may affect the range of housing
choice available in certain jurisdictions. This includes availability of allocated land in specific
zoning districts for multi-family and multi-structure units.
POTENTIAL SOLUTIONS
Implement inclusionary zoning for municipalities within the region or on a case by case
basis for new Planned Unit Development projects
Increase zoning areas that allow the development of multifamily developments
Create an affordable housing overlay to minimize barriers to affordable housing within
local zoning codes
8.8 HOMELESSNESS
Chronic homelessness and near homelessness remain a cause for concern in the Greater Des
Moines Metro Region. In their 2011 Homeless Count report, the Iowa Institute for Community
Alliances identified seven subpopulations of homeless individuals: chronically homeless,
severely mentally ill, people with chronic substance abuse issues, veterans, persons with
HIV/AIDS, victims of domestic violence, and unaccompanied youth (under 18). The largest
single population was people with chronic substance abuse issues with the severely mentally ill
and victims of domestic violence in a near tie for second. Slightly more than 75 percent of the
homeless adults identified in their report had no income, creating a significant barrier to attaining
housing in the near future.
The lack of adequate support services to help these groups find and maintain suitable housing in
a timely manner creates an additional barrier as these individuals and families seek housing. The
homeless sheltering system in the city plays a key role in providing housing options, but is more
of a temporary solution to the problem. The municipal jurisdictions in the region and Polk
County have established the Homeless Coordinating Council to look into various actions and
strategies to reduce homelessness and establish housing options for this population.
POTENTIAL SOLUTIONS
Add more emergency shelter beds in more locations across the region to the current
homeless sheltering system
Create additional transitional housing options for each homeless subgroup
Expand the mandate of the Homeless Coordinating Council to include coordination with
regional planning efforts
The Greater Des Moines Metro Area Regional Analysis of Impediments to Fair Housing Choice
87
8.9 THIS REPORT AND ON-GOING AND FUTURE PLANNING EFFORTS
This report identifies specific impediments to fair housing in the region and suggests action steps
to overcome these barriers. This analysis is expected to guide housing policy decisions in the
region and feed into the region’s ongoing planning efforts. Two such planning efforts are
scheduled in the immediate or near future: comprehensive plan updates in the City of Des
Moines and The Tomorrow Plan.
The City of Des Moines
The City of Des Moines anticipates updating its Comprehensive Plan and Zoning Code in the
next several years. The new Comprehensive Plan and Zoning Code should take into account the
findings of this report and its recommendations related to housing affordability, changing
demographics (incorporating sensitivity to cultural housing preferences), senior-friendly housing,
and zoning and subdivision regulations when developing land use/development policies as well
as specific regulations. The City of Des Moines should also consider these findings and
recommendations when developing future neighborhood revitalization plans.
The Tomorrow Plan
The Tomorrow Plan is a regional planning effort looking out to the year 2050 that incorporates
several elements of sustainability. Through the planning process, The Tomorrow Plan has taken
a regional look at future growth as it relates to transportation systems and needs, housing and
affordable housing, watershed management, economic development, and parks and conservation.
Through public input, secondary data analysis, and scenario modeling The Tomorrow Plan team
has offered many different visions of future land use trends and outcomes. These potential
visions have contributed to the planning process by showing how specific development patterns
can influence future land use. Currently The Tomorrow Plan team is in the process of
determining a preferred vision for the region’s future development and growth. During this
process The Tomorrow Plan will continue to work with regional stakeholders to come to the
preferred vision for regional development through technical and steering committee workgroups
and sessions. This vision will provide guiding principles for land use and development as well as
a regionally consolidated plan for future growth in the region. This growth will most likely
involve regional collaboration for services and planning, and will be guided by best practices in
sustainable development.
The Tomorrow Plan: Project Phasing
1. Project Initiation: In the initial phase of the project, the foundation for the entire
planning effort was determined.
2. Regional Assessment: Phase 2 included assemblage of existing plans and available data
to inform the planning process, as well as an assessment of where the central Iowa region
stands today and is likely headed in the future if current trends continue. This assessment
The Greater Des Moines Metro Area Regional Analysis of Impediments to Fair Housing Choice
88
was directed towards measuring regional sustainability using the Consortium’s
mandatory outcomes and project goals as a starting point, taking into account
sustainability principles and metrics that are emerging in national practice, and factoring
in the community engagement results to date
3. Regional Vision for Sustainability: In Phase 3, a vision for a sustainable future central
Iowa region – integrating housing, land use, economic and workforce development,
transportation, environmental, and infrastructure components – was developed based on
community input. Development of the vision was incorporated with the formulation and
testing of scenarios for future regional growth, including the projected trend and
alternatives for achieving the community’s vision. The end result will be a preferred
scenario for regional sustainable development that will provide the basis for the complete
regional plan for sustainable development and implementation program to be prepared in
Phases 4 and 5.
4. Regional Sustainability Framework: In Phase 4, specific plan components will be
developed with goals and strategies to achieve the vision and preferred future direction
for sustainability from Phase 3, as well as the Consortium’s mandatory outcomes for the
Project.
5. Sustainability Report & Implementation: In the final phase, the results of previous
phases of work will be compiled into a complete regional plan for sustainable
development. As part of this effort, the consultant team will develop an action plan, in
consultation with the Consortium, plan is the last in the sequence of the regional plan for
sustainable development components to be prepared, the previous phases of work are
designed to lay the groundwork for and to building capacity for successful
implementation (e.g., through ongoing stakeholder/partner involvement).
This phase will also include:
Recommendations for development of appropriate partnerships to support
ongoing regional integration and collaboration
Identification of all entities responsible for implementation
Identification and recommendations for potential funding strategies
Adoption of strategic implementation plan for projects, initiatives and
policies, including timeline
Development of 2050 Planning Document.
Phase 5 is anticipated to be completed in February 2013, after which adoption and
implementation of the plan will commence.
The Greater Des Moines Metro Area Regional Analysis of Impediments to Fair Housing Choice
89
8.10 CONCLUSION
The primary issue that has limited the housing choices for various population groups is
affordability, both in terms of the cost of housing and of the capacity for individual households
to pay market rate rents. NIMBYism is a commonplace reaction to efforts to build affordable
housing in the region. It surfaces at various places and times even as the region experiences an
increase in immigrant and minority population.
Other barriers include limited choices for affordable senior housing, for large families, and for
households needing handicap accessible units. The various jurisdictions within the region have
not engaged in shared analyses of housing problems or collaborative efforts to identify solutions
to housing problems. Future housing development patterns will depend on the level of regional
cooperation going forward.
Housing and fair housing issues do not have a central place in regional planning conversations.
The people interviewed and surveyed for this report belonged to housing agencies, financial
agencies, some support services, and providers. Citizen advocacy and representative groups
formed a very small proportion of the groups and individuals engaged in the study. This makes it
difficult to get accurate ‘public’ perspective of the target population and leaves a big gap in the
study.
A future study must build in adequate time and allot resources for a reliable public input session.
Vulnerable population groups must be targeted in the absence of any housing related citizens
groups. It is important to identify citizen groups, faith-based organizations and community
groups that work with target populations in various disciplines ranging from economic
development to community development. While it is challenging to compile a list of groups that
work with immigrant and minority groups, a regional focus typically requires a more engaged
and sustained involvement afforded by a longer project timeline.
The Greater Des Moines Metro Area Regional Analysis of Impediments to Fair Housing Choice
90
APPENDIX A: Survey Questionnaire
1. Please identify your department and company/organization
2. Please identify your jurisdiction/service area
3. What role does your group/organization play in provision of housing in the Des Moines –
West Des Moines metro area?
4. In your opinion, what are some of the barriers to affordable housing in your
jurisdiction/service area?
5. In your opinions, what are some of the barriers to home ownership in your
jurisdiction/service area?
6. The Department of Housing and Urban Development (HUD) and Department of Justice
(DOJ) are jointly responsible for enforcing the deferral Fair Housing Act which prohibits
discrimination in housing on the basis of race, color, religion, sex, national origin,
familial status and disability. Given this definition, what are some of the barriers to fair
housing in your jurisdiction/service area?
7. What services or programs address fair housing in your jurisdiction/service area?
8. What do you see as the most significant housing challenge facing your
jurisdictions/service area over the next 5 years?
9. Additional comments
The Greater Des Moines Metro Area Regional Analysis of Impediments to Fair Housing Choice
91
APPENDIX B: Housing-related services in the Greater Des Moines Metro Area
This list is not meant to be exhaustive but to provide examples of the work that public and
private agencies are currently doing to increase access to safe and affordable housing in the
Greater Des Moines Metro area.
AIDS Project of Central Iowa
http://www.aidsprojectci.org
The AIDS Project of Central Iowa provides rental assistance to low-income persons living with
HIV/AIDS at risk for homelessness.
Anawim Housing
http://anawimhousing.org
Anawim Housing owns or manages low-income and transitional units in the Greater Des Moines
Area.
Beacon of Life
http://beaconoflifedm.org
Beacon of Life offers transitional housing for homeless women.
Catholic Charities of the Diocese of Des Moines
http://www.dmdiocese.org/catholic-charities.cfm
The St. Joseph Emergency Family Shelter provides temporary homeless shelter. Catholic
Charities also provides refugee resettlement services, and a domestic violence shelter among
other services. The St Mary Family Center provides limited financial aid for rent, utilities and
occasionally other special needs.
Central Iowa Regional Housing Authority
http://www.cirhahome.org
The Central Iowa Regional Housing Authority administers Section 8 Housing Choice Vouchers
and provides public housing for the areas of the Metro area in Dallas and Madison Counties.
Central Iowa Shelter and Services
http://centraliowashelter.org
Central Iowa Shelter and Services provides emergency shelter services and other services to help
the homeless population of the Greater Des Moines area transition out of homelessness.
The Greater Des Moines Metro Area Regional Analysis of Impediments to Fair Housing Choice
92
City of Des Moines
www.dmv.org
The City of Des Moines provides essential services through two agencies (1) Des Moines
Municipal Housing Agency (DMMHA), which provides rental units for low-income qualified
families and administers Section 8 rental assistance in Polk County. DMMHA also provides
public housing, primarily for elderly residents. (2) Des Moines Community Action Agency
(DMCAA) assists low-income families with utility crisis assistance, heating and cooling and
other needs.
City of West Des Moines
http://www.wdm.iowa.gov
The City of West Des Moines offers transitional housing for homeless residents through the
West Des Moines Transitional Housing Program. For those at risk of becoming homeless, West
Des Moines’ Emergency Assistance program provides many services including partial payment
of rent and utilities along with negotiations with housing providers on behalf of tenants.
The City of West Des Moines also administrates metro wide services such as the Polk City
Home Improvement Program and the Metro Home Improvement Program (which serves
Ankeny, Altoona, Clive, Grimes, Johnston, Pleasant Hill, Urbandale, West Des Moines and
Windsor Height). These programs provide five-year forgivable loans for housing repairs and the
correction of code violations to low income households. The Owner-Occupied Rehabilitation
Program, also administered by West Des Moines and funded by The Dallas County Local
Housing Trust Fund, provides the same assistance to low-income homeowners within Dallas
County.
Community Housing Initiatives, Inc.
http://www.chihousing.com
Community Housing Initiatives is a statewide non-profit organization that constructs new or
rehabilitates existing units for low-income households. CHI also provides foreclosure prevention
among other services
Federal Home Loan Bank of Des Moines
http://www.fhlbdm.com
Ten percent of the Federal Home Loan Bank of Des Moines’ net earnings are set aside to fund
four housing grant programs.:(1) The Affordable Housing Program is a grant that supports
housing projects for low-income households (2) Native American Homeownership Initiative
provides grants for down payment, closing cost, counseling or rehabilitation assistance for low-
income members of Native American tribes. (3) Urban First Time Homebuyer Program: assists
first time homebuyers in urban areas with down payment and closing costs for the purchase of a
home. (4) Rural Homeownership Fund assists homebuyers in rural areas with down payment and
closing costs for the purchase of a home.
The Greater Des Moines Metro Area Regional Analysis of Impediments to Fair Housing Choice
93
Greater Des Moines Habitat for Humanity
http://www.gdmhabitat.org
The Greater Des Moines Habitat for humanity sells new and renovated homes at no interest to
qualified low-income families.
Hawthorn Hill
http://www.hawthorn-hill.org
Hawthorn Hill operates the New Directions Shelter that provides emergency shelter and services
for homeless mothers and their children. The Home Connection, another program, provides
transitional housing and supportive services to homeless families with children.
Hope Ministries
http://www.hopeiowa.org
Hope Ministries offers many services for low-income and homeless residents including: Bethel
Mission, an emergency shelter for homeless men, Door of Faith a long-term recovery center for
homeless and addicted men, and Hope Family Center a long term residential center for homeless
women and children.
Housing Opportunities Made Easy (HOME) Inc.
http://homeincdsm.org
In partnership with other agencies, HOME Inc. acts as a general contractor in building or
improving housing for low-income people in Polk County. HOME Inc. also provides loans and
rental assistance.
Iowa Legal Aid
http://www.iowalegalaid.org
Iowa Legal Aid provides free legal advice to low income Iowans. Specific housing related
services they offer include landlord issues, discrimination, and foreclosure prevention.
Neighborhood Finance Corporation
http://www.neighborhoodfinance.org
NFC provides unique lending programs and other services to facilitate neighborhood
revitalization in Polk County, Iowa through partnerships with residents, governments,
community based organizations and the business community. NFC offers purchase loans,
refinance loans, and home improvement loans as well as home buyer education and counseling.
They offer forgivable loans for home improvements with every mortgage loan. The subsidy
(forgivable loan) of up to $10,000 is used to help pay for property repairs and improvement.
Eligible home buyers also receive a subsidy (forgivable) up to $2,500 to assist with down
payment and/or closing costs on a purchase transaction.

The Greater Des Moines Metro Area Regional Analysis of Impediments to Fair Housing Choice
94
U.S. Committee for Refugees and Immigrants (USCRI)
http://www.refugees.org/about-us/where-we-work/uscri-des-moines
USCRI offers resettlement services for refugees and immigrants.
Young Women’s Christian Association (YWCA)
http://www.ywca.org/site/pp.asp?c=afLEJSOzHoE&b=1027605
The YWCA provides low cost transitional housing to women and children.
Youth Emergency Services & Shelter (YESS)
http://yessiowa.typepad.com
YESS provides emergency shelter and other services to youth up to age 17.
Several groups offer shelter and transitional housing services for victims of domestic violence in
the area.
Children and Families of Iowa
http://www.cfiowa.org
Iowa Coalition Against Domestic Violence
http://www.icadv.org
Iowa Coalition Against Sexual Assault
http://www.iowacasa.org
The Iowa Coalition against Sexual Assault has two culturally specific advocacy groups:
Latinas Unidas por un Nuevo Amanecer
http://www.lunaiowa.org
Monsoon United Asian Women of Iowa
http://www.muawi.org
A number of local churches also provide crisis rent and utility support including the following:
Christ the King Parish (Catholic)
http://www.christthekingparish.org
Cottage Grove Presbyterian Church
http://www.cgpresbyterian.org