The Great Recession and SNAP Caseloads: A Tale of Two States
30
The Great Recession and SNAP Caseloads: A Tale of Two States By Mark Edwards a Colleen Heflin b Peter Mueser b Suzanne Porter c Bruce Weber a a. Oregon State University, 319 Fairbanks Hall, Corvallis, OR 97331 b. University of Missouri, 900 University Ave, Columbia, Missouri 65211 c. Oregon Department of Human Services, Office of Forecasting, Research & Analysis, 500 Summer Street NE E-23, Salem, OR 97301 Working Paper Number RSP 1401 Rural Studies Program Oregon State University 213 Ballard Extension Hall Corvallis, OR 97331 (541) 737-1442 http://ruralstudies.oregonstate.edu
Transcript of The Great Recession and SNAP Caseloads: A Tale of Two States

The Great Recession and SNAP Caseloads:
A Tale of Two States
By
Mark Edwardsa
Colleen Heflinb
Peter Mueserb
Suzanne Porterc
Bruce Webera
a. Oregon State University, 319 Fairbanks Hall, Corvallis, OR 97331
b. University of Missouri, 900 University Ave, Columbia, Missouri 65211
c. Oregon Department of Human Services, Office of Forecasting, Research & Analysis,
500 Summer Street NE E-23, Salem, OR 97301
Working Paper Number
RSP 1401
Rural Studies Program
Oregon State University
213 Ballard Extension Hall
Corvallis, OR 97331
(541) 737-1442
http://ruralstudies.oregonstate.edu

Great Recession and SNAP Caseloads
1
Abstract
Using unique detailed administrative data for the 2003-2010 period, we contrast Florida’s and
Oregon’s dramatically different participation dynamics, assessing the expansion and extension of
benefits before, during, and after the Great Recession. While the recession led to increased need
and SNAP participation in both states, state differences in pre-recession program policies and
efforts to enroll and retain eligible participants provide a plausible explanation for lower exit
rates and longer spell durations in Oregon. Implications of these findings for low income
households, policymakers and future research are discussed.

Great Recession and SNAP Caseloads
2
INTRODUCTION
The Great Recession of 2008-2009 produced record numbers of poor Americans. Since then, the
economy has recovered slowly with persistently high levels of underemployment and long-term
unemployment. Yet, food insecurity, one of the most direct measures of material hardship, did
not rise in the years immediately after the Recession even though income-based measures of
economic well-being continued to deteriorate (Coleman-Jensen et al. 2012). Increases in the
take-up rates and the generosity of the Supplemental Nutrition Assistance Program (SNAP1)
have been given some credit for this buffering of American families from food insecurity during
and after the Recession (Nord and Prell 2011). Following an extraordinary spike with the onset
of the Great Recession, the SNAP caseload continued to grow even as the economy slowly
improved, reaching 22.3 million households in fiscal year 2012, up from 12.7 million households
in fiscal year 2008 (U.S. Department of Agriculture 2012).
While it is evident that SNAP caseloads have increased as a result of the Great Recession,
little is known about how dynamics of SNAP use have changed since then. Differences in those
dynamics across states provide an opportunity to examine the degree to which the SNAP
caseload is impacted by the economic needs state agencies and residents have faced and the ways
agencies have implemented this important safety net program. Florida and Oregon offer a useful
contrast in the SNAP-reliance of their populations, the administration of the program, and the
timing and depth of economic impact of the Recession. Using state administrative data from
Oregon and Florida over the 2003-2010 time period, we document each state’s pre-recession
situation, its reaction to the recession in terms of expansion of SNAP benefits (increasing the
flow of new participants into the program), and the extension of SNAP duration for participants

Great Recession and SNAP Caseloads
3
(reducing the outflow from the program). We conclude with a discussion of implications of our
findings for low-income families, policymakers, and researchers.
LITERATURE REVIEW
Changes in the SNAP caseload over the past 30 years have inspired a body of research that
examines the relative impacts of policy changes versus macro-economic conditions. A series of
studies at the end the 1990s sought to explain the substantial decline in caseloads over the 1980s
and 1990s (Currie & Grogger 2001; Figlio, Gundersen, & Ziliak 2000; Kabbani & Wilde 2003;
Kornfeld 2002; Wallace & Blank 1999; Ziliak, Gundersen & Figlio 2003.). Some researchers
found that macro-economic conditions accounted for more of the declining caseload than did
policy changes (Kabbani & Wilde 2003; Ziliak et.al. 2003), while others detected relatively
equal effects (Kornfeld 2002), and still others concluded that policy changes were more
influential than the improving economy of the 1990s (Currie & Grogger 2001).
Focusing on the dramatically increasing caseload of the 2000s, a new round of studies
looked at how variation in administrative processes in the program as well as macroeconomic
conditions affected the SNAP caseload. Ziliak (2013), Klerman & Danielson (2011) and Mabli
& Ferrerosa (2010) found greater effects of macro-economic conditions than effects from policy
innovations, but all three identified non-trivial effects of SNAP policy changes at both the
federal and state level. Those changes include use of categorical eligibility (where eligibility for
one need-based program qualifies clients for another), increases in the dollar value of vehicles
excluded from asset calculations, and adoption of electronic benefits transfer (EBT) cards to
replace paper coupons. Ratcliffe, McKernan & Finegold (2008) also identified significant effects
of policy innovations such as longer certification periods and more generous asset tests. Mabli,

Great Recession and SNAP Caseloads
4
Sama-Martin & Castner (2009) confirmed these findings and found that outreach spending had
only a small impact.
Johnson (2012) explored the entry and exit dynamics at the national level, concluding
that slower exit rates drove the rising SNAP caseloads during the economic recovery period of
2003-2007. However, during the Great Recession, while exit rates remained stable, entry rates
increased, in large part reflecting increases in the eligible population.2
It is clear from the previous literature that measures of need, including the economic
conditions and demographic characteristics of the population, and changes in policy altering the
ability of income-eligible populations to access the program have affected the size of SNAP
caseloads and the dynamics of participation. However, the most recent studies suggest that, while
SNAP has historically been a countercyclical program, participation patterns appear to have
changed since the 2001 recession, with SNAP caseloads rising even during times of declining
unemployment. We use state administrative data to describe two different patterns of SNAP
expansion and extension before, during and after the Great Recession, suggesting that poor
households’ experiences with this federal safety net program were impacted by states’
implementation decisions.
Economic and Program Influences on SNAP Use in Florida and Oregon
1. “Need”: State Populations and Economic Indicators
We begin by comparing the demographic and economic indicators of Florida and Oregon. Given
the short time horizon of this study, 2003-2010, the demographic characteristics of each state are
relatively stable, but they tell us something about the static nature of need, given that SNAP use
rates vary substantially based on gender, race, and age. Economic conditions, on the other hand,
are highly dynamic but also directly determine the size of the population eligible for SNAP.

Great Recession and SNAP Caseloads
5
-- Table 1 here --
Table 1 illustrates that there are several differences in the population characteristics that could
affect the demand for SNAP in the two states. Some demographic factors suggest a higher level
of demand in Florida. For example, Florida has much higher shares of Black and Hispanic
populations than Oregon. To the extent that Black and Hispanic populations tend to have lower
incomes, the different population compositions could increase the demand for SNAP. Also, the
share of adults with high school and college degrees is slightly lower in Florida than in Oregon,
which could lead to lower earnings and higher demand for SNAP.
In contrast, the age structure of the population in the two states may reduce demand for
SNAP in Florida. Florida has a smaller share of children and a larger share of retirees than
Oregon. Since children are more likely to be in poverty and those over age 65 are less likely to
be in poverty, the age composition of the population puts downward pressure on demand for
SNAP in Florida relative to Oregon and the nation.
Some other demographic factors have indeterminate effects on baseline demand for
SNAP. Florida has higher shares of foreign-born and non-English-speaking populations than the
US and much higher shares than Oregon. Having larger shares of the population not speaking
English may both decrease the use of SNAP if there are language barriers to enrollment, and
increase the need for SNAP to the extent that language barriers restrict access to well-paid jobs.
While static differences in state participation rates for SNAP are influenced by
demographic characteristics of states, changes in the SNAP caseload depend on business cycle
dynamics. The 2003-2010 period which we examine includes the expansion that followed the
2001 recession (2001-2007) and the Great Recession (2008-2009) as well as the start of a
subsequent recovery. Business cycles are experienced differently in different states. During the

Great Recession and SNAP Caseloads
6
recovery from the 2001 recession, Florida had lower unemployment rates than Oregon. Florida
entered the Great Recession sooner, recovered later, and had a larger increase in the
unemployment rate between 2006 and 2010 than did Oregon. Poverty rates for Oregon and
Florida were similar and fairly stable prior to the recession (around 12%) and rose quickly to
around 15% during the recession.
Considering demography alone, Florida has a more racially heterogeneous population
mix, more immigrants, and lower average levels of education relative to Oregon. Thus, one
would expect Florida to have a larger proportion of its population income-eligible for and
participating in SNAP. But in terms of the expectations of SNAP use and duration due to the
health of the macro-economy, the expectations are not so clear. While Oregon’s economy was
weaker at the beginning of our observation window, Florida’s subsequent economic conditions
suggest an even more severe and prolonged recession, hence likely increasing SNAP enrollment
and length of use.
2. Administrative Access and SNAP Policy in Florida and Oregon
While SNAP is a federal program, there is a great deal of difference at the state level in
terms of how the program is administered. For example, states have the option of requesting a
waiver for several federal regulations that can make it easier to apply and qualify for and retain
benefits. Additionally, the application process itself can be streamlined or arduous, depending in
part on the adoption of a modernized service delivery model or the availability of program staff
(Castner, O’Reilly, Conway, et. al 2012; Center for Budget and Policy Priorities 2011; Rowe,
Hall, O’Brien, et al.2010). Spurred on by the “internet revolution,” at least 34 states now offer
the option of applying for SNAP benefits online (Center for Budget and Policy Priorities 2011).
Driven variously by claims of enhanced efficiency, increased access, and cost savings (Castner et

Great Recession and SNAP Caseloads
7
al. 2012; Rowe et al. 2010), the application of “e-government” to the SNAP application process
is a unique process in each state that may include the use of call centers, electronic
documentation storage, the elimination of face-to-face eligibility interviews, and the elimination
of case-workers. Florida and Oregon have dramatically diverged in the motivation for and speed
with which they have embraced modernization as well as pursued other policy waivers.
The differences between states in terms of the administration of the program are striking.
Florida has been at the leading edge of the rapid transformation from a traditional
paper/caseworker/in-person interview model to a technology-mediated model. The re-design by
Florida’s Department of Children and Families (DCF) has been nationally recognized as an
exemplar of modernization, receiving innovation awards from the USDA and others. Its new
approach to administering SNAP was implemented in the 2004-2006 period, well before the
recessionary pressures compelled many other states to think about substantial changes to their
application system. While Florida served as a pioneer in terms of modernizing the application
and eligibility determination processes for public social programs, Heflin, London and Mueser
(2012) suggest that the system has had important weaknesses. While Florida eventually adopted
expanded “categorical eligibility” (which would increase SNAP enrollments by changing
resource and asset limits), the state also maintained a six month recertification period for the
majority of its caseload, making more participants vulnerable to being disqualified or
accidentally dropped due to bureaucratic errors by state agencies and client errors in providing
needed documentation. The state allows for revoking SNAP benefits as a TANF sanction for the
non-compliant (hence reducing SNAP participation) and it did not operate a formal outreach
program to increase participation.
In contrast to Florida, while Oregon was a slow adopter of SNAP application

Great Recession and SNAP Caseloads
8
modernization, it adopted other innovative approaches with a central aim of increasing SNAP
participation. Policy analysts, state agencies, and community partner organizations have closely
collaborated since the late 1990s to identify and remove barriers to participation (Edwards 2012),
leading to high participation rates acknowledged nationally by awards from the USDA. In
contrast to the six month recertification period in Florida, the standard certification period in
Oregon has remained at 12 months − a policy which would logically result in longer durations of
SNAP participation. Early on, between 2000 and 2002 Oregon expanded categorical eligibility to
all TANF-related cash programs. Oregon increased the income eligibility limit to 185 percent of
the federal poverty line, waived asset reporting for vehicles and bank accounts, implemented
simplified reporting, increased its outreach efforts, and established a ‘no wrong door’ policy − all
efforts aimed to expand the SNAP participation rate. In contrast to Florida, where staff positions
were reduced by 40 percent, Oregon TANF caseworkers were reassigned to SNAP in 2006,
increasing the number of SNAP authorized positions by 44 percent. In early 2009 the number of
Oregon’s authorized positions increased by another 15 percent. This growth supported a newly
implemented “same day/next day” interview policy, so that, whenever possible, client interviews
would be conducted no later than the day after the application was received (Oregon DHS policy
staff, personal communication, October 9, 2012).
Considering the impact of the structure of access, one might expect that states like
Florida with redesigned application and eligibility procedures would have increased access to
SNAP, compared to states using the traditional caseworker model. All else equal, the ability to
substitute time in a social service office with internet or telephone contact should reduce the
transaction costs of the application procedure and increase participation among eligible
populations. However, the unique collaborative nature in the Oregon experience, with a more

Great Recession and SNAP Caseloads
9
solicitous customer-friendly approach to application and recertification could lead to Oregon
having higher enrollment rates and longer periods on SNAP. More frequent recertification
deadlines in Florida (six month versus the twelve months in Oregon) suggest the duration of
program participation should be longer in Oregon than Florida.
DATA and METHODS
Monthly data on SNAP applicants and participants over the January 2003-March 2010 time
period come from administrative case records maintained by the Florida Department of Children
and Families (DCF) and the Oregon Department of Human Services (DHS) in computer readable
form. For Florida, the information in these records includes the monthly benefit amounts,
reported income amounts, as well as demographic and geographic characteristics of households.
Oregon’s data include demographic, geographic, and household composition, but not financial
information. Data on employment and earnings come from quarterly earnings records maintained
by Florida and Oregon, respectively, in support of their Unemployment Insurance systems. The
observation period captures the pre-Recession years running up to and through the Great
Recession.
State administrative data are ideal for these analyses and represent a substantial
advantage over the two other data sources typically used for analyses of SNAP caseloads −
Quality Control data (QC) and data from the Survey of Income and Program Participation
(SIPP). Both the QC data and the SIPP contain only a sample of respondents, and the sample for
a given state may be quite small and unrepresentative in the case of the SIPP. QC data provide a
cross-sectional window only and are therefore unable to answer questions about caseload
dynamics. Finally, SIPP has also been noted to have substantial problems with measurement
error in reporting of social safety net programs such as SNAP (Bollinger & David 2001). In

Great Recession and SNAP Caseloads
10
contrast, our analysis of administrative data from Florida and Oregon provides a unique
opportunity to observe how SNAP characteristics and dynamics have changed over the 2003-
2009 period for the entire population of SNAP clients in two states.
We describe changing characteristics of SNAP participants and the length of time they
used SNAP at different points prior to and during the Great Recession. Given that we have
access to the full population of SNAP participants for these two states over the time period, with
hundreds of thousands of cases in each state, we do not need to use inferential statistics based on
sampling theory. Every difference presented is statistically significant and descriptive results are
representative of the caseload dynamics. Our approach follows that of Ribar, Edelhoch, & Liu
(2008), using state-level administrative data linked to state employment data. They note that
using administrative data from a single state has a number of disadvantages: limited variation in
policies and economic conditions and inclusion in the dataset of only those people who have
participated in the program. These disadvantages are offset, of course, by advantages such as
having detailed information about participants, data not subject to recall and non-response bias, a
very large number of cases, and longitudinal data that follow individuals over a long period of
time providing information about the timing of transitions and program spell duration. To offset
the single-state disadvantage, we have used administrative data in two very different states, and
so are able to explore how variation in political and administrative cultures in the two states,
along with policy and economy influences, is related to the SNAP caseload.
We break down the observation period into four time periods to highlight different sets of
policy or economic conditions. The first period, from January 2003 to December 2004, serves as
our baseline period. The second period, from January 2005 to December 2006, is when Florida’s
new delivery model was phased in. The third period, from January 2007 to June 2008,

Great Recession and SNAP Caseloads
11
corresponds to the period when the economic conditions began to deteriorate. The final period
shown is from July 2008 to March 2009 and captures the height of the Great Recession and just
prior to implementing the increased SNAP benefits that were part of the American Recovery and
Reinvestment Act of 2009. For each time period, we show how average spell durations changed
for the overall caseload, and for particular demographic groups, specifically documenting the
median spell length and the percentage of total spells that were at least 12 months in duration.3,4
RESULTS
EXPANSION: SNAP CASELOADS OVER TIME AND AMONG GROUPS IN FLORIDA AND
OREGON
We begin by describing SNAP caseload growth for the two states. Figure 1 shows the growth in
the percentage of the population receiving SNAP in Florida and Oregon beginning in 2003. The
caseload in Florida grew somewhat faster in the first two years, was then essentially flat 2005-
2008, and then increased dramatically. In Oregon, growth was somewhat slower at first, then
remained steady 2004-2008, after which it increased in the face of the recession, much like
Florida.
-- Figure 1 here --
Economic differences between the states provide little by way of explanation for the
patterns of SNAP growth in the two states from 2003-2007, prior to the recession. For example,
unemployment declines were very similar in 2003-2005 in the two states, yet SNAP growth was
larger in Florida. Poverty rates in Oregon and Florida were about the same prior to the recession
(around 12%) and both rose quickly to near 15% during the recession, yet Oregon’s SNAP
participation, as a percentage of the population, remained consistently above Florida’s in every
year.

Great Recession and SNAP Caseloads
12
Expansion of SNAP to more people may come not just from the aggregate economic
need among residents, but from state-specific levels of access, whereby income-eligible
individuals may be more likely to apply for and receive SNAP benefits. In 2003, Oregon had 80
percent participation among the eligible population, and by 2007 it had achieved nearly full
participation among income-eligible residents. The Oregon figures far exceed the national
average, which increased from 56 percent in 2003 to 72 percent in 2009. Florida remained below
the national average through the period. However, the increase in the participation rate was
dramatic, with growth from 48 percent in 2003 to 69 percent, very close to the national average,
in 2009 (See Cunnyngham, et.al 2012; 2010; 2007).
-- Figure 2 here --
Our data permit us to describe the state-specific expansion of SNAP with the rate of new
entrants to SNAP relative to the state population at risk; that is, the ratio of entrants to those not
receiving SNAP. Figure 2 makes clear that Florida and Oregon had flows onto SNAP that were
quite similar until the recession hit, when Florida’s inflow accelerated faster than Oregon’s. As a
consequence, the expansion of SNAP caseloads in both states can be viewed as a result of the
growing population becoming income-eligible for SNAP benefits as the macroeconomy
worsened, while Florida’s more rapid acceleration is consistent with its rapidly growing
participation rate among income-eligible residents. Oregon’s participation rate was already high
leading into the recession, and so fewer non-participating income-eligible residents remained to
be enrolled. Hence, in both states expansion of benefits was evident through increasing numbers
of income-eligible people (due to the recession) and through differently timed successes at
enrolling eligible residents before and during the recession.

Great Recession and SNAP Caseloads
13
EXTENSION: SNAP SPELLS in FLORIDA AND OREGON
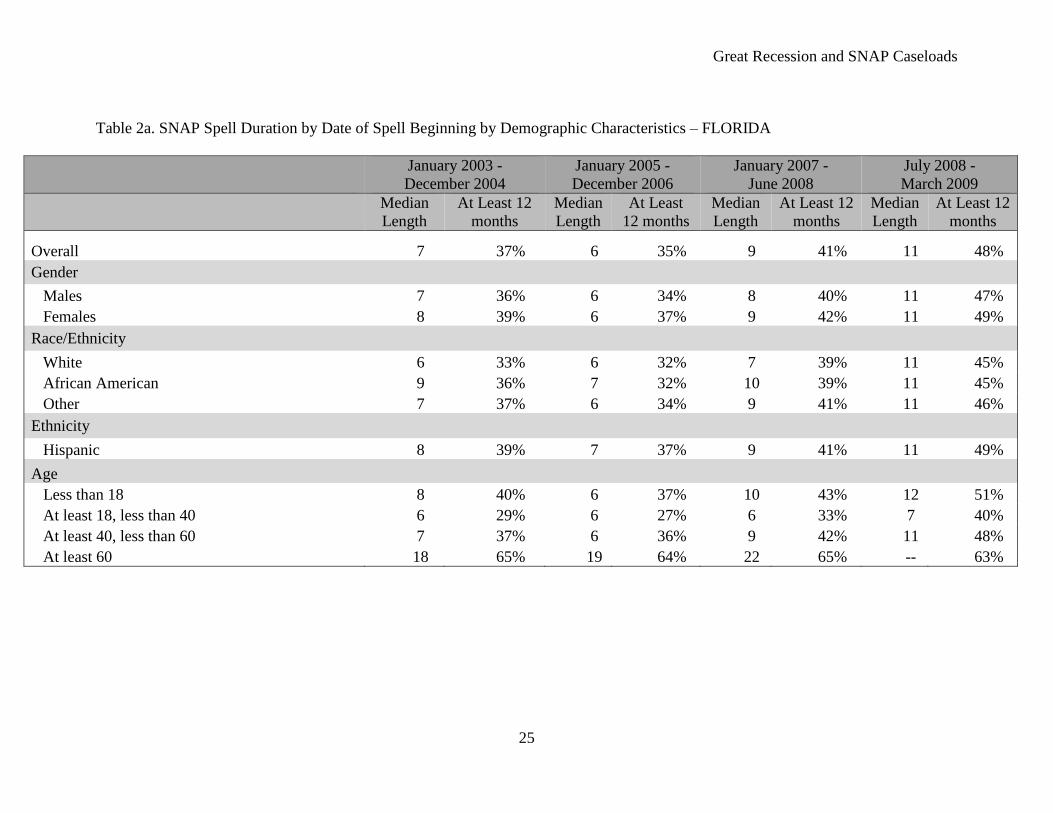
SNAP caseloads are not only a function of entries, but of exits and time until exit. Tables
2a and 2b present Florida and Oregon information on average spell length by demographic
characteristics for those beginning SNAP spells during the period of our study. Most notable is
the consistently longer spell length in Oregon. For SNAP spells starting in the first period (2003-
2004), the median length for Florida was 7 months, and 37 percent of spells were over 12
months, whereas the comparable figures for Oregon were 10 months and 46 percent. Although,
in the subsequent period, spell length declined in Florida, in both states the spell length increased
dramatically in the last two periods. In the most recent period, 48 percent of spells in Florida and
63 percent of spells in Oregon lasted more than 12 months.
- - Tables 2a and 2b here - -
Spell lengths for men versus women in Florida resembled one another throughout our
periods, while Oregon women had longer average times on SNAP than Oregon men even during
the Great Recession (Tables 2a and 2b). Until the height of the recession, African American
SNAP recipients in Florida showed longer spell lengths than white recipients, whereas the
convergence of spell lengths for these groups in Oregon occurred early in the study period.
Patterns for Hispanic recipients were not appreciably different from those of African American
recipients in each state until the height of the recession, when Oregon Hispanic recipients
experienced greater growth in spell length than the other racial groups – with spells lasting four
to five months longer. Finally, Oregon children receiving SNAP in each time period of our study
had spell lengths dramatically longer than those of Florida children, with median spells for
Oregon children increasing to nearly two years during the recession. Working age adults (18-39
and 40-59) and seniors showed less dramatic changes, although significant increases were

Great Recession and SNAP Caseloads
14
experienced by all three groups in both states, with the exception that there was little growth for
younger adults in Florida.
Although it is difficult to identify all the factors that explain the differences in spell
length, program design and administrative procedures can have a powerful influence on client
behavior (Broughton 2012). An important contributor may be differences in redetermination
periods and processes. Most SNAP cases in Oregon are certified for 12 months, while in Florida
most are certified for 6 months. In both states recertification closely parallels the initial
certification process, but in Oregon identification and citizenship requirements are not revisited
at recertification.
-- Figure 3 here --
The longer SNAP spells in Oregon are further illustrated by examining the outflow rates
of Oregon and Florida SNAP recipients (Figure 3). While the overall trend tracks with the
economy (declining outflows as the economy worsened), the dramatically different outflow rates
suggest that implementation decisions such as the 6-month recertification requirement in Florida
shorten average spells. In any given month, it appears that a Florida SNAP recipient had
approximately twice the likelihood of an Oregon SNAP recipient to be leaving the program,
regardless of the prevailing economic conditions of the country or of the state.
DISCUSSION
By the end of the Great Recession, Florida’s food insecurity rate had jumped from 11.8%
at the beginning of the decade to 16.1%, while Oregon’s rate remained at 13.7% (Nord,
Andrews, and Carlson 2003; Coleman-Jensen, Nord, Andrews and Carlson 2011). The “very low
food security” rate also increased by 3 percentage points in Florida while only increasing by 1
percentage point in Oregon over this same period. These state differences in material hardship

Great Recession and SNAP Caseloads
15
are all the more striking given Florida’s relatively low SNAP enrollment, short SNAP spells, and
higher outflow rates.
Our findings from an analysis of unique state administrative data for two states suggest
that how states choose to implement federal safety net programs matters. Population
characteristics and trends in economic indicators for the states do no align with the similarities,
differences, increases, and declines in SNAP entry rates, exit rates, and spell length, leaving
program implementation as the most likely reason for many of the observed differences. Low
income families in Oregon and Florida experienced a very different safety net prior to and during
the Great Recession. Hence, to the extent that SNAP provides relief from food insecurity, low
income families experienced the Great Recession’s painful effects quite differently depending on
where they lived, and not just because the recession had differential local impacts on the
economy. State-specific program implementation and administration, within the flexibility
provided by the federal program, made it more likely that Oregon residents who were income-
eligible would participate before the recession and would keep their benefits before and during
the recession. In contrast, Florida’s income-eligible residents were less likely to be enrolled prior
to the recession. During the recession they found greater success enrolling, but Floridians were
much more likely than Oregonians to lose benefits before, during, and immediately after the
recession. These benefit losses were not the result of better economic circumstances in Florida.
While it is well known that SNAP caseloads rose across the United States during the Recession,
the state-specific patterns and reasons for those patterns become clearer by examining the
administrative data as we have done. It is important to note that the type of analysis presented
here would not be possible using secondary data such as the American Community Survey or
Current Population Survey, where measurement error issues and the cross-sectional time frame

Great Recession and SNAP Caseloads
16
prevent the reliable analysis of SNAP caseload characteristics and dynamics. Thus, this in-depth
picture of SNAP receipt over the time period including the Great Recession is an important
substantive contribution.
Our project highlights how decisions made by state lawmakers and agencies directly
influence the lives of low income people in various states. While Florida implementation policies
make it harder for recipients to remain on SNAP, resulting in participation rates near the national
average, Oregon policies achieve nearly 100% participation among eligibles. These are not
economic forces at work, but are instead decisions by state actors who undoubtedly interpret the
goals and meaning of these programs very differently from party to party, state to state.
While this analysis is limited by its consideration of only two states, the narrow focus
allows for a deeper understanding and description of economic conditions, administrative
practices and the dynamics of program use, highlighting the differently available safety net for
low income households in different places. Scholars interested in understanding SNAP caseload
fluctuations would improve our understanding of state-level differences in program participation
by better attending to the cultural and political forces uniquely influencing different states. These
state-level differences are often just identified as a state “fixed effect” in quantitative studies
using all states. Those interested in bringing these influences directly into such models may
consider using measures of political party affiliation of the Governor, and both state legislative
bodies as well as indicators of citizen ideology and political ideology.
Finally, additional research is needed to identify which aspects of local culture are most
important to determining the acceptability of program participation and to describe the roles of
formal political actors as well as community-based advocacy groups in creating a context in

Great Recession and SNAP Caseloads
17
which program participation is viewed as a right and responsibility versus a sign of personal
weakness.

Great Recession and SNAP Caseloads
18
ENDNOTES
1. SNAP was previously called the Food Stamp Program. The name was changed in 2008. We
refer to the program as SNAP for the entire period.
2. Note that we have access to SNAP caseload data only and therefore do not estimate the SNAP
eligible population ourselves. We rely upon the work of others to estimate the size and coverage
of the eligible SNAP population. See Cunnyngham et al 2012 for example.
3. Spells of SNAP participation identify the period, measured in months, that a spell of SNAP
receipt lasts; that is, the number of months an individual receives SNAP continuously from the
month of first receipt to the last month of receipt. However, we made adjustments to remove
administrative “churn” by counting any month as a month of SNAP receipt if the individual
received SNAP in both the prior and succeeding months. Hence, in effect, the start of a SNAP
spell is defined as a month of SNAP receipt preceded by at least two months of nonreceipt, and
the end of a SNAP spell is a month of receipt followed by at least two months of nonreceipt.
4. Where no spells shorter than the median are censored, calculations of median length are
identical to Kaplan-Meier estimates. Where some spells are censored at lengths shorter than the
median, Kaplan-Meier methods provide an approach to calculating survival probabilities based
on partial information. In the case at hand, we have chosen not to use these methods because
censoring is directly associated with time of spell start, and, as a result, K-M estimates could
well exhibit bias.

Great Recession and SNAP Caseloads
19
REFERENCES
Bollinger, C. & David, M. (2001). Estimation with Response Error and Non-response: Food
Stamp Participation in the SIPP. Journal of Business and Economic Statistics, 19(2),
129-141.
Broughton, C. (2012). Bringing the Organization Back In: The Role of Bureaucratic Churning in
Early TANF Caseload Declines in Illinois. Journal of Sociology and Social Welfare,
37(3), 155-183.
Castner, L., O’Reilly, A., Conway, K., Bardos, M. & Sama-Miller, E. (2012). Performance
Measurement for Supplemental Nutrition Assistance Program Modernization Initiatives:
Integrated Report. U.S. Department of Agriculture, Food and Nutrition Service, Office of
Research and Analysis. Retrieved March 15, 2013
(http://www.fns.usda.gov/ora/MENU/Published/snap/FILES/ProgramOperations/SNAP
Modernization.pdf).
Center for Budget and Policy Priorities. 2011. “SNAP On-line: A review of state government
SNAP websites.” Retrieved February 15, 2013 (http://www.cbpp.org/files/
8-23-05fa.pdf).
Coleman-Jensen, A., Nord, M., Andrews, M., & Carlson, S. (2011). Household Food Security in
the United States in 2010. USDA Economic Research Service Report #125. Retrieved
January 23, 2014 (http://www.ers.usda.gov/media/121076/err125_2_.pdf).
Coleman-Jensen, A., Nord, M., Andrews, M., & Carlson, S. (2012). Household Food Security in
the United States in 2011. USDA Economic Research Service Report #141. Retrieved
January 23, 2014 (http://www.ers.usda.gov/publications/err-economic-research-
report/err141.aspx#.UuLwdFPTkUc).

Great Recession and SNAP Caseloads
20
Cunnyngham, K., Castner, L. & Sukasih, A.. (2012). Empirical Bayes Shrinkage Estimates of
State Supplemental Nutrition Assistance Program Participation Rates in 2007-2009 for
All Eligible People and the Working Poor. U.S. Department of Agriculture Food and
Nutrition Services. Retrieved March 15, 2013.
(http://www.fns.usda.gov/ora/MENU/Published/snap/FILES/Participation/
/Techpartrate2007-2009.pdf).
Cunnyngham, K., Castner, L. & Sukasih, A. (2010). Empirical Bayes Shrinkage Estimates of
State Supplemental Nutrition Assistance Program Participation Rates in 2005-2007 for
All Eligible People and the Working Poor. U.S. Department of Agriculture Food and
Nutrition Services. Retrieved March 15, 2013
(http://www.fns.usda.gov/ora/ MENU/Published/snap/FILES/Participation
/techpartrate2005-2007.pdf).
Cunnyngham, K., Castner, L. & Sukasih, A. (2007). Empirical Bayes Shrinkage Estimates of
State Supplemental Nutrition Assistance Program Participation Rates in 2002-2004 for
All Eligible People and the Working Poor. U.S. Department of Agriculture Food and
Nutrition Services. Retrieved March 15, 2013 (http://www.fns.usda.gov/ora/
MENU/Published/snap/FILES/Participation/ techpartrate2002-2004.pdf ).
Currie, J. & Grogger, J. (2001). Explaining Recent Declines in Food Stamp Program
Participation. Pp. 203-29 in Brookings-Wharton Papers on Urban Affairs, edited by
Gale, W.G. & Pack, J.R.. Washington, DC: Brookings Institution Press.
Edwards, M.E. ( 2012). The Rise of State Agency-Nonprofit Collaboration
Against Food Insecurity in Western States. Food, Culture and Society, 15(1), 93-112.

Great Recession and SNAP Caseloads
21
Figlio, D.N., Gundersen, C, & Ziliak, J.P. (2000). The Effects of the Macroeconomy and
Welfare Reform on Food Stamp Caseloads. American Journal of Agricultural
Economics, 82(3), 635-41.
Heflin, C., London, A. & Mueser, P. (2012). Clients’ Perspectives on a Technology-Based Food
Assistance Application System. American Review of Public Administration, doi:
10.1177/0275074012455454.
Kabbani, N. & Wilde, P. (2003). Short Recertification Periods in the U.S. Food Stamp Program.
Journal of Human Resources, 38(S), 1112-1138.
Klerman, J.A., & Danielson, C. (2011). Transformation of the Supplemental Nutrition
Assistance Program. Journal of Policy Analysis and Management, 30(4), 863-88.
Kornfeld, R. (2002). Explaining Recent Trends in Food Stamp Program Caseloads. Report
prepared by Abt Associates, Inc. for the U.S. Department of Agriculture, Economic
Research Service, E-FAN-02-008, March.
Mabli, J., Sama-Martin, E, & Castner, L. (2009). Effects of Economic Conditions and Program
Policy on State Food Stamp Program Caseloads, 2000 to 2006. Contractor and
Cooperator Report No. 56, Mathematica Policy Research. Retrieved March 15, 2013
(http://naldc.nal.usda.gov/download/35893/PDF).
Mabli, J., & Ferrerosa, C. (2010). Supplemental Nutrition Assistance Program Caseload Trends
and Changes in Measures of Unemployment, Labor Underutilization and Program Policy.
Washington, DC: Mathematica Policy Research. Retrieved March 15, 2013
(http://www.mathematica-mpr.com/publications /PDFs/ nutrition/ SNAP_caseloads.pdf).
Nord, M., Andrews, M, & Carlson, S. 2003. Household Food Security in the United States,
2002. USDA Economic Research Service Report #35. Retrieved January 23, 2014

Great Recession and SNAP Caseloads
22
(http://www.ers.usda.gov/publications/fanrr-food-assistance-nutrition-research-
program/fanrr35.aspx#.UuLxL1PTkUc).
Nord, M, & Prell, M. (2011). Food Security Improved Following the 2009 ARRA Increase in
SNAP Benefits, ERR-116, U.S. Department of Agriculture, Economic Research Service.
Retrieved March 15, 2013 (http://www.ers.usda.gov/media/127913/err116.pdf).
Ratcliffe, C., McKernan, S. & Finegold, K. (2008). Effects of Food Stamp and TANF Policies on
Food Stamp Receipt. Social Science Review, 82(2), 291-334.
Ribar, D.C., Edelhoch, M., & Liu, Q. (2008). Watching the Clocks: The Role of Food Stamp
Recertification and TANF Time Limits in Caseload Dynamics. Journal of Human
Resources, 43(1), 208–239.
Rowe, G., Hall, S., O’Brien, C., Pindus, N., & Koralek, R. (2010). Enhancing Supplemental
Nutrition Assistance Program (SNAP) Certification: SNAP Modernization Efforts:
Interim Report–Volume 1, Alexandria, VA: U.S. Department of Agriculture, Food and
Nutrition Service. Retrieved March 15, 2013 (http://www.fns.usda.gov/ora/MENU/
Published/ snap/FILES/ ProgramOperations/ EnhancedCertification_IntVol1.pdf).
United States Census Bureau. (2010). “State and County Quick Facts”. Retrieved March 15,
2013 (http://quickfacts.census.gov/qfd/index.html).
U.S. Department of Agriculture, Food and Nutrition Service, “Program Data: SNAP
Characteristics Reports, FY 2009 through September 2012,” Retrieved December 15,
2012 (http://www.fns.usda.gov/pd/snapmain.htm).
Wallace, G., & Blank, R.M. (1999). What Goes Up Must Come Down? Explaining Recent
Changes in Public Assistance Caseloads, Pp 49-90 in Economic Conditions and Welfare
Great Recession and SNAP Caseloads
23
Reform, edited by Danziger, S.H. Kalamazoo, MI: W.E. Upjohn Institute for
Employment Research.
Ziliak, J.P., Gundersen, C., & Figlio, D. (2003). Food Stamp Caseloads Over the Business
Cycle. Southern Economic Journal, 69(4), 903–919.
Ziliak, J.P. 2013. “Why Are So Many Americans on Food Stamps? The Role of the Economy,
Policy, and Demographics” Paper presented at the Annual Meetings of the Applied
Public Policy Analysis & Management, Washington, D.C., November 2013.

Great Recession and SNAP Caseloads
24
Table 1. State Demographic Characteristics
Florida Oregon United States
Race
White 78.5% 88.6% 78.1%
Black 16.5% 2.0% 13.1%
Other 5.0% 9.5% 8.7%
Ethnicity
Hispanic 22.9% 12.0% 16.7%
Language
English not spoken in home 26.6% 14.3% 20.1%
Education (age 25+)
High school or higher 85.3% 88.6% 85.0%
Bachelor's degree or higher 25.9% 28.6% 27.9%
Age Structure
Persons under 5 years 5.6% 6.1% 6.5%
Persons under 18 years 21.0% 22.3% 24.0%
Persons 65 years and over 17.6% 14.3% 13.0% Source: United States Census 2010
Great Recession and SNAP Caseloads
25
Table 2a. SNAP Spell Duration by Date of Spell Beginning by Demographic Characteristics – FLORIDA
January 2003 -
December 2004
January 2005 -
December 2006
January 2007 -
June 2008
July 2008 -
March 2009
Median
Length
At Least 12
months
Median
Length
At Least
12 months
Median
Length
At Least 12
months
Median
Length
At Least 12
months
Overall 7 37% 6 35% 9 41% 11 48%
Gender
Males 7 36% 6 34% 8 40% 11 47%
Females 8 39% 6 37% 9 42% 11 49%
Race/Ethnicity
White 6 33% 6 32% 7 39% 11 45%
African American 9 36% 7 32% 10 39% 11 45%
Other 7 37% 6 34% 9 41% 11 46%
Ethnicity
Hispanic 8 39% 7 37% 9 41% 11 49%
Age
Less than 18 8 40% 6 37% 10 43% 12 51%
At least 18, less than 40 6 29% 6 27% 6 33% 7 40%
At least 40, less than 60 7 37% 6 36% 9 42% 11 48%
At least 60 18 65% 19 64% 22 65% -- 63%

Great Recession and SNAP Caseloads
26
Table 2b: SNAP Spell Duration by Date of Spell Beginning by Demographic Characteristics - OREGON
January 2003 -
December 2004
January 2005 -
December 2006
January 2007 -
June 2008
July 2008 -
March 2009
Median
Length
At Least 12
months
Median
Length
At Least 12
months
Median
Length
At Least 12
months
Median
Length
At Least 12
months
Overall 10 46% 12 50% 12 54% 17 63%
Gender
Males 8 42% 11 47% 12 51% 15 61%
Females 11 50% 12 54% 12 57% 18 64%
Race/Ethnicity
White 9 45% 11 50% 12 54% 17 63%
African American 12 51% 12 53% 12 56% 18 64%
Other 11 47% 12 52% 12 55% 17 63%
Ethnicity
Hispanic 9 44% 11 48% 12 56% 22 67%
Age
Less than 18 12 51% 12 55% 14 59% 22 67%
At least 18, less than 40 7 38% 9 44% 11 47% 12 58%
At least 40, less than 60 10 46% 12 51% 12 55% 17 63%
At least 60 22 69% 23 71% 24 71% 25 75%

Figure 1. Monthly SNAP Caseloads/State Population
Source: Authors calculations of average monthly recipients based on data from Florida Department of Children and
Families and Oregon Department of Human Services

Great Recession and SNAP Caseloads
28
Figure 2. SNAP Inflows Relative to Population Not Receiving SNAP
Source: Authors’ calculations of average monthly recipients, based on data from Florida Department of Children
and Families and Oregon Department of Human Services

Great Recession and SNAP Caseloads
29
Figure 3. SNAP Outflows Relative to SNAP Population
Source: Authors’ calculations of SNAP recipient exits, based on data from Florida Department of Children
and Families and Oregon Department of Human Services