The Great Property Crime Drop: A regional analysis · The Great Property Crime Drop: A regional...
12
1 Issue paper no. 88 July 2013 Bureau Brief NSW Bureau of Crime Statistics and Research The Great Property Crime Drop: A regional analysis Don Weatherburn and Jessie Holmes Aim: To describe and discuss regional variation between parts of NSW in the rate at which theft and robbery offences have fallen. Method: Percentage changes in rates of offending in robbery and various categories of theft were calculated for the period 2000 to 2012. Changes in the extent to which rates of crime across areas have become more similar were quantified by comparing the standard deviation in crime rates across areas in 2000 to the standard deviation in crime rates in 2012. Product moment calculations were used to measure (a) the extent to which areas with high crime rates in 2000 also had high crime rates in 2012 and (b) the extent to which areas with the highest crime rates in 2000 had the largest falls in crime in 2012. Results: The fall in property crime and robbery across NSW between 2000 and 2012 has been very uneven; being much larger in Sydney and other urban areas than in rural areas. The fall in theft offence rates ranges from 62 per cent in the Sydney Statistical Division (SD) to 5.9 per cent in the Northern SD. Similarly, the fall in robbery rates ranges from 70.8 per cent in the Sydney SD to 21.9 per cent in the Northern SD. In some areas some offences actually increased. The Murray, Northern, Murrumbidgee, North Western, Hunter and Central West SDs, for example, all experienced an increase in steal from a retail store. Conclusion: State Plan performance measures for improvements in public safety should take into account regional changes in rates of offending as well as changes in the overall volume of offending. Keywords: NSW, property crime, robbery, theft, rates, rural, urban, metropolitan Introduction Between 2000 and 2012, New South Wales (NSW), along with most other Australian States and Territories, experienced a remarkable fall in theft and robbery 1 offences 2 . Figure 1 shows the annual rate of these two types of offence 3 for 2000 and 2012. Over this period the robbery rate fell 66.5 per cent while the theft 4 rate fell 54.8 per cent. Rates of these two categories of recorded crime in NSW are now the lowest they have been since 1995. Figure 1. NSW theft and robbery rates by year (2000 and 2012) 5,268.7 2,381.1 186.3 62.4 0 20 40 60 80 100 120 140 160 180 200 0 1000 2000 3000 4000 5000 6000 2000 2012 Robbery rate per 100,000 pop. Theft rate per 100,000 pop. Year Theft Robbery The fall in theft and robbery is not specific to any particular kind of theft or robbery offence. As can be seen from Table 1, there have been substantial reductions across the State in all the major categories of robbery and theft. Table 1. NSW theft and robbery rates and percentage decline, 2000 vs 2012 Offence NSW rate per 100,000 population % decline 2000 2012 Break and enter dwelling 1258.9 554.5 -56.0 Break and enter non-dwelling 777.4 222.5 -71.4 Motor vehicle theft 809.6 249.5 -69.2 Steal from motor vehicle 1407.7 644.6 -54.2 Steal from retail store 328 300 -8.5 Steal from dwelling 490.4 299.2 -39.0 Steal from person 196.8 110.8 -43.7 Total Theft* 5268.7 2381.1 -54.8 Robbery without a weapon 108.2 38.3 -64.6 Robbery with a firearm 11.1 4.8 -56.8 Robbery with a weapon not a firearm 67 19.2 -71.3 Total Robbery 186.3 62.4 -66.5 * includes break and enter dwelling and non-dwelling, motor vehicle theſt, and steal from motor vehicle/dwelling/person/retail store
-
Upload
phamkhuong -
Category
Documents
-
view
214 -
download
0
Transcript of The Great Property Crime Drop: A regional analysis · The Great Property Crime Drop: A regional...

1
Issue paper no. 88 July 2013
Bureau BriefNSW Bureau of CrimeStatistics and Research
The Great Property Crime Drop: A regional analysisDon Weatherburn and Jessie Holmes
Aim: To describe and discuss regional variation between parts of NSW in the rate at which theft and robbery offences have fallen.
Method: Percentage changes in rates of offending in robbery and various categories of theft were calculated for the period 2000 to 2012. Changes in the extent to which rates of crime across areas have become more similar were quantified by comparing the standard deviation in crime rates across areas in 2000 to the standard deviation in crime rates in 2012. Product moment calculations were used to measure (a) the extent to which areas with high crime rates in 2000 also had high crime rates in 2012 and (b) the extent to which areas with the highest crime rates in 2000 had the largest falls in crime in 2012.
Results: The fall in property crime and robbery across NSW between 2000 and 2012 has been very uneven; being much larger in Sydney and other urban areas than in rural areas. The fall in theft offence rates ranges from 62 per cent in the Sydney Statistical Division (SD) to 5.9 per cent in the Northern SD. Similarly, the fall in robbery rates ranges from 70.8 per cent in the Sydney SD to 21.9 per cent in the Northern SD. In some areas some offences actually increased. The Murray, Northern, Murrumbidgee, North Western, Hunter and Central West SDs, for example, all experienced an increase in steal from a retail store.
Conclusion: State Plan performance measures for improvements in public safety should take into account regional changes in rates of offending as well as changes in the overall volume of offending.
Keywords: NSW, property crime, robbery, theft, rates, rural, urban, metropolitan
IntroductionBetween 2000 and 2012, New South Wales (NSW), along with most other Australian States and Territories, experienced a remarkable fall in theft and robbery1 offences2. Figure 1 shows the annual rate of these two types of offence3 for 2000 and 2012. Over this period the robbery rate fell 66.5 per cent while the theft4 rate fell 54.8 per cent. Rates of these two categories of recorded crime in NSW are now the lowest they have been since 1995.
Figure 1. NSW theft and robbery rates by year (2000 and 2012)
5,268.7
2,381.1
186.3
62.4
0
20
40
60
80
100
120
140
160
180
200
0
1000
2000
3000
4000
5000
6000
2000 2012
Robb
ery
rate
per
100
,000
pop
.
Thef
t rat
e pe
r 100
,000
pop
.
Year
TheftRobbery
The fall in theft and robbery is not specific to any particular kind of theft or robbery offence. As can be seen from Table 1, there have been substantial reductions across the State in all the major categories of robbery and theft.
Table 1. NSW theft and robbery rates and percentage decline, 2000 vs 2012
Offence
NSW rate per 100,000 population %
decline2000 2012
Break and enter dwelling 1258.9 554.5 -56.0Break and enter non-dwelling 777.4 222.5 -71.4Motor vehicle theft 809.6 249.5 -69.2Steal from motor vehicle 1407.7 644.6 -54.2Steal from retail store 328 300 -8.5Steal from dwelling 490.4 299.2 -39.0Steal from person 196.8 110.8 -43.7Total Theft* 5268.7 2381.1 -54.8Robbery without a weapon 108.2 38.3 -64.6Robbery with a firearm 11.1 4.8 -56.8Robbery with a weapon not a firearm
67 19.2 -71.3
Total Robbery 186.3 62.4 -66.5* includes break and enter dwelling and non-dwelling, motor vehicle theft, and steal from
motor vehicle/dwelling/person/retail store

2
While the overall decline in theft and robbery over the long term is welcome news, not all communities throughout NSW have benefited equally from the fall in these crimes. The variation in crime trends across the State is quite substantial. In some areas, rates of theft have actually increased. The purpose of this brief is to describe and discuss the variation in long-term trends across different regions of NSW.
We begin by examining changes in the rate of theft and robbery offences between 2000 and 2012 across NSW Statistical Divisions (SDs) and Metropolitan Statistical Sub-Divisions (SSDs). We then examine trends in robbery and different types of theft offences within SDs and SSDs. Finally, data are presented comparing each SD and SSD with the State as a whole for rates of robbery5 and each theft offence. Appendix 1 provides maps of the NSW SDs and Metropolitan SSDs. Appendix 2 provides a list of the Local Government Areas (LGAs) contained within each SD and SSD.
For reasons of space, the analysis below is conducted in terms of NSW SDs and Metropolitan SSDs rather than in terms of LGAs. It is recognised, however, that many readers may be interested in long-term trends in these crimes within their LGA. The electronic data file associated with this publication (available from BOCSAR’s website here) provides the rate of each theft and robbery offence in 2000 and in 2012 and the percentage decline (or increase) for each LGA. Rates for LGAs with less than 20 incidents for each offence in either 2000 or 2012 have been suppressed.
Before we begin, it is useful to introduce two statistical terms which are used in this brief to help describe the trends in crime. The first term is the ‘standard deviation’. The standard deviation of a set of measurements is the average variation around the mean of the measurements. To say that crime rates across areas have a low standard deviation is to say those crime rates are clustered together or fairly similar. Equally, to say that the standard deviation in crime rates across areas has fallen over time is to say that the crime rates across those areas have become more similar to one another.
The second term is the ‘correlation coefficient’. This is a measure of the extent to which two sets of measurements tend to be associated with one another (e.g. measurements of height and weight). Correlation coefficients (or correlations) vary between +1.0 and -1.0. A correlation of +1.0 means that higher values on one measure are perfectly associated with higher values on the other measure. A correlation of -1.0 means that higher values on one measure are perfectly associated with lower values on the other measure. A correlation coefficient of zero means that there is no relationship between two measures.
Correlations6 are used in what follows for two purposes. The first is to determine whether areas which had a high crime rate in 2000 also had a high crime rate in 2012. The second is to determine whether the largest falls in crime occurred in the areas which, in 2000, had the highest crime rates.
The change in theft and robbery by SDFigure 2 shows the overall decline in theft rates across NSW SDs. It is obvious that all the SDs shown in Figure 2 experienced a decrease in theft rates between 2000 and 2012. There is, however, considerable variation in the size of the fall. The falls range from 62.0 per cent in the Sydney SD down to 5.9 per cent in the Northern SD. There has also been a reduction in the variation in theft rates across areas. The standard deviation in theft rates across SDs fell by 38.8 per cent between 2000 and 2012.
The correlation across SDs in the rate of theft in 2000 and the rate of theft in 2012 is +0.37, indicating that there is a slight tendency for areas that were high in theft in 2000 to be high in theft in 2012. The correlation between the theft rate in 2000 and the size of the change in theft rates between 2000 and 2012 is -0.59, indicating that there is a modest tendency for areas with the higher rates of crime in 2000 to experience larger falls in theft between 2000 and 2012.
Figure 3 shows the decline in robbery rates across the same time period for NSW SDs. Note that this figure does not include results for the Far West SD because incidents of robbery were too rare in that region to measure change in any meaningful way.
There are two noteworthy features of Figure 3. The first is the much higher robbery rate and much larger fall in the robbery rate in the Sydney SD compared with all other SDs. The second is that, while most SDs experienced a fall in robbery rates, two
Figure 2. Theft rate by Statistical Division and year (2000 and 2012)
Rate
per
100
,000
pop
.
0
1000
2000
3000
4000
5000
6000
7000
2000 2012Year
SydneyIllawarraHunterRichmond-Tweed
South EasternNorth WesternCentral WestMid-North CoastFar WestMurrayMurrumbidgeeNorthern
Figure 3. Robbery rate by Statistical Division and year (2000 and 2012)
Rate
per
100
,000
pop
.
Year
0
50
100
150
200
250
300
2000 2012
SydneyNorth WesternSouth EasternIllawarraMurrumbidgeeCentral WestRichmond-TweedHunterNorthernMid-North CoastMurray
Far West not shown as there were less than 20 incidents in 2000 and 2012
3
did not. They were the Murray SD, where robbery rates rose by 21.0 per cent, and the Mid-North Coast SD, where robbery rates rose by 9.8 per cent. As with theft, the decline in robbery rates (amongst those SDs which experienced a decline) is quite variable: ranging from a drop of 70.8 per cent in the Sydney SD to a drop of 21.9 per cent in the Northern SD.
Although the fall in robbery has been uneven, the SDs were much more closely clustered in their robbery rates in 2012 than they were in 2000. The standard deviation in robbery rates fell by 72.2 per cent between 2000 and 2012. The correlation across areas between the robbery rate in 2000 and the robbery rate in 2012 (+0.78) was much stronger than the corresponding correlation for theft; indicating that areas with high rates of robbery in 2000 tended to have relatively high rates of robbery in 2012.
The correlation between the rate of robbery in 2000 and the size of the decline in robbery rates between 2000 and 2012 was -0.53, suggesting that the size of the fall in robbery rates was modestly related to the magnitude of the robbery rate in a SD in 2000.
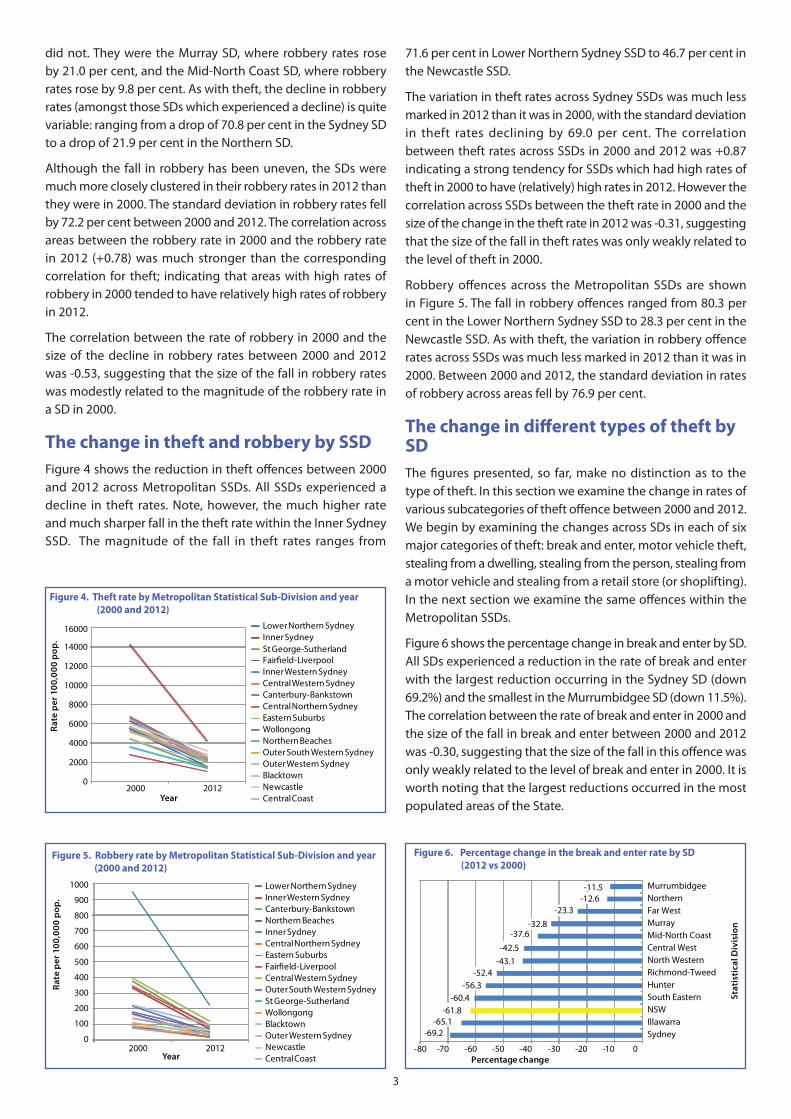
The change in theft and robbery by SSDFigure 4 shows the reduction in theft offences between 2000 and 2012 across Metropolitan SSDs. All SSDs experienced a decline in theft rates. Note, however, the much higher rate and much sharper fall in the theft rate within the Inner Sydney SSD. The magnitude of the fall in theft rates ranges from
71.6 per cent in Lower Northern Sydney SSD to 46.7 per cent in the Newcastle SSD.
The variation in theft rates across Sydney SSDs was much less marked in 2012 than it was in 2000, with the standard deviation in theft rates declining by 69.0 per cent. The correlation between theft rates across SSDs in 2000 and 2012 was +0.87 indicating a strong tendency for SSDs which had high rates of theft in 2000 to have (relatively) high rates in 2012. However the correlation across SSDs between the theft rate in 2000 and the size of the change in the theft rate in 2012 was -0.31, suggesting that the size of the fall in theft rates was only weakly related to the level of theft in 2000.
Robbery offences across the Metropolitan SSDs are shown in Figure 5. The fall in robbery offences ranged from 80.3 per cent in the Lower Northern Sydney SSD to 28.3 per cent in the Newcastle SSD. As with theft, the variation in robbery offence rates across SSDs was much less marked in 2012 than it was in 2000. Between 2000 and 2012, the standard deviation in rates of robbery across areas fell by 76.9 per cent.
The change in different types of theft by SDThe figures presented, so far, make no distinction as to the type of theft. In this section we examine the change in rates of various subcategories of theft offence between 2000 and 2012. We begin by examining the changes across SDs in each of six major categories of theft: break and enter, motor vehicle theft, stealing from a dwelling, stealing from the person, stealing from a motor vehicle and stealing from a retail store (or shoplifting). In the next section we examine the same offences within the Metropolitan SSDs.
Figure 6 shows the percentage change in break and enter by SD. All SDs experienced a reduction in the rate of break and enter with the largest reduction occurring in the Sydney SD (down 69.2%) and the smallest in the Murrumbidgee SD (down 11.5%). The correlation between the rate of break and enter in 2000 and the size of the fall in break and enter between 2000 and 2012 was -0.30, suggesting that the size of the fall in this offence was only weakly related to the level of break and enter in 2000. It is worth noting that the largest reductions occurred in the most populated areas of the State.
Figure 4. Theft rate by Metropolitan Statistical Sub-Division and year (2000 and 2012)
Rate
per
100
,000
pop
.
0
2000
4000
6000
8000
10000
12000
14000
16000
2000 2012Year
Lower Northern SydneyInner SydneySt George-SutherlandFair�eld-LiverpoolInner Western SydneyCentral Western SydneyCanterbury-BankstownCentral Northern SydneyEastern SuburbsWollongongNorthern BeachesOuter South Western SydneyOuter Western SydneyBlacktownNewcastleCentral Coast
Figure 5. Robbery rate by Metropolitan Statistical Sub-Division and year (2000 and 2012)
Rate
per
100
,000
pop
.
Year
0
100
200
300
400
500
600
700
800
900
1000
2000 2012
Lower Northern SydneyInner Western SydneyCanterbury-BankstownNorthern BeachesInner SydneyCentral Northern SydneyEastern SuburbsFair�eld-LiverpoolCentral Western SydneyOuter South Western SydneySt George-SutherlandWollongongBlacktownOuter Western SydneyNewcastleCentral Coast
Figure 6. Percentage change in the break and enter rate by SD (2012 vs 2000)
Stat
isti
cal D
ivis
ion
Percentage change
MurrumbidgeeNorthernFar WestMurrayMid-North CoastCentral WestNorth WesternRichmond-TweedHunterSouth EasternNSWIllawarraSydney
-80 -70 -60 -50 -40 -30 -20 -10 0
-69.2
-11.5-12.6
-23.3-32.8
-37.6-42.5
-43.1
-56.3-60.4
-61.8-65.1
-52.4

4
Figure 7. Percentage change in the motor vehicle theft rate by SD (2012 vs 2000)
Stat
isti
cal D
ivis
ion
Percentage change-100 -80 -60 -40 -20 0 20 40
NorthernFar WestMurrayMid-North CoastMurrumbidgeeCentral WestSouth EasternNorth WesternRichmond-TweedHunterNSWSydneyIllawarra
15.8-12.7
-21.0-33.3-34.4
-38.1-44.9-45.5
-46.8-53.4
-69.2-74.8
-76.8
Figure 8. Percentage change in the steal from dwelling rate by SD (2012 vs 2000)
Stat
isti
cal D
ivis
ion
Percentage change
-55.6-46.2-45.5
-43.3-41.9
-39.0-38.2
-34.3-31.0
-28.7-23.8
-14.2-13.5
-60 -50 -40 -30 -20 -10 0
Far WestRichmond-TweedSouth EasternIllawarraSydney NSWHunterCentral WestMurrayMid-North Coast
North WesternNorthernMurrumbidgee
Figure 9. Percentage change in the steal from person rate by SD (2012 vs 2000)
Stat
isti
cal D
ivis
ion
Percentage change-60 -50 -40 -30 -20 -10 0 10 20 30 Far West not shown as there
were less than 20 incidents in 2000 and 2012
-28.0
23.123.2
0.82.5
14.3
-3.3
-43.7-40.8
-48.5-49.1
-45.6
Richmond-TweedMurrumbidgeeHunterMurrayMid-North CoastCentral WestNorthernSouth EasternNSWIllawarraSydneyNorth Western
Figure 10. Percentage change in the steal from motor vehicle rate by SD (2012 vs 2000)
Stat
isti
cal D
ivis
ion
Percentage change-70 -60 -50 -40 -30 -20 -10 0 10
MurrumbidgeeNorthernMurrayFar WestSouth EasternCentral WestMid-North CoastNorth WesternHunterRichmond-TweedIllawarraNSWSydney
5.91.3
-3.4-13.2
-15.6-20.9
-21.2-30.1
-32.1-39.1
-48.6-54.2
-63.7
Figure 11. Percentage change in the steal from retail store rate by SD (2012 vs 2000)
Stat
isti
cal D
ivis
ion
Percentage change-30 -20 -10 0 10 20 30
MurrayNorthernMurrumbidgeeNorth WesternHunterCentral WestSouth EasternIllawarraNSWSydney Richmond-TweedMid-North CoastFar West
23.019.6
15.17.7
3.82.6
-4.4-5.7
-8.5-11.9
-16.5-24.0
-26.5
Figure 7 shows the percentage change in motor vehicle theft by SD. All SDs experienced a reduction in the rate of this offence with the exception of one. The Northern SD experienced a 15.8 per cent increase from 2000 to 2012. The largest reduction occurred in the Illawarra (down 76.8%), which was closely followed by the drop in Sydney (down 74.8%). In contrast to break and enter, the correlation between the rate of motor vehicle theft in 2000 and the size of the fall in this offence between 2000 and 2012 was strongly related to the level of motor vehicle theft in 2000 (-0.79).
Figure 8 shows the percentage change in rates of stealing from dwellings by SD. All SDs experienced a reduction in the rate of this offence. The largest reduction occurred in the Far West (down 55.6%) and the smallest in the Murrumbidgee SD (down 13.5%). As with break and enter, the correlation between the rate of stealing from dwellings in 2000 and the size of the fall in this offence between 2000 and 2012 was comparatively small (-0.36), indicating that the size of the fall in stealing from dwellings in an area was only weakly related to the level of stealing from dwellings in that area in 2000.
There were mixed results for steal from person rates. Figure 9 shows the percentage change in this offence by SD. Six SDs experienced a reduction in steal from person rates. The North Western SD had the largest drop (down 49.1%), while the Central West SD had the smallest drop (down 3.3%). Five SDs, however, experienced increased rates for this offence. Richmond-Tweed had the largest increase (up 23.2%), while the Mid-North Coast had the smallest increase (up 0.8%). The correlation between the steal from person rates in 2000 and
the size of the fall in this offence between 2000 and 2012 was reasonably strong (-0.61).
Figure 10 shows the percentage change in stealing from motor vehicles by SD between 2000 and 2012. All SDs except two experienced a reduction in the rate of this offence. The offence increased slightly (up 5.9%) in the Murrumbidgee SD and in the Northern SD (up 1.3%). The largest reduction occurred in Sydney (down 63.7%). The next largest drop occurred in Illawarra (down 48.6%). The rate of stealing from motor vehicles in 2000 and the size of the fall in this offence between 2000 and 2012 were strongly correlated (-0.79).
There were mixed results for shoplifting rates across NSW. As can be seen from Figure 11, six SDs experienced a reduction in shoplifting rates. The Far West had the largest drop (down

5
26.5%) and the South Eastern SD the smallest drop (down 4.4%). However, six SDs experienced increased shoplifting rates. These six were: Murray (up 23.0%), Northern (up 19.6%), Murrumbidgee (up 15.1%), North Western (up 7.7%), Hunter (up 3.8%) and the Central West (up 2.6%). The correlation between shoplifting rates in 2000 and the size of the fall in this offence between 2000 and 2012 was -0.15, suggesting that the size of the fall in this offence was only very weakly related to the level of shoplifting in 2000.
The change in different types of theft by metropolitan SSDFigures 12 to 17 show the percentage change in specific theft offences for NSW Metropolitan SSDs between 2000 and 2012.
These figures show that, for four of the six theft offences, every metropolitan SSD experienced a rate reduction of at least 25.9 per cent. In some cases the reductions were more substantial than this. In the area with the smallest reduction in break and enter (Blacktown) the rate of break and enter fell by 56.1 per cent. In the area with the smallest reduction in motor vehicle theft (Newcastle), the rate of motor vehicle theft fell by 55.7 per cent. The largest reduction in any specific theft category occurred in Lower Northern Sydney, where the rate of motor vehicle theft fell by 84.0 per cent.
In a small number of areas, however, two of the six theft offences increased (for steal from person and shoplifting).
Figure 13. Percentage change in the motor vehicle theft rate by Metropolitan SSD (2012 vs 2000)
-90 -80 -70 -60 -50 -40 -30 -20 -10 0Percentage change
Met
ropo
litan
Sta
tist
ical
Sub
-Div
isio
nNewcastleCentral CoastCanterbury-BankstownNSWOuter Western SydneyBlacktownEastern SuburbsOuter South Western SydneyInner Western SydneySt George-SutherlandCentral Western SydneyFair�eld-LiverpoolNorthern BeachesCentral Northern SydneyWollongongInner SydneyLower Northern Sydney
-55.7-57.0
-68.2-69.2
-70.9-73.2-73.6-75.1
-75.9-76.6-76.8-77.8-78.0
-79.1-81.1-81.6
-84.0
Figure 17. Percentage change in the steal from retail store rate by Metropolitan SSD (2012 vs 2000)
Met
ropo
litan
Sta
tist
ical
Sub
-Div
isio
n
Percentage change-50 -40 -30 -20 -10 0 10 20 30 40
Central Northern SydneyEastern SuburbsNewcastle Outer South Western SydneyCentral CoastInner Western SydneyNSWInner SydneyLower Northern SydneyBlacktownWollongongFair�eld-LiverpoolCanterbury-BankstownSt George-SutherlandNorthern BeachesOuter Western SydneyCentral Western Sydney
34.824.6
4.54.4
0.5-1.4
-8.5-9.9
-14.2-14.8
-15.6-17.1
-17.8-19.4-19.9
-30.1-42.3
Figure 14. Percentage change in the steal from dwelling rate by Metropolitan SSD (2012 vs 2000)
Met
ropo
litan
Sta
tist
ical
Sub
-Div
isio
n
-60 -50 -40 -30 -20 -10 0Percentage change
Central Western SydneyCanterbury-BankstownOuter Western SydneyBlacktownNSWInner SydneyInner Western SydneyEastern SuburbsNewcastle Fair�eld-LiverpoolLower Northern SydneyOuter South Western SydneyWollongongSt George-SutherlandCentral CoastNorthern BeachesCentral Northern Sydney
-25.9-27.5
-35.5-37.6
-39.0-39.4
-40.6-41.6-41.8-41.9
-45.0-46.7-46.8-48.0
-49.1-49.6
-56.7
Figure 15. Percentage change in the steal from person rate by Metropolitan SSD (2012 vs 2000)
Met
ropo
litan
Sta
tist
ical
Sub
-Div
isio
n
Percentage change-100 -80 -60 -40 -20 0 20
Newcastle Central CoastBlacktownOuter Western SydneyCentral Northern SydneyNSWWollongongOuter South Western SydneySt George-SutherlandInner SydneyEastern SuburbsNorthern BeachesCentral Western SydneyLower Northern SydneyFair�eld-LiverpoolInner Western SydneyCanterbury-Bankstown
15.2
-15.3-32.5
-40.5-43.7-45.0-45.0
-47.3-50.0-50.7-52.7-52.7
-60.9-62.2-65.2
-76.4
2.2
Figure 16. Percentage change in the steal from motor vehicle rate by Metropolitan SSD (2012 vs 2000)
Met
ropo
litan
Sta
tist
ical
Sub
-Div
isio
n
Percentage change-90 -80 -70 -60 -50 -40 -30 -20 -10 0
Newcastle Outer South Western SydneyCentral CoastBlacktownOuter Western SydneyNSWWollongongFair�eld-LiverpoolCanterbury-BankstownCentral Western SydneyNorthern BeachesCentral Northern SydneySt George-SutherlandInner Western SydneyEastern SuburbsLower Northern SydneyInner Sydney
-35.4-37.2
-39.0-46.0-47.9
-54.2-54.9
-56.8-58.7
-60.6-62.2
-63.6-64.0
-65.2-67.8
-76.7-82.2-77.6
-77.1-74.1
-72.0
-70.6-68.9-68.7-68.5-67.5-67.4
-63.1-61.8-61.8-59.5-58.8
-56.1
-90 -80 -70 -60 -50 -40 -30 -20 -10 0Inner SydneyLower Northern SydneySt George-Sutherland-Canterbury-Bankstown-Eastern SuburbsFair�eld-LiverpoolCentral Western SydneyCentral Northern SydneyWollongongNorthern BeachesInner Western SydneyCentral CoastNSWOuter South Western SydneyOuter Western SydneyNewcastleBlacktown
Percentage change
Met
ropo
litan
Sta
tist
ical
Sub
-Div
isio
n
Figure 12. Percentage change in the break and enter rate by Metropolitan SSD (2012 vs 2000)
-71.4

6
In Newcastle SSD, for example, the rate of steal from person increased by 15.2 per cent. In Central Northern Sydney and the Eastern Suburbs, the rate of shoplifting increased by 34.8 per cent in the former case and 24.6 per cent in the latter.
Comparisons with the NSW rateThe fact that there has been a large fall in theft and robbery in an area does not mean that theft and robbery in that area has ceased to be a problem. It is of interest, therefore, to see how rates of theft and robbery in different areas have moved relative to the State rate. The easiest way to do this is to take each offence and each area, calculate the ratio of the rate of that offence in that area to the corresponding NSW rate in 2000, and then compare the result to the same ratio for 20127. The percentage difference between these two ratios tells us whether the rate of that offence for that area has moved closer to the State rate or further away from it. An example might help to clarify the approach.
Table 2. Percentage change between the ratio of rates for robbery and theft offences for each SD and SSD compared to NSW, 2000 vs 2012
Region type RegionBreak and
enter
Motor vehicle
theftSteal from dwelling
Steal from person
Steal from motor vehicle
Steal from retail store Robbery
NSW Statistical Divisions (SDs)
Central West 50.6 100.7 7.7 71.8 72.8 12.2 76.1
Far West 101.1 183.2 -27.3 80.8 89.6 -19.7 290.8
Hunter 14.4 51.2 1.2 102.9 48.3 13.5 119.1
Illawarra -8.6 -24.8 -7.0 -3.5 12.3 3.1 20.9
Mid-North Coast 63.6 116.5 16.9 79.0 72.1 -16.9 227.8
Murray 76.1 156.5 13.0 82.0 110.9 34.5 261.2
Murrumbidgee 131.9 112.7 41.8 118.6 131.3 25.8 43.7
North Western 49.2 76.8 24.9 -9.7 52.7 17.7 -8.9
Northern 128.9 275.8 40.6 27.9 121.2 30.7 133.0
Richmond-Tweed 24.8 72.6 -11.8 118.8 33.1 -8.7 221.0
South Eastern 3.8 78.8 -10.7 5.1 84.4 4.5 -34.2
Sydney -19.2 -18.3 -4.8 -8.5 -20.7 -3.7 -12.9
Metropolitan Statistical Sub-Divisions (SSDs)
Blacktown 14.9 -12.9 2.3 50.4 18.0 -6.9 33.4
Canterbury-Bankstown -26.6 3.3 18.8 -58.1 -9.7 -10.1 -32.0
Central Coast -3.4 39.6 -16.6 81.5 33.1 9.8 54.9
Central Northern Sydney -18.0 -32.3 -29.1 5.7 -20.4 47.4 -28.0
Central Western Sydney -18.4 -24.6 21.4 -16.0 -13.9 -36.9 -9.5
Eastern Suburbs -25.2 -14.5 -4.3 -12.5 -29.7 36.2 -25.6
Fairfield-Liverpool -23.0 -27.8 -4.8 -32.9 -5.6 -9.4 -16.8
Inner Sydney -41.4 -40.4 -0.7 -11.2 -61.1 -1.5 -28.9
Inner Western Sydney -14.6 -21.9 -2.6 -38.1 -24.0 7.8 -35.7
Lower Northern Sydney -39.9 -48.1 -9.9 -30.5 -49.1 -6.2 -41.2
Newcastle 7.9 43.7 -4.7 104.7 41.1 14.2 114.2
Northern Beaches -14.9 -28.5 -17.5 -15.9 -17.4 -12.4 -31.2
Outer South Western Sydney 0.0 -19.1 -12.7 -2.3 37.2 14.2 5.3
Outer Western Sydney 6.1 -5.7 5.7 19.9 13.8 -23.5 40.3
St George-Sutherland -32.0 -24.0 -14.8 -6.4 -21.4 -11.9 11.2
Wollongong -17.4 -38.6 -12.9 -2.3 -1.6 -7.7 11.2
In 2000, the rate of motor vehicle theft in the Central West was 338.2 per 100,000 population. The state rate for this offence in that year was 809.6 per 100,000. The ratio of the rates was (338.2/809.6 =) 0.42. In other words, in 2000, the rate of motor vehicle theft in the Central West SD was a little under half the state rate. Equivalent calculations show that the ratio of the rate of motor vehicle theft in the Central West SD to the NSW rate in 2012 was (209.2/249.5=) 0.84. So the rate of motor vehicle theft in the Central West has moved from a little under half the State rate to over 80 per cent of the State rate (i.e. it has moved closer). Relative to the NSW rate, the rate of motor vehicle theft in the Central West SD has increased by 100.7 per cent.
Table 2 shows these calculations for robbery and theft offences in each of the NSW SDs and each of the Metropolitan SSDs. To make the table easier to interpret, areas where the rate of a particular offence has improved relative to the State rate are highlighted in yellow. Areas where the rate of a particular offence has deteriorated relative to the State rate are highlighted in red. In the Central West SD, for example, the rate

7
of break and enter has deteriorated by 50.6 per cent relative to the State rate. In the St George-Sutherland SSD, on the other hand, the rate of break and enter has improved by 32.0 per cent relative to the State rate. Inspection of the distribution of red and yellow shading in Table 2 indicates that in most parts of Sydney and Illawarra theft and robbery offences have improved relative to the State rate, whereas most areas of regional NSW have deteriorated relative to the State rate.
DiscussionThe fall in theft and robbery in NSW (and other Australian States and Territories) over the last 13 years has been remarkable. The NSW theft rate in 2012 was less than half what it was in 2000. The robbery rate in 2012 was less than a third of what it was in 2000. Sydney and other urban areas, however, have benefited much more from this fall in crime than rural NSW. In some rural areas, rates of theft have actually increased. These findings raise two questions: 1) What caused the fall in property crime and robbery? and 2) why has the fall been more pronounced in urban NSW areas than in regional ones?
In the two decades prior to the heroin shortage, theft and robbery rates in Australia were rising rapidly (Mukherjee & Dagger 1990; Australian Bureau of Statistics 2001). The dramatic fall in theft and robbery offences from 2000 onwards was both unprecedented and unexpected. It is true that the United States and Britain experienced falls in crime around this time but the crime drop in these countries began some years earlier than in Australia and affected a much wider range of offences (US Department of Justice 2013; UK Office for National Statistics 2013). If the fall in theft and robbery offences in Australia was caused by factors within Australia, it is important to know what they were. If they can be manipulated or controlled in any way, they may provide valuable insights into the effectiveness of existing or future policies in controlling crime.
As it happens, very little research has been conducted into why theft and robbery rates have fallen in Australia. Only two studies have been conducted to date. The first, by Moffatt et al. (2005), focussed on the influence of the Australian heroin shortage on burglary and robbery in NSW. The second, by Wan et al. (2012), focussed on the effect of the NSW criminal justice system on property and violent crime, but included a measure of the influence of the heroin shortage. Some background information is necessary in order to understand the significance of the heroin shortage.
Past research has shown that dependent drug users, especially dependent heroin users, frequently commit theft and robbery offences in order to fund their drug purchases (Dobinson & Ward 1985; Hogg 1987; Stevenson & Forsythe 1998; Chilvers & Weatherburn 2003). The rise in theft and robbery rates in Australia during the 1980s and 90s coincided with falling heroin prices, increasing heroin purity and a rapid growth in heroin use (Degenhardt & Day 2004). Around Christmas 2000, the price of heroin rose by 75 per cent and the purity fell from around 70 per cent to around 30 per cent. From this point on, both heroin use and crimes known to be commonly committed by heroin
users (viz. burglary and robbery) began to fall (Degenhardt & Day 2004).
Moffatt et al. (2005) recognised that heroin shortage could have affected levels of burglary and robbery but pointed out that other factors correlated with the shortage, such as increased use of imprisonment, reduced levels of unemployment or growing consumer confidence, might also have played a role. They noted that these factors continued to change in a favourable direction (along with crime) long after the primary indicator of heroin use (e.g. heroin overdoses) had stabilised (at a lower level). To test the hypothesis that the heroin shortage contributed to the fall in burglary and robbery they examined the influence of heroin use on burglary and robbery between January 1998 to December 2003, while controlling for changes in long-term unemployment, consumer confidence (a proxy for average weekly earnings) and the aggregate prison time being served by offenders.
The results revealed a strong association between crime trends and heroin use (as measured by the number of heroin overdoses) even after adjusting for the effects of long-term unemployment, consumer confidence and the aggregate prison time being served by offenders. These other factors, however, also had a significant effect on crime trends (although aggregate prison time affected burglary, not robbery). That study also found that rates of entry into drug treatment were significantly correlated with falling crime rates, even after adjusting for all the factors mentioned above. The research by Moffatt et al (2005), then, suggested that the drop in property crime was attributable to falling drug use, an improving economy, a tougher criminal justice system and greater access to drug treatment.
In 2012, Wan et al. (2012) published a more comprehensive study of trends in property and violent crime across 153 NSW LGAs between 1996 and 2008. Their study, like that conducted by Moffatt et al. (2005), included measures of the economy (average weekly income) and heroin use (heroin overdoses). It also included measures of the likelihood of arrest, the likelihood of imprisonment given arrest and the average prison term if sentenced to prison. As with Moffatt et al. (2005), their measure of heroin use remained strongly associated with the fall in crime even after adjusting for the effects of changes in income, the risk of arrest, the risk of imprisonment and the length of the average prison term. All these other factors except the last, however, were also significantly associated with the fall in property crime.
The research by Moffatt et al. (2005) and Wan et al. (2012) has yielded some important insights into the fall in theft and robbery in NSW but much work remains to be done before our understanding of the fall in NSW or, indeed, across Australia, is complete. No-one has yet examined the contribution of changes in the number of people in the peak offender-prone age bracket (16-24 years), changes in vehicle and household security, changes in the market for stolen goods (Fitzgerald & Poynton 2011) or changes in police tactics and resources, although any or all of these factors might have influenced
8
crime. Nor has anyone tested the possible effect of changes in abortion laws or falling lead levels, both of which have been cited as possible causes of the long-term fall in crime in the United States and both of which have been the focus (in that country) of considerable research (Levitt 2004; Nevin 2007).
This makes it difficult to answer the question of why the fall in theft and robbery in NSW was much more pronounced in urban than in rural areas. The correlations reported earlier show that the size of the fall in crime in a given area was (for most offences) not strongly related to the rate of that crime in that area in 2000. This rules out any explanation based on regression to the mean8. It would be interesting to know whether the regional pattern in the size of the crime drop observed in NSW is mirrored in other States and Territories. Unfortunately, the Australian Bureau of Statistics does not publish any regional breakdown of national crime data. It is therefore impossible to determine whether the regional pattern observed in NSW is due to a State-specific set of factors, factors impacting the country as a whole or some combination of the two.
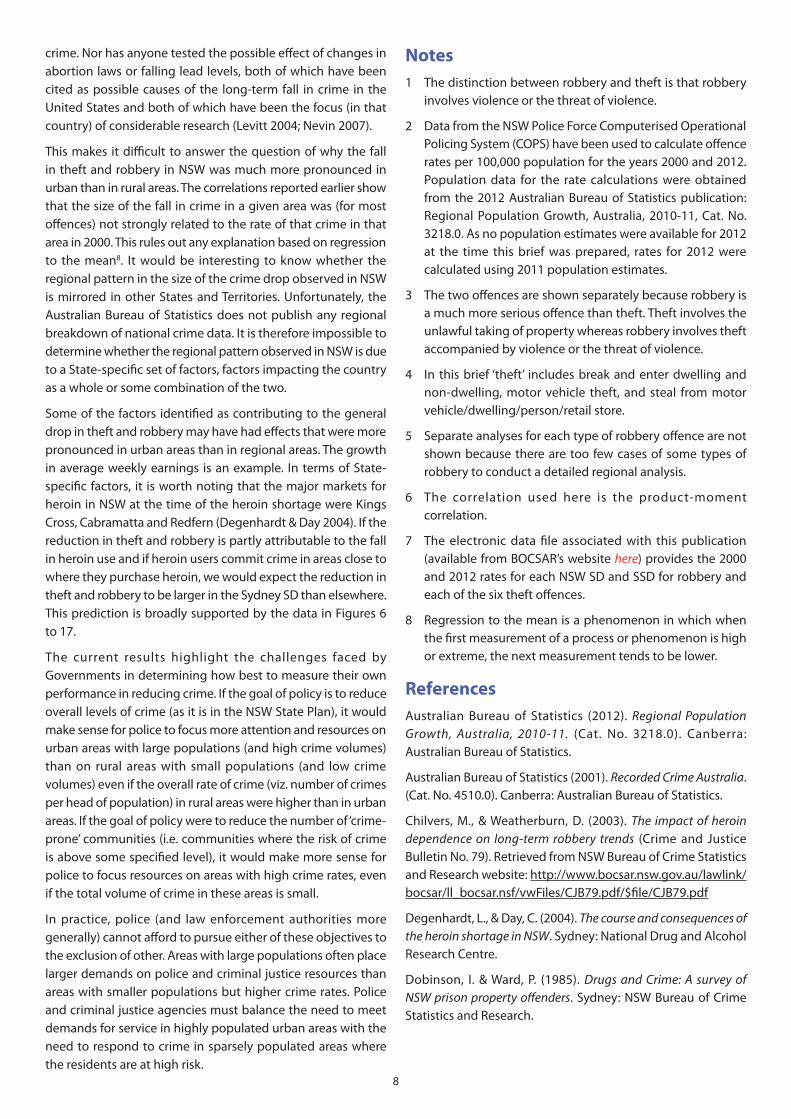
Some of the factors identified as contributing to the general drop in theft and robbery may have had effects that were more pronounced in urban areas than in regional areas. The growth in average weekly earnings is an example. In terms of State-specific factors, it is worth noting that the major markets for heroin in NSW at the time of the heroin shortage were Kings Cross, Cabramatta and Redfern (Degenhardt & Day 2004). If the reduction in theft and robbery is partly attributable to the fall in heroin use and if heroin users commit crime in areas close to where they purchase heroin, we would expect the reduction in theft and robbery to be larger in the Sydney SD than elsewhere. This prediction is broadly supported by the data in Figures 6 to 17.
The current results highlight the challenges faced by Governments in determining how best to measure their own performance in reducing crime. If the goal of policy is to reduce overall levels of crime (as it is in the NSW State Plan), it would make sense for police to focus more attention and resources on urban areas with large populations (and high crime volumes) than on rural areas with small populations (and low crime volumes) even if the overall rate of crime (viz. number of crimes per head of population) in rural areas were higher than in urban areas. If the goal of policy were to reduce the number of ‘crime-prone’ communities (i.e. communities where the risk of crime is above some specified level), it would make more sense for police to focus resources on areas with high crime rates, even if the total volume of crime in these areas is small.
In practice, police (and law enforcement authorities more generally) cannot afford to pursue either of these objectives to the exclusion of other. Areas with large populations often place larger demands on police and criminal justice resources than areas with smaller populations but higher crime rates. Police and criminal justice agencies must balance the need to meet demands for service in highly populated urban areas with the need to respond to crime in sparsely populated areas where the residents are at high risk.
Notes1 The distinction between robbery and theft is that robbery
involves violence or the threat of violence.
2 Data from the NSW Police Force Computerised Operational Policing System (COPS) have been used to calculate offence rates per 100,000 population for the years 2000 and 2012. Population data for the rate calculations were obtained from the 2012 Australian Bureau of Statistics publication: Regional Population Growth, Australia, 2010-11, Cat. No. 3218.0. As no population estimates were available for 2012 at the time this brief was prepared, rates for 2012 were calculated using 2011 population estimates.
3 The two offences are shown separately because robbery is a much more serious offence than theft. Theft involves the unlawful taking of property whereas robbery involves theft accompanied by violence or the threat of violence.
4 In this brief ‘theft’ includes break and enter dwelling and non-dwelling, motor vehicle theft, and steal from motor vehicle/dwelling/person/retail store.
5 Separate analyses for each type of robbery offence are not shown because there are too few cases of some types of robbery to conduct a detailed regional analysis.
6 The correlation used here is the product-moment correlation.
7 The electronic data file associated with this publication (available from BOCSAR’s website here) provides the 2000 and 2012 rates for each NSW SD and SSD for robbery and each of the six theft offences.
8 Regression to the mean is a phenomenon in which when the first measurement of a process or phenomenon is high or extreme, the next measurement tends to be lower.
ReferencesAustralian Bureau of Statistics (2012). Regional Population Growth, Australia, 2010-11. (Cat. No. 3218.0). Canberra: Australian Bureau of Statistics.
Australian Bureau of Statistics (2001). Recorded Crime Australia. (Cat. No. 4510.0). Canberra: Australian Bureau of Statistics.
Chilvers, M., & Weatherburn, D. (2003). The impact of heroin dependence on long-term robbery trends (Crime and Justice Bulletin No. 79). Retrieved from NSW Bureau of Crime Statistics and Research website: http://www.bocsar.nsw.gov.au/lawlink/bocsar/ll_bocsar.nsf/vwFiles/CJB79.pdf/$file/CJB79.pdf
Degenhardt, L., & Day, C. (2004). The course and consequences of the heroin shortage in NSW. Sydney: National Drug and Alcohol Research Centre.
Dobinson, I. & Ward, P. (1985). Drugs and Crime: A survey of NSW prison property offenders. Sydney: NSW Bureau of Crime Statistics and Research.

9
Fitzgerald, J., & Poynton, S. (2011). The changing nature of objects stolen in household burglaries (Bureau Brief No. 62). Retrieved from NSW Bureau of Crime Statistics and Research website: http://www.bocsar.nsw.gov.au/lawlink/bocsar/ll_bocsar.nsf/vwFiles/bb62.pdf/$file/bb62.pdf
Hogg, R. (1987). Robbery. Sydney: NSW Bureau of Crime Statistics and Research.
Levitt, S. (2004). Understanding why crime fell in the 1990s: Four factors that explain the decline and six that do not. Journal of Economic Perspectives, 18(1), 163-190.
Moffatt, S., Weatherburn, D., & Donnelly, N. (2005). What caused the recent drop in property crime? (Crime and Justice Bulletin No. 85). Retrieved from NSW Bureau of Crime Statistics and Research website: http://www.bocsar.nsw.gov.au/lawlink/bocsar/ll_bocsar.nsf/vwFiles/cjb85.pdf/$file/cjb85.pdf
Mukherjee, S.K., & Dagger, D. (1990). The Size of the Crime Problem in Australia. Canberra: Australian Institute of Criminology.
Nevin, R. (2007). Understanding international crime trends: The legacy of preschool lead exposure. Environmental Research, 104, 315-336.
Stevenson, R. J., & Forsythe, L. M. V. (1998). The Stolen Goods Market in New South Wales: An interview study with imprisoned burglars (Report No. 44). Retrieved from NSW Bureau of Crime Statistics and Research website: http://www.bocsar.nsw.gov.au/lawlink/bocsar/ll_bocsar.nsf/vwFiles/r44.pdf/$file/r44.pdf
UK Office for National Statistics (2013). Crime in England and Wales: Year Ending December 2012. Retrieved from the Office for National Statistics website: http://www.ons.gov.uk/ons/dcp171778_307458.pdf
US Department of Justice (2013). Crime in the United States 2011. Retrieved from the Federal Bureau of Investigations website: http://www.fbi.gov/about-us/cjis/ucr/crime-in-the-u.s/2011/crime-in-the-u.s.-2011
Wan, W., Moffatt, S., Jones, C., & Weatherburn, D. (2012). The effect of arrest and imprisonment on crime (Crime and Justice Bulletin No. 158). Retrieved from NSW Bureau of Crime Statistics and Research website: http://www.bocsar.nsw.gov.au/lawlink/bocsar/ll_bocsar.nsf/vwFiles/CJB158.pdf/$file/CJB158.pdf

10
APPENDIX 1. MAPS
Map 1. New South Wales Statistical Division boundaries
Map 2. Sydney Statistical Subdivision boundaries

11
APPENDIX 2. LGAs IN METROPOLITAN STATISTICAL SUBDIVISIONS
Metropolitan Statistical Subdivisions
Inner Sydney Inner Western Sydney Central Northern Sydney
Botany Bay Ashfield Hornsby
Leichhardt Burwood Ku-ring-gai
Marrickville Canada Bay The Hills Shire
Sydney Strathfield
Eastern Suburbs Central Western Sydney Northern Beaches
Randwick Auburn Manly
Waverley Holroyd Pittwater
Woollahra Parramatta Warringah
St George – Sutherland Outer Western Sydney Central Coast
Hurstville Blue Mountains Gosford
Kogarah Hawkesbury Wyong
Rockdale Penrith
Sutherland Shire
Canterbury – Bankstown Blacktown Newcastle
Bankstown Blacktown Cessnock
Canterbury Lake Macquarie
Maitland
Fairfield – Liverpool Newcastle
Fairfield Lower Northern Sydney Port Stephens
Liverpool Hunters Hill
Lane Cove
Outer South Western Sydney Mosman Wollongong
Camden North Sydney Kiama
Campbelltown Ryde Wollongong
Wollondilly Willoughby Shellharbour

12
NSW Bureau of Crime Statistics and Research - Level 8, St James Centre, 111 Elizabeth Street, Sydney 2000 [email protected] • www.bocsar.nsw.gov.au • Ph: (02) 9231 9190 • Fax: (02) 9231 9187 • ISBN 978-1-921824-68-5
© State of New South Wales through the Department of Attorney General and Justice 2013. You may copy, distribute, display, download and otherwise freely deal with this work for any purpose, provided that you attribute the Department of Attorney General and Justice as the owner. However, you must obtain permission
if you wish to (a) charge others for access to the work (other than at cost), (b) include the work in advertising or a product for sale, or (c) modify the work.
APPENDIX 2. LGAs IN NSW REGIONAL STATISTICAL DIVISIONS
NSW regional Statistical Divisions
Hunter Illawarra Richmond – Tweed Mid-North Coast
Cessnock Kiama Ballina BellingenDungog Shellharbour Byron Clarence ValleyGloucester Shoalhaven Kyogle Coffs HarbourGreat Lakes Wingecarribee Lismore Greater TareeLake Macquarie Wollongong Richmond Valley Port Macquarie–HastingsMaitland Tweed KempseyMuswellbrook Lord Howe Island Newcastle NambuccaPort StephensSingletonUpper Hunter Shire
Northern North Western Central West South Eastern
Armidale Dumaresq Bogan Bathurst Regional Bega ValleyGlen Innes Severn Bourke Bland BombalaGunnedah Brewarrina Blayney BoorowaGuyra Cobar Cabonne Cooma–MonaroGwydir Coonamble Cowra EurobodallaInverell Dubbo Forbes Goulburn MulwareeLiverpool Plains Gilgandra Lachlan HardenMoree Plains Mid-Western Regional Lithgow PalerangNarrabri Narromine Oberon QueanbeyanTamworth Regional Walgett Orange Snowy RiverTenterfield Warren Parkes Upper Lachlan ShireUralla Warrumbungle Shire Weddin Yass ValleyWalcha Wellington Young
Murrumbidgee Murray Far West Carrathool Albury Broken HillCoolamon Balranald Central DarlingCootamundra Berrigan Unincorporated Far WestGriffith Conargo Gundagai Corowa ShireHay DeniliquinJunee Greater Hume ShireLeeton JerilderieLockhart MurrayMurrumbidgee TumbarumbaNarrandera UranaTemora WakoolTumut WentworthWagga Wagga