THE GREAT HOUSING WORKOUT - Squarespacestatic1.squarespace.com/.../The-Great-Housing-Workout.pdf ·...
22
THE GREAT HOUSING WORKOUT: How five million homes will be acquired, renovated and rented or sold by thousands of local operators to solve America’s housing crisis WHITE PAPER Arixa Capital Advisors • 10990 Wilshire Boulevard, Suite 440 • Los Angeles, CA 90024 • 310-428-9109 • www.ArixaCapital.com A White Paper by: JAN B. BRZESKI [email protected] 310-428-9109 March 2012
Transcript of THE GREAT HOUSING WORKOUT - Squarespacestatic1.squarespace.com/.../The-Great-Housing-Workout.pdf ·...

THE GREAT HOUSING WORKOUT:How five million homes will be acquired, renovated and rented or sold by thousands of local operators to solve America’s housing crisis
WHITE PAPER
Arixa Capital Advisors • 10990 Wilshire Boulevard, Suite 440 • Los Angeles, CA 90024 • 310-428-9109 • www.ArixaCapital.com
A White Paper by:
JAN B. [email protected]
March 2012

The Great Housing Workout White Paper Page 1 of 21 Arixa Capital Advisors, LLC ©2013 All Rights Reserved
THE GREAT HOUSING WORKOUT
White Paper
Contents
Overview ...................................................................................................................................................... 3
Recent History of the Single Family Residential Market ........................................................................ 4
Current Market Status and Key Trends ................................................................................................... 5
Overview of Investment Strategies ............................................................................................................ 6
Demand for Rental Housing. ................................................................................................................ 6
Buying Right and Renovating Cost Effectively ........................................................................................ 7
Fix-and-Flip Business Model ..................................................................................................................... 8
Buying at “Wholesale” Cost/Distressed Sale Value. ............................................................................ 8
Renovating Cost Effectively. ................................................................................................................ 8
Fix-and-Flip Typical Profit Margins. .................................................................................................... 8
Use of Leverage by Fix-and-Flip Operators. ........................................................................................ 9
Challenges and Limitations of Fix-and-Flip Strategy.............................................................................. 9
Competition from Other Fix-and-Flip Operators. ................................................................................. 9
Capital-Intensive Business; Unsteady Cash Flow................................................................................. 9
Weak Demand for Housing Upon Exit. ................................................................................................ 9
Specialized Business; Not a Good Fit for Most People. ..................................................................... 10
Fix-and-Rent Model .................................................................................................................................. 10
Advantages of the Fix-and-Rent Program .............................................................................................. 11
Attractive, Steady Current Income. ..................................................................................................... 11
Ability to Create “Instant Equity”. ...................................................................................................... 11
Tenant Turnover Likely Lower vs. Apartments. ................................................................................. 11
Ability to Use Leverage. ..................................................................................................................... 12
Multiple Exit Pathways. ...................................................................................................................... 12
Rental Demand .......................................................................................................................................... 13
Rental Demand is Strong. ................................................................................................................... 13
Price-to-Rental Income Ratios are Favorable. .................................................................................... 13
Challenges and Limitations of Fix-and-Rent Market ............................................................................ 14

The Great Housing Workout White Paper Page 2 of 21 Arixa Capital Advisors, LLC ©2013 All Rights Reserved
Few Economies of Scale. .................................................................................................................... 14
Potential for Heavy Wear and Tear. .................................................................................................... 15
Absence of Highly Professional, Scalable Property Management Organizations. ............................. 15
Federal Government Policy and its Implications ................................................................................... 15
Interest Rates for Home Buyers. ......................................................................................................... 15
Sales of Government-Owned Homes. ................................................................................................. 15
How Investors Can Gain Exposure to Residential Investment ............................................................. 16
Purchasing REO Properties Directly. .................................................................................................. 16
Investing as a Joint Venture Equity Partner with an Operator. ........................................................... 17
Investing in One or More First Trust Deeds Secured by Individual Properties. ................................. 17
Investing in a Fund Pursuing One of the Above-Referenced Strategies. ............................................ 18
Conclusion ................................................................................................................................................. 19
References and Recommendations for Further Research ..................................................................... 20
About the Author ...................................................................................................................................... 20

The Great Housing Workout White Paper Page 3 of 21 Arixa Capital Advisors, LLC ©2013 All Rights Reserved
Overview
In February 2012, Warren Buffett drew attention to the U.S. housing market as an investment opportunity
in an interview on CNBC. An excerpt of the interview is provided below.
“If I had a way of buying a couple hundred thousand single-family homes… I would load up on
them… it's a very attractive asset class now. I could buy…them at distressed prices and find
renters and … [take a] mortgage, it’s a leveraged way of owning a very cheap asset and I think
that’s as attractive of an investment as you can make.” Warren Buffett CNBC's Squawk Box,
Monday, February 27, 2012
This white paper aims to present key facts about the U.S. housing market today; to explain the main ways
that investors can gain exposure to this asset class; and to highlight both the opportunities and the
challenges associated with each strategy. The goal of the white paper is to provide a realistic snapshot of
the market as of early 2012, and to assist interested investors in making decisions that fit with their
capabilities. Above all, the author hopes to help investors to form realistic expectations about the market
prior to making investment decisions.
At the same time, the white paper aims to explain that the solution to the housing crisis that has held back
the U.S. economy is relatively simple and is right in front of us. Thousands of local operators purchase
homes from banks, renovate them, and either rent them or resell them. They have been doing this for
several years and they will keep doing so, attracted by appealing profit margins and strong returns.
Policy-makers should recognize that the solution to the housing crisis will come from these operators, not
from Washington, D.C. or from Wall Street. Over a period of about five years, with about 1 million
homes renovated per year, operators will clear the backlog of foreclosures and the housing market will
return to a more normal state.
The Great Housing Workout White Paper Page 4 of 21 Arixa Capital Advisors, LLC ©2013 All Rights Reserved
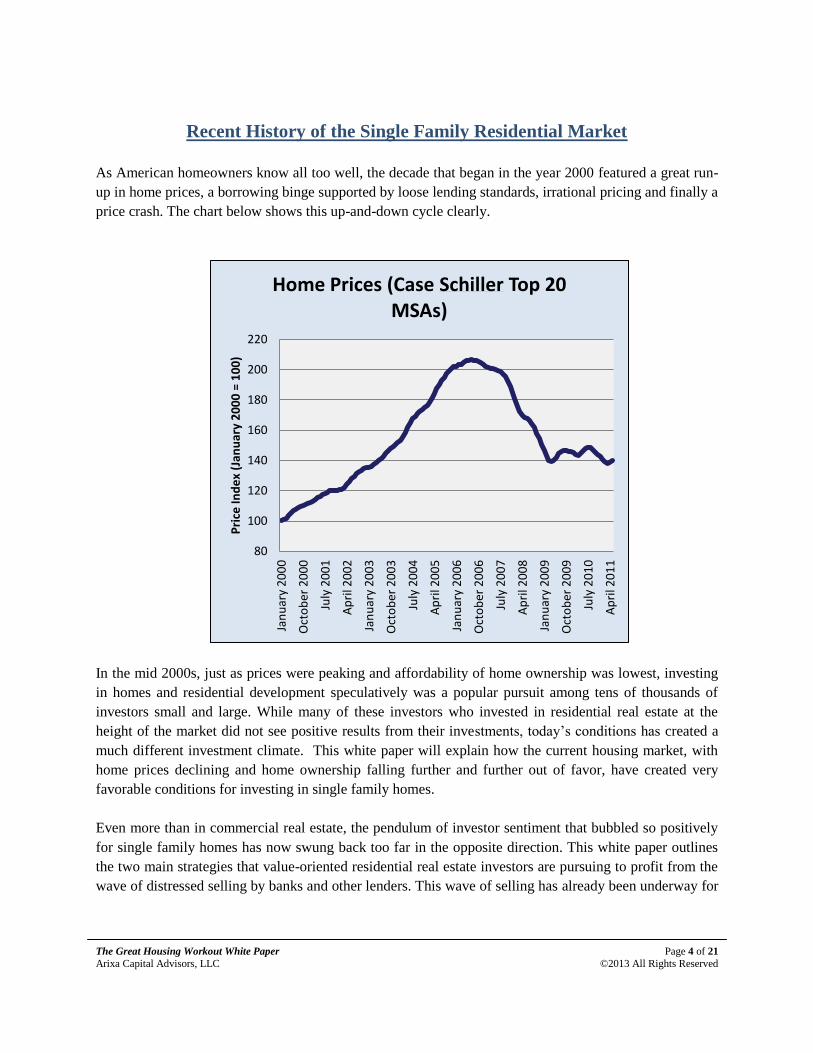
Recent History of the Single Family Residential Market
As American homeowners know all too well, the decade that began in the year 2000 featured a great run-
up in home prices, a borrowing binge supported by loose lending standards, irrational pricing and finally a
price crash. The chart below shows this up-and-down cycle clearly.
In the mid 2000s, just as prices were peaking and affordability of home ownership was lowest, investing
in homes and residential development speculatively was a popular pursuit among tens of thousands of
investors small and large. While many of these investors who invested in residential real estate at the
height of the market did not see positive results from their investments, today’s conditions has created a
much different investment climate. This white paper will explain how the current housing market, with
home prices declining and home ownership falling further and further out of favor, have created very
favorable conditions for investing in single family homes.
Even more than in commercial real estate, the pendulum of investor sentiment that bubbled so positively
for single family homes has now swung back too far in the opposite direction. This white paper outlines
the two main strategies that value-oriented residential real estate investors are pursuing to profit from the
wave of distressed selling by banks and other lenders. This wave of selling has already been underway for
80
100
120
140
160
180
200
220
Jan
uar
y 2
00
0
Oct
ob
er 2
00
0
July
20
01
Ap
ril 2
00
2
Jan
uar
y 2
00
3
Oct
ob
er 2
00
3
July
20
04
Ap
ril 2
00
5
Jan
uar
y 2
00
6
Oct
ob
er 2
00
6
July
20
07
Ap
ril 2
00
8
Jan
uar
y 2
00
9
Oct
ob
er 2
00
9
July
20
10
Ap
ril 2
01
1
Pri
ce In
de
x (J
anu
ary
20
00
= 1
00
)
Home Prices (Case Schiller Top 20 MSAs)

The Great Housing Workout White Paper Page 5 of 21 Arixa Capital Advisors, LLC ©2013 All Rights Reserved
four years, but is expected to continue for at least another four years, offering savvy investors attractive
risk adjusted returns relative to those available elsewhere in the investment universe.
Current Market Status and Key Trends
For investors in single family homes, one of the most important metrics is the number of homes that will
change hands in distressed transactions in the upcoming years. Each home will require a renovation prior
to being returned to the market either as a rental property or as a resale to an owner-occupant. The chart
below, developed by Amherst Securities, estimates the number of defaults at between 8 million and 10
million homes over the next six years.
Not all homes that go into foreclosure will be purchased by an investor at a foreclosure sale. According to
one source, about 29% of recent California foreclosures are purchased by third parties (investors).1 The
remaining 71% become bank-owned property (“real estate owned,” or “REO”). According to another
study, about 40% of REO properties are purchased by an investor.2
Putting together these two estimates, we can approximate the number of homes that will be purchased by
an investor: 29% of all transactions at foreclosure sale, plus 40% of the remaining 71% of transactions, or
29% + 28% = 57% of all foreclosures.
Using the 10 million home figure from Amherst Securities, we can estimate that 5.7 million homes might
credibly be purchased by investors over the next six years or so—approximately 1 million homes per
year, on average.
The Great Housing Workout White Paper Page 6 of 21 Arixa Capital Advisors, LLC ©2013 All Rights Reserved
Overview of Investment Strategies
When investors purchase homes, either at a foreclosure sale, via short sale, or directly from banks, these
homes almost always need some level of renovations before they can be occupied again either as a rental
property or as a resale. In most cases, the prior occupant of the property lost his or her home through
foreclosure or a short sale. Owners who know they will lose their homes do not generally spend money
keeping their homes in good condition, since they will not be in the home to benefit from repairs.
Frequently, the buyers of such properties need to spend $10,000 to $30,000 per home to perform repairs,
including painting the inside and outside of the house; replacing carpet or other flooring; renovating
kitchens and bathrooms; and/or re-landscaping the front and back yards.
The scope of the renovation is dictated by the investor’s strategy for the property. The two main
investment strategies are: (i) renting the property as an income investment, with the hope of realizing
appreciation over time as well as current rental income (the “fix-and-rent” strategy); and (ii) reselling the
property for a profit, usually within six months of the purchase (the “fix-and-flip” strategy).
One study suggests that 44% of REO property purchases in the local market that was examined are resold
again within a year, typically for a healthy profit.3 In the California market, anecdotal evidence gathered
by the author suggests that many investors are shifting their emphasis from the fix-and-flip strategy to the
fix-and-rent strategy.
Demand for Rental Housing. As shown on the chart on the following page, the homeownership rate is
falling. The U.S. Census estimates that the homeownership rate has declined from its peak of 69% in
2005-2006 to its present level of 66%. These current figures include 2.8 million homeowners who have
either not made a mortgage payment in over a year or are in foreclosure.4 This imminent decline of 2.8
million homeowners represents a fall in the homeownership rate of more than 2 percentage points.
Therefore, the homeownership rate has further to fall and will likely continue to fall below its historical
range of between 63%-65%. Any household that does not own their residence is likely renting in some
fashion (or living with another household, in which case the two households become a single household).
Therefore every 1% decline in the homeownership rate represents approximately 1 million households
transitioning from homeownership to renting. For a more detailed analysis of these statistics, the author
has written an article on SeekingAlpha.com which goes into further detail about the housing market and
homeownership rate.5
Additionally, a confluence of factors including tighter lending standards, depressed economic conditions,
and a sentiment among young people today that is far more negative towards homeownership than it was
in the past, suggest that the equilibrium rate of homeownership may be lower than the recent historical
average. By comparison, in 1950 the homeownership rate was only 55%.6

The Great Housing Workout White Paper Page 7 of 21 Arixa Capital Advisors, LLC ©2013 All Rights Reserved
Buying Right and Renovating Cost Effectively
There is a common thread to both strategies outlined in the previous section. In both cases, the operator’s
most important job is to purchase properties at favorable prices, and get them renovated cost-effectively
in a way that will add additional value in excess of the money spent on renovations. In doing so, the
operator should be able to create substantial value equity within 30 to 60 days after purchasing a property.
First, the total volume of properties owned by banks today is much higher than historical norms. There
are currently 6.1 million mortgages that are non-performing with 2.1 million mortgages in an active
foreclosure process.7 Also, competition from owner-occupants is more limited since many families prefer
to rent or cannot qualify for a loan to purchase a home in today’s extremely tight lending environment. As
a consequence of the sheer number of distressed homes and the lower demand from owner-occupants,
distressed homes are trading at a deeper discount to retail market value than they have historically.
Whereas in the past it was typical to purchase distressed homes at a 5% discount, today these homes can
be purchased for discounts ranging between 14-46%.8 Today’s market environment allows, investors in
single family homes to make more money “on the buy” than usual, thus creating the conditions for very
attractive risk-adjusted returns in 2012 and 2013.
It should be noted that banks also own an unusually large quantity of commercial real estate today.
However, in that market, banks are generally less motivated to sell, while the number of opportunistic
buyers with cash available is high, resulting in far fewer opportunities and lower risk-adjusted returns, in
the author’s experience. While fix-and-flip operators in the residential market might be able to create 15-
59.0
60.0
61.0
62.0
63.0
64.0
65.0
66.0
67.0
68.0
69.0
70.0
1Q
65
2Q
67
3Q
69
4Q
71
1Q
74
2Q
76
3Q
78
4Q
80
1Q
83
2Q
85
3Q
87
4Q
89
1Q
92
2Q
94
3Q
96
4Q
98
1Q
01
2Q
03
3Q
05
4Q
07
1Q
10
U.S. Home Ownership Rates (1965-Present)
U.S. Home Ownership Rates (1965-Present)

The Great Housing Workout White Paper Page 8 of 21 Arixa Capital Advisors, LLC ©2013 All Rights Reserved
20% gross profits (before accounting for selling costs) on a typical project, in the commercial market 5-
10% is probably more typical. For this reason, “flipping” in the commercial market is less common. Most
buyers in that market are prepared for a multi-year holding period in order to generate a combination of
income and, eventually, capital gains.
Fix-and-Flip Business Model
The fix-and-flip business model is relatively simple. It is premised on buying a property at a wholesale
value, typically from a bank; renovating the property in a way that would appeal to a prospective
homeowner; and then selling it for a price that covers all of the renovation and transactions costs, plus a
profit for the renovator/operator. This model is premised on the fact that many homes that require
meaningful renovations will not qualify for a traditional home loan from Fannie Mae, Freddie Mac
(“conventional loans”) or the U.S. Department of Housing and Urban Development (“HUD”) or Veterans
Administration (“VA”). These lenders and the banks who sell loans to these government entities account
for over 95.7% of all purchase money home loan originations.9
Buying at “Wholesale” Cost/Distressed Sale Value. The profit built into the fix-and-flip business
model can be divided into two parts: The first part comes from buying the property at a wholesale value
from the bank that is below the “as-is” retail value at the time of purchase. The absence of competition
from typical buyers who need a Government Sponsored Entity (“GSE”) loan allows investors to purchase
at 5% to 15% or more below retail value, since retail value is defined as what typical buyers would pay if
the buyers were able to secure conventional financing for their purchase.
Renovating Cost Effectively. The second element of the fix-and-flip operator’s value creation is the
renovation itself. The operator determines what repairs and upgrades are needed to maximize the appeal
of the home to retail buyers who are looking to purchase a home in the area. Typical upgrades include
interior and exterior paint, new carpeting, and kitchen and bathroom renovations. Sometimes
improvements are more extensive such as removing walls or otherwise re-configuring space in the house,
or even adding space such as an extra bedroom or bathroom. The operator then gets these upgrades
completed cost-effectively by negotiating favorable rates from outside contractors and suppliers. The
operator’s total cost for these upgrades might be $20,000 or $25,000, but the value to a retail home buyer
might be much higher, because the retail home buyer would have to take time to plan the renovation, pay
a contractor to oversee the project, and generally spend a great deal of energy doing things that the
average retail home buyer does not have the time or expertise to do.
Fix-and-Flip Typical Profit Margins. It is not uncommon for a fix-and-flip operator to generate a 10%
return on investment over a five or six month period, after accounting for selling costs of about 5%-6% of
the sale price of the property. To do so requires about a 16% return on investment before accounting for
selling costs. This profit margin might well be divided into two roughly equal components—one based on

The Great Housing Workout White Paper Page 9 of 21 Arixa Capital Advisors, LLC ©2013 All Rights Reserved
buying right, and the other based on renovating cost-effectively and providing a “turn-key” property for
the retail homebuyer.
Use of Leverage by Fix-and-Flip Operators. Assuming a 10% return on investment in 5-6 months,
many fix-and-flip operators are generating 20-25% (or higher) annualized returns. Given such attractive
returns, many fix-and-flip operators are eager to buy as many projects as they can. As a result, they
frequently use private money loans in order to spread out their equity investment dollars over as large a
number of projects as they can. Banks will not generally provide financing to fix-and-flip operators,
because banks do not like to underwrite properties for loans that will be paid off in a few months.
In order to justify the work to underwrite a property, lenders require some minimum amount of profit per
investment (say, $10,000 including interest income and origination fees). This amount of profit usually
equates to a high effective interest rate for the borrower, since the $10,000 is being charged on a small
loan over a relatively short period of time. Banks are not generally comfortable charging double-digit
interest rates to their customers, since they are paying less than 1% interest on deposits from those same
customers. As a result, this market of lending to fix-and-flip operators is generally left to private money
lenders for whom these loans can be an excellent investment.
One of the ways that investors can participate in the fix-and-flip business is to provide debt financing to
operators in this market. That strategy is outlined in detail in a prior white paper published by the author
of this white paper.10
Challenges and Limitations of Fix-and-Flip Strategy
There are several disadvantages of pursuing the fix-and-flip strategy as an operator. These challenges
include:
Competition from Other Fix-and-Flip Operators. Profit margins for fix-and-flip operators have
declined as more operators and more capital have entered the market in the past few years. Acquisition
techniques that once generated large profits margins, such as buying properties at foreclosure sales, now
generate thinner margins.11
Operators who are not experienced can easily lose money on one or more
transactions.
Capital-Intensive Business; Unsteady Cash Flow. Fix-and-Flip operators need plenty of cash in order
to take advantage of buying opportunities when they arise. They also need cash to cover renovation costs.
Even very experienced operators who make money consistently often find themselves with too much cash
at some times and not enough at other times.
Weak Demand for Housing Upon Exit. The fix-and-flip market is premised on selling the home to an
owner-occupant family once the home has been renovated. Monetary easing has provided very low
interest rates with correspondingly affordable monthly payments for those buyers who qualify for a loan.
The Great Housing Workout White Paper Page 10 of 21 Arixa Capital Advisors, LLC ©2013 All Rights Reserved
However, some buyers who would qualify for a loan already own a home, partly because of the now-
expired Federal stimulus provision which provided very generous first-time home buyer tax credits. With
a relatively small number of families still looking to buy, selling a home takes longer today. For this
reason, among others, many operators are moving toward holding homes as rentals rather than selling
them.
Specialized Business; Not a Good Fit for Most People. Buying, fixing and flipping a home may sound
like an enjoyable activity, and TV networks such as HGTV have spurred interest and to some extent
glamorized this activity. However, the reality of buying, renovating and re-selling homes is very hard
work requiring specialized skills and resources, together with solid organizational abilities. Most
successful operators work 60-80 hours per week at this activity and manage large teams of sub-
contractors. Being an operator requires full time attention and “street smarts” about how much a given
project should cost, and how much a home can be sold for, which most investors don’t have.
In spite of the challenges outlined above, the fix-and-flip business remains viable for experienced,
efficient operators. They are providing a service which is greatly needed in our economy and will remain
in demand for years to come, as millions of distressed loans pass through the mortgage system and
foreclosure process and are recycled back into productive use.
Fix-and-Rent Model
In the fix-and-rent model, the investor or operator purchases the distressed property, performs
renovations, and then rents it out to a tenant to generate current income. The renovation typically includes
less work than what would be performed under the fix-and-flip model. Renovations would normally
include items such as painting the interior, replacing carpet and other flooring, and upgrading appliances.
Other items such as landscaping the yard, replacing windows and doors and upgrading kitchens and
bathrooms are typically excluded from fix-and-rent renovation projects, since tenants often will not pay
significant extra rent for these upgrades. Zelman Associates estimates there are 13.6 million rented single
family homes in the U.S. today. They report an average occupancy rate of 93.9% among respondents to
their survey of professional managers of such properties. 12
The fix-and-rent operator is looking for enough income from rental operations to generate an attractive
return on the total cost of the property, which includes the renovation cost. A typical target today is an 8%
return on cost. In the world of income property, this would be referred to as an 8% capitalization rate,
defined as net operating income divided by total cost. Note that for a property that cost $100,000,
including renovation cost, the required net operating income would be $8,000. Given operating costs of
$4,000-$5,000 per year on average, plus an allowance for vacancy and bad debt, the required rental rate
would be $1,100 to $1,200 per month.
In California, it is possible to achieve an 8% capitalization rate in certain selected locations. Generally,
the purchase price of the home must be around $100,000 or less for this target to be achieved. In early

The Great Housing Workout White Paper Page 11 of 21 Arixa Capital Advisors, LLC ©2013 All Rights Reserved
2012, the median sales price for homes in California was $246,000.13
Clearly, these rental homes are in
the most affordable areas and not likely to be in the main urban areas. However, in order to generate
steady rental income, they must also be close to employment centers, and not in areas that are too remote.
Investors could also assemble homes at a cost of $150,000 or $200,000 each, however, without
proportionately higher rent, the return on cost (capitalization rate) would likely be closer to 6% for these
homes. A 6% capitalization rate is also acceptable, and is comparable to the capitalization rate on
apartment buildings. These higher-priced homes may offer attractive upside appreciation opportunities in
the future when compared to lower priced homes. As an example, 10% appreciation on a $200,000
property would generate a $20,000 increase in equity for an investor, while the same 10% appreciation on
a $100,000 home would only generate a $10,000 increase in equity. Also, higher-end homes may attract
more credit-worthy tenants who also treat the property with more care. As in the apartment investment
market, there is a trade-off between current yield and property/neighborhood quality.
Advantages of the Fix-and-Rent Program
Late 2011 and early 2012 have seen a number of research reports and announcements touting the benefits
of the fix-and-rent investment thesis.14
15
This program has a number of advantages including those listed
below.
Attractive, Steady Current Income. Like an apartment building, a portfolio of rental homes has the
potential to generate steady current income. Some people have called such portfolios “horizontal
apartments” because of the similar low risk characteristics of this strategy to apartment ownership. Losing
a single tenant can generate a huge change in income for shopping centers or industrial buildings, but
losing one residential tenant in a portfolio of properties results in a smaller vacancy loss.
Ability to Create “Instant Equity”. Like successful fix-and-flip operators, fix-and-rent operators are
able to purchase homes at wholesale prices from banks or in short sales and renovate them cost-
effectively. As a result, once a home is fixed and ready to rent, its value should be substantially higher
than the operator’s cost basis. While the fix-and-rent operator does not realize this gain until years later,
when the property is sold, the ability to create value immediately enhances the returns of the fix-and-rent
strategy.
Tenant Turnover Likely Lower vs. Apartments. Apartment tenant turnover can be high, depending on
the market. In Las Vegas, the average tenant moves after one year or less. Turnover carries a cost, since
units must be painted, sit vacant for a period of time, and concessions (frequently one month of free rent)
may be necessary to induce a new tenant to sign a lease. Families renting a home are more likely to have
children and may not want to move frequently, because of school and other considerations. Recent market
research indicates that the average single family home renter stays for 33 months.16

The Great Housing Workout White Paper Page 12 of 21 Arixa Capital Advisors, LLC ©2013 All Rights Reserved
Ability to Use Leverage. A portfolio of rented single family homes has similar financial characteristics
to an apartment building. In particular, it will tend to have steady income with high operating margins
(operating profit/revenue, which is typically above 50% for apartments). As such, both apartments and
rented homes are excellent candidates for using leverage as part of the capitalization of the portfolio.
Furthermore, the cost of a loan secured by real property with a proven ability to generate income should
be substantially less than a loan on a project that does not generate income. Low-cost debt financing can
enhance the returns of the fix-and-rent strategy.
Multiple Exit Pathways. The owner of an apartment property can either hold the investment for income
or sell it to another apartment investor. The owner of a portfolio of rental homes has the option to sell a
given property in the future either to an investor, or to an owner-occupant. This added exit opportunity
has the potential to increase returns substantially because at certain times in the real estate market cycle,
owner-occupants will pay much more for a home than investors. By analogy, commercial real estate
investors like to invest in surface parking lots located close to the city center of major metropolitan areas.
These lots have a value as an income property, but they might have a much higher value in the future to
developers who could build high rise buildings on the properties, if and when the market is strong enough
to justify this higher and better use. For single family homes, the highest and best use—and the highest
valuation--is likely to again be owner-occupancy at some point in the future.
To illustrate the fix-and-rent strategy, Figure 1 below depicts two actual fix-and-rent investments. Both
properties are located in Southern California’s Inland Empire region, which was one of the hardest-hit by
the real estate market crash, and as a result both properties were purchased at a substantial discount to
renovated retail market value. The net operating incomes as a percentage of total cost represent a 9% and
7% yield, respectively. The second property, with a cost basis including a light renovation of $82,100 in
early 2012, last sold in 2001 for $239,500.
Figure 1
The Great Housing Workout White Paper Page 13 of 21 Arixa Capital Advisors, LLC ©2013 All Rights Reserved
Rental Demand
Supporting the fix-and-rent model is strong demand for rental housing as of early 2012, as well as
attractive price-to-rental income ratios from the investor’s perspective.
Rental Demand is Strong. Demographic trends are positive for rental housing. New household
formations are forecast to average 1.4 million per year through 2015. The author believes that
approximately half of all new households will become renters as opposed to homeowners for a number of
reasons, including, among other factors, a negative sentiment towards homeownership, tight lending
standards for mortgages, and difficult personal economic circumstances resulting from the recent
recession. In addition to newly formed households, homeowners who lose their homes to the foreclosure
process will also typically enter the rental market, creating additional demand. Further detail is provided
in the Marcus & Millichap’s 2012 National Apartment Report:
All 44 markets tracked in the National Apartment Index are forecast to post continued
employment growth and effective rent growth in 2012. Recovery has moved beyond the
cyclical surge in demand to a more sustainable expansion, as remarkable shifts in demographic,
economic and social patterns underpin demand for rental housing. U.S. vacancy should reach
5.0 percent by the end of 2012, a 40-basis-point decline since 2011, and resulting in 4.8 percent
effective rent growth. Forecast completions will total nearly 85,000 units, still critically short of
a conservative demand forecast for 120,000 units, initiating a new development cycle.
Household formations are forecast to increase by 29 percent to an annual average of 1.4 million
through 2015, aided by rising immigration and 2.1 million echo boomers entering the prime
renter age cohort.
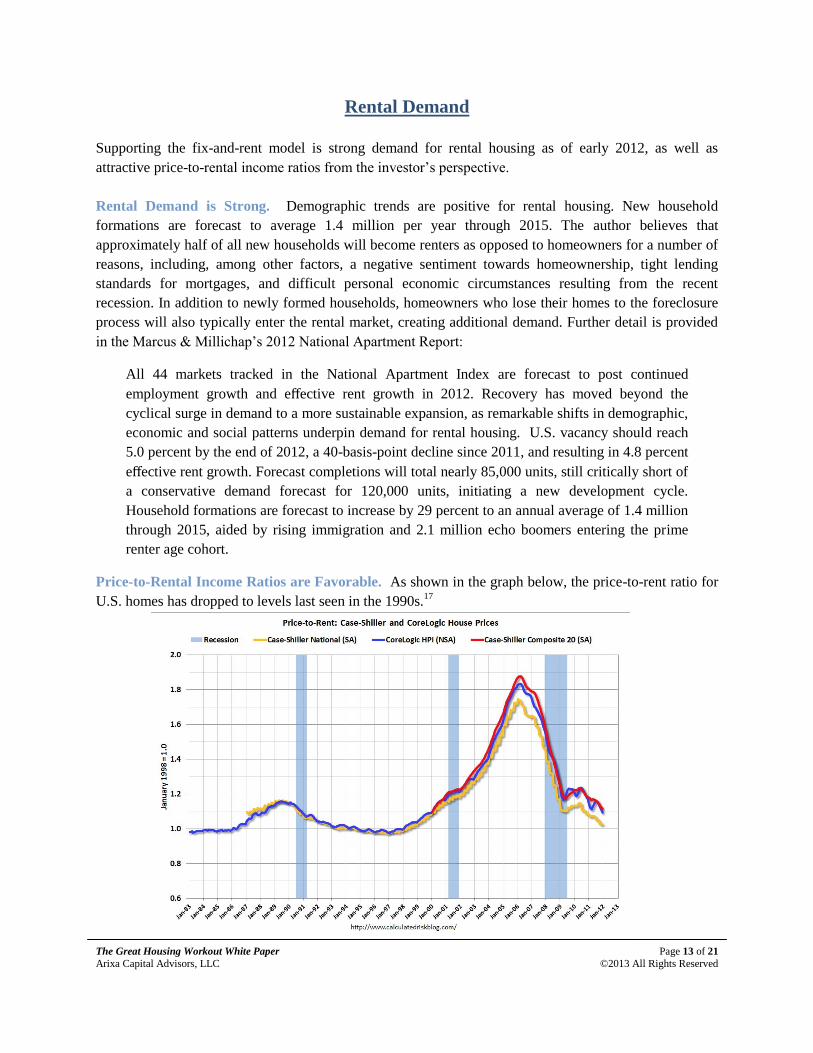
Price-to-Rental Income Ratios are Favorable. As shown in the graph below, the price-to-rent ratio for
U.S. homes has dropped to levels last seen in the 1990s.17
The Great Housing Workout White Paper Page 14 of 21 Arixa Capital Advisors, LLC ©2013 All Rights Reserved
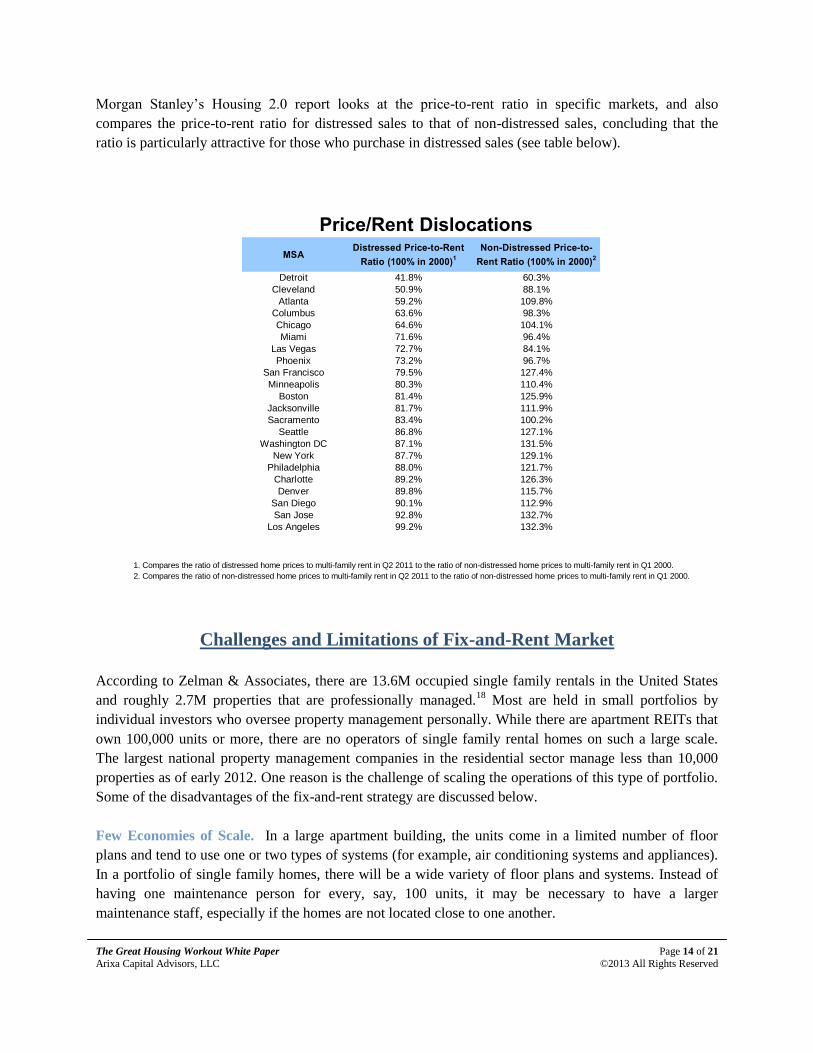
Morgan Stanley’s Housing 2.0 report looks at the price-to-rent ratio in specific markets, and also
compares the price-to-rent ratio for distressed sales to that of non-distressed sales, concluding that the
ratio is particularly attractive for those who purchase in distressed sales (see table below).
Challenges and Limitations of Fix-and-Rent Market
According to Zelman & Associates, there are 13.6M occupied single family rentals in the United States
and roughly 2.7M properties that are professionally managed.18
Most are held in small portfolios by
individual investors who oversee property management personally. While there are apartment REITs that
own 100,000 units or more, there are no operators of single family rental homes on such a large scale.
The largest national property management companies in the residential sector manage less than 10,000
properties as of early 2012. One reason is the challenge of scaling the operations of this type of portfolio.
Some of the disadvantages of the fix-and-rent strategy are discussed below.
Few Economies of Scale. In a large apartment building, the units come in a limited number of floor
plans and tend to use one or two types of systems (for example, air conditioning systems and appliances).
In a portfolio of single family homes, there will be a wide variety of floor plans and systems. Instead of
having one maintenance person for every, say, 100 units, it may be necessary to have a larger
maintenance staff, especially if the homes are not located close to one another.
M O R G A N S T A N L E Y R E S E A R C H
7
Housing 2.0: The New Rental Paradigm
October 27, 2011
Investment Returns: A Tale of Two Sources
1. A Historic Dislocation Between Rents and Home Prices: While most overall price to rent ratio analysis focuses on average home prices, we choose to break this out by the distressed nature of the sale. In our Outlook for 2011 (see “2011 SPG Outlook”, December 8, 2010), we calculated the price to rent ratios for non- distressed prices across several MSAs. Here, we look at the same ratios, but calculated based on the distressed price, since those are the prices that investors are paying for these target rental properties. Across 20 of the largest MSAs in the country, it is clear that not only do the ratios indicate that distressed property is cheap on this basis, but that they are significantly cheaper than they have been since 2000, which includes the pre-bubble period. At the same time, non-distressed prices remain high on the same basis for most MSAs. The conclusion, therefore, is that gross rents are historically attractive relative to current distressed prices. Adding to this attractiveness is the fact that multifamily data shows rents continuing to rise.
2. Capital Appreciation without Home Price Appreciation?: Usually, we would attach the concept of capital appreciation to that of home price appreciation, and model capital returns based on our home price projections. However, in the current market environment, we believe there are actually two separate sources for capital appreciation. First is the fundamental underlying HPA, which we believe will remain close to 0% over the next five years. Second is the capital appreciation that we believe exists from the convergence of distressed to non-distressed prices as the backlog of inventory is cleared. Historically, there has been about a 5% discount for distressed properties due to quality issues. Currently, this discount ranges from 30-45% depending on the MSA. We believe this greater discount is due to the excessive inventory of distressed properties. If this is the case, then eventually when the distressed inventory returns to a more normal level, distressed prices should also converge toward their non-distressed counterparts. While not all of this convergence will be from the bottom up (indeed, we believe non-distressed prices have more to fall), a good amount of capital appreciation should still occur simply due to the magnitude of the current discount. Furthermore, as the distressed inventory is removed from the market, the overall housing environment should improve and eventually lead to fundamental home price appreciation as well.
Price/Rent Dislocations
Source: DataQuick, Morgan Stanley ResearchSource: CBRE, Case-Shiller, Morgan Stanley Research
Distressed Discounts
MSADistressed Price-to-Rent
Ratio (100% in 2000)1
Non-Distressed Price-to-
Rent Ratio (100% in 2000)2
Detroit 41.8% 60.3%
Cleveland 50.9% 88.1%
Atlanta 59.2% 109.8%
Columbus 63.6% 98.3%
Chicago 64.6% 104.1%
Miami 71.6% 96.4%
Las Vegas 72.7% 84.1%
Phoenix 73.2% 96.7%
San Francisco 79.5% 127.4%
Minneapolis 80.3% 110.4%
Boston 81.4% 125.9%
Jacksonville 81.7% 111.9%
Sacramento 83.4% 100.2%
Seattle 86.8% 127.1%
Washington DC 87.1% 131.5%
New York 87.7% 129.1%
Philadelphia 88.0% 121.7%
Charlotte 89.2% 126.3%
Denver 89.8% 115.7%
San Diego 90.1% 112.9%
San Jose 92.8% 132.7%
Los Angeles 99.2% 132.3%
MSADistressed / Non-
Distressed Ratio
Potential
Appreciation from
ConvergenceAtlanta 53.9% 85.5%
Cleveland 57.7% 73.2%
Chicago 62.1% 61.0%
San Francisco 62.4% 60.3%
Boston 64.7% 54.7%
Columbus 64.7% 54.5%
Washington DC 66.2% 51.0%
New York 67.9% 47.2%
Seattle 68.3% 46.4%
Detroit 69.2% 44.4%
San Jose 69.9% 43.0%
Charlotte 70.6% 41.6%
Philadelphia 72.3% 38.4%
Minneapolis 72.7% 37.5%
Jacksonville 73.0% 37.0%
Miami 74.3% 34.6%
Los Angeles 75.0% 33.4%
Phoenix 75.7% 32.0%
Denver 77.6% 28.8%
San Diego 79.8% 25.3%
Sacramento 83.3% 20.1%
Las Vegas 86.4% 15.7%
1. Compares the ratio of distressed home prices to multi-family rent in Q2 2011 to the ratio of non-distressed home prices to multi-family rent in Q1 2000.
2. Compares the ratio of non-distressed home prices to multi-family rent in Q2 2011 to the ratio of non-distressed home prices to multi-family rent in Q1 2000.
The Great Housing Workout White Paper Page 15 of 21 Arixa Capital Advisors, LLC ©2013 All Rights Reserved
Potential for Heavy Wear and Tear. In an apartment complex, the management can create and enforce
policies designed to create a professional appearance and minimize wear and tear on the property. For
example, many buildings do not allow large dogs. In rental houses, the management staff is not on-
property and cannot easily enforce policies. Houses may therefore need more substantial repairs when a
tenant moves out and will likely incur more wear and tear during the period that a tenant occupies the
property.
Absence of Highly Professional, Scalable Property Management Organizations. Property managers
of single family homes typically charge 7% to 10% of revenue as a property management fee. Assuming
rent of $1,100 per month, this amounts to $77 to $110 per month, per unit. Frequently, local realtors
provide property management as an added service for their clients, since it helps them to generate
brokerage fees when properties are purchased or sold. However, given the inherent challenges of
managing single family homes, even the best groups are unlikely to want to or be able to scale above a
limited number of units. The owner must monitor performance carefully and is likely to find some
property managers are capable in some areas during certain periods of time, but it will be difficult to find
property managers who are consistently excellent and also able to scale up and cover multiple cities
effectively. One way to mitigate this issue is to partner with local operators who are sharing in both the
initial investment and in the profits, so that they have an incentive to maximize income beyond a
relatively small property management fee.
Federal Government Policy and its Implications
Government policy affects the housing market in significant ways. Some of these policies and their
implications are outlined below.
Interest Rates for Home Buyers. The Federal government provides artificially low interest rates for
home buyers via an implied government guarantee of Fannie Mae and Freddie Mac-issued debt and an
explicit guarantee on FHA and VA loans. This has the effect of propping up home values, since most
home buyers shop based on the monthly payment they can afford, not the purchase price of the home.
Most experts believe that this and other subsidies for home ownership will continue for many years to
come.
Fannie Mae currently allows investors to purchase up to 10 investment properties using a Fannie Mae
loan. This can be an attractive option for investors with good credit and healthy cash flow, since the
interest rate on Fannie Mae loans in early 2012 is 4%-5% and other lenders charge significantly more.
Sales of Government-Owned Homes. According to a recent Business Week article, Fannie Mae,
Freddie Mac and various other entities owned by the Federal Government currently own almost 250,000
homes.19
The number would be much higher if the government and GSEs foreclosed on many homes with
The Great Housing Workout White Paper Page 16 of 21 Arixa Capital Advisors, LLC ©2013 All Rights Reserved
loans in default. The government does not want to put all of these homes up for sale at once, because
home prices would drop, undermining the economic recovery. The government cannot hold onto the
homes indefinitely because they will deteriorate if not maintained.
In late 2012, the government announced plans to begin selling portfolios of REO properties to investment
groups who will operate them as rentals. There has also been discussion of providing attractive financing
to the investors. The rationale is that homes can be sold over a period of many years, when the housing
market is stronger. This mass disposition may represent a major opportunity for investors who are well-
capitalized and able to execute on a fix-and-rent strategy. As of early 2012, many of the largest private
equity firms were organizing themselves and forming partnerships to take advantage of this opportunity.
How Investors Can Gain Exposure to Residential Investment
There is no simple, publicly-traded security that gives passive investors direct exposure to either the fix-
and-flip or fix-and-rent strategies outlined in this white paper. Both of these strategies are being executed
overwhelmingly by private groups typically consisting of a few key individuals, usually backed up by a
team of contractors and real estate professionals and perhaps a small number of employees. The lack of
public market investment vehicles, in fact, explains the attractive returns available to investors who find a
way to access these investment niches successfully. The “big money” on Wall Street simply hasn’t found
a way to direct significant capital into this business; hence the continued above-market risk-adjusted
returns for strong operators and connected investors.
With this being said, there are several ways in which investors can participate. This section explains
several strategies: (a) purchasing REO properties directly; (b) investing as a joint venture equity partner
with an operator; (c) investing in one or more first trust deeds secured by individual properties; and (d)
investing in a fund pursuing one of these strategies.
Purchasing REO Properties Directly. In this strategy, the investor personally acquires a home,
determines the extent of renovations and the renovation budget, hires contractors or subcontractors, and
either sells the home or rents it out after completing the renovations. If the home is rented, the investor
either acts as the property manager personally, or finds a property manager locally to rent the property,
collect the rent, and perform repairs and pay bills.
Advantages: This model is the most profitable for the investor, if the investor can devote time to
the process of buying direct from banks, is efficient, and has the right skills and time available to
oversee each aspect of the strategy.
Disadvantages/Risks: Unless the investor has developed deep experience, there is a great deal of
room for inefficiency and error in each part of the strategy (buying, renovating, leasing and
The Great Housing Workout White Paper Page 17 of 21 Arixa Capital Advisors, LLC ©2013 All Rights Reserved
operating/maintaining, if applicable). A mediocre operator might end up spending a huge amount
of time with hit-and-miss results.
Investing as a Joint Venture Equity Partner with an Operator. Once an operator has developed the
infrastructure and team to perform either the fix-and-flip or fix-and-rent strategy, he or she is usually
eager to pursue as many profitable projects as possible. As a result, operators need capital and usually
turn to their friends and family for additional financing. Investors might seek out an operator with
experience and provide equity financing in return for a share of the profits. A typical profit split is 50/50
between the investor and the operator, after some minimum preferred return has been met. A typical
preferred return is between 10% and 15% in the fix-and-flip model, with a lower preferred return in the
rental model. Usually the operator invests some amount of money (usually between 5% and 20% of the
total capital needed) and this investment is often subordinated to the passive investor’s return of capital.
In other words, the operator guarantees that the third-party investor will at least receive his or her capital
back before the operator does.
Advantages: This strategy can be very profitable without requiring hands-on involvement or a
large time commitment. Returns of 15%-20% annually are not uncommon for the fix-and-flip
model. This strategy can provide the opportunity to evaluate each investment individually as
opposed to investing in a pool where the investor has no say regarding which specific investments
will be made.
Disadvantages/Risks: Many operators lack the experience and/or judgment to sponsor an
investment successfully. Other operators may not be honest about expenses. Returns are likely to
be volatile as even good operators have some unprofitable investments. Operators my “cherry
pick,” in other words, they may keep the best projects for themselves personally and only offer
the less profitable projects to their base of investors.
Investing in One or More First Trust Deeds Secured by Individual Properties. For investors
concerned about volatile results, one approach is to invest in a first trust deed secured by a property being
rehabilitated. The investor agrees to cap his or her upside potential in return for having an investment that
is secured by a property, with the borrower providing cash equity that acts as a cushion for the first trust
deed investor in case the project does not go according to plan. If the borrower defaults, the lender can
foreclose on the property and own the property at a favorably low cost basis. Executed properly, this
approach allows the lender to exit the transaction without a loss, even if the borrower defaults.
Specialized mortgage brokers offer trust deed investments where they purportedly have performed all the
required due diligence work and the investor’s responsibility is limited to funding the investment.
Advantages: If the lender limits the first trust deed to some amount less than cost, ensuring at
least 20-30% cash equity from the borrower, this strategy should provide a margin of safety and
reduce the probability of a loss. Because the lender’s investment is recorded as a first lien, the
need for a deep, trusting relationship with the borrower is reduced, as the borrower cannot
extinguish the lien on the property without the lender’s consent, which takes the form of a

The Great Housing Workout White Paper Page 18 of 21 Arixa Capital Advisors, LLC ©2013 All Rights Reserved
notarized “reconveyance”. Investors can achieve returns of 8% to 10% or even slightly more on
these investments.
Disadvantages/Risks: The investor must be prepared to foreclose on the property, take
ownership, and liquidate the investment in case of a borrower default. The investor must check
title to make sure that there are no other liens on the property. It is critical for the investor to
personally check that the loan amount is conservative relative to the value of the property. Also,
while returns are appealing, the investor must continually reinvest funds into new trust deeds
when existing investments pay off, since most of these loans pay off every six months or so in the
fix-and-flip model. When considering the “down time” when cash is idle, the total return from
this strategy may be below 10%. If investors are using a broker to source loans, investors should
not rely 100% on a broker to perform all of its due diligence correctly. The investor needs to do
his or her own homework.
Investing in a Fund Pursuing One of the Above-Referenced Strategies. Passive investors can gain
exposure to residential investment through a fund. Dedicated funds exist for several of the strategies
described in this white paper, for example, fix-and-flip equity, fix-and-rent equity, and fix-and-flip
debt/first trust deed investing. The fund manager takes responsibility for making investments in keeping
with the fund’s mandate, which is outlined in a private placement memorandum and operating agreement.
A fund’s historical results may be available, and the results may be audited, providing added comfort as
to the manager’s track record, reputation and probity.
Advantages: The investor has no day-to-day responsibilities. The investor’s capital commitment
is usually limited to the amount invested (no capital calls). The investor’s liability is limited. The
responsibility to keep capital deployed (as opposed to having idle cash waiting for a new
investment) falls on the fund manager, rather than on the investor.
Disadvantages/Risks: The fund manager charges a fee, a portion of which is usually levied
regardless of the returns of the fund. While fund managers usually provide more transparency and
better reporting than individual operators, the investor still must research the manager’s
reputation. Some fund managers have been unscrupulous. Investors should be cautious about
strategy creep, namely, fund managers who might increase risk in an effort to maintain returns,
when market conditions change.

The Great Housing Workout White Paper Page 19 of 21 Arixa Capital Advisors, LLC ©2013 All Rights Reserved
Conclusion
The author generally agrees with Warren Buffett’s endorsement of investment in single family homes
given current market conditions in early 2012. The key drivers of this opportunity include (a) a huge
volume of properties whose owners are highly motivated to sell; (b) a relative scarcity of capital in many
niches, when compared to more mainstream investment areas; and (c) strong demand for rental housing,
supporting the fix-and-rent strategy. These drivers combine to create a fertile environment for value-
oriented investors who understand real estate. To realize good results, investors should make a realistic
assessment of their skills and capabilities, and choose the level of involvement that fits (active, passive, or
somewhere in between). Finally, before investing, the investor must perform thorough due diligence not
just on individual properties (for active strategies), but also reference checks on any partners or service
providers. This is important particularly for more passive investors.
For policy-makers, the conclusion is that natural market forces are healing the housing market already.
The solution lies in many thousands of operators who are buying, renovating and then renting or selling
homes that have been through the foreclosure process. The great housing workout will take years to
unfold but should be allowed to do so naturally. Large-scale policy efforts are not needed and in many
cases would be based on a faulty understanding of what is already happening on the ground in America’s
hard-hit neighborhoods, namely, a clear trend towards stabilization that is unfolding one property at a
time.
The Great Housing Workout White Paper Page 20 of 21 Arixa Capital Advisors, LLC ©2013 All Rights Reserved
References and Recommendations for Further Research
Housing 2.0: The New Rental Paradigm, Morgan Stanley Research, Oliver Chang et al, October 27,
2011.
The Government’s Role in the Housing Finance System, The Brookings Institution, Karen Dynan and
Ted Gayer, April 14, 2011;
http://www.brookings.edu/~/media/Files/rc/papers/2011/0211_housing_finance_dynan_gayer/0211_h
ousing_finance_dynan_gayer.pdf.
Opportunities and Issues Regarding Investing in California First Trust Deeds, by Jan B. Brzeski, July
2010; http://arixacapital.com/white-paper-opportunities-and-issues-regarding-investing-in-california-
first-trust-deeds.
January 2012 Single Family Rental Survey, January 18, 2012, Zelman Associates,
www.zelmanassociates.com.
Outlook for the U.S. Housing Market, Laurie Goodman, Amherst Securities, presentation to the CFA
Society of Los Angeles, January 25, 2012.
LPS Mortgage Monitor: February 2012 Mortgage Performance Observations, Lender Processing
Services.
About the Author
Jan B. Brzeski is the principal and founder of Arixa Capital Advisors, LLC, a real investment company
based in Los Angeles, California. He is also the portfolio manager of two funds dedicated to investing in
single family residential debt and equity, respectively. Mr. Brzeski’s experience includes acquisitions,
underwriting and asset management for Standard Management Company, a Los Angeles commercial real
estate investment company founded in 1961, and working as an investment banking analyst at Goldman,
Sachs & Co. in New York and San Francisco. Mr. Brzeski earned a B.A. from Dartmouth College and an
M.A. from Oxford University. He is a California-licensed real estate broker.

The Great Housing Workout White Paper Page 21 of 21 Arixa Capital Advisors, LLC ©2013 All Rights Reserved
Endnotes
1 The Foreclosure Report, October, 2011, ForeclosureRadar.com.
2 Distressed and Dumped: Market Dynamics of Low-Value, Foreclosed Properties during the Advent of the Federal
Neighborhood Stabilization Program, February 10, 2012, Dan Immergluck, Georgia Institute of Technology. 3 Transforming Foreclosed Properties into Community Assets, Furman Center for Real Estate and Urban Policy,
December 2008. 4 Outlook for the U.S. Housing Market, Laurie Goodman, Amherst Securities, presentation to the CFA Society of Los
Angeles, January 25, 2012. 5 See http://seekingalpha.com/article/295832-how-investors-are-restoring-equilibrium-to-the-housing-market.
6 U.S. Census Bureau, http://www.census.gov/hhes/www/housing/census/historic/ownrate.html.
7 LPS Mortgage Monitor: February 2012 Mortgage Performance Observations, Lender Processing Services.
8 “Housing 2.0: The New Rental Paradigm, Morgan Stanley Research,” Oliver Chang et al, October 27, 2011, pg. 7.
9 Inside Mortgage Finance analysis of first half of 2011 data, as reported in DoctorHousingBubble.com,
http://www.doctorhousingbubble.com/arrival-of-housing-purgatory-housing-bad-investment-until-2015-low-mortgage-rates-make-debt-cheap-yet-no-income-growth-jobs-household-formation. 10
“Opportunities and Issues Regarding Investing in California First Trust Deeds,” by Jan B. Brzeski, July 2010; http://arixacapital.com/white-paper-opportunities-and-issues-regarding-investing-in-california-first-trust-deeds. 11
“Buying Chances Tumble for Flipper,” Los Angeles Business Journal, March 5-11, 2012 Edition. Available at http://arixacapital.com/articles/CalBusJournal_March2012.pdf. 12
January 2012 Single Family Rental Survey, January 18, 2012, Zelman Associates, pg. 2. 13
“California Home Sales Rise in December; Median Price Falls Again,” Los Angeles Times, January 19, 2012; http://articles.latimes.com/2012/jan/19/business/la-fi-home-sales-20120119. 14
“US Housing Among Most Attractive Assets: Marc Faber,” CNBC.com,, February 17, 2012 ; http://m.cnbc.com/us_news/46425342/1 15
“Housing 2.0: The New Rental Paradigm, Morgan Stanley Research,” Oliver Chang et al, October 27, 2011. 16
January 2012 Single Family Rental Survey, January 18, 2012, Zelman Associates, pg. 2. 17
www.calculatedriskblog.com. 18
Zelman Associates, pg. 2. 19
“Foreclosures: Uncle Sam and His 248,000 Homes,” Business Week, September 1, 2011, http://www.businessweek.com/magazine/foreclosures-uncle-sam-and-his-248000-homes-09012011.html.