
The Grape, Wine, & Ornamental Situation and Outlook...
30
The Grape, Wine, & Ornamental Situation and Outlook 2016 Xiaoli Fan, Jie Li, Miguel Gómez Dyson School of Applied Economics and Management Cornell University Cornell Agribusiness Economic Outlook Conference Ithaca, January 20 th , 2016
Transcript of The Grape, Wine, & Ornamental Situation and Outlook...
The Grape, Wine, & Ornamental
Situation and Outlook 2016
Xiaoli Fan, Jie Li, Miguel Gómez
Dyson School of Applied Economics and Management
Cornell University
Cornell Agribusiness Economic Outlook Conference
Ithaca, January 20th, 2016
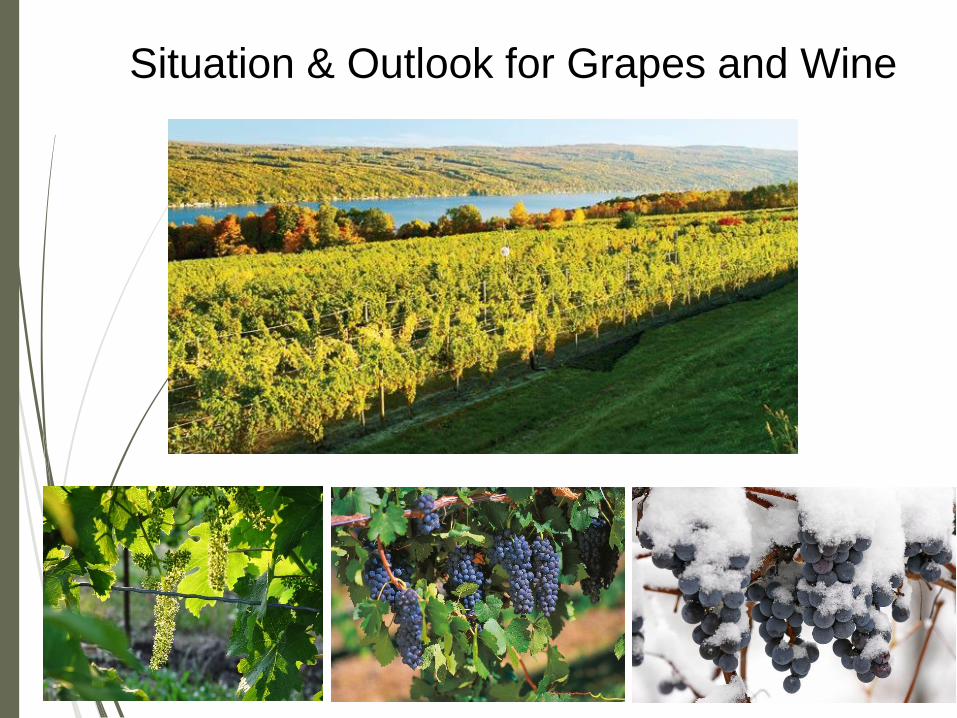
Situation & Outlook for Grapes and Wine

Value of Utilized Production of Grapes,
New York, 1997-2014
Source: New York Agricultural Statistics, 2015
40.0 38.9
58.4
45.9 47.7 47.0
38.3
32.1
38.5 39.9
53.3
58.8
48.3
68.4 70.1
52.3
74.8
69.4
0
10
20
30
40
50
60
70
80
1997 1998 1999 2000 2001 2002 2003 2004 2005 2006 2007 2008 2009 2010 2011 2012 2013 2014
Million Dollars
Year

New York Grapes Utilization,
2012-2014
Source: Fruit Report, New York Field Office, NASS, USDA, 2015
Use 2012 2013 2014
tons
Fresh 3,000 3,000 3,000
Juicea69,000 149,000 133,000
Wine 40,000 50,000 44,000
Total 112,000 202,000 180,000
a Includes other processing for jam, jelly, etc.
Estimated 2015 grape production: 165,000 tons, 12% down from 2014.
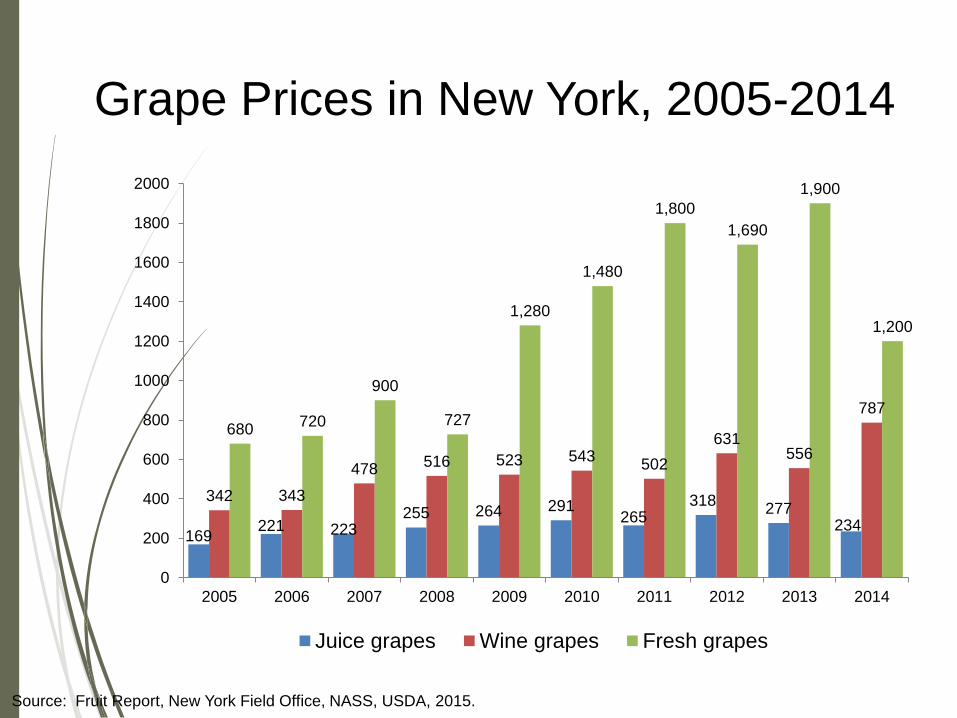
Grape Prices in New York, 2005-2014
Source: Fruit Report, New York Field Office, NASS, USDA, 2015.
169221 223
255 264 291265
318277
234
342 343
478 516 523 543502
631556
787
680720
900
727
1,280
1,480
1,800
1,690
1,900
1,200
0
200
400
600
800
1000
1200
1400
1600
1800
2000
2005 2006 2007 2008 2009 2010 2011 2012 2013 2014
Juice grapes Wine grapes Fresh grapes

Grapes Grown and Processed in NY
Source: New York Agricultural Statistics, 2015.
Received by Wineries and Processing Plants, 2010-2014a
Variety 2010 2011 2012 2013 2014
% Change
2014/2013
5-year
Avg.Concord
117,300 124,700 64,600 148,000 128,800 -15% 116,680
Niagara21,600 20,300 11,400 20,000 17,500 -14% 18,160
Other grape
varietiesb 27,880 38,000 33,000 34,000 30,700 -11% 32,716
Total, all
varieties172,000 183,000 109,000 202,000 177,000 -14% 168,600
a Includes New York grown grapes received at out-of-state plants.
b Includes Vinifera varieties, American and French Hybrid varieties not shown.
c includes Concord grapes processed for juice

Total Wine Consumption, U.S.
1999-2014
Source: Wine Institute; Department of Commerce; Gomberg, Fredrickson and Associates, 2013
543 568574
617 639665
592717 745 753 767
784836 856
893
0
100
200
300
400
500
600
700
800
900
1999 2000 2001 2002 2003 2004 2005 2006 2007 2008 2009 2010 2011 2012 2013 2014
Table wine Others
Million Gallons886
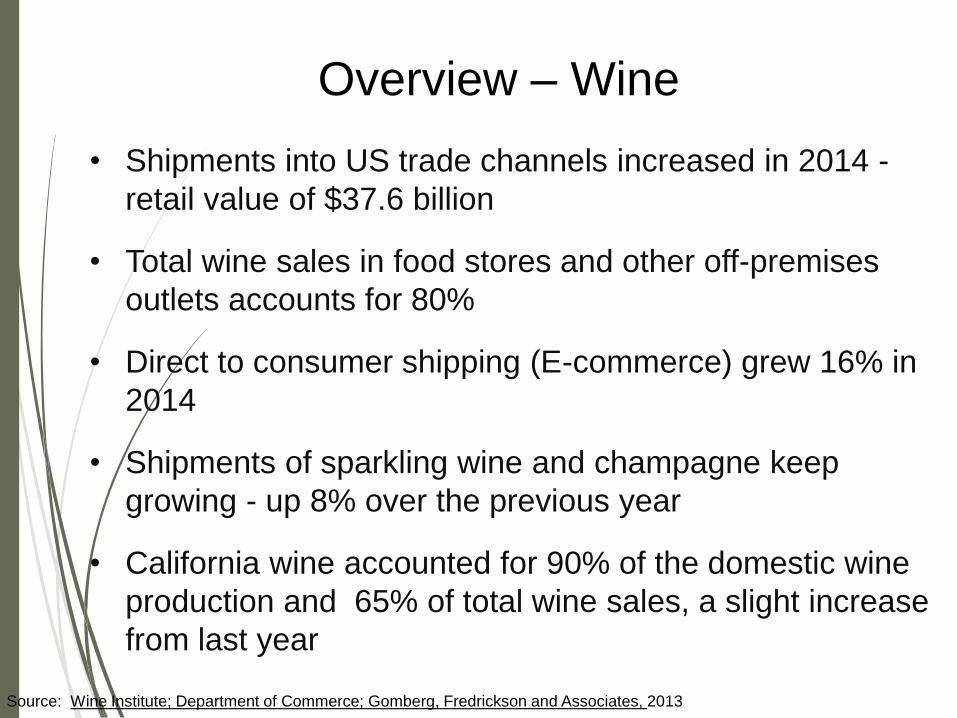
Overview – Wine
Source: Wine Institute; Department of Commerce; Gomberg, Fredrickson and Associates, 2013
• Shipments into US trade channels increased in 2014 -
retail value of $37.6 billion
• Total wine sales in food stores and other off-premises
outlets accounts for 80%
• Direct to consumer shipping (E-commerce) grew 16% in
2014
• Shipments of sparkling wine and champagne keep
growing - up 8% over the previous year
• California wine accounted for 90% of the domestic wine
production and 65% of total wine sales, a slight increase
from last year
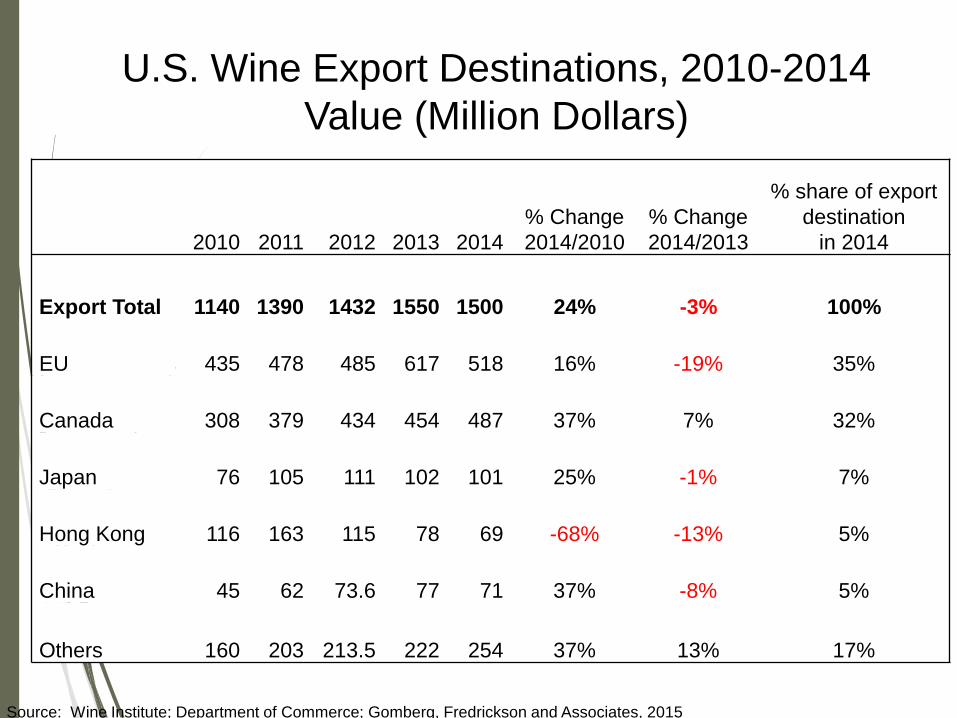
U.S. Wine Export Destinations, 2010-2014
Value (Million Dollars)
Source: Wine Institute; Department of Commerce; Gomberg, Fredrickson and Associates, 2015
2010 2011 2012 2013 2014
% Change
2014/2010
% Change
2014/2013
% share of export
destination
in 2014
Export Total 1140 1390 1432 1550 1500 24% -3% 100%
EU 435 478 485 617 518 16% -19% 35%
Canada 308 379 434 454 487 37% 7% 32%
Japan 76 105 111 102 101 25% -1% 7%
Hong Kong 116 163 115 78 69 -68% -13% 5%
China 45 62 73.6 77 71 37% -8% 5%
Others 160 203 213.5 222 254 37% 13% 17%

• Value of US wine exports totaled 1.5 billion - first time decline
since the economic crisis in 2008
• 35% (value) to EU, and 32% to Canada; followed by Japan, Hong
Kong and China
• Decreased exports driven by declines in trade volume to leading
destinations, except Canada
Primary Reasons
• Strong U.S. dollar
• Labor standoff along the West coast for several months
U.S. Wine Exports, 2014
Source: Wine Institute; Department of Commerce; Gomberg, Fredrickson and Associates, 2014

Per Capita Consumption of Wine by Country, 2008-2014 (in liters)
Source: Wine Institute; Department of Commerce; Gomberg, Fredrickson and Associates, 201
2008 2011 2014
%Change
2014/2008
Canada 10.91 11.7 14.75 26%
Hong Kong 3.75 5.14 8.57 56%
China 0.39 0.62 1.18 67%
Japan 2.54 4.13 2.73 7%
France 45.3 45.61 42.51 -7%
Italy 42.71 37.63 33.3 -28%
Spain 25.87 21.58 21.26 -22%
UK 19.75 20.03 21.99 10%
US 9.16 10.46 10.25 11%
Keep existing consumers and explore new markets

Outlook – New York Grapes
2015/2016
Crop value expected to be lower than the 2014 level
• An average growing season in 2015, except for Lake
Erie
• Estimated shortage of some vinifera and hybrid grapes
Shortage on Bordeaux Reds and Gewürztraminer
Concord: down 14% from 2015, close to 5-years
average
Niagara: below 5-year average in 2015 due to the
trunk damage in winter in most Niagara vineyards
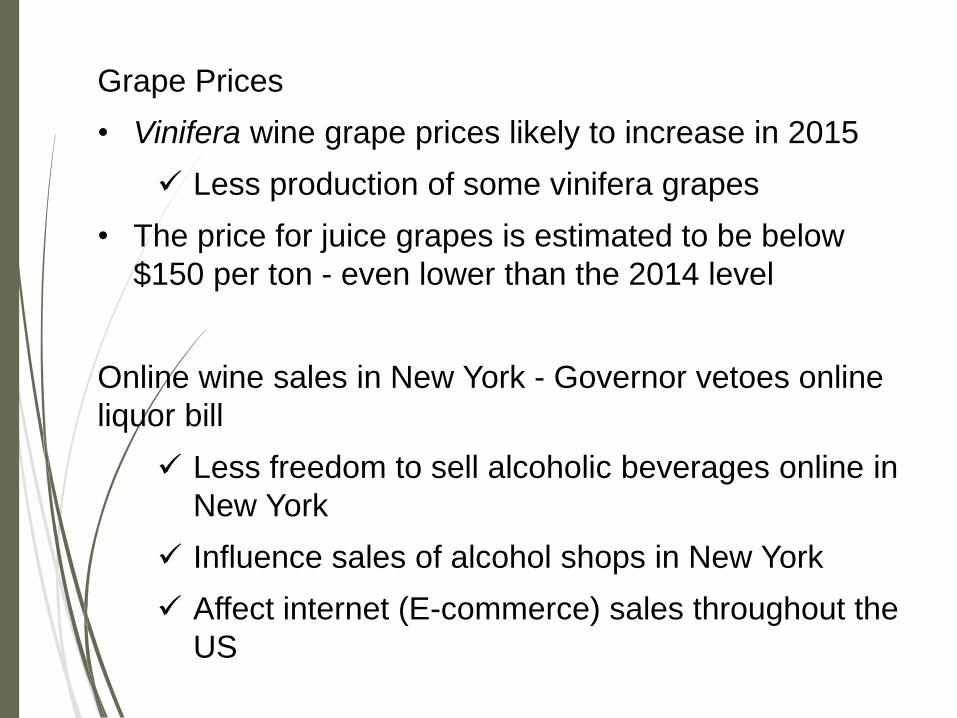
Grape Prices
• Vinifera wine grape prices likely to increase in 2015
Less production of some vinifera grapes
• The price for juice grapes is estimated to be below
$150 per ton - even lower than the 2014 level
Online wine sales in New York - Governor vetoes online
liquor bill
Less freedom to sell alcoholic beverages online in
New York
Influence sales of alcohol shops in New York
Affect internet (E-commerce) sales throughout the
US

U.S. grape production likely to decrease in 2015/2016
• Primarily due to lower production in California
Earliest harvest on record, wildfire during harvest, a fourth year of drought
• Expected lower grape production in Washington, New York, Oregon and Pennsylvania
Domestic grower prices for wine grapes are likely to go up
Outlook – U.S. Grapes
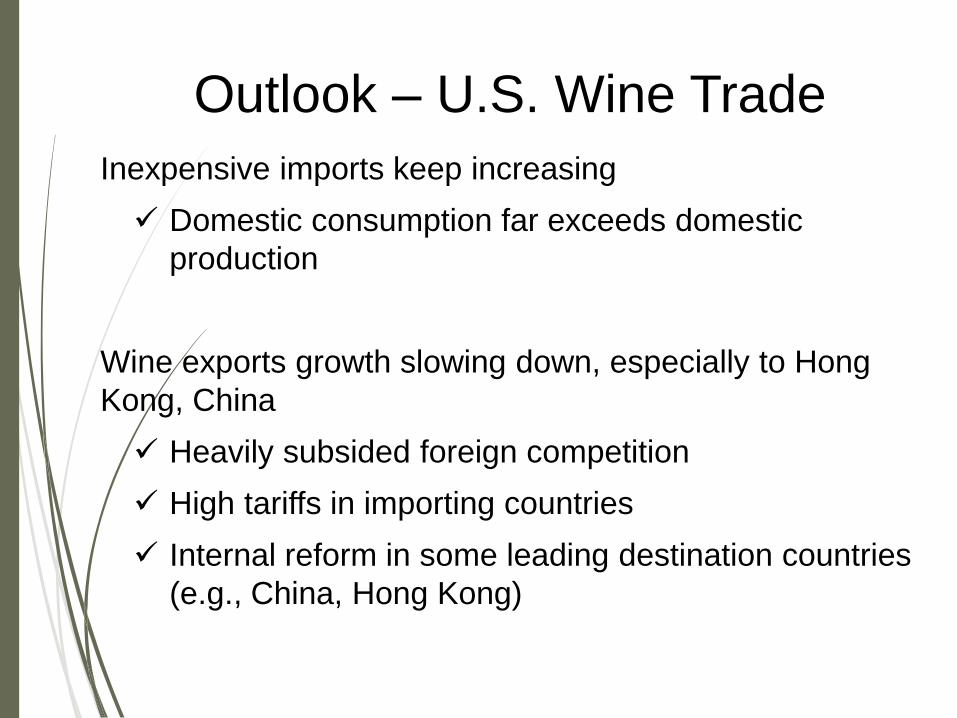
Inexpensive imports keep increasing
Domestic consumption far exceeds domestic
production
Wine exports growth slowing down, especially to Hong
Kong, China
Heavily subsided foreign competition
High tariffs in importing countries
Internal reform in some leading destination countries
(e.g., China, Hong Kong)
Outlook – U.S. Wine Trade
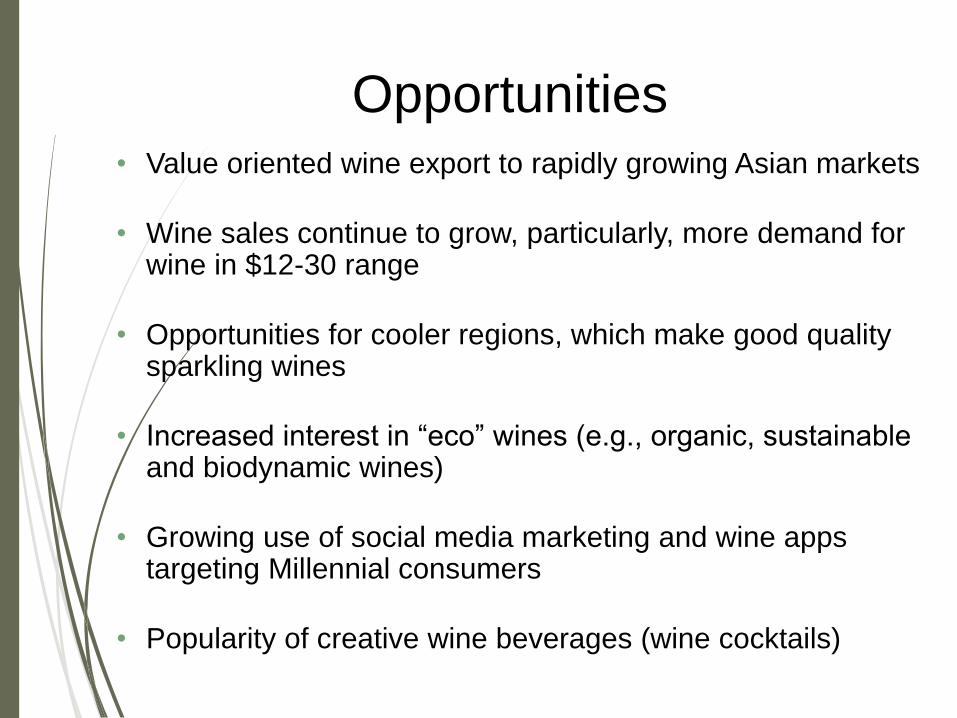
Opportunities• Value oriented wine export to rapidly growing Asian markets
• Wine sales continue to grow, particularly, more demand for wine in $12-30 range
• Opportunities for cooler regions, which make good quality sparkling wines
• Increased interest in “eco” wines (e.g., organic, sustainable and biodynamic wines)
• Growing use of social media marketing and wine apps targeting Millennial consumers
• Popularity of creative wine beverages (wine cocktails)

Red Blotch Economic Impact
Analysis: Preliminary Findings

• First discovered in California in 2008, GRBD has been
found across the United States
• In red-berried cultivars, visual GRBD foliar disease
symptoms include red blotches early in the season
• GRBD quality and yield impacts are still being
evaluated and understood
• GRBD has been associated with significant quality
impacts:
• Poor color development (pink fruit)
• Low sugar accumulation (reductions by 2-4 brix)
• Reduced complexity and flavor profile
What do we know about Grapevine Red Blotch Disease (GRBD)?

2015 Red Blotch Economic Impact:
Survey & methods
• 34 vineyard mangers and buyers
• Participants identified through
local extension partners (WSU,
CU, UC-COE).
• 3 states (CA, NY, WA)
• 4 distinct regions (Sonoma, Napa,
Southeast Washington, Suffolk
County).

Overall impact: Between $2,665 (5% initial
infection in year 3, 25% price penalty) and
$20,629 (60% initial infection in year 3, 100%
price penalty)
Suffolk County (Long Island), NY
$60,000.00
$50,000.00
$40,000.00
$30,000.00
$20,000.00
$10,000.00
$0.00
0% 10% 20% 30% 40% 50% 60% 70%
100% price penalty
no management Rogue and replant
Replant vineyard
$30,000.00
$20,000.00
$10,000.00
$0.00
0% 10% 20% 30% 40% 50% 60% 70%
Eco
no
mic
imp
act
(lo
sse
s $
/acr
e)
25% price penalty
no management Rogue and replant Replant vineyard

Ornamental Crops: Situation and Outlook

New York Floriculture – Growing Area: 2012-2014 (Operations with $10,000+ in sales)
Source: Floriculture Report, New York Field Office, NASS, USDA, 2015
Year
Total
greenhouse
Cover
Shade and
temporary
cover
Total
covered
area
Open
ground
Total covered & open
ground
-- 1,000 square feet -- --- acres ---
2012 26,377 353 26,730 694 1,308
2013 25,567 440 26,016 798 1,395
2014 19,660 319 19,979 835 1,294
a Includes operations with $10,000+ in annual floriculture sales. Crops include cut flowers, cut cultivated greens, potted
flowering plants, potted foliage plants, bedding and garden plants, and propagative materials. Total may not add due to
rounding.

Grower Cash Receipts of Floriculture Products,
New York, 2007-2014
100
120
140
160
180
200
220
2007 2008 2009 2010 2011 2012 2013 2014
Million dollars
Source: Floriculture Report, New York Field Office, NASS, USDA, 2015
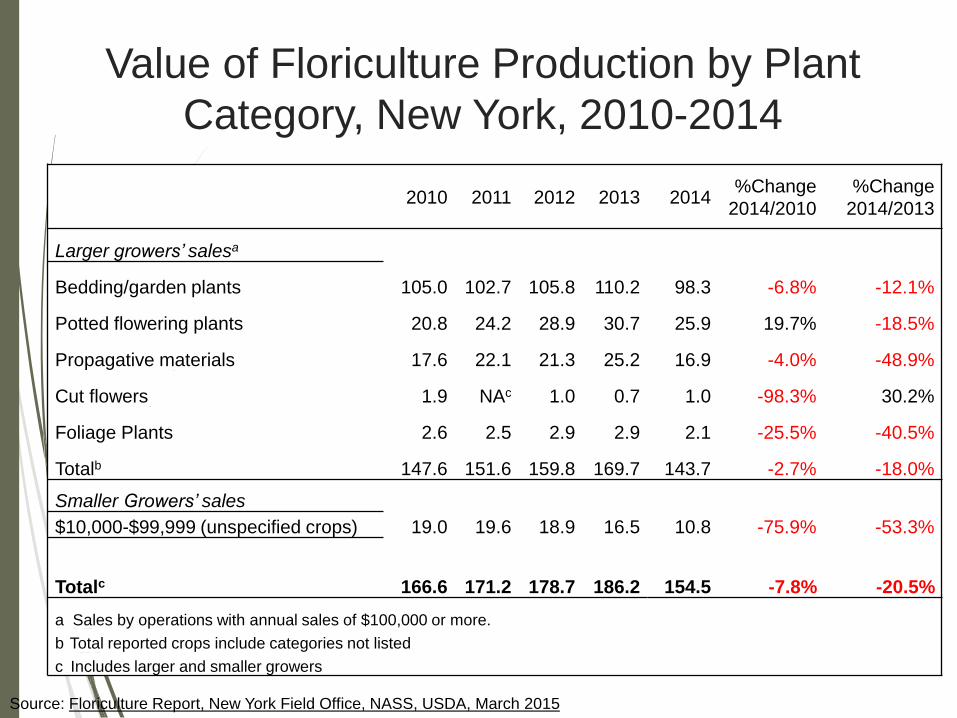
Value of Floriculture Production by Plant
Category, New York, 2010-2014
2010 2011 2012 2013 2014%Change
2014/2010
%Change
2014/2013
Larger growers’ salesa
Bedding/garden plants 105.0 102.7 105.8 110.2 98.3 -6.8% -12.1%
Potted flowering plants 20.8 24.2 28.9 30.7 25.9 19.7% -18.5%
Propagative materials 17.6 22.1 21.3 25.2 16.9 -4.0% -48.9%
Cut flowers 1.9 NAc 1.0 0.7 1.0 -98.3% 30.2%
Foliage Plants 2.6 2.5 2.9 2.9 2.1 -25.5% -40.5%
Totalb 147.6 151.6 159.8 169.7 143.7 -2.7% -18.0%
Smaller Growers’ sales
$10,000-$99,999 (unspecified crops) 19.0 19.6 18.9 16.5 10.8 -75.9% -53.3%
Totalc 166.6 171.2 178.7 186.2 154.5 -7.8% -20.5%
a Sales by operations with annual sales of $100,000 or more.
b Total reported crops include categories not listed
c Includes larger and smaller growers
Source: Floriculture Report, New York Field Office, NASS, USDA, March 2015
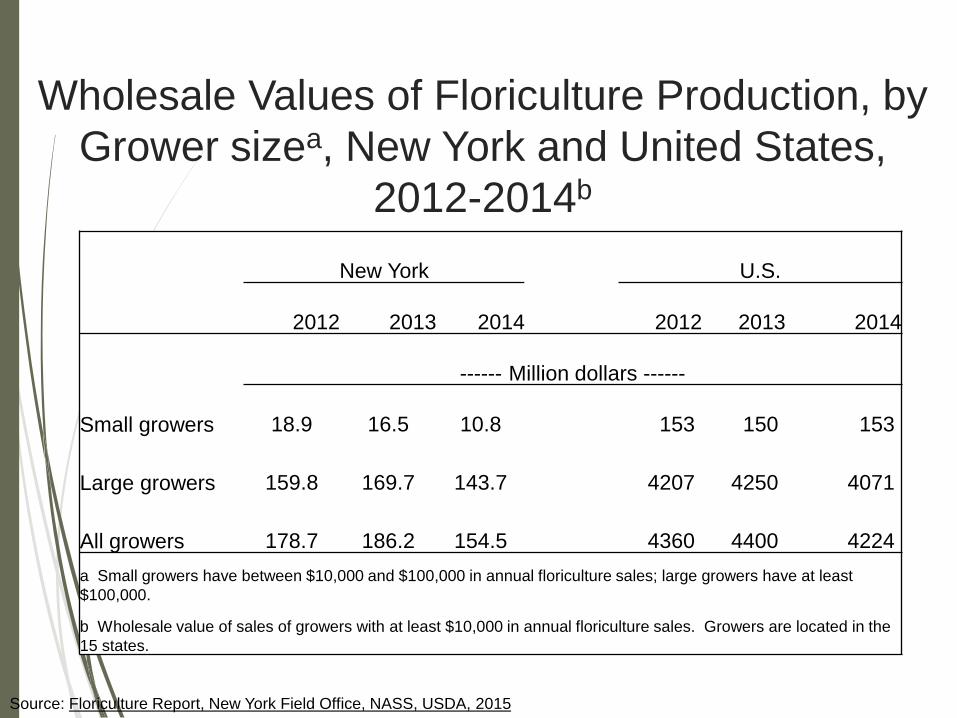
Wholesale Values of Floriculture Production, by
Grower sizea, New York and United States,
2012-2014b
New York U.S.
2012 2013 2014 2012 2013 2014
------ Million dollars ------
Small growers 18.9 16.5 10.8 153 150 153
Large growers 159.8 169.7 143.7 4207 4250 4071
All growers 178.7 186.2 154.5 4360 4400 4224
a Small growers have between $10,000 and $100,000 in annual floriculture sales; large growers have at least
$100,000.
b Wholesale value of sales of growers with at least $10,000 in annual floriculture sales. Growers are located in the
15 states.
Source: Floriculture Report, New York Field Office, NASS, USDA, 2015

Nursery Crops: Outlook
Source: Nursery Management’s 2015 State of the Industry Report
Average Profit Margins, 2014/2015
6%8%
26%
20%
13%
11%
8%
8%
6%
11%
15%
26%
14%
10%
5%
13%
Not profitable
Less than 5 percent
6 to 10 percent
11-20 percent
21-25 percent
More than 25%
Break even
Not sure
2014
2015

Nursery Crops: 2016 Outlook
Source: Nursery Management’s 2015 State of the Industry Report
• Majority (>50%) of growers confident that demand for
nursery crops will increase ─ expect to increase profit
margins in 2016
• 78% raised prices in 2015, and plan to increase prices
again in 2016
• Increased production of edibles, propagation materials,
container-grown perennials, container-grown shrubs
and container-growing trees in 2016
• Reduced production in field grown shrubs, field grown
perennials, and tropicals in 2016

Source: Nursery Management’s 2015 State of the Industry Report
Ornamental Crops: 2016 Outlook
Expected growth of 5-7% in 2016-2017
• Recovering job market
Consumers are more confident
More disposable income
• Healthy housing market (1.1-1.2 million new housing
units annually)
More demand for plant materials
Shortage of trees
Expect tree prices to increase
• Rising home values
Source: Nursery Management’s 2015 State of the Industry Report
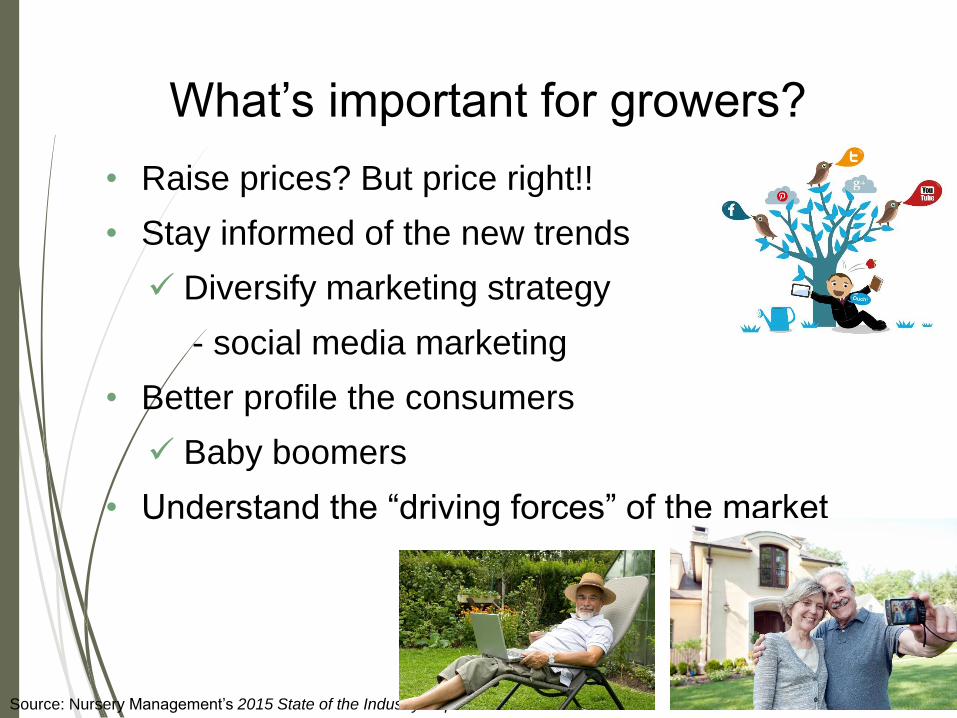
What’s important for growers?
• Raise prices? But price right!!
• Stay informed of the new trends
Diversify marketing strategy
- social media marketing
• Better profile the consumers
Baby boomers
• Understand the “driving forces” of the market

Thank you for your attention!
QUESTIONS?
Miguel. I Gómez
Dyson School of Applied Economics and Management
Cornell University
340D Warren Hall


![Outlook 2007 - calendarOffice 2007 [OUTLOOK 2007 - CALENDAR] 2 OUTLOOK 2007 CALENDAR FOLDER Outlook 2007 Calendar Window The Outlook 2007 Calendar Folder provides easy viewing of appointments,](https://static.fdocuments.us/doc/165x107/5f4d6a371177844bdc7827e3/outlook-2007-office-2007-outlook-2007-calendar-2-outlook-2007-calendar-folder.jpg)


