THE GOVERNMENT OF THE REPUBLIC OF SLOVENIA INSTITUTE OF MACROECONOMIC ANALYSIS AND DEVELOPMENT Iasi,...
21
THE GOVERNMENT OF THE REPUBLIC OF SLOVENIA INSTITUTE OF MACROECONOMIC ANALYSIS AND DEVELOPMENT Iasi, 26 SEPTEMBER 2008 Forecasting macroeconomic Forecasting macroeconomic variables with dynamic factor variables with dynamic factor models – The case of Slovenia models – The case of Slovenia Marko Glažar Marko Glažar
-
Upload
alfred-nigel-may -
Category
Documents
-
view
217 -
download
0
Transcript of THE GOVERNMENT OF THE REPUBLIC OF SLOVENIA INSTITUTE OF MACROECONOMIC ANALYSIS AND DEVELOPMENT Iasi,...

THE GOVERNMENT OF THE REPUBLIC OF SLOVENIA
INSTITUTE OF MACROECONOMIC ANALYSIS AND DEVELOPMENT
Iasi, 26 SEPTEMBER 2008
Forecasting macroeconomic Forecasting macroeconomic variables with dynamic factor variables with dynamic factor models – The case of Sloveniamodels – The case of Slovenia
Marko GlažarMarko Glažar

INSTITUTE OF MACROECONOMIC ANALYSIS AND DEVELOPMENT
Outline
Introduction Theoretical background Data Results
– Pseudo out-of-sample analysis– Past forecasts compared to realization
Conclusion
INSTITUTE OF MACROECONOMIC ANALYSIS AND DEVELOPMENT
IntroductionIntroduction
Dynamic factor models (DFM)– Used for forecasting, business cycle investigation, monetary
policy– IMAD uses DFM for forecasting growth of GDP and components– The forecasts are not official, used as a support for experts’
forecast
– The DFM approach was developed for IMAD by Igor Masten, University of Ljubljana, Faculty of Economics
– The model is more thoroughly described in IMAD working paper

INSTITUTE OF MACROECONOMIC ANALYSIS AND DEVELOPMENT
Theoretical backgroundTheoretical background
Nttt yyy ,...,1
ittiit ufLy )( )(,...,)( 1 LL irii
rttt fff ,...,1
Nttt uuu ,...,1
ittit ufy N ,...,1
• N series, vector in time t
• Each element can be represented as:
• vector lag polynomial – dynamic factor loading
• vector of r common factors
• idiosyncratic disturbance
• if is of a finite order q =1, then
• where
)(Li
Dynamic r – factor model:

INSTITUTE OF MACROECONOMIC ANALYSIS AND DEVELOPMENT
Theoretical backgroundTheoretical background The disturbances are unobserved and it holds:
( ) 0tE u 2 21( ) ( ,..., )t t NE u u diag
( ) 0tE f ( )t tE f f ( ) 0t tE f u
1
1 2,...,
1 1
min ( ) ( )T
N T
f f it i ti t
NT y f
1rT f f I
s.t.
For the strict factor model it holds:
A dynamic factor model can be estimated by principal components
For a known number of factors we have a nonlinear least square problem:
INSTITUTE OF MACROECONOMIC ANALYSIS AND DEVELOPMENT
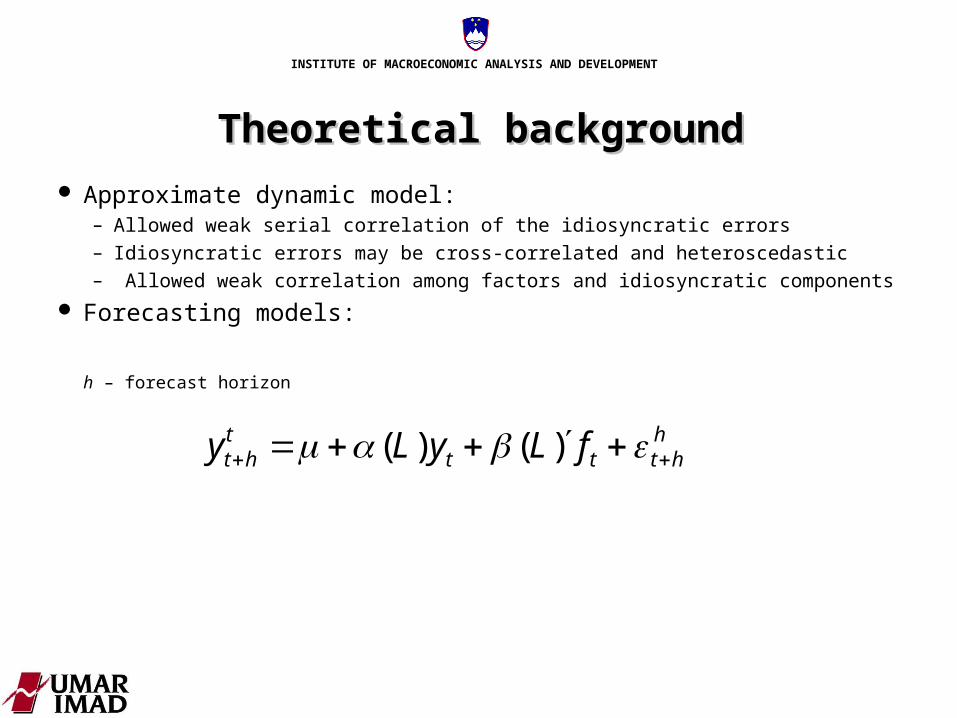
Theoretical backgroundTheoretical background Approximate dynamic model:
– Allowed weak serial correlation of the idiosyncratic errors– Idiosyncratic errors may be cross-correlated and heteroscedastic– Allowed weak correlation among factors and idiosyncratic components
Forecasting models:
h – forecast horizon
hhttt
tht fLyLy )()(

INSTITUTE OF MACROECONOMIC ANALYSIS AND DEVELOPMENT
Relative mean squared error is the measure for comparison of the models
hT
Tt
htht
hht
hT
Tt
hthti
hht
YY
YY
MSE2
1
2
1
2
|,0
2
|,
ˆ
ˆ
MSE of the factor models is compared to the MSE of the AR model in the pseudo out-of-sample analysis
Theoretical backgroundTheoretical background Altogether we have 158 different models. Differentiated by:
• Number of factors, unbalanced or balanced panel• Inclusion of the AR component• Inclusion of the factor lags• Inclusion of the intercept correction
INSTITUTE OF MACROECONOMIC ANALYSIS AND DEVELOPMENT
DataData
Dataset consists of 80 quarterly series, from 1994:– National account data– Survey data – confidence indicators– Prices– Foreign trade– Production indices– Labour market– Financial variables
Sources: Eurostat, Statistical Office of the Republic of Slovenia, Centre for European Economic Research, Bank of Slovenia, Ministry of Finance,…
INSTITUTE OF MACROECONOMIC ANALYSIS AND DEVELOPMENT
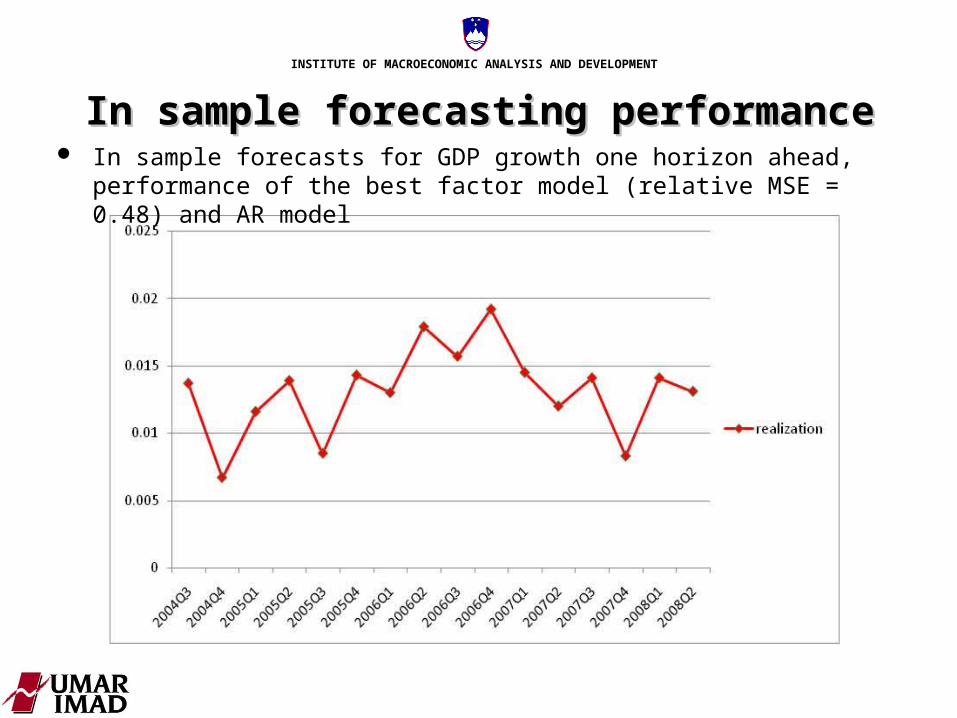
In sample forecastIn sample forecastinging performance performance In sample forecasts for GDP growth one horizon ahead, performance of the
best factor model (relative MSE = 0.48) and AR model

INSTITUTE OF MACROECONOMIC ANALYSIS AND DEVELOPMENT
In sample forecastIn sample forecastinging performance performance In sample forecasts for GDP growth one horizon ahead, performance of the
best factor model (relative MSE = 0.48) and AR model

INSTITUTE OF MACROECONOMIC ANALYSIS AND DEVELOPMENT
In sample forecastIn sample forecastinging performance performance In sample forecasts for GDP growth one horizon ahead, performance of the
best factor model (relative MSE = 0.48) and AR model

INSTITUTE OF MACROECONOMIC ANALYSIS AND DEVELOPMENT
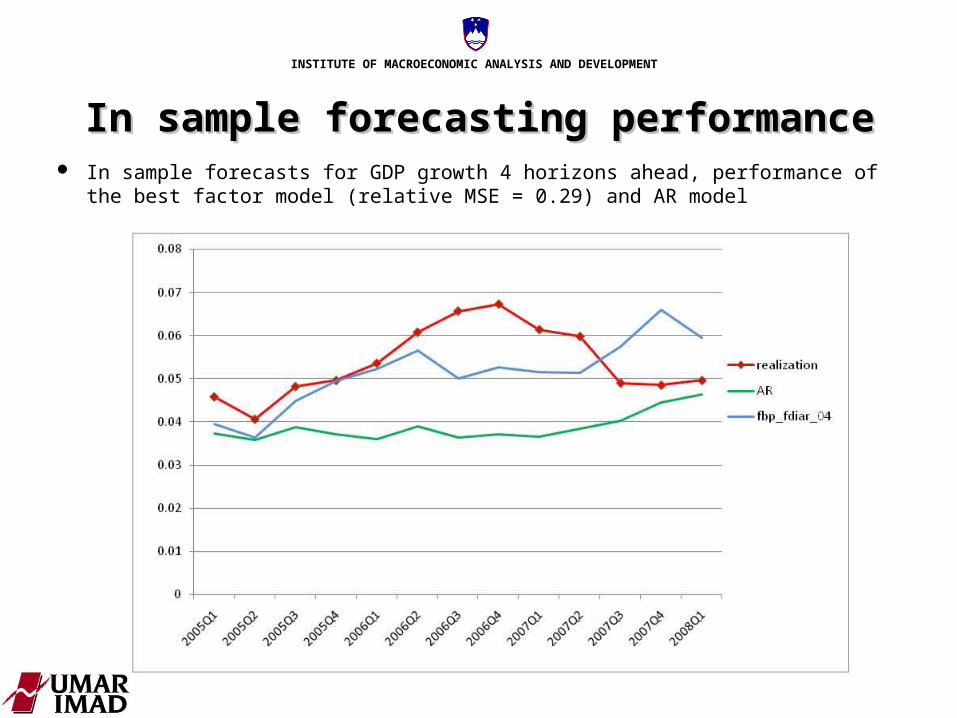
In sample forecastIn sample forecastinging performance performance In sample forecasts for GDP growth 4 horizons ahead, performance of the
best factor model (relative MSE = 0.29) and AR model

INSTITUTE OF MACROECONOMIC ANALYSIS AND DEVELOPMENT
In sample forecastIn sample forecastinging performance performance In sample forecasts for GDP growth 4 horizons ahead, performance of the
best factor model (relative MSE = 0.29) and AR model
INSTITUTE OF MACROECONOMIC ANALYSIS AND DEVELOPMENT
In sample forecastIn sample forecastinging performance performance In sample forecasts for GDP growth 4 horizons ahead, performance of the
best factor model (relative MSE = 0.29) and AR model
INSTITUTE OF MACROECONOMIC ANALYSIS AND DEVELOPMENT
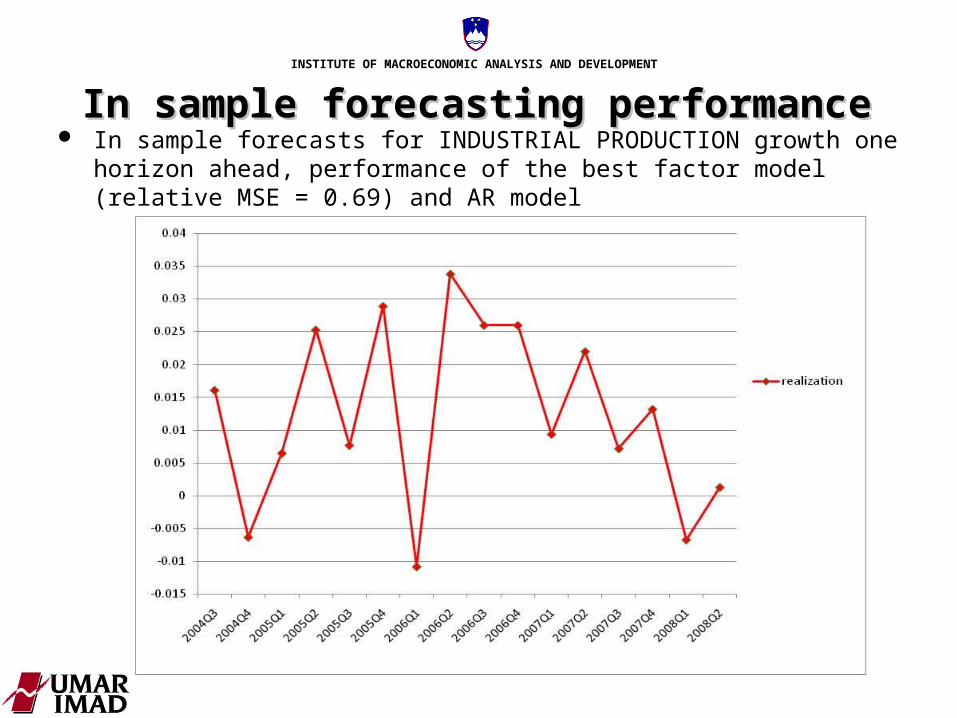
In sample forecastIn sample forecastinging performance performance In sample forecasts for INDUSTRIAL PRODUCTION growth one horizon
ahead, performance of the best factor model (relative MSE = 0.69) and AR model
INSTITUTE OF MACROECONOMIC ANALYSIS AND DEVELOPMENT
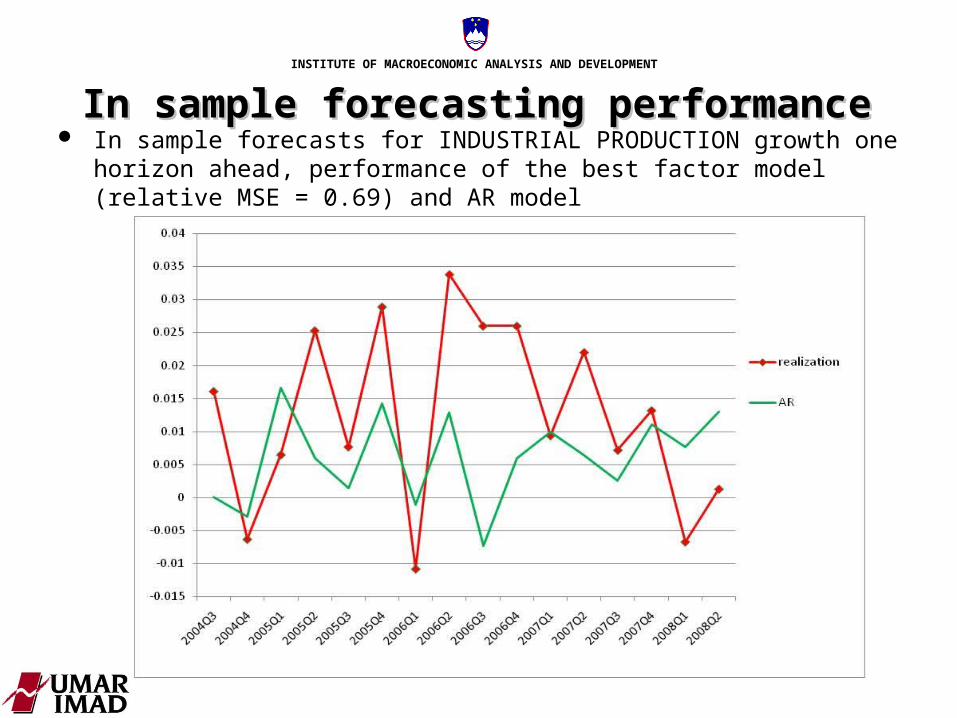
In sample forecastIn sample forecastinging performance performance In sample forecasts for INDUSTRIAL PRODUCTION growth one horizon
ahead, performance of the best factor model (relative MSE = 0.69) and AR model
INSTITUTE OF MACROECONOMIC ANALYSIS AND DEVELOPMENT
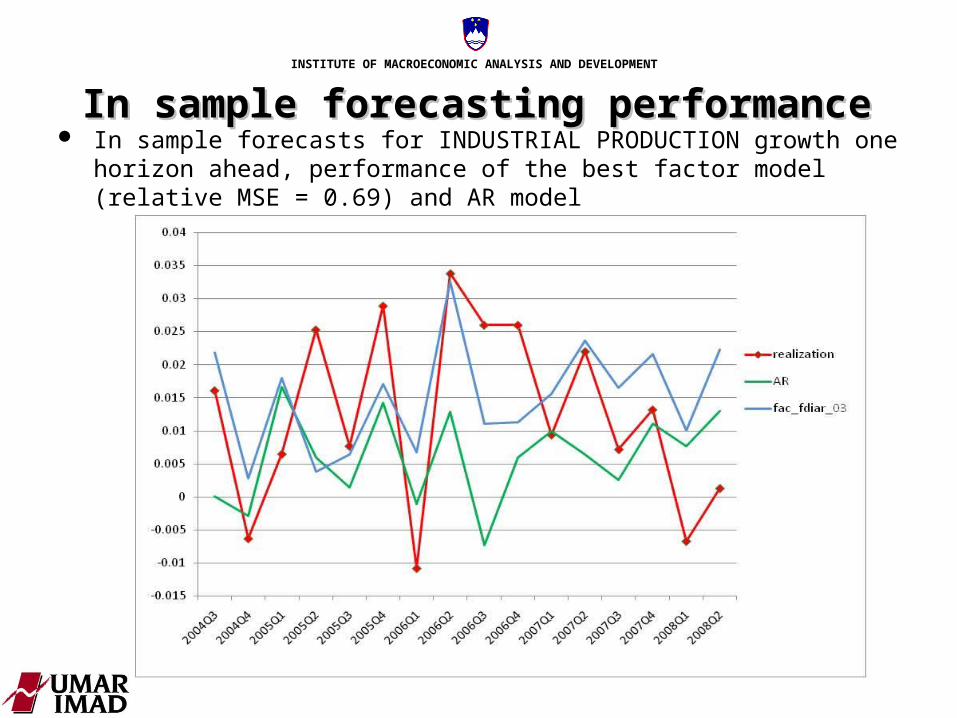
In sample forecastIn sample forecastinging performance performance In sample forecasts for INDUSTRIAL PRODUCTION growth one horizon
ahead, performance of the best factor model (relative MSE = 0.69) and AR model

INSTITUTE OF MACROECONOMIC ANALYSIS AND DEVELOPMENT
ForecastForecastinging performance for performance for annual GDP growthannual GDP growth
Forecasts for the year 2007
Forecasts for the year 2008
Data to Q406 Q107 Q207 Q307DFM forecasts 6.1 6.4 6.3 6.4official IMAD forecasts 4.7 5.8realization 6.1realization after revision 6.8
Data to Q207 Q307 Q407 Q108 Q208DFM forecasts 5.4 5.8 4.2 6.0 5.4official IMAD forecasts 4.6 4.4

INSTITUTE OF MACROECONOMIC ANALYSIS AND DEVELOPMENT
Forecasts with DFM for the year 2007 compared to the realization and IMAD official forecasts
ForecastForecastinging performance performance of the of the growth of GDP componentsgrowth of GDP components
Q406 Q107 Q207 Q307 realizationGFCF (seasonaly adjusted) 9.7 19.9 20.5 19.2 17.0GFCF - official IMAD forecasts 5.9 14.5 17.2IMP (seasonaly adjusted) 9.3 10.4 14.6 15.7 14.3IMP - official IMAD forecasts 8.7 14.2 14.1EXP (seasonaly adjusted) 9.6 13.6 14.5 15.1 13.3EXP - official IMAD forecasts 9.7 13.4 13.0

INSTITUTE OF MACROECONOMIC ANALYSIS AND DEVELOPMENT
Concluding remarksConcluding remarks
With a good dataset DFM perform better than simple AR models
We use additional improvements such as preselection of the
variables and use of lagged series in extracting the factors
Problem with the revisons of the data (by Statistical office)
We use the DFM also for forecasting inflation, using
disaggregated data on CPI components
INSTITUTE OF MACROECONOMIC ANALYSIS AND DEVELOPMENT
Reference:
IMAD Working Paper Series
http://www.umar.gov.si/en/publications/working_papers
Brezigar Masten A., Glažar M., Kušar J., Masten I.: Forecasting Macroeconomic Variables in Slovenia Using Dynamic Factor Models
Contact: