The Government Finance Database: A Common Resource for...
81
The Government Finance Database: A Common Resource for Quantitative Research in Public Financial Analysis Kawika Pierson, Mike Hand, and Fred Thompson Center for Governance and Public Policy Research Atkinson Graduate School of Management Willamette University 900 State Street Salem, Oregon 97301 Abstract Quantitative public financial management research is limited by the absence of a common database for empirical analysis (Gill and Meier 2000). While the U.S. Census Bureau distributes government finance data that some scholars have utilized, the arduous process of collecting, interpreting, and organizing the data has led its adoption to be prohibitive and inconsistent. In this article we offer a single, coherent resource that contains all of the census data from 1967-2011, uses easy to understand natural-language variable names, and will be extended when new data is available.
Transcript of The Government Finance Database: A Common Resource for...

The Government Finance Database: A Common Resource for Quantitative Research in Public Financial Analysis
Kawika Pierson, Mike Hand, and Fred Thompson Center for Governance and Public Policy Research
Atkinson Graduate School of Management Willamette University
900 State Street Salem, Oregon 97301
Abstract Quantitative public financial management research is limited by the absence of a common database for
empirical analysis (Gill and Meier 2000). While the U.S. Census Bureau distributes government finance
data that some scholars have utilized, the arduous process of collecting, interpreting, and organizing the
data has led its adoption to be prohibitive and inconsistent. In this article we offer a single, coherent
resource that contains all of the census data from 1967-2011, uses easy to understand natural-language
variable names, and will be extended when new data is available.

INTRODUCTION
Data drive the cumulative acquisition of scientific knowledge (Gill and Meier 2000). Widely shared,
coherent databases facilitate quantitative research and render the replication of findings practical and
convenient. Indeed, much of what we know about public finance has been tested against large microdata
sets – in the United States, primarily merged information files based on household-level data from the
IRS Individual Public-Use Tax Files, the Current Population Survey, the Consumer Expenditure Survey,
and the triennial Survey of Consumer Finances.
Unfortunately, students of public financial management must often rely on one-off, custom-built
datasets to pursue their inquiries, which is costly, inimical to replication, and leaves practitioners
uncertain about the utility of academic insights, or, worse, we eschew quantitative analysis altogether.
Indeed, less than half of all research in the field employs quantitative methods (Groeneveld et al. 2014).
For someone from outside the field of public financial management, the lack of coherent, widely
used data might seem an unlikely obstacle to the discovery of general truths. After all, students of public
financial management have access to a database that is in many respects ideally suited to their needs and
wide-ranging in its coverage. The field’s subjects are governmental entities, how they source and use
cash, and the consequences of alternative ways of getting and deploying public monies. The U.S. Census
Bureau has surveyed state and local governments annually since 1967. And, as the Director of the U.S.
Census Bureau stated in a letter accompanying the 2013 request for financial information: “This survey is
the only comprehensive source of information on the finances of local governments in the United States.”
The problem with the U.S. Census Bureau’s annual surveys of state and local government
finances is that the data retrieved from the census require substantial effort to interpret, translate,
consolidate, and use. Arguably, the situation is similar to the situation in corporate finance prior to the
availability of the CRSP-COMPUSTAT database of stock prices and accounting data. Accounting data
were available from the Securities and Exchange Commission and data on share prices could be obtained
from various vendors, but merging and matching observations from these files was prohibitively costly.

Consequently, the data were rarely used and, when they were, it was nearly impossible to explain, let
alone resolve, the numerous discrepancies in the findings that resulted, which held back sustained
intellectual progress in the field. Corporate financial research no longer suffers from this problem.
Comprehensive, useable data about financial markets is now universally available. The CRSP-
COMPUSTAT database supports much of the research in the field and has secured its sustained progress.
This article describes the steps we have taken to make the Census Bureau’s annual surveys of
state and local government finances equally easy to interpret, translate, consolidate, and use. It offers a
single, comprehensive database of government-finance statistics,1 which includes detailed financial data
from states, municipalities, townships, special districts, and school districts for the years 1967 through
2011, processed to make it user friendly – uncomplicated to use and convenient for replication.
We will demonstrate some applications of the database, but its potential for scholarly inquiry is
staggering. The data include extensive information on government revenue from both tax and non-tax
sources, facilitating a more general understanding of strategies to increase revenue streams (Mikesell and
Ross 2012), the interdependencies of local government and school district revenue (Kurban et al. 2012),
or the budgetary impacts of revenue diversity (Chapman and Gorina 2012), just to name a few
possibilities.
The data include detailed breakdowns of expenditures by both type and function, which can propel
answers to questions about spending on education and transportation (Witko and Newmark 2010), the
importance of the business cycle for budgets (Hou 2006), geographic impacts on categories of municipal
spending (Vallés-‐Giménez and Zárate-‐Marco 2011), or the applicability of aggregate budget functions
(Breunig et al. 2010). The database also contains information about the cash positions of governments,
the issuance and retirement of debt, and the investments of social insurance trusts.
The applicability of the data is perhaps best exemplified by the fact that the Census Bureau’s annual
surveys of state and local government finances have been used by researchers across disciplines. Recent
1 http://www.willamette.edu/mba/research_impact/2014/public_datasets.html

examples include Gore (2004), Baber and Gore (2008), Kido et al. (2012), Murray et al. (1998), Carroll
(2009), Mullins (2004), and Fisher and Papke (2000), among others. However, no research has presented
the data as comprehensively, continuously, or coherently as we do here.
The diversity of treatments and time horizons in work using Census of Governments data isn’t
surprising given the investment of time and resources necessary to work with the data in its raw state, but
it is potentially damaging to the interpretation and application of research in our field. By consolidating
the Census Bureau’s data into a single, coherent database we hope to alleviate these concerns and move
quantitative research in public finance progressively forward.
Some caveats are appropriate however. The government finance database is an imperfect resource. In
particular the data do not include measures of accomplishment or effort, except where money spent is a
reasonable proxy for the latter, and so the database must be supplemented if such measures are important
to the question being studied, e.g. by merging it with performance data, such as the Texas school-district
performance data (Meier et al. 2010). However, given the push towards both methodological (Krause and
Meier 2003) and theoretical (Kelman 2005) innovation in public administration research, and given the
existing diversity the field displays in those areas (see for instance Bartle 2001 or Raadschelders 2013)
this breadth of financial information provided from a single, standardized source has the potential to
streamline and facilitate a diverse body of inquiry.
After explaining the overall structure of the data, what variables are included, and how the data is
transformed from its raw state, we will transition to discussing several insights that arose from our initial
analysis. These include examples of using the data to better understand patterns in government finance,
and important advice for other researchers working with the database.
THE GOVERNMENT FINANCE DATABASE
The basic unit of reporting in government accounting is the fund, essentially a separate bucket of financial
resources tasked with accomplishing some objective (GASB 1). While more recent accounting guidance
mandates that some government-wide information be reported in addition to fund level reports (GASB
34), the census extends this reference frame by consolidating information across funds and presenting all
of its data on a government-wide basis. This approach is broadly beneficial for studies that seek to
understand something about governments as separate financial entities, and better conforms to the way
that citizens and financial intermediaries (as opposed to governmental managers charged with oversight)
use government accounting data (Voorhees and Kravchuk 2001)2.
The data are reported in thousands of nominal dollars, unadjusted for changes in prices or wages
over time, allowing researchers to choose whether and how best to convert the information into real
dollars. The time period represented in the data is 1967-2011, however the number of governments
included varies significantly from year to year. The primary source of this variation is the fact that the
Census Bureau collects financial data from governments in two separate, but related efforts. During years
ending in a 2 or 7 the government collects a census (essentially a population) of government financial
statistics in the “Census of Government Finance and Employment Data”. Every year when a census is not
being conducted a sample of governments report data through the “Annual Survey of State & Local
Government Finances”.
The data include federal3 (type 6), state (type 0), county (type 1), municipal (type 2), township
(type 3), special district (type 4), and school district data (type 5), each of which can be isolated by
censoring the data on the “Type_Code” variable. While every state is included in the sample every year
the coverage for other government types is less complete. Figure 1 shows the number of governments of
each type that are included in the data each year.
2 While many government funds report information on a modified-‐accrual basis, some are required to report using a cash basis, a modified cash basis, or (rarely) a full accrual basis (Ingram 1984). This diversity of reporting practices within and across governments presents some difficulty to anyone attempting to present, or utilize government financial data in a consistent manner. Given that a transformation of data between the different accounting treatments is not possible the census adopts the accounting basis declared by each government fund “so long as that basis (1) conforms to generally accepted accounting procedures and (2) is applied consistently from year-‐to-‐year.” In practice this means that the data are best conceptualized as roughly equivalent to cash flows, even though they will not always represent actual cash flows during the periods reported. 3 The federal data were not produced by the census after 1995.

FIGURE 1
Report Counts by Government Type and Year
0
500
1000
1500
2000
2500
3000
3500
1967 1972 1975 1978 1981 1984 1987 1990 1993 1996 1999 2002 2005 2008 2011
Records County
0 2000 4000 6000 8000 10000 12000 14000 16000 18000 20000
1967 1972 1975 1978 1981 1984 1987 1990 1993 1996 1999 2002 2005 2008 2011
Records
Axis Title
Municipality
0 2000 4000 6000 8000 10000 12000 14000 16000 18000
1967 1972 1975 1978 1981 1984 1987 1990 1993 1996 1999 2002 2005 2008 2011
Records
Axis Title
Township
0 5000 10000 15000 20000 25000 30000 35000 40000
1967 1972 1975 1978 1981 1984 1987 1990 1993 1996 1999 2002 2005 2008 2011
Records
Axis Title
Special District

Figure 1 highlights several important insights into the coverage of the data over time. Reporting rates are
uniformly high during years when a full census was conducted. In addition, school districts report at
much higher rates than other governments, but show a large reduction in reporting during the years
between 1993 and 1996. Closer examination of the data for other government types shows a similar (but
less visually pronounced) reduction in coverage during those years. In 1993 the census began sampling a
smaller, but still significant, portion of all government types. Because of their work with the National
Center for Education Statistics, the census was able to resume nearly complete coverage of school
districts following the 1997 census, but the other government types were never again sampled at the
levels seen in the late 1980’s.
Census Data Codes One of the largest hurdles in the process of organizing the census’ government financial information as a
single, coherent database is learning to interpret the codes used by the census to identify what each data
point represents. The database we present replaces these codes with natural language variable names
borrowed from the census’ classification manual, however understanding the codes that the census uses
internally will help readers to validate, interpret, and apply our work.
Each census code combines an “object code” with a “function code”. Object codes are one
character long and represent large categories or types of data. For instance, the object code T is used for
all tax revenues. Function codes are double digit numbers that indicate what the funds in question were
used for. Combining an object code, such as A, for current charges, with a function code, such as 12, for
0 2000 4000 6000 8000 10000 12000 14000 16000
1967 1972 1975 1978 1981 1984 1987 1990 1993 1996 1999 2002 2005 2008 2011
Records
Axis Title
School District

elementary and secondary education, results in a pointer to a particular variable, in this case A12: current
charges from elementary and secondary education 4.
Revenue At a high level the data for each government are grouped into four large categories: revenue flows,
expenditure flows, cash and investment positions, and debt positions.
The revenue data are organized by sector into general revenue, utility revenue, liquor store
revenue, and social insurance trust revenue. Each of these sectors is comprised of a number of smaller
subcategories, as shown in table 1.
TABLE 1 Revenue Categories
Revenue Categories Census Object Description General Revenue T B C D A U All revenue not arising from utilities, liquor stores, or
social insurance Taxes T All taxes other than those assessed for social insurance Intergovernmental Revenue B C D Transfers to the government from others, including
grants and shared taxes From Federal B Intergovernmental revenue from federal sources From State C Intergovernmental revenue from state sources From Local D Intergovernmental revenue from local sources Current Charges A Fees collected for providing services, other than utility
service charges or liquor store charges Miscellaneous General Rev U Other general revenue from a government’s own
sources Utility Revenue A Revenue from providing water, electric, gas, or
transportation services Liquor Store Revenue A Sales revenue from government run liquor stores Social Insurance Trust Rev X Y Contributions and investment earnings (or losses) for
all social insurance programs. Retirement Plans X Contributions and investment earnings (or losses) for
public employee retirement programs Unemployment Revenue Y Contributions and investment earnings (or losses) for
the unemployment compensation insurance system Note: This table shows the high-level organization of the different revenue variables in the database. It references the census object categories used to create these categories, and provides a short description of each. The indentation of the variables in the first column indicates how subcategories of data collapse into larger categories. More detailed descriptions of each category can be found in the Census’ 2006 classification manual (http://www.census.gov/govs/classification/).
4 Function codes are not applied consistently across the entire data set, but are still useful to understanding data within large sections of it. For instance, the function code 01 represents property taxes whenever it is used with object code T, but represents air transportation with every expenditure object code.

TABLE 2
Tax Revenue Categories Tax Revenue Categories Census
Code Description
Total Taxes The sum of all of the tax categories Property Tax T01 All taxes on property that use its value as a basis Total Sales Taxes The sum of general and selective sales taxes General Sales Tax T09 Taxes on the sale of all types of goods and services Total Selective Sales Taxes The sum of the eight selective sales tax categories Alcoholic Beverage T10 Sales taxes on government and private sales of alcohol Amusement T11 Sales taxes on all types of amusement businesses Insurance Premium T12 Sales taxes on insurance Motor Fuel T13 Sales taxes on fuels for vehicles and aircraft Pari-mutuels T14 Sales taxes on wagers and betting Public Utilities T15 Sales taxes on government owned utilities Tobacco T16 Sales taxes on tobacco products Other Selective Sales Tax T19 All other selective sales taxes Total License Taxes The sum of the nine licensing tax subcategories Alcoholic Beverage T20 Licenses pertaining to alcohol Amusement T21 Licenses pertaining to amusement businesses Corporate T22 Licenses pertaining to all corporations Hunting and Fishing T23 Licenses pertaining to hunting and fishing Total Motor Vehicle The sum of motor vehicle and operator licenses Motor Vehicle T24 Licenses pertaining to the right to operate a vehicle
(Registration, plates, inspection ect.) Operator Licenses T25 Licenses pertaining to the right to drive in general Public Utility T27 Licenses imposed on public utilities Occupation and business T28 Licenses for certain professions and businesses Other Licenses T29 All other licenses. Total income Taxes The sum of individual and corporate income taxes. Individual T40 Taxes on the income of individuals Corporate T41 Taxes on the income of corporations Death and Gift Tax T50 Taxes on the transfer of property after death Documentary Tax T51 Taxes on the transfer of documents Severance Tax T53 Taxes on the removal of natural resources Taxes NEC T99 All other taxes not listed above Note: This table gives a detailed breakdown of the different tax revenue data reported. NEC stands for not elsewhere classified. The indentation of the variables in the first column indicates how subcategories of data collapse into larger categories. More detailed descriptions of each category can be found in the Census’ 2006 classification manual (http://www.census.gov/govs/classification/).

The revenue data within each subcategory are further broken down in order to identify more specific
sources of funds. Tax revenues have the largest number of subcategories in the data. Table 2 summarizes
the organization of tax revenue subcategories.
Intergovernmental revenue data is first separated based on its source (from the federal, state, or
local government) as shown in table 1. Within each of these sources intergovernmental revenue is
categorized by its intended use. Table 3 displays this structure.
TABLE 3 Intergovernmental Revenue Functions
Intergovernmental Revenue Categories
Census Number
Description
Air Transportation 01 Aid in support of public airports Interschool revenue 11 Aid from one school district to another (schools only) Education 21 Aid for public schools Employment Security 22 Transfers to the states from the federal government for
unemployment insurance General Support 30 Aid that can be applied for any purpose Health and Hospitals 42 Aid intended for public health or hospitals Highways 46 Aid to be used for roads, streets, and highways Transit Subsidies 94 Aid for mass transit systems Housing and Community Dev 50 Aid for public housing and other community development Natural Resources 59 Federal aid for conservation resource protection Public Welfare 79 Aid for social welfare programs Sewerage 80 Aid for sewage systems, disposal and treatment Other Uses 89 All other aid not classified above Note: This table describes a detailed breakdown of the different intergovernmental revenue function codes reported by governments in the data. More detailed descriptions of each function code can be found in the Census’ 2006 classification manual (http://www.census.gov/govs/classification/).
The precise application of each of these categories changes somewhat based on the source of the
intergovernmental revenue. For instance federally sourced intergovernmental revenue for public welfare
includes programs such as TANF (Temporary Assistance for Needy Families) and Medicaid, whereas
state sourced intergovernmental revenue for public welfare includes pass-through of these programs, as
well as revenue arising from state specific programs. An exhaustive documentation of what each variable
contains and excludes is available in the census classification manual.
Current charges are amounts that the government collects from individuals and corporations in
exchange for providing services. They are reported in gross amounts, ignoring any cost of service. Liquor

stores and utilities are excluded from current charges and given their own category of revenue in order to
distinguish them from general revenue. Charges are separated based on the type of service provided as
shown in table 4.
TABLE 4 Current Charge Functions
Charge Functions Census Number
Description
Total General Charges The sum of all charges Airport Charges 01 Charges relating to air transportation Misc. Commercial Charges 03 Charges from all publicly owned enterprises NEC Total Education Charges The sum of the three education subcategories Total Elem-Secondary The sum of the next three variables School Lunch 09 Revenue from the sale of milk and school lunches Tuition 10 Charges for tuition and transportation Other 12 Other charges (athletics, textbooks ect.) Higher Education 16 18 All charges from public higher education All Other Education 21 Charges from all other state or federally run schools Hospital Charges 36 Charges for care in publicly run hospitals Total Highway Charges The sum of the two following variables Regular Highways 44 Assessments and fees for the maintenance of non-toll roads Toll Highways 45 Fees from toll roads Housing and Com Dev 50 Revenue from the rental of public housing Natural Resources 56 59 Charges from forestry and other natural resources Parking Charges 60 Charges from on and off-street parking, and lots Parks and Recreation 61 Revenue from facilities, parks, stadiums ect. Sewerage 80 Charges for sewage connection, collection and disposal Solid Waste Management 81 Fees from garbage collection and the operation of landfills Water Transport 87 Charges relating to port terminals and canal operation All Other General Charges 89 All charges NEC Note: This table describes a detailed breakdown of the different current charge function codes reported in the data. NEC stands for not elsewhere classified. The indentation of the variables in the first column indicates how subcategories of data collapse into larger categories. More detailed descriptions of each function code can be found in the Census’ 2006 classification manual (http://www.census.gov/govs/classification/).
Liquor store and utility revenue are not disaggregated to the extent that other revenue data is. Total liquor
store revenue is reported, and utility revenue is broken into revenue from each of the four types of
utilities: water, electricity, gas, and mass transit.
Several categories of general revenue are listed under miscellaneous general revenue. Their
organization is shown in table 5.

TABLE 5 Miscellaneous General Revenue Variables
Variable Name Census Code
Description
Total Charges and Misc. Revenue The sum of total charges and total misc. revenue Total Misc. General Revenue The sum of the seven variables below Special Assessments U01 Charges to individuals benefiting from improvements Property Sale Other U11 Gross receipts from all property sales Interest Revenue U20 Interest earnings from all sources Fines and Forfeits U30 Revenue from legal penalties Rents and Royalties U40 U41 The sum of rent and royalty income Net Lottery Revenue U95 Lottery proceeds net of the cost of prizes Misc. General Revenue NEC U99 All general revenue NEC Note: This table describes the coding of the miscellaneous revenue variables and provides a short description of each. NEC stands for not elsewhere classified. The indentation of the variables in the first column indicates how subcategories of data collapse into larger categories. More detailed descriptions of each variable can be found in the Census’ 2006 classification manual (http://www.census.gov/govs/classification/).
TABLE 6
Insurance Trust Revenue Variables Variable Name Census
Code Description
Total Insurance Trust Revenue The sum of all insurance trust revenue Total Insurance Trust Contributions The sum of the contribution variables below Total Trust Investment Revenue The sum of the investment variables below Total Retirement Plan Revenue The sum of all retirement plan revenue Total Retirement Contributions The sum of the following four contribution variables Local Government Employees X01 Contributions from employees of local governments State Government Employees X04 Contributions from employees of state governments From Other Governments X05 Contributions coming from other governments Contribution to Own System X06 Contributions to the government’s own system Investment Earnings X08 All earnings on the investments of the retirement plan Total Unemployment Revenue The sum of the following three variables Unemployment Payroll Tax Y01 Included in total insurance trust contributions Unemployment Interest Revenue Y02 Included in total investment revenue Unemployment Federal Advances Y04 Funds received when taxes and investments cannot
cover the benefits due to unemployed workers Note: This table describes the coding of the social insurance trust revenue variables and provides a short description of each. NEC stands for not elsewhere classified. The indentation of the variables in the first column indicates how subcategories of data collapse into larger categories. More detailed descriptions of each variable can be found in the Census’ 2006 classification manual (http://www.census.gov/govs/classification/). The last category of revenue is revenue from social insurance trusts. Insurance trust revenue is separated
into retirement plan revenue and unemployment revenue, and several smaller partitions of both are
reported as shown in table 6.

Expenditure Expenditures are organized according to their category and function. The category of each expenditure
refers to how the cash was used, while the function of the expenditure refers to the type of service it was
used to accomplish. In general every expenditure variable is a combination of one category and one
function, following the logic of the census codes. For instance, “Air Transportation Capital Outlay” is in
the capital outlay category and was used for the air transportation function.
Table 5 shows the different categories of expenditures that are recorded in the data. Total
expenditures are the sum of direct expenditures and intergovernmental expenditures. Direct expenditures
can further be broken down into current expenditures used to pay employees, purchase supplies and hire
contractors; construction expenditures used to build long term assets; and expenditures used to purchase
(rather than build) long term assets. Capital outlay expenditures are the sum of construction and purchase
expenditures.
Intergovernmental expenditures are defined by the census as “as amounts paid to other
governments for performance of specific functions or for general financial support.” They are included in
total expenditure, and are separated based on whether the funds went to state governments or local ones.
In a very small number of instances5 assistance, subsidies, and interest on debt are added to direct
expenditures and total expenditures. When this occurs the data always include a separate line item
reporting the amount of assistance, subsidies, or interest, allowing researchers to correct for this if
necessary.
TABLE 5
Expenditure Categories Expenditure Categories Census Object Description Total E F G L M The sum of all expenditures
5 Assistance and subsidies are coded by the census as object J, and occur four times in the data: state government scholarships (J19), federal categorical assistance programs (J67), other cash assistance programs (J68), and federal and state veterans’ services (J85). Interest on debt is coded by the census as object I and occurs five times: interest on general debt (I89), and interest on debt for the four classes of utilities (I91, I92, I93, and I94).

Direct E F G Current expenditures (such as salaries and supplies), plus any expenditures for capital improvements
Capital Outlay F G Purchase or construction of capital improvements Construction F Construction expenditures only Intergovernmental to State L Paid to state governments for performance of functions
or aid related to those functions Intergovernmental to Local M Paid to local governments for performance of functions
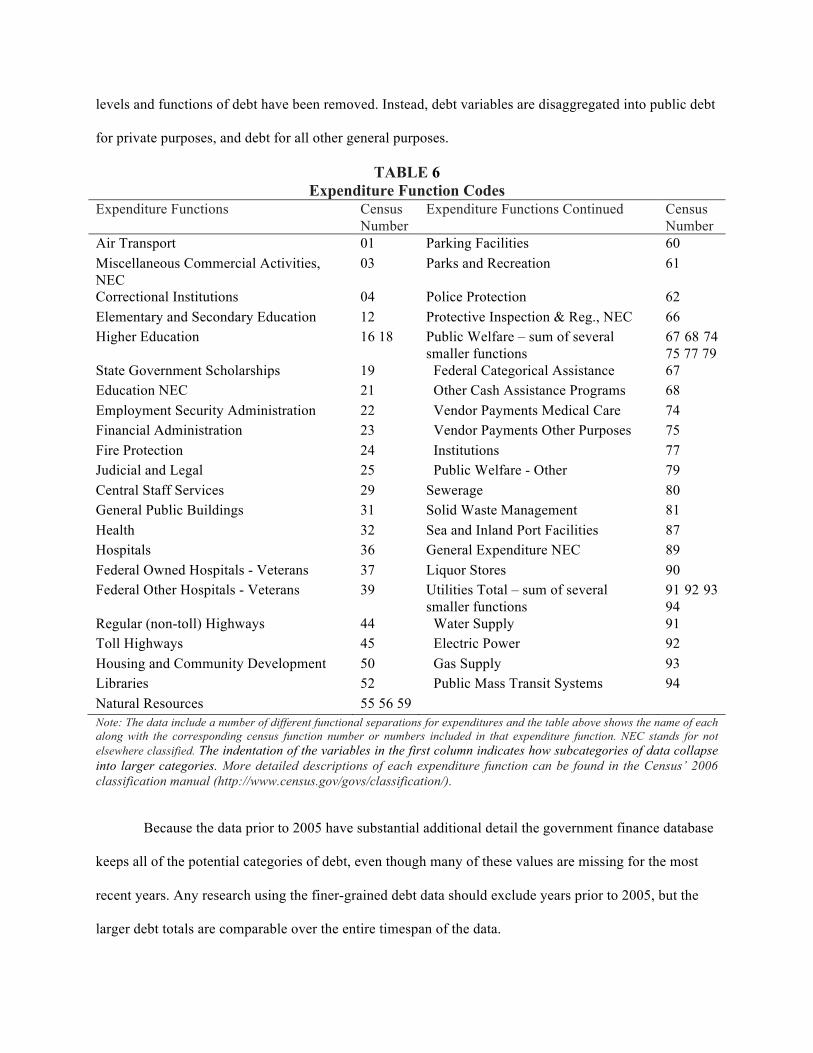
or aid related to those functions Note: Every set of expenditure data follows a similar organization. This table shows users of the data how to interpret the names given to the variables in the database, references the census object codes used to create them, and provides a short description of each. The indentation of the variables in the first column indicates how subcategories of data collapse into larger categories. More detailed descriptions of each category can be found in the Census’ 2006 classification manual (http://www.census.gov/govs/classification/). Expenditures are also separated by function within the database. Table 6 shows the various expenditure
functions considered in the data and the census function codes that correspond to them. Some of the
expenditure functions recorded by the census only exist at the federal level and have been excluded from
the database otherwise. Other codes exist in the newest census data but do not exist for years prior to 2007
and have been removed or consolidated into their earlier versions to create a more coherent database.
Cash and Investment Positions Several of the cash and investment positions of each government are recorded in the data. Other current
and long term assets, such as those recorded on a typical statement of net position are not included by the
census. A summary of these variables is shown in table 7.
Debt Positions Debt statistics were significantly simplified following the 2005 redesign of the Census’ government
finance statistics program. Prior to this simplification data on debt were separated based on whether the
debt was issued with the backing of the full faith and credit of the government in question, whether it was
not guaranteed, or whether the guarantee was unspecified. Within each of those categories the debt was
broken out by function: debt to be used for each of the four utilities (water, electric, gas, and transit),
general use debt, elementary and secondary education debt, or higher education debt. Measures of debt
outstanding, debt issued, and debt retired were recorded for each of these guarantees and functions. Debt
outstanding, issued, and retired are still reported variables, but the distinctions between the guarantee
levels and functions of debt have been removed. Instead, debt variables are disaggregated into public debt
for private purposes, and debt for all other general purposes.
TABLE 6 Expenditure Function Codes
Expenditure Functions Census Number
Expenditure Functions Continued Census Number
Air Transport 01 Parking Facilities 60 Miscellaneous Commercial Activities, NEC
03 Parks and Recreation 61
Correctional Institutions 04 Police Protection 62 Elementary and Secondary Education 12 Protective Inspection & Reg., NEC 66 Higher Education 16 18 Public Welfare – sum of several
smaller functions 67 68 74 75 77 79
State Government Scholarships 19 Federal Categorical Assistance 67 Education NEC 21 Other Cash Assistance Programs 68 Employment Security Administration 22 Vendor Payments Medical Care 74 Financial Administration 23 Vendor Payments Other Purposes 75 Fire Protection 24 Institutions 77 Judicial and Legal 25 Public Welfare - Other 79 Central Staff Services 29 Sewerage 80 General Public Buildings 31 Solid Waste Management 81 Health 32 Sea and Inland Port Facilities 87 Hospitals 36 General Expenditure NEC 89 Federal Owned Hospitals - Veterans 37 Liquor Stores 90 Federal Other Hospitals - Veterans 39 Utilities Total – sum of several
smaller functions 91 92 93 94
Regular (non-toll) Highways 44 Water Supply 91 Toll Highways 45 Electric Power 92 Housing and Community Development 50 Gas Supply 93 Libraries 52 Public Mass Transit Systems 94 Natural Resources 55 56 59 Note: The data include a number of different functional separations for expenditures and the table above shows the name of each along with the corresponding census function number or numbers included in that expenditure function. NEC stands for not elsewhere classified. The indentation of the variables in the first column indicates how subcategories of data collapse into larger categories. More detailed descriptions of each expenditure function can be found in the Census’ 2006 classification manual (http://www.census.gov/govs/classification/).
Because the data prior to 2005 have substantial additional detail the government finance database
keeps all of the potential categories of debt, even though many of these values are missing for the most
recent years. Any research using the finer-grained debt data should exclude years prior to 2005, but the
larger debt totals are comparable over the entire timespan of the data.

TABLE 7 Cash and Investment Security Variables
Variable Name Census Code
Description
Total Cash and Securities The sum of all cash and securities held Insurance Trust Cash and Securities The sum of retirement and unemployment
investments Employee Retirement Cash and Sec. The sum of all employee retirement cash and sec. Employee Retirement Cash X21 Cash held by the employee retirement system Employee Retirement Securities The sum of the following two subcategories Federal Securities X30 Amount invested in federal government securities Non-Governmental Securities The sum of the following five variables Corporate Bonds Z77 All forms of corporate debt Corporate Stock Z78 All forms of corporate equity investments Mortgages X42 Mortgages owed to the retirement system Other Investments X44 Mutual funds, international investments, loans to
members and several other investments Miscellaneous Investments X47 All investments of the retirement system NEC State and Local Government Sec. X35 Included in X44 but also reported separately6 Unemployment Cash and Securities The sum of the following two variables Unemployment in US Treasuries Y07 The balance held in federal securities Other Unemployment Balances Y08 Negative when states borrow from the federal gov. Non-Insurance Trust Cash and Sec. The sum of the following three variables Sinking Fund Cash and Securities W01 Funds held in order to service debt, all purposes Bond Fund Cash and Securities W31 Proceeds of bond issues awaiting disbursement Other Non-Insurance Trust C&S W61 All other non-insurance trust cash and investments Note: This table describes the coding of the cash and investment security variables and provides a short description of each. NEC stands for not elsewhere classified. The indentation of the variables in the first column indicates how subcategories of data collapse into larger categories. More detailed descriptions of each variable can be found in the Census’ 2006 classification manual (http://www.census.gov/govs/classification/).
CREATING A COHERENT DATABASE
The Census’ government financial data comes in two forms. Data from 1967 through 2007 is more or less
organized in the manner that researchers expect from panel data. The files are divided by year. Each row
of each file corresponds to one government. There are several columns for identifying information and a
column for each financial variable. These columns are all labeled with natural language names that make
6 This may seem like an odd choice given the explicit division between governmental and non-‐governmental securities in the data, but given that defaults by state and local governments are more likely than federal defaults (Chalmers 1998, and many others) conceptually including state and local government bonds with non-‐federal securities is reasonable. For situations where this combination is unwanted state and local government securities can be subtracted out.

it easy to understand what they represent. One wrinkle arises from the fact that data for this period is
always provided in three separate text files each year. Each file contains a row for every government and
some identifying information, but the three files contain different subsets of the financial information
available.
Overcoming this challenge is straightforward. Given the consistent naming scheme used by the
census for these years we simply merge the three data files each year so that all of the columns are
available in one large matrix. We then loop through the years available and continue aggregating the data
into what we call the “early database”.
The newer data presents a much more substantial challenge, and the process of consolidating it
with the early database to create one source of data is a substantial contribution. Data after 2007 is
organized into two files per year. The first file is a fixed width text file called the “Individual Unit File”.
On each row of this file there is one government ID number, one census data code, one number
representing data, the year of the data, and a character that encodes something about how the data was
gathered.
This organization presents the first major hurdle to merging the recent data with the early
database, since each row of the individual unit file holds data that must comprise one cell in the final
matrix. For this reason the individual unit file is transposed so that there is one row per government and
one column for each census data code.
The second file the census provides contains identifying information for every government in that
year’s data, and is organized by government ID code. This “Government ID” file has the name of each
government, population figures, and several other pieces of identifying information. Once the individual
unit files are transposed they are merged with this identifying information to create the “recent database”.

FIGURE 2 Consolidation of the Census of Governments Data
Note: A conceptual overview of the process of consolidating the various data files from the census of governments to form a single coherent database.
The second major hurdle presented by the more recent census data is the fact that the data are not encoded
with natural language variable names the way that the early census data is. This needs to be fixed, so the
final step in the data consolidation is a mapping of each of the census codes onto the variable names used
in the early database. The Census provides some resources to facilitate the process, including a user’s
guide to the early data and classification manuals describing the recent data, but the process is still time
1967 . . . 2007
IndFinA IndFinB IndFinC + +
Early Database
2008 2009 2010 2011 Government ID File:
01100100100000 AUTAUGA COUNTY other identifiers
Individual Unit File 0110010010000019T 10721132008R 0110010010000019U 59558552008R
ID Year 19T 19U … 01100100100000 2008 1072113 5955855
Transposed to:
Recent Database Merged to Create:
Merged to Create:
All files share common identifiers and use natural language variable names, but files A, B, and C have different columns
Recent Database
Census codes renamed and aggregated
+ Early Database Recoded Recent Database = Coherent
Database

consuming and meticulous in a way that likely deters other researchers from incorporating the recent data
into their studies.
In the end we take the recoded recent data and merge it with the early data to present a single
coherent database of government financial statistics between 1967 and 2011. Specific instructions for
replicating our consolidation, the final SAS code we employed, and a mapping of data codes to variable
names is available in the supplementary files included with the database download7. A high-level view of
the process of organizing and consolidating all of the census data is shown in figure 2.
DATA INSIGHTS
Unbalanced Panel Data The government finance database is an unbalanced panel dataset because the annual samples vary in size,
and so any analysis of the data should be informed by traditional approaches to working with unbalanced
panels, such as fixed effects models (Baltagi 2008). However, a deeper understanding of how the sample
varies over time can provide us with advantages over the simple application of statistical tools, by guiding
future research designs and by helping to interpret results.
One particularly striking finding from a high level analysis of the data is that smaller (larger)
sample sizes indicate that the sample is skewed towards larger (smaller) governments. The graphs in
figures 3 and 4 show a clear, inverse relationship for counties (r = -0.93) and municipalities (r = -0.78)
between the number of governments sampled each year and the median population of the governments in
the sample, providing strong evidence that larger municipalities are more likely to be sampled during non-
census years. The two government types that are exceptions to this pattern are states and school districts,
because of the uniformly high reporting rates for both.
This relationship indicates several actionable steps, beyond the straightforward advice to apply
year fixed effects, for quantitative research using this data. First, considering government size in your
7 http://www.willamette.edu/mba/research_impact/2014/public_datasets.html

research design will be essential. Directly controlling for size, or being able to make a plausible argument
for why size is not important for the question being pursued is an important bar for studies using this
database to clear. If such controls or arguments are missing, academics and policy makers should be very
wary of generalizing the results.
FIGURE 3 The Relationship between Sample Size and Population for Counties
FIGURE 4 The Relationship between Sample Size and Population for Municipalities
Second, the particular research focus may inform the data cleaning and selection process in novel ways.
For instance, studies that aim to identify long term financial trends across all governments may want to
only use the data from years ending in a 2 or a 7, because that will ensure that every measure they
calculate is representative of a census of governments. Some of the time series we graph later in this
paper will clearly show the impact that ignoring this advice can have. On the other hand, studies that
include or truncate data based on the population of each observation may claim to be including all of the
-‐ 500 1,000 1,500 2,000 2,500 3,000 3,500
-‐
10,000
20,000
30,000
40,000
50,000
60,000
1972 1977 1982 1987 1992 1997 2002 2007
Records PopulaKon
Year
Total Records Med Pop
-‐
4,000
8,000
12,000
16,000
20,000
24,000
-‐
5,000
10,000
15,000
20,000
25,000
30,000
1972 1977 1982 1987 1992 1997 2002 2007
Records PopulaKon
Year
Total Records Med Pop

data, but are actually removing much of what is available and are prejudicing their sample towards
including more observations during the most recent years. While this type of data cleaning is often
correctly implemented without much thought in other fields, reviewers of work using the government
finance database should pressure authors to justify (or test to ensure) that the choice to include only
governments with a certain population does not bias the results of the study.
While the number of governments sampled in any given year varies considerably, impacting the
median population of the sample, it has long been understood that city populations follow a power law, or
Pareto distribution (Beckmann 1958, or Blank and Solomon 2000), and thus it is reasonable to ask
whether years with a small number of governments might nonetheless cover a large fraction of the
population. Figures 5 and 6 take advantage of the fact that all states report data for every year to calculate
the percentage of the total population covered by various government types each year.
What these figures show is that even though the samples are skewed towards governments with the
largest populations, and so are not representative of all cities or all counties, they do capture a sizeable
portion of the overall population8 in both cases.
FIGURE 5 Population Coverage for Sampled Local Governments
8 There are likely several reasons why none of the years reach 100% coverage for population. One is that Connecticut and Rhode Island do not report county data, even though they both have counties. In addition, the District of Columbia is coded as a state by the census and not as a local government. In practice however these reasons do not account for much of the gap. Other sources potentially include systematic non-‐reporting from less obvious sources, or the possibility that state population estimates are updated more often than other governments and so display growth sooner.
0% 10% 20% 30% 40% 50% 60% 70% 80% 90% 100%
1977 1979 1981 1983 1985 1987 1989 1991 1993 1995 1997 1999 2001 2003 2005 2007 2009 2011
Percent of Total
Total
Townships
MunicipaliKes

FIGURE 6
Population Coverage for Sampled County Governments
An important implication of this is that studies which use the government finance database to measure the
overall economic force of a particular category of government cash flow are likely to come very close to
an accurate estimate, even during small sample years. Per capita numbers, which are easy to compute in
the database, will often be a reasonable tool to use given that the data cover so much of the population.
These measures will still be weighted towards representing people living in the largest governments
during years when the sample is the smallest, but most people live in places with large populations and so
per capita measures will be broadly representative.
Another important consideration in working with unbalanced panel data is that requiring a long,
uninterrupted time series of observations will limit the generality of your results. More specifically in this
case, depending on the type of government being researched, requiring consecutive observations is likely
to bias your sample towards including larger governments and data measured during the years in the late
1980’s when samples were larger. The size of this effect is controlled by the number of concurrent
observations your research design requires however, so even small differences in such requirements have
the potential to sizably impact your findings. Table 8 shows the number of observations that have
consecutive data of a given length, and table 9 shows how average population changes in those samples.
Figure 7 graphs the sample sizes as proportions of all of the available data.
0% 10% 20% 30% 40% 50% 60% 70% 80% 90% 100%
1977 1979 1981 1983 1985 1987 1989 1991 1993 1995 1997 1999 2001 2003 2005 2007 2009 2011
Percent of Total
Total
CounKes

TABLE 8 The Impact of Requiring Consecutive Data on Sample Size
Consecutive Years Required All Reports 2-Year 3-Year 4-Year 5-Year Federal 25 24 23 22 21 State 1,800 1,700 1,650 1,600 1,550 County 93,365 76,582 70,505 65,096 60,109 Municipality 361,300 208,715 170,286 144,915 121,995 Township 273,063 133,936 100,474 80,014 60,311 Special Districts 393,918 159,349 137,548 116,732 98,437 School Districts 488,319 425,588 395,090 367,150 339,564 All Types 1,611,790 1,005,894 875,576 775,529 681,987 Note: This table displays how the sample size will change when researchers require consecutive years of data. The calculations are shown by government type, and each column increases the number of required years by one.
TABLE 9 The Impact of Requiring Consecutive Data on Average Population
Consecutive Years Required All Reports 2-Year 3-Year 4-Year 5-Year Federal 229,703,936 229,703,936 229,703,936 229,703,936 229,703,936 State 5,148,833 5,148,833 5,148,833 5,148,833 5,148,833 County 95,796 108,182 113,368 118,457 123,753 Municipality 15,568 23,986 28,017 31,423 35,677 Township 4,963 7,521 8,923 10,087 11,967 Note: This table displays how the average population of included governments will change when researchers require consecutive years of data. The calculations are shown by government type, and each column increases the number of required years by one.
FIGURE 7 Proportion of Governments with Consecutive Years of Data
Representative Results In the process of organizing and cleaning the data we were struck by its wide applicability to many
different areas of public administration. In this section we present a number of simple analyses that
illustrate both the flexibility and usability of the government finance database.
Figure 8 is a good example. It shows a time series of the average number of tax revenue sources
computed for both municipalities and school districts. These data were constructed by adding an indicator
variable to the database for each type of tax revenue. The indicator was coded as a 0 whenever the total
0%
20%
40%
60%
80%
100%
Federal State County Municipality Township Special Dist School Dist All
Percent of Total
Length 1
Length 2
Length 3
Length 4
Length 5

amount of that tax was either missing or equal to zero, and was coded as a 1 otherwise. The indicators for
property taxes, sales taxes, income taxes, license taxes, and other taxes were then summed and the
average was calculated, by year, for each government type.
FIGURE 8 Number of Tax Revenue Sources by Government Type
The results show two interesting features. The first is a quantitative confirmation of the often-noted trend
towards increasing revenue diversification by municipal governments (Hendricks, 2002). This trend is
mirrored by school districts, a fact which is far less well known. The second notable feature is that the
number of municipal tax revenue sources looks much more variable than the number of school district tax
revenue sources. In fact, much of that variability is induced by the different sample sizes (and therefore
the different average populations) each year.
Figure 9 shows a similar analysis that also highlights several additional considerations for using
the data. It graphs average, real, per capita government debt at both the state and municipal levels.
Scaling by population is easy, since population figures are included in the data, but because the
database is recorded in nominal thousands of dollars any analysis that wants to control for inflation needs
to merge an appropriate scaling factor. In this case we used the annual average CPI levels from the
Bureau of Labor Statistics (with 1983 ≅ 1), scaled total debt outstanding by both CPI and population, and
multiplied each resulting figure by 1,000. The government level figures were then averaged, by year, for
each government type.
0
0.5
1
1.5
2
2.5
3
3.5
1967 1971 1973 1975 1977 1979 1981 1983 1985 1987 1989 1991 1993 1995 1997 1999 2001 2003 2005 2007 2009 2011
Num
ber o
f Tax Reven
ue Sou
rces
School Districts
MunicipaliKes

FIGURE 9 Real per Capita Debt by Government Type
On the surface the graph in figure 9 shows many of the features described by Hildreth and Zorn (2005),
including a substantial increase in debt levels following the Tax Reform Act of 1986, decreasing new
issues in the early 1990’s, and a general upward trend in debt outstanding since. Beyond those well-
known trends however the real, per capita levels tell an interesting story about how large and small
municipalities have used debt markets differently.
Prior to 1986 five-year censuses show relatively little difference from annual samples in terms of
the average level of real debt per person. Following the 1987 census however those differences dominate
the figure, indicating that large municipalities have taken advantage of the Tax Reform Act of 1986 far
more than small municipalities, even in inflation adjusted per capita terms. While city size has been
studied in relation to its impact on interest rates (Rivers and Yates 1997, Simonsen et al. 2001), this
previously unnoticed pattern between city size and the level of outstanding municipal debt is a potential
area for future research.
There is no reason why the data need to be analyzed from the aggregate perspective our previous
two figures used. Breaking the data out and studying one particular government is also an interesting
exercise. For instance, figure 10 shows the state of Oregon’s total revenue and total expenditure, in
billions of nominal dollars through time.
0
500
1000
1500
2000
2500
3000
1972 1977 1982 1987 1992 1997 2002 2007
Real 1983 Do
lalrs per Person State
Municipal

FIGURE 10 Oregon Total Revenue and Total Expenditure
The most striking feature of this graph is the sizeable impact of the great recession on total revenue in
2009. Contrary to what you might think, this change is not the result of a large decrease in taxes collected
or any other traditional revenue source, instead virtually all of the difference between the 2008 and 2009
numbers comes from the approximately $12 billion dollar loss from public employee retirement system
investment revenue. The visual impact of this loss on the graph is small compared to the actual impact
losses like this had on public retirement systems across the nation and the world (Pino and Yermo 2010),
but it drives home an important point about the flexibility of the government finance database. Isolating
more stable government revenues through the use of general revenue, rather than total revenue, is likely to
be advisable in many situations, and further isolating your data from the impact of intergovernmental
revenue by using the “own source” versions of either revenue number is also possible.
Another option for segmenting the data is to look more closely at patterns within a particular
government type. Table 10 shows one such analysis for special districts. While the general pattern of
growth in special districts is well known (see Carr 2006 or McCabe 2000), and there are a few isolated
studies that attempt to understand what is driving that growth (cf. Nunn and Schoedel’s 1997 study using
one year of data to our table), there are no studies describing which types of special districts have
contributed most to that growth.
0
5
10
15
20
25
30
35
40
1977 1979 1981 1983 1985 1987 1989 1991 1993 1995 1997 1999 2001 2003 2005 2007 2009 2011
Billions of Dollars
Revenue
Expenditure

TABLE 10 Special District Growth
Special District Category Code 1977 Ct. 2007 Ct. Δ% 1977 % 2007 % Total -‐ 25,987 35,574 37% 100.00% 100.00% Local Fire Protection 24 4,186 5,814 39% 16.11% 16.34% Water Supply Utility 91 2,481 3,424 38% 9.55% 9.63% Housing and Community Development 50 2,412 3,391 41% 9.28% 9.53% Other Multi-‐function Districts 99 517 2,545 392% 1.99% 7.15% Soil and Water Conservation 88 2,431 2,531 4% 9.35% 7.11% Drainage 51 2,254 2,021 -‐10% 8.67% 5.68% Sewerage 80 1,608 1,867 16% 6.19% 5.25% Libraries 52 588 1,663 183% 2.26% 4.67% Cemeteries 2 1,615 1,588 -‐2% 6.21% 4.46% Sewerage and Water Supply 98 1,064 1,359 28% 4.09% 3.82% Parks and Recreation 61 830 1,320 59% 3.19% 3.71% Other Single Function Districts 89 312 926 197% 1.20% 2.60% Irrigation 64 933 827 -‐11% 3.59% 2.32% Regular Highways 44 652 813 25% 2.51% 2.29% Health 32 356 768 116% 1.37% 2.16% Hospitals 40 717 671 -‐6% 2.76% 1.89% Flood Control 63 681 588 -‐14% 2.62% 1.65% School Building Authorities 9 1,019 522 -‐49% 3.92% 1.47% Air Transportation 1 299 490 64% 1.15% 1.38% Solid Waste Management 81 71 425 499% 0.27% 1.19% Public Mass Transit Utility 94 96 356 271% 0.37% 1.00% Other Natural Resources 59 179 336 88% 0.69% 0.94% Miscellaneous Commercial Activities 3 0 297 -‐ 0.00% 0.83% Industrial Development 41 0 168 -‐ 0.00% 0.47% Sea and Inland Port Facilities 87 166 162 -‐2% 0.64% 0.46% Electric Power Utility 92 82 154 88% 0.32% 0.43% Reclamation 86 114 149 31% 0.44% 0.42% Natural Resources and Water Supply 97 71 87 23% 0.27% 0.24% Fire Protection and Water Supply 96 66 59 -‐11% 0.25% 0.17% Gas Supply Utility 93 46 57 24% 0.18% 0.16% Public Welfare Institutions 77 0 51 -‐ 0.00% 0.14% Mortgage Credit 42 0 39 -‐ 0.00% 0.11% Parking Facilities 60 122 32 -‐74% 0.47% 0.09% Correctional Institutions 4 0 23 -‐ 0.00% 0.06% Police Protection 62 0 23 -‐ 0.00% 0.06% Toll Highways 45 0 15 -‐ 0.00% 0.04% Public Welfare 79 0 12 -‐ 0.00% 0.03% Other Corrections 5 0 1 -‐ 0.00% 0.00% Unknown 0 19 0 -‐100% 0.07% 0.00% Note: This table displays the growth of special districts by comparing the 1977 data with the 2007 data, and is ordered by the number of districts existing in the 2007 data. The absolute number of special districts of each type is displayed, along with the percentage change between the two years, and the proportion of all special districts that each type comprises. The code column is the special district function code used by the census.

Our findings demonstrate a number of interesting patterns. First, much of the growth seems to be an
organic expansion of the most common special districts without much change in their proportion. For
instance, even though local fire protection districts added 1,628 to their total and grew almost 40% over
the 30 years, they represented a very stable 16% of all special districts at both points. Second, some of the
most dramatic growth came from the other multi-function district category, which grew from around 2%
to over 7% of all districts, indicating that citizens who form special districts are increasingly deciding that
the efficiency of combining multiple functions (perhaps from economies of scale, or reductions in
administrative costs), outweighs the burden arising from additional complexity.
There are many other interesting storylines that we might draw from this table, including the
reduction in school building authorities and cemeteries potentially representing shifts in population
demographics, or the strong growth of library, health, and solid waste management districts potentially
representing increased demand for those services in areas without the population to support them
previously. The diversity of potential insights from this relatively simple analysis highlights the fact that
we can only begin to characterize the full extent of the flexibility and utility of the government finance
database here.
FUTURE STEPS
A trade-off between ease of use and purity exists with any data cleaning effort. On the one hand we would
like to present researchers with a database that is free from abnormalities and can be easily used in the
widest range of circumstances. On the other hand we also want a database that is as close to the raw data
collected by the census as possible in order to limit statistician induced measurement error.
In this paper we have made several decisions that ensure the purity of the data even when there is
some reduction in its usability. We plan to implement fixes for these issues, but have reserved these
changes for a later work, since this will give us an opportunity to describe our approach to the data
cleaning in a complete way, and because our approaches are potentially controversial. Academics who
appreciate the changes we plan to make are free to apply them or use our revised database, and those who

disagree with us or would prefer to use an alternate method can still have access to the census data in this
form. A brief description of the issues we would like to fix is warranted however, since our choosing to
not amend the database now means that the data may have less utility for some studies.
The two primary issues surround the population figures and the fiscal year end dates. The issue
with the population numbers is that they do not update annually. Given the fact that per capita levels are a
common, useful transformation to apply to government finance statistics, the use of old population figures
means that per capita variables are likely to be measured with error in some cases. Short of conducting a
retrospective count of populations for every government in the dataset the best solution is to model what
the population must have been in every year when the population estimate is not current. This model
could take many different forms, so we will reserve a discussion of how we propose to create it for the
future.
The issue with the fiscal year end dates is threefold: inconsistent coding of dates, a large number
of error codes which we can interpret, and a surprising collection of other strange entries that are harder to
interpret. The bluntest illustration of this problem is that fact that there are 520 unique values of fiscal
year end dates, and only 365 days in a year. There are several avenues for correcting this problem, none
of which is perfect. In the meantime however research that relies on fiscal year end dates should be
careful of dropping observations that don’t conform to the expected format of this data field.
CONCLUSION
While the data we provide is far from perfect it still represents a substantial step forward for
quantitative research in public financial analysis, and helps to solve a long-standing problem
created by the lack of standardized cross-sectional databases in our field.
All of the data was collected by the U.S. Census Bureau’s annual surveys and five-year
censuses of state and local government finance, but prior to our work the use of census data in
public accounting and finance research always involved a substantial investment into data

cleaning. As a result there was very little standardization in the time periods and government
types covered, and the interpretability, accessibility, and replicability of research suffered.
We offer this database in the hopes that it can bring more consistency and transparency to
quantitative research in financial management. In the process it should also make conducting this
type of research less costly, and may provide a template for others with access to unique data
sources who want to provide them to our field.

REFERENCES Baber, W. R., & Gore, A. K. (2008). Consequences of GAAP disclosure regulation: Evidence from municipal debt issues. The Accounting Review, 83(3), 565-592. Baltagi, B. (2008). Econometric analysis of panel data (Vol. 1). John Wiley & Sons. Bartle J. R.., (2001) Evolving Theories of Public Budgeting. Amsterdam, New York: Emerald Group Publishing Limited. Beckmann, M. J. (1958). City hierarchies and the distribution of city size. Economic Development and Cultural Change, 6(3), 243-248. Blank, A., & Solomon, S. (2000). Power laws in cities population, financial markets and internet sites (scaling in systems with a variable number of components). Physica A: Statistical Mechanics and its Applications, 287(1), 279-288. Breunig, C., Koski, C., & Mortensen, P. B. (2010). Stability and punctuations in public spending: A comparative study of budget functions. Journal of Public Administration Research and Theory, 20(3), 703-722. Carr, J. B. (2006). Local government autonomy and state reliance on special district governments: A reassessment. Political Research Quarterly, 59(3), 481-492. Carroll, D. A. (2009). Diversifying municipal government revenue structures: Fiscal illusion or instability?. Public Budgeting & Finance, 29(1), 27-48. Chalmers, J. M. (1998). Default risk cannot explain the muni puzzle: Evidence from municipal bonds that are secured by US Treasury obligations. Review of Financial Studies, 11(2), 281-308. Chapman, J., & Gorina, E. (2012). Effects of the Form of Government and Property Tax Limits on Local Finance in the Context of Revenue and Expenditure Simultaneity. Public Budgeting & Finance, 32(4), 19-45. Fama, E. F., & French, K. R. (1993). Common risk factors in the returns on stocks and bonds. Journal of Financial Economics, 33(1), 3-56. Fisher, R. C., & Papke, L. E. (2000). Local government responses to education grants. National Tax Journal, 153-168. GASB, Concepts Statement No.1 of the Governmental Accounting Standards Board: Objectives of Financial Reporting (Norwalk, CT: GASB, 1987) GASB, Statement No. 34 (Norwalk, CT: GASB, 1999). Gill, J., & Meier, K. J. (2000). Public administration research and practice: A methodological manifesto. Journal of Public Administration Research and Theory, 10(1), 157-199. Gore, A. K. (2004). The effects of GAAP regulation and bond market interaction on local government disclosure. Journal of Accounting and Public Policy, 23(1), 23-52.

Groeneveld, S., Tummers, L. G., Bronkhorst, B., Ashikali, T., & Van Thiel, S. (2014). Quantitative Methods in Public Administration: Their Use and Development Through Time. International Public Management Journal, Forthcoming. Hendrick, R. (2002). Revenue diversification: Fiscal illusion or flexible financial management. Public budgeting & finance, 22(4), 52-72. Hildreth, W. B., & Zorn, C. (2005). The evolution of the state and local government municipal debt market over the past quarter century. Public Budgeting & Finance, 25(4s), 127-153. Hou, Y. (2006). Budgeting for fiscal stability over the business cycle: A countercyclical fiscal policy and the multiyear perspective on budgeting. Public Administration Review, 66(5), 730-741. Ingram, R. W. (1984). Economic incentives and the choice of state government accounting practices. Journal of Accounting Research, 126-144. Kelman, S. (2005). Public management needs help!. Academy of Management Journal, 48(6), 967-969. Kido, N., Petacchi, R., & Weber, J. (2012). The influence of elections on the accounting choices of governmental entities. Journal of Accounting Research, 50(2), 443-476. Krause, G. A., & Meier, K. J., (2003). Politics, policy, and organizations: frontiers in the scientific study of bureaucracy. University of Michigan Press. Kurban, H., Gallagher, R. M., & Persky, J. J. (2012). Estimating local redistribution through property-tax-funded public school systems. National Tax Journal, 65(3), 629-65 McCabe, B. C. (2000). Special-district formation among the states. State & Local Government Review, 121-131. Meier, K. J., Morton, T., & Molina, A. (2010). Texas School District Performance Data 1993-2009. College Station, TX: Project For Equity, Representation and Governance. Mikesell, J. L., & Ross, J. M. (2012). Fast money? The contribution of state tax amnesties to public revenue systems. National Tax Journal, 65(3), 529-562. Mullins, D. R. (2004). Tax and Expenditure Limitations and the Fiscal Response of Local Government: Asymmetric Intra-‐Local Fiscal Effects. Public Budgeting & Finance, 24(4), 111-147. Murray, S. E., Evans, W. N., & Schwab, R. M. (1998). Education-finance reform and the distribution of education resources. American Economic Review, 789-812. Nunn, S., & Schoedel, C. (1997). Special districts, city governments, and infrastructure spending in 105 US metropolitan areas. Journal of Urban Affairs,19(1), 59-72. Pino, A., & Yermo, J. (2010). The impact of the 2007-‐2009 crisis on social security and private pension funds: A threat to their financial soundness? International Social Security Review, 63(2), 5-30. Raadschelders, J. C. (2013). Public administration: The interdisciplinary study of government. Oxford University Press.
Rivers, M. J., & Yates, B. M. (1997). City size and geographic segmentation in the municipal bond market. The Quarterly Review of Economics and Finance, 37(3), 633-645. Simonsen, B., Robbins, M. D., & Helgerson, L. (2001). The influence of jurisdiction size and sale type on municipal bond interest rates: An empirical analysis. Public Administration Review, 61(6), 709-717. Vallés-‐Giménez, J., & Zárate-‐Marco, A., (2011). Disparities in the Spending Needs of Highland Municipalities. Public Budgeting & Finance, 31(3), 26-48. Voorhees, W. R., & Kravchuk, R. S. (2001). The new governmental financial reporting model under GASB statement no. 34: an emphasis on accountability. Public Budgeting & Finance, 21(3), 1-30. Witko, C., & Newmark, A. J. (2010). The Strange Disappearance of Investment in Human and Physical Capital in the United States. Journal of Public Administration Research and Theory, 20(1), 215-232.

Appendix A: Replication of Data Consolidation Instructions for replicating the the process of data organization we followed.
• Obtain the relevant files from the census: four (4) “fin_data” files from 2008 – 2011, and one (1) “IndFin_1967-2007.zip” file.
o (Contact information is available from: http://www.census.gov/govs/local/) • Extract these files to a directory on your computer • Make sure that you have at least 20GB of space available on the drive where your SAS work
directory is located, since the data files stored in memory get very large during this process. • Paste the code from appendix C into a SAS program file. • Change the directories referenced in the code so that they will work on your machine. There are
several locations for these: o Line 4
! Make sure to include the final “/IndFin0” after the file path pointing to the 1967-2007 folder.
o Line 46 ! Make sure to include the final “/IndFin” (different from above) after the file path
pointing to the 1967-2007 folder. o Line 114
! This should point to the data file containing the 2011 data, the text “2011FinEstDAT_ALL5modp_pu.txt” fits the current census data, but these naming conventions change regularly.
o Line 142 ! This should point to the file containing the 2011 government ID information
o Line 168 ! Points to the 2010 financial data text file.
o Line 196 ! Points to the 2010 government ID file.
o Line 222 ! Points to the 2009 financial data text file.
o Line 250 ! Points to the 2009 government ID file.
o Line 276 ! Points to the 2008 financial data text file.
o Line 304 ! Points to the 2008 government ID file.
o Line 1189 ! This points to the location and file name where the final comma separated data
file should be exported and saved. • Run the SAS program, it should output a csv file with the consolidated data to the location you
indicated on line 1189.

Appendix B: Mapping Natural Language Variables to Census Data Codes In table A1 we display the census codes used to create each of the database variables, or present a formula in cases where the variable is computed from other database variables. Variables listed as “.” Do not have a data code in the newest census data and will not have complete coverage in the database as a result. IGR stands for “intergovernmental revenue”, NEC stands for “not elsewhere classified”, LTD stands for “long term debt”, FFC stands for “full faith and credit”, and NG stands for “not guaranteed”.
TABLE A1 Corresponding Census Codes or Formulas for Each Database Variable
Database Variable Name Census Data Codes or Formula Total_Revenue B01, B21, B22, B30, B42, B46, B50, B59, B79, B80, B89, B91,
B92, B93, B94, C21, C30, C42, C46, C50, C79, C80, C89, C91, C92, C93, C94, D21, D30, D42, D46, D50, D79, D80, D89, D91, D92, D93, D94, T01, T09, T10, T11, T12, T13, T14, T15, T16, T19, T20, T21, T22, T23, T24, T25, T27, T28, T29, T40, T41, T50, T51, T53, T99, A01, A03, A09, A10, A12, A16, A18, A21, A36, A44, A45, A50, A56, A59, A60, A61, A80, A81, A87, A89, U01, U11, U20, U21, U30, U40, U41, U50, U95, U99, A90, A91, A92, A93, A94, X01, X02, X05, X08, Y01, Y02, Y04, Y11, Y12, Y51, Y52
Total_Rev_Own_Sources T01, T09, T10, T11, T12, T13, T14, T15, T16, T19, T20, T21, T22, T23, T24, T25, T27, T28, T29, T40, T41, T50, T51, T53, T99, A01, A03, A09, A10, A12, A16, A18, A21, A36, A44, A45, A50, A56, A59, A60, A61, A80, A81, A87, A89, U01, U11, U20, U21, U30, U40, U41, U50, U95, U99, A90, A91, A92, A93, A94, X01, X02, X05, X08, Y01, Y02, Y04, Y11, Y12, Y51, Y52
General_Revenue B01, B21, B22, B30, B42, B46, B50, B59, B79, B80, B89, B91, B92, B93, B94, C21, C30, C42, C46, C50, C79, C80, C89, C91, C92, C93, C94, D21, D30, D42, D46, D50, D79, D80, D89, D91, D92, D93, D94, T01, T09, T10, T11, T12, T13, T14, T15, T16, T19, T20, T21, T22, T23, T24, T25, T27, T28, T29, T40, T41, T50, T51, T53, T99, A01, A03, A09, A10, A12, A16, A18, A21, A36, A44, A45, A50, A56, A59, A60, A61, A80, A81, A87, A89, U01, U11, U20, U21, U30, U40, U41, U50, U95, U99
Gen_Rev_Own_Sources A01, A03, A09, A10, A12, A16, A18, A21, A36, A44, A45, A50, A56, A59, A60, A61, A80, A81, A87, A89, T01, T09, T10, T11, T12, T13, T14, T15, T16, T19, T20, T21, T22, T23, T24, T25, T27, T28, T29, T40, T41, T50, T51, T53, T99, U01, U11, U20, U21, U30, U40, U41, U50, U95, U99
Total_Taxes T01, T09, T10, T11, T12, T13, T14, T15, T16, T19, T20, T21, T22, T23, T24, T25, T27, T28, T29, T40, T41, T50, T51, T53, T99
Property_Tax T01 Tot_Sales___Gr_Rec_Tax T09, T10, T11, T12, T13, T14, T15, T16, T19 Total_Gen_Sales_Tax T09 Total_Select_Sales_Tax T10, T11, T12, T13, T14, T15, T16, T19 Alcoholic_Beverage_Tax T10

Amusement_Tax T11 Insurance_Premium_Tax T12 Motor_Fuels_Tax T13 Pari_mutuels_Tax T14 Public_Utility_Tax T15 Tobacco_Tax T16 Other_Select_Sales_Tax T19 Total_License_Taxes T20 , T21 , T22 , T23 , T24 , T25 , T27 , T28 , T29 Alcoholic_Beverage_Lic T20 Amusement_License T21 Corporation_License T22 Hunting___Fishing_License T23 Motor_Vehicle_License T24 Motor_Veh_Oper_License T25 Motor_Vehicle_License_Total T24, T25 Public_Utility_License T27 Occup_and_Bus_Lic_NEC T28 Other_License_Taxes T29 Total_Income_Taxes T40 , T41 , T50 , T51 , T53 , T99 Individual_Income_Tax T40 Corp_Net_Income_Tax T41 Death_and_Gift_Tax T50 Docum_and_Stock_Tr_Tax T51 Severance_Tax T53 Taxes_NEC T99 Total_IG_Revenue B01, B21, B22, B30, B42, B46, B50, B59, B79, B80, B89, B91,
B92, B93, B94, C21, C30, C42, C46, C50, C79, C80, C89, C91, C92, C93, C94, D21, D30, D42, D46, D50, D79, D80, D89, D91, D92, D93, D94
Total_Fed_IG_Revenue B01, B21, B22, B30, B42, B46, B50, B59, B79, B80, B89, B91, B92, B93, B94
Fed_IGR_Air_Transport B01 Fed_IGR_Education B21 Fed_IGR_Emp_Sec_Adm B22 Fed_IGR_Gen_Rev_Shar . Fed_IGR_Gen_Support B30 Fed_IGR_Health___Hos B42 Fed_IGR_Highways B46 Fed_IGR_Transit_Sub B94 Fed_IGR_Hous_Com_Dev B50 Fed_IGR_Natural_Res B59 Fed_IGR_Public_Welf B79 Fed_IGR_Sewerage B80 Fed_IGR_Other B89 Total_State_IG_Revenue C21, C30, C42, C46, C50, C79, C80, C89, C91, C92, C93, C94 State_IGR_Education C21 State_IGR_Tax_Relief . State_IGR_Oth_Gen_Sup C30 State_IGR_Gen_Sup State_IGR_Oth_Gen_Sup, State_IGR_Tax_Relief State_IGR_Health___Hos C42 State_IGR_Highways C46

State_IGR_Transit_Sub C94 State_IGR_Hous_Com_Dev C50 State_IGR_Public_Welf C79 State_IGR_Sewerage C80 State_IGR_Other C89 Tot_Local_IG_Rev D21, D30, D42, D46, D50, D79, D80, D89, D91, D92, D93,
D94 Local_IGR_InterSchool_Aid D11 Local_IGR_Other_Education D21 Local_IGR_Oth_Gen_Sup D30 Local_IGR_Health___Hos D42 Local_IGR_Highways D46 Local_IGR_Transit_Sub D94 Local_IGR_Hous_Com_Dev D50 Local_IGR_Public_Welf D79 Local_IGR_Sewerage D80 Local_IGR_Other D89 Tot_Chgs_and_Misc_Rev A01, A03, A09, A10, A12, A16, A18, A21, A36, A44, A45,
A50, A56, A59, A60, A61, A80, A81, A87, A89, U01, U11, U20, U21, U30, U40, U41, U50, U95, U99
Total_General_Charges A01, A03, A09, A10, A12, A16, A18, A21, A36, A44, A45, A50, A56, A59, A60, A61, A80, A81, A87, A89
Chg_Air_Transportation A01 Chg_Misc_Com_Activ A03 Chg_Total_Education A09, A10, A12, A16, A18, A21 Chg_Total_Elem_Education Chg_Elem_Ed_Sch_Lunch, Chg_Elem_Ed_Tuition,
Chg_Elem_Ed_NEC Chg_Elem_Ed_Sch_Lunch A09 Chg_Elem_Ed_Tuition A10 Chg_Elem_Ed_NEC A12 Chg_Total_High_Ed A16, A18 Chg_Hospitals A36 Chg_Highways Chg_Regular_Highways, Chg_Toll_Highways Chg_Regular_Highways A44 Chg_Toll_Highways A45 Chg_Housing___Comm_Dev A50 Chg_Total_Nat_Res A56 , A59 Chg_Parking A60 Chg_Parks___Recreation A61 Chg_Sewerage A80 Chg_Solid_Waste_Mgmt A81 Chg_Water_Transport A87 Chg_All_Other_NEC A89 Misc_General_Revenue U01, U11, U20, U21, U30, U40, U41, U50, U95, U99 Special_Assessments U01 Prop_Sale_Total Prop_Sale_Hous_Com_Dev, Prop_Sale_Other Prop_Sale_Hous_Com_Dev . Prop_Sale_Other U11 Interest_Revenue U20 Fines_and_Forfeits U30 Rents_and_Royalties U40 , U41

Net_Lottery_Revenue U95 Misc_General_Rev_NEC U99 Liquor_Stores_Revenue A90 Total_Utility_Revenue A91, A92, A93, A94 Water_Utility_Revenue A91 Electric_Utility_Rev A92 Gas_Utility_Rev A93 Transit_Utility_Rev A94 Total_Insur_Trust_Rev X01, X02, X05, X08, Y01, Y02, Y04, Y11, Y12, Y51, Y52 Total_Insur_Trust_Ctrb X01, X02, X05, Y01 Tot_Ins_Trust_Inv_Rev X08 , Y02 Total_Emp_Ret_Rev X01, X02, X05, X08 Emp_Ret_Total_Ctrib X01, X02, X05 Emp_Ret_Loc_Emp_Ctrib X01 Emp_Ret_Loc_To_Loc_Sys X04 Emp_Ret_From_Other_Gov X05 Emp_Ret_Sta_To_Sta_Ctr X06 Emp_Ret_Int_Rev X08 Emp_Ret_Other_Earnings . Total_Unemp_Rev Y01, Y02, Y04 Unemp_Payroll_Tax Y01 Unemp_Int_Revenue Y02 Unemp_Federal_Advances Y04 Total_Expenditure E01, E03, E04, E05, E12, E16, E18, E21, E22, E23, E24, E25,
E26, E29, E31, E32, E36, E44, E44, E45, E50, E52, E55, E56, E59, E60, E61, E62, E66, E74, E75, E77, E79, E80, E81, E85, E87, E89, E90, E91, E92, E93, E94, I89, I91, I92, I93, I94, J19, J67, J68, J85, X11, X12, Y05, Y06, Y14, Y53, F01, F03, F04, F05, F12, F16, F18, F21, F22, F23, F24, F25, F26, F29, F31, F32, F36, F44, F45, F50, F52, F55, F56, F59, F60, F61, F62, F66, F77, F79, F80, F81, F85, F87, F89, F90, F91, F92, F93, F94, G01, G03, G04, G05, G12, G16, G18, G21, G22, G23, G24, G25, G26, G29, G31, G32, G36, G44, G45, G50, G52, G55, G56, G59, G60, G61, G62, G66, G77, G79, G80, G81, G85, G87, G89, G90, G91, G92, G93, G94, L01, L04, L05, L12, L18, L23, L25, L29, L32, L36, L44, L52, L59, L60, L61, L62, L66, L67, L79, L80, L81, L87, L89, L91, L92, L93, L94, M01, M04, M05, M12, M18, M21, M23, M24, M25, M29, M30, M32, M36, M44, M50, M52, M55, M56, M59, M60, M61, M62, M66, M67, M68, M79, M80, M81, M87, M89, M91, M92, M93, M94, Q12, Q18, S67, S74, S89
Total_IG_Expenditure L01, L04, L05, L12, L18, L23, L25, L29, L32, L36, L44, L50, L52, L59, L60, L61, L62, L66, L67, L79, L80, L81, L87, L89, L91, L92, L93, L94, M01, M04, M05, M12, M18, M21, M23, M24, M25, M29, M30, M32, M36, M44, M50, M52, M52, M55, M56, M59, M60, M61, M62, M66, M67, M68, M79, M80, M81, M87, M89, M91, M92, M93, M94, Q12, Q18, S67, S89
Direct_Expenditure E01, E03, E04, E05, E12, E16, E18, E21, E22, E23, E24, E25, E26, E29, E31, E32, E36, E44, E45, E50, E52, E55, E56, E59, E60, E61, E62, E66, E74, E75, E77, E79, E80, E81, E85, E87, E89, E90, E91, E92, E93, E94, F01, F03, F04, F05, F12, F16,

F18, F21, F22, F23, F24, F25, F26, F29, F31, F32, F36, F44, F45, F50, F52, F55, F56, F59, F60, F61, F62, F66, F77, F79, F80, F81, F85, F87, F89, F90, F91, F92, F93, F94, G01, G03, G04, G05, G12, G16, G18, G21, G22, G23, G24, G25, G26, G29, G31, G32, G36, G44, G45, G50, G52, G55, G56, G59, G60, G61, G62, G66, G77, G79, G80, G81, G85, G87, G89, G90, G91, G92, G93, G94, X11, X12, Y05, Y06, Y14, Y53, J19, J67, J68, J85, I89, I91, I92, I93, I94
Total_Current_Expend Total_Expenditure, - Total_Capital_Outlays Total_Current_Oper E01, E03, E04, E05, E12, E16, E18, E21, E22, E23, E24, E25,
E26, E29, E31, E32, E36, E44, E45, E50, E52, E55, E56, E59, E60, E61, E62, E66, E74, E75, E77, E79, E80, E81, E85, E87, E89, E90, E91, E92, E93, E94
Total_Capital_Outlays F01, F03, F04, F05, F12, F16, F18, F21, F22, F23, F24, F25, F26, F29, F31, F32, F36, F44, F45, F50, F52, F55, F56, F59, F60, F61, F62, F66, F77, F79, F80, F81, F85, F87, F89, F90, F91, F92, F93, F94, G01, G03, G04, G05, G12, G16, G18, G21, G22, G23, G24, G25, G26, G29, G31, G32, G36, G44, G45, G50, G52, G55, G56, G59, G60, G61, G62, G66, G77, G79, G80, G81, G85, G87, G89, G90, G91, G92, G93, G94
Total_Construction F01, F03, F04, F05, F12, F16, F18, F21, F22, F23, F24, F25, F26, F29, F31, F32, F36, F44, F45, F50, F52, F55, F56, F59, F60, F61, F62, F66, F77, F79, F80, F81, F85, F87, F89, F90, F91, F92, F93, F94
Total_Other_Capital_Outlays Total_Capital_Outlays, -Total_Construction Tot_Assist___Subsidies J19, J67, J68, J85 Total_Interest_on_Debt I89, I91, I92, I93, I94 Total_Insur_Trust_Ben X11, X12, Y05, Y06, Y14, Y53 Total_Salaries___Wages Z00 General_Expenditure E01, E03, E04, E05, E12, E16, E18, E21, E22, E23, E24, E25,
E26, E29, E31, E32, E36, E44, E45, E50, E52, E55, E56, E59, E60, E61, E62, E66, E74, E75, E77, E79, E80, E81, E85, E87, E89, E90, E91, E92, E93, E94, F01, F03, F04, F05, F12, F16, F18, F21, F22, F23, F24, F25, F26, F29, F31, F32, F36, F44, F45, F50, F52, F55, F56, F59, F60, F61, F62, F66, F77, F79, F80, F81, F85, F87, F89, F90, F91, F92, F93, F94, G01, G03, G04, G05, G12, G16, G18, G21, G22, G23, G24, G25, G26, G29, G31, G32, G36, G44, G45, G50, G52, G55, G56, G59, G60, G61, G62, G66, G77, G79, G80, G81, G85, G87, G89, G90, G91, G92, G93, G94, X11, X12, Y05, Y06, Y14, Y53, J19, J67, J68, J85, I89, I91, I92, I93, I94
IG_Exp_To_State_Govt L01, L04, L05, L12, L18, L23, L25, L29, L32, L36, L44, L50, L52, L59, L60, L61, L62, L66, L67, L79, L80, L81, L87, L89, L91, L92, L93, L94
IG_Exp_To_Local_Govts M01, M04, M05, M12, M18, M21, M23, M24, M25, M29, M30, M32, M36, M44, M50, M52, M52, M55, M56, M59, M60, M61, M62, M66, M67, M68, M79, M80, M81, M87, M89, M91, M92, M93, M94
IG_Exp_To_Federal_Govt S67, S74, S89 Direct_General_Expend E01, E03, E04, E05, E12, E16, E18, E21, E22, E23, E24, E25,
E26, E29, E31, E32, E36, E44, E45, E50, E52, E55, E56, E59,

E60, E61, E62, E66, E74, E75, E77, E79, E80, E81, E85, E87, E89, E90, E91, E92, E93, E94, F01, F03, F04, F05, F12, F16, F18, F21, F22, F23, F24, F25, F26, F29, F31, F32, F36, F44, F45, F50, F52, F55, F56, F59, F60, F61, F62, F66, F77, F79, F80, F81, F85, F87, F89, F90, F91, F92, F93, F94, G01, G03, G04, G05, G12, G16, G18, G21, G22, G23, G24, G25, G26, G29, G31, G32, G36, G44, G45, G50, G52, G55, G56, G59, G60, G61, G62, G66, G77, G79, G80, G81, G85, G87, G89, G90, G91, G92, G93, G94, X11, X12, Y05, Y06, Y14, Y53, J19, J67, J68, J85, I89, I91, I92, I93, I94
General_Current_Expend General_Expenditure, - General_Capital_Outlay General_Current_Oper E01, E03, E04, E05, E12, E16, E18, E21, E22, E23, E24, E25,
E26, E29, E31, E32, E36, E44, E45, E50, E52, E55, E56, E59, E60, E61, E62, E66, E74, E75, E77, E79, E80, E81, E85, E87, E89, E90, E91, E92, E93, E94
General_Capital_Outlay F01, F03, F04, F05, F12, F16, F18, F21, F22, F23, F24, F25, F26, F29, F31, F32, F36, F44, F45, F50, F52, F55, F56, F59, F60, F61, F62, F66, F77, F79, F80, F81, F85, F87, F89, G01, G03, G04, G05, G12, G16, G18, G21, G22, G23, G24, G25, G26, G29, G31, G32, G36, G44, G45, G50, G52, G55, G56, G59, G60, G61, G62, G66, G77, G79, G80, G81, G85, G87, G89
General_Construction F01, F03, F04, F05, F12, F16, F18, F21, F22, F23, F24, F25, F26, F29, F31, F32, F36, F44, F45, F50, F52, F55, F56, F59, F60, F61, F62, F66, F77, F79, F80, F81, F85, F87, F89, F90, F91, F92, F93, F94
General_Capital_Outlay_Other General_Capital_Outlay, -General_Construction General_Assist___Sub Tot_Assist___Subsidies General_Debt_Interest I89 Air_Trans_Total_Expend E01 , F01 , G01 , L01 , M01 Air_Trans_Direct_Expend E01 , F01 , G01 Air_Trans_Cap_Outlay F01 , G01 Air_Trans_Current_Exp Air_Trans_Direct_Expend, -Air_Trans_Cap_Outlay Air_Trans_Construction F01 Air_Trans_IG_To_State L01 Air_Trans_IG_Local_Govts M01 Misc_Com_Activ_Tot_Exp E03 , F03 , G03 Misc_Com_Activ_Cap_Out F03 , G03 Misc_Com_Activ_Current_Exp Misc_Com_Activ_Tot_Exp, -Misc_Com_Activ_Cap_Out Misc_Com_Activ_Constr F03 Correct_Total_Exp E04 , F04 , G04 , E05 , F05 , G05 , L04 , L05 , M04 , M05 Correct_Direct_Exp E04 , E05 , F04 , G04 , F05 , G05 Correct_Cap_Outlay F04 , G04 , F05 , G05 Correct_Current_Exp Correct_Direct_Exp, -Correct_Cap_Outlay Correct_Construct F04 , F05 Correct_IG_To_St L04 , L05 Correct_IG_Loc_Govts M04 , M05 Total_Educ_Total_Exp E12, F12, G12, E16, F16, G16, E18, F18, G18, J19, E21, F21,
G21, L12, M12, Q12, L18, M18, L21, M21 Total_Educ_Direct_Exp E12, F12, G12, E16, F16, G16, E18, F18, G18, J19, E21, F21,
G21

Total_Educ_Assist___Sub J19 Total_Educ_Cap_Outlay F12, F16, F18, F21, G12, G16, G18, G21 Total_Educ_Current_Exp Total_Educ_Direct_Exp, -Total_Educ_Cap_Outlay Total_Educ_Construct F12 , F16 , F18 , F21 Elem_Educ_Total_Exp E12, F12, G12, L12, M12, Q12 Elem_Educ_Direct_Exp E12, F12, G12 Elem_Educ_Cap_Outlay F12, G12 Elem_Educ_Current_Exp Elem_Educ_Direct_Exp, -Elem_Educ_Cap_Outlay Elem_Educ_Construction F12 Elem_Educ_IG_To_State L12 Elem_Educ_IG_Local_Govts M12 Elem_Educ_IG_Sch_to_Sch Q12 Higher_Ed_Total_Exp E16, E18, F16, F18, G16, G18, L18, M18 Higher_Ed_Direct_Exp E16, E18, F16, F18, G16, G18 Higher_Ed_Cap_Outlay F16, F18, G16, G18 Higher_Ed_Current_Exp Higher_Ed_Direct_Exp, -Higher_Ed_Cap_Outlay Higher_Ed_Construct F16, F18 Higher_Ed_IG_To_St L18 Higher_Ed_IG_Loc_Govts M18 Educ_NEC_Total_Expend E21, F21, G21, L21, M21 Educ_NEC_Direct_Expend E21, F21, G21 Educ_NEC_Assistance . Educ_NEC_Cap_Outlay F21, G21 Educ_NEC_Current_Exp Educ_NEC_Direct_Expend, -Educ_NEC_Cap_Outlay Educ_NEC_Construction F21 Educ_NEC_IG_To_State L21 Educ_NEC_IG_Local_Govts M21 Emp_Sec_Adm_Direct_Exp E22 , F22 , G22 Emp_Sec_Adm_Cap_Outlay F22 , G22 Emp_Sec_Adm_Current_Exp Emp_Sec_Adm_Direct_Exp, -Emp_Sec_Adm_Cap_Outlay Emp_Sec_Adm_Construct F22 Fin_Admin_Total_Exp E23, F23, G23, L23, M23 Fin_Admin_Direct_Exp E23, F23, G23 Fin_Admin_Cap_Outlay F23, G23 Fin_Admin_Current_Exp Fin_Admin_Direct_Exp, -Fin_Admin_Cap_Outlay Fin_Admin_Construction F23 Fin_Admin_IG_To_State L23 Fin_Admin_IG_Local_Govts M23 Fire_Prot_Total_Expend E24, F24, G24, L24, M24 Fire_Prot_Direct_Exp E24, F24, G24 Fire_Prot_Cap_Outlay F24, G24 Fire_Prot_Current_Exp Fire_Prot_Direct_Exp, -Fire_Prot_Cap_Outlay Fire_Prot_Construction F24 Fire_Prot_IG_To_State L24 Fire_Prot_IG_Local_Govts M24 Judicial_Total_Expend E25, F25, G25, L25, M25 Judicial_Direct_Expend E25, F25, G25 Judicial_Cap_Outlay F25, G25 Judicial_Current_Exp Judicial_Direct_Expend, -Judicial_Cap_Outlay Judicial_Construction F25 Judicial_IG_To_State L25

Judicial_IG_Local_Govts M25 Cen_Staff_Total_Expend E29, F29, G29, L29, M29 Cen_Staff_Direct_Exp E29, F29, G29 Cen_Staff_Cap_Outlay F29, G29 Cen_Staff_Current_Exp Cen_Staff_Direct_Exp, -Cen_Staff_Cap_Outlay Cen_Staff_Construction F29 Cen_Staff_IG_To_State L29 Cen_Staff_IG_Local_Govts M29 Gen_Pub_Bldg_Total_Exp E31, F31, G31 Gen_Pub_Bldg_Cap_Out F31, G31 Gen_Pub_Bldg_Current_Exp Gen_Pub_Bldg_Total_Exp, -Gen_Pub_Bldg_Cap_Out Gen_Pub_Bldg_Construct F31 Health_Total_Expend E32, F32, G32, L32, M32 Health_Direct_Expend E32, F32, G32 Health_Capital_Outlay F32, G32 Health_Current_Exp Health_Direct_Expend, -Health_Capital_Outlay Health_Construction F32 Health_IG_To_State L32 Health_IG_Local_Govts M32 Total_Hospital_Total_Exp E36, F36, G36, L36, M36 Total_Hospital_Dir_Exp E36, F36, G36 Total_Hospital_Cap_Out F36, G36 Total_Hospital_Current_Exp Total_Hospital_Dir_Exp, -Total_Hospital_Cap_Out Total_Hospital_Construct F36 Total_Hospital_IG_To_State L36 Total_Hospital_IG_Loc_Govts M36 Own_Hospital_Total_Exp E37, F37, G37 Own_Hospital_Cap_Out F37, G37 Own_Hospital_Current_Exp Own_Hospital_Total_Exp, -Own_Hospital_Cap_Out Own_Hospital_Construct F37 Hosp_Other_Total_Exp E39, F39, G39, L39, M39 Hosp_Other_Direct_Exp E39, F39, G39 Hosp_Other_Cap_Outlay F39, G39 Hosp_Other_Current_Exp Hosp_Other_Direct_Exp, -Hosp_Other_Cap_Outlay Hosp_Other_Construct F39 Hosp_Other_IG_To_State L39 Hosp_Other_IG_Loc_Govts M39 Total_Highways_Tot_Exp E44, F44, G44, E45, F45, G45, L44, M44 Total_Highways_Dir_Exp E44, F44, G44, E45, F45, G45 Total_Highways_Cap_Out F44, G44, F45, G45 Total_Highways_Current_Exp Total_Highways_Dir_Exp, -Total_Highways_Cap_Out Total_Highways_Construct F44, F45 Regular_Hwy_Total_Exp E44, F44, G44, L44, M44 Regular_Hwy_Direct_Exp E44, F44, G44 Regular_Hwy_Cap_Outlay F44, G44 Regular_Hwy_Current_Exp Regular_Hwy_Direct_Exp, -Regular_Hwy_Cap_Outlay Regular_Hwy_Construct F44 Regular_Hwy_IG_To_Sta L44 Regular_Hwy_IG_Loc_Govts M44 Toll_Hwy_Total_Expend E45, F45, G45 Toll_Hwy_Cap_Outlay F45, G45

Toll_Hwy_Current_Exp Toll_Hwy_Total_Expend, -Toll_Hwy_Cap_Outlay Toll_Hwy_Construction F45 Transit_Sub_Total_Exp . Transit_Sub_Direct_Sub . Transit_Sub_IG_To_Sta . Transit_Sub_IG_Loc_Govts . Transit_Sub_To_Own_Sys . Hous___Com_Total_Exp E50, F50, G50, L50, M50 Hous___Com_Direct_Exp E50, F50, G50 Hous___Com_Cap_Outlay F50, G50 Hous___Com_Current_Exp Hous___Com_Direct_Exp, -Hous___Com_Cap_Outlay Hous___Com_Construct F50 Hous___Com_IG_To_State L50 Hous___Com_IG_Loc_Govts M50 Libraries_Total_Expend E52, F52, G52, L52, M52 Libraries_Direct_Exp E52, F52, G52 Libraries_Cap_Outlay F52, G52 Libraries_Current_Exp Libraries_Direct_Exp, -Libraries_Cap_Outlay Libraries_Construction F52 Libraries_IG_To_State L52 Libraries_IG_Local_Govts M52 Natural_Res_Total_Exp E55, F55, G55, M55, E56, F56, G56, M56, E59, F59, G59, L59,
M59 Natural_Res_Direct_Exp E55, F55, G55, E56, F56, G56, E59, F59, G59 Natural_Res_Cap_Outlay F55, G55, F56, G56, F59, G59 Natural_Res_Current_Exp Natural_Res_Direct_Exp, -Natural_Res_Cap_Outlay Natural_Res_Construct F55, F56, F59 Natural_Res_IG_To_Sta L59 Natural_Res_IG_Loc_Govts M55, M56 , M59 Parking_Total_Expend E60, F60, G60, L60, M60 Parking_Direct_Expend E60, F60, G60 Parking_Capital_Outlay F60, G60 Parking_Current_Exp Parking_Direct_Expend, -Parking_Capital_Outlay Parking_Construction F60 Parking_IG_To_State L60 Parking_IG_Local_Govts M60 Parks___Rec_Total_Exp E61, F61, G61, L61, M61 Parks___Rec_Direct_Exp E61, F61, G61 Parks___Rec_Cap_Outlay F61, G61 Parks___Rec_Current_Exp Parks___Rec_Direct_Exp, -Parks___Rec_Cap_Outlay Parks___Rec_Construct F61 Parks___Rec_IG_To_Sta L61 Parks___Rec_IG_Loc_Govts M61 Police_Prot_Total_Exp E62, F62, G62, L62, M62 Police_Prot_Direct_Exp E62, F62, G62 Police_Prot_Cap_Outlay F62, G62 Police_Prot_Current_Exp Police_Prot_Direct_Exp, -Police_Prot_Cap_Outlay Police_Prot_Construct F62 Police_Prot_IG_To_Sta L62 Police_Prot_IG_Loc_Govts M62 Prot_Insp_Total_Exp E66, F66, G66, L66, M66

Prot_Insp_Direct_Exp E66, F66, G66 Prot_Insp_Cap_Outlay F66, G66 Prot_Insp_Current_Exp Prot_Insp_Direct_Exp, -Prot_Insp_Cap_Outlay Prot_Insp_Construction F66 Prot_Insp_IG_To_State L66 Prot_Insp_IG_Local_Govts M66 Public_Welf_Total_Exp J67, L67, M67, J68 , M68, E74, E75, S74, E77, F77, G77, E79,
F79, G79, L79, M79 Public_Welf_Direct_Exp J67, J68 , E74, E75, E77, F77, G77, E79, F79, G79 Public_Welf_Cash_Asst J67, J68, M67, M68 Public_Welf_Cap_Outlay F77, G77, F79, G79 Public_Welf_Current_Exp Public_Welf_Direct_Exp, -Public_Welf_Cap_Outlay, -
Public_Welf_Cash_Asst Public_Welf_Construct F77, F79 Welf_Categ_Total_Exp J67, L67, M67 Welf_Categ_Cash_Assist J67 Welf_Categ_IG_To_State L67 Welf_Categ_IG_Loc_Govts M67 Welf_Cash_Total_Exp J68 , M68 Welf_Cash_Cash_Assist J68 Welf_Cash_IG_Local_Govts M68 Welf_Vend_Pmts_Medical E74 Welf_Vend_Pmts_NEC E75 Welf_State_Share_Part_D S74 Welf_Ins_Total_Exp E77, F77, G77 Welf_Ins_Cap_Outlay F77, G77 Welf_Ins_Current_Exp Welf_Ins_Construction F77 Welf_NEC_Total_Expend E79, F79, G79, L79, M79 Welf_NEC_Direct_Expend E79, F79, G79 Welf_NEC_Cap_Outlay F79, G79 Welf_NEC_Current_Exp Welf_NEC_Direct_Expend, -Welf_NEC_Cap_Outlay Welf_NEC_Construction F79 Welf_NEC_IG_To_State L79 Welf_NEC_IG_Local_Govts M79 Sewerage_Total_Expend E80, F80, G80, L80, M80 Sewerage_Direct_Expend E80, F80, G80 Sewerage_Cap_Outlay F80, G80 Sewerage_Current_Exp Sewerage_Direct_Expend, -Sewerage_Cap_Outlay Sewerage_Construction F80 Sewerage_IG_To_State L80 Sewerage_IG_Local_Govts M80 SW_Mgmt_Total_Expend E81, F81, G81, L81, M81 SW_Mgmt_Direct_Expend E81, F81, G81 SW_Mgmt_Capital_Outlay F81, G81 SW_Mgmt_Current_Exp SW_Mgmt_Direct_Expend, -SW_Mgmt_Capital_Outlay SW_Mgmt_Construction F81 SW_Mgmt_IG_To_State L81 SW_Mgmt_IG_Local_Govts M81 Water_Trans_Total_Exp E87, F87, G87, L87, M87 Water_Trans_Direct_Exp E87, F87, G87

Water_Trans_Cap_Outlay F87, G87 Water_Trans_Current_Exp Water_Trans_Direct_Exp, -Water_Trans_Cap_Outlay Water_Trans_Construct F87 Water_Trans_IG_To_Sta L87 Water_Trans_IG_Loc_Govts M87 Interest_on_Gen_Debt I89 General_NEC_Total_Exp E89, F89, G89, L89, M89, S89, J89 General_NEC_Direct_Exp E89, F89, G89, J89 VetBonus J89 General_NEC_Cap_Outlay F89, G89 General_NEC_Current_Exp General_NEC_Direct_Exp, -General_NEC_Cap_Outlay, -
VetBonus General_NEC_Construct F89 General_NEC_IG_To_St L89 General_NEC_IG_Loc_Govts M89 General_NEC_IG_To_Fed S89 Liquor_Stores_Tot_Exp E90, F90, G90 Liquor_Stores_Cap_Out F90, G90 Liquor_Stores_Current_Exp Liquor_Stores_Tot_Exp, -Liquor_Stores_Cap_Out Liquor_Stores_Constr F90 Total_Util_Total_Exp E91, I91, F91, G91, L91, M91, E92, I92, F92, G92, L92, M92,
E93, I93, F93, G93, L93, M93, E94, I94, F94, G94, L94, M94 Total_Util_Inter_Exp I91, I92, I93, I94 Total_Util_Cap_Outlay F91, F92, F93, F94, G91, G92, G93, G94 Total_Util_Current_Exp Total_Util_Total_Exp, -Total_Util_Inter_Exp, -
Total_Util_Cap_Outlay Total_Util_Construct F91, F92, F93, F94 Water_Util_Total_Exp E91, I91, F91, G91, L91, M91 Water_Util_Inter_Exp I91 Water_Util_Cap_Outlay F91, G91 Water_Util_Current_Exp Water_Util_Total_Exp, -Water_Util_Inter_Exp, -
Water_Util_Cap_Outlay Water_Util_Construct F91 Elec_Util_Total_Exp E92, I92, F92, G92, L92, M92 Elec_Util_Inter_Exp I92 Elec_Util_Cap_Outlay F92, G92 Elec_Util_Current_Exp Elec_Util_Total_Exp, -Elec_Util_Inter_Exp, -
Elec_Util_Cap_Outlay Elec_Util_Construct F92 Gas_Util_Total_Exp E93, I93, F93, G93, L93, M93 Gas_Util_Inter_Exp I93 Gas_Util_Cap_Outlay F93, G93 Gas_Util_Current_Exp Gas_Util_Total_Exp, -Gas_Util_Inter_Exp, -
Gas_Util_Cap_Outlay Gas_Util_Construct F93 Trans_Util_Total_Exp E94, I94, F94, G94, L94, M94 Trans_Util_Inter_Exp I94 Trans_Util_Cap_Outlay F94, G94 Trans_Util_Current_Exp Trans_Util_Total_Exp, -Trans_Util_Inter_Exp, -Trans_Util_Cap_Outlay Trans_Util_Total_Exp, -Trans_Util_Inter_Exp, -
Trans_Util_Cap_Outlay Trans_Util_Construct F94

Emp_Ret_Total_Expend X11, X12 Emp_Ret_Benefit_Paymts X11 Emp_Ret_Withdrawals X12 Emp_Ret_Other_Paymts . Unemp_Comp_Total_Exp Y05, Y06 Unemp_Comp_Ben_Paymts Y05 Unemp_Ext___Spec_Pmts Y06 Total_Debt_Outstanding _44T, _49U, _64V Total_Long_Term_Debt_Out _44T, _49U ST_Debt_End_of_Year _64V Total_Beg_LTD_Out _19T, _19U Beg_LTD_Out_Private_Purp _19T Beg_LTD_Out_All_Other _19U Beg_LTD_Out_Utility . *All detailed debt codes were discontinued in 2005 Beg_LTD_Out_Water_Util . Beg_LTD_Out_Elec_Util . Beg_LTD_Out_Gas_Util . Beg_LTD_Out_Trans_Util . Beg_LTD_Out_General . Beg_LTD_Out_Education . Beg_LTD_Out_Priv_Purp . Beg_LTD_Out_Other_NEC . Total_LTD_Issued _24T, _29U LTD_Iss_Private_Purp _24T LTD_Iss_All_Other _29U LTD_Iss_Utility . LTD_Iss_Util_Water . LTD_Iss_Util_Electric . LTD_Iss_Util_Gas_Supply . LTD_Iss_Util_Transit . LTD_Iss_General . LTD_Iss_Gen_Elem_Educ . LTD_Iss_Gen_Other_Educ . LTD_Iss_Gen_Other_NEC . Total_LTD_Iss_FFC . LTD_Iss_FFC_Utility . LTD_Iss_FFC_Water_Util . LTD_Iss_FFC_Elec_Util . LTD_Iss_FFC_Gas_Util . LTD_Iss_FFC_Trans_Util . LTD_Iss_FFC_General . LTD_Iss_FFC_Elem_Educ . LTD_Iss_FFC_Other_Educ . LTD_Iss_FFC_Other_NEC . Total_LTD_Iss_NG . LTD_Iss_NG_Utility . LTD_Iss_NG_Water_Util . LTD_Iss_NG_Elec_Util . LTD_Iss_NG_Gas_Util . LTD_Iss_NG_Trans_Util . LTD_Iss_NG_General .

LTD_Iss_NG_Elem_Educ . LTD_Iss_NG_Other_Educ . LTD_Iss_NG_Private_Purp . LTD_Iss_NG_Other_NEC . Total_LTD_Iss_Unsp . LTD_Iss_Unsp_Utility . LTD_Iss_Unsp_Water_Util . LTD_Iss_Unsp_Elec_Util . LTD_Iss_Unsp_Gas_Util . LTD_Iss_Unsp_Trans_Util . LTD_Iss_Unsp_General . LTD_Iss_Unsp_Elem_Educ . LTD_Iss_Unsp_Other_Educ . LTD_Iss_Unsp_Other_NEC . Total_LTD_Retired _34T, _39U LTD_Ret_Private_Purp _34T LTD_Ret_All_Other _39U LTD_Ret_Utility . LTD_Ret_Util_Water . LTD_Ret_Util_Electric . LTD_Ret_Util_Gas_Supply . LTD_Ret_Util_Transit . LTD_Ret_General . LTD_Ret_Gen_Elem_Educ . LTD_Ret_Gen_Other_Educ . LTD_Ret_Gen_Other_NEC . Total_LTD_Ret_FFC . LTD_Ret_FFC_Utility . LTD_Ret_FFC_Water_Util . LTD_Ret_FFC_Elec_Util . LTD_Ret_FFC_Gas_Util . LTD_Ret_FFC_Trans_Util . LTD_Ret_FFC_General . LTD_Ret_FFC_Elem_Educ . LTD_Ret_FFC_Other_Educ . LTD_Ret_FFC_Other_NEC . Total_LTD_Ret_NG . LTD_Ret_NG_Utility . LTD_Ret_NG_Water_Util . LTD_Ret_NG_Elec_Util . LTD_Ret_NG_Gas_Util . LTD_Ret_NG_Trans_Util . LTD_Ret_NG_General . LTD_Ret_NG_Elem_Educ . LTD_Ret_NG_Other_Educ . LTD_Ret_NG_Private_Purp . LTD_Ret_NG_Other_NEC . Total_LTD_Ret_Unsp . LTD_Ret_Unsp_Utility . LTD_Ret_Unsp_Water_Util . LTD_Ret_Unsp_Elec_Utili .

LTD_Ret_Unsp_Gas_Util . LTD_Ret_Unsp_Trans_Util . LTD_Ret_Unsp_General . LTD_Ret_Unsp_Elem_Educ . LTD_Ret_Unsp_Other_Educ . LTD_Ret_Unsp_Other_NEC . Total_LTD_Out _44T, _49U LTD_Out_Private_Purp _44T LTD_Out_All_Other _49U Total_LTD_Out_Utility . LTD_Out_Util_Water . LTD_Out_Util_Electric . LTD_Out_Util_Gas_Supply . LTD_Out_Util_Transit . LTD_Out_General . LTD_Out_Gen_Elem_Educ . LTD_Out_Gen_Other_Educ . LTD_Out_Gen_Other_NEC . Total_LTD_Out_FFC . LTD_Out_FFC_Utility . LTD_Out_FFC_Water_Util . LTD_Out_FFC_Elec_Util . LTD_Out_FFC_Gas_Util . LTD_Out_FFC_Trans_Util . LTD_Out_FFC_General . LTD_Out_FFC_Elem_Educ . LTD_Out_FFC_Other_Educ . LTD_Out_FFC_Other_NEC . Tot_LTD_Out_NG . LTD_Out_NG_Utility . LTD_Out_NG_Water_Util . LTD_Out_NG_Elec_Util . LTD_Out_NG_Gas_Util . LTD_Out_NG_Trans_Util . LTD_Out_NG_General . LTD_Out_NG_Elem_Educ . LTD_Out_NG_Other_Educ . LTD_Out_NG_Private_Purp . LTD_Out_NG_Other_NEC . Total_Cash___Securities W01, W31, W61, X21, X30, Z77, Z78, X42, X44, X47, Y07,
Y08, Y21, Y61 Insur_Trust_Cash___Sec X21, X30, Z77, Z78, X42, X44, X47, Y07, Y08, Y21, Y61 Emp_Retire_Cash___Sec X21, X30, X35, Z77, Z78, X42, X47, X44 Emp_Retire_Cash___Dep X21 Emp_Retire_Total_Sec X30, X35, Z77, Z78, X42, X47, X44 Emp_Retire_Sec_Tot_Fed X30 Emp_Retire_Sec_S_L_Secur X35 Emp_Retire_Sec_Tot_Nong Z77, Z78, X42, X47, X44 Emp_Retire_Sec_Corp_Bds Z77 Emp_Retire_Sec_Corp_Stk Z78 Emp_Retire_Sec_Mortgages X42

Emp_Retire_Sec_Misc_Inv X47 Emp_Retire_Sec_Oth_Nong X44 Unemp_Comp_Cash___Sec Y07, Y08 Unemp_Comp_Bal_In_US_Trs Y07 Unemp_Comp_Other_Balance Y08 Nonin_Trust_Cash___Sec W01, W31, W61 Sinking_Fd_Cash___Sec W01 Bond_Fd_Cash___Sec W31 Oth_Nonin_Fd_Cash___Sec W61

Appendix C: Sas Code for Data Consolidation The following is the complete SAS code we used to consolidate all of the files we received from the census. Please refer to appendix A for step by step instructions for using this SAS code. * This sas macro merges the historical data files that the census provides; %macro census; * Defines the text that is repeated in each census file. Base text should be changed to your correct file path (it is declared twice in the code, so change both); %LET BaseText = E:/CensusData/IndFin/IndFin0; %LET EndTextA = a.Txt; %LET EndTextB = b.Txt; %LET EndTextC = c.Txt; %do i = 7 %to 0 %by -1; * Import the data from each of the three physical files in the current year; %Let FileName = &BaseText&i&EndTextA; *Creates concatenated file names following the census naming conventions; proc import datafile="&FileName" out=DataA dbms=dlm replace; delimiter=","; getnames=yes; GUESSINGROWS=700; *This takes longer to run than is optimal, but will help to ensure that the data types created by proc import are correct.; run; %Let FileName = &BaseText&i&EndTextB; proc import datafile="&FileName" out=DataB dbms=dlm replace; delimiter=","; getnames=yes; run; %Let FileName = &BaseText&i&EndTextC; proc import datafile="&FileName" out=DataC dbms=dlm replace; delimiter=","; getnames=yes; run; * Merge the three data items into one; Data LatestData; Merge DataA DataB DataC; by ID; run; * The if then else structure allows the larger data set to be created for the first set of files; %if &i = 7 %then %do; * Add trailing zeros to the ID number to match the format in more recent data; Data LargeData; set LatestData; run; %end; %else %do; * Append the most recently merged data to the larger data file; PROC APPEND BASE= LargeData DATA= LatestData force; RUN; %end;

%end; %LET BaseText = E:/CensusData/IndFin/IndFin; * Make sure to change this destination to match your file system; %do i = 70 %to 99; * Import the data from each of the three physical files in the current year; %Let FileName = &BaseText&i&EndTextA; *Creates concatenated file names following the census naming conventions; proc import datafile="&FileName" out=DataA dbms=dlm replace; delimiter=","; getnames=yes; GUESSINGROWS=700; run; %Let FileName = &BaseText&i&EndTextB; proc import datafile="&FileName" out=DataB dbms=dlm replace; delimiter=","; getnames=yes; run; %Let FileName = &BaseText&i&EndTextC; proc import datafile="&FileName" out=DataC dbms=dlm replace; delimiter=","; getnames=yes; run; * Merge the three data items into one; Data LatestData; Merge DataA DataB DataC; by ID; run; * Append the most recently merged data to the larger data file; PROC APPEND BASE= LargeData DATA= LatestData force; RUN; %end; %do i = 67 %to 67; * Import the data from each of the three physical files in the current year; %Let FileName = &BaseText&i&EndTextA; *Creates concatenated file names following the census naming conventions; proc import datafile="&FileName" out=DataA dbms=dlm replace; delimiter=","; getnames=yes; GUESSINGROWS=700; run; %Let FileName = &BaseText&i&EndTextB; proc import datafile="&FileName" out=DataB dbms=dlm replace; delimiter=","; getnames=yes; run; %Let FileName = &BaseText&i&EndTextC; proc import datafile="&FileName" out=DataC dbms=dlm replace; delimiter=","; getnames=yes; run; * Merge the three data items into one; Data LatestData; Merge DataA DataB DataC; by ID; run; * Append the most recently merged data to the larger data file; PROC APPEND BASE= LargeData DATA= LatestData force;

RUN; %end; %MEND Census; * This line runs the macro shown above; %Census; *Create variables not existing in earlier data that can be calculated from it; Data LargeData; Set LargeData; *Manipulate certain identification variables that can be improved in the overall database; FunctionCode = .; Enrollment = .; if Type_Code = '4' then do; FunctionCode = Population; Population = .; Enrollment = .; end; if Type_Code = '5' then do; FunctionCode = .; Enrollment = Population; Population = .; end; run; * We now need to format the newer census data to roughly match the format of the earlier data. This process is; * accomplished without a macro because there are only a few years of newer data, and the file names thend to be non-standard; * Make sure that you change the "Inflie" line on each of the data steps to the path for the files on your system. * Read the financial data file in fixed width format, dollar signs indicate values which are stored as characters; DATA FinancialData; INFILE 'E:/CensusData/2011/2011FinEstDAT_ALL5modp_pu.txt' MISSOVER; INPUT id_state $ 1-2 id_type $ 3 id_county $ 4-6 id_unit $ 7-9 id_add $ 10-14 itemcode $ 15-17 data 18-29 year 30-33 code $ 34; id = cats(of id_state id_type id_county id_unit); RUN; * Transpose the financial information file so that every government ID number corresponds to one row and every data item has its own column; PROC TRANSPOSE data=work.FinancialData out=work.TransposedData name=Year; var data; by id; id itemcode; run;

* Change the "year" variable in the finacnial data matrix to be the year we are currently working with; Data TransposedDates; Set work.TransposedData; Year = 2011; run; * Sort each of the matricies by ID code in preparation for merging them.; proc sort data=TransposedDates; by id; run; * Read the government information file as a fixed width text file. Dollar signs indicate fields that are coded as text.; DATA Identification; INFILE 'E:/CensusData/2011/fin_gid_2011.txt' MISSOVER; INPUT id_state $ 1-2 id_type $ 3 id_county $ 4-6 id_unit $ 7-9 id_add $ 10-14 Name $ 15-78 CountyName $ 79-113 FIPSstate $ 114-115 FIPScounty $ 116-118 FIPSplace $ 119-123 Population 124-132 PopYear $ 133-134 Enrollment 135-141 EnrollYear $ 142-143 FunctionCode 144-145 SchoolLevel $ 146-147 FYEnd $ 148-151 SurveyYear $ 152-153; id = cats(of id_state id_type id_county id_unit); RUN; * Merge the government identification file with the transposed, dated, finacial information file; Data LatestData; Merge Identification TransposedDates; By id; run; *Concatenate the Latest data to the larger data file preserving every data element for later reorganization; Data NewData; Set LatestData; Run; *Begin the same process for the 2010 data; * * * *; * Read the financial data file in fixed width format, dollar signs indicate values which are stored as characters; DATA FinancialData; INFILE 'E:/CensusData/2010/2010FinEstDAT_ALL12modp_pu.txt' MISSOVER; INPUT id_state $ 1-2 id_type $ 3 id_county $ 4-6 id_unit $ 7-9 id_add $ 10-14 itemcode $ 15-17 data 18-29 year 30-33 code $ 34; id = cats(of id_state id_type id_county id_unit); RUN; * Transpose the financial information file so that every government ID number corresponds to one row and every data item has its own column;

PROC TRANSPOSE data=work.FinancialData out=work.TransposedData name=Year; var data; by id; id itemcode; run; * Change the "year" variable in the finacnial data matrix to be the year we are currently working with; Data TransposedDates; Set work.TransposedData; Year = 2010; run; * Sort each of the matricies by ID code in preparation for merging them.; proc sort data=TransposedDates; by id; run; * Read the government information file as a fixed width text file. Dollar signs indicate fields that are coded as text.; DATA Identification; INFILE 'E:/CensusData/2010/fin_gid_2010.txt' MISSOVER; INPUT id_state $ 1-2 id_type $ 3 id_county $ 4-6 id_unit $ 7-9 id_add $ 10-14 Name $ 15-78 CountyName $ 79-113 FIPSstate $ 114-115 FIPScounty $ 116-118 FIPSplace $ 119-123 Population 124-132 PopYear $ 133-134 Enrollment 135-141 EnrollYear $ 142-143 FunctionCode 144-145 SchoolLevel $ 146-147 FYEnd $ 148-151 SurveyYear $ 152-153; id = cats(of id_state id_type id_county id_unit); RUN; * Merge the government identification file with the transposed, dated, finacial information file; Data LatestData; Merge Identification TransposedDates; By id; run; *Concatenate the Latest data to the larger data file preserving every data element for later reorganization; Data NewData; Set NewData LatestData; Run; *Begin the same process for the 2009 data; * * * *; * Read the financial data file in fixed width format, dollar signs indicate values which are stored as characters; DATA FinancialData; INFILE 'E:/CensusData/2009/2009FinEstDAT_ALL16modp_pu.txt'

MISSOVER; INPUT id_state $ 1-2 id_type $ 3 id_county $ 4-6 id_unit $ 7-9 id_add $ 10-14 itemcode $ 15-17 data 18-29 year 30-33 code $ 34; id = cats(of id_state id_type id_county id_unit); RUN; * Transpose the financial information file so that every government ID number corresponds to one row and every data item has its own column; PROC TRANSPOSE data=work.FinancialData out=work.TransposedData name=Year; var data; by id; id itemcode; run; * Change the "year" variable in the finacnial data matrix to be the year we are currently working with; Data TransposedDates; Set work.TransposedData; Year = 2009; run; * Sort each of the matricies by ID code in preparation for merging them.; proc sort data=TransposedDates; by id; run; * Read the government information file as a fixed width text file. Dollar signs indicate fields that are coded as text.; DATA Identification; INFILE 'E:/CensusData/2009/fin_gid_2009.txt' MISSOVER; INPUT id_state $ 1-2 id_type $ 3 id_county $ 4-6 id_unit $ 7-9 id_add $ 10-14 Name $ 15-78 CountyName $ 79-113 FIPSstate $ 114-115 FIPScounty $ 116-118 FIPSplace $ 119-123 Population 124-132 PopYear $ 133-134 Enrollment 135-141 EnrollYear $ 142-143 FunctionCode 144-145 SchoolLevel $ 146-147 FYEnd $ 148-151 SurveyYear $ 152-153; id = cats(of id_state id_type id_county id_unit); RUN; * Merge the government identification file with the transposed, dated, finacial information file; Data LatestData; Merge Identification TransposedDates; By id; run; *Concatenate the Latest data to the larger data file preserving every data element for later reorganization; Data NewData; Set NewData LatestData; Run; *Begin the same process for the 2008 data; * *

* *; * Read the financial data file in fixed width format, dollar signs indicate values which are stored as characters; DATA FinancialData; INFILE 'E:/CensusData/2008/2008FinInddiv15_modp3.txt' MISSOVER; INPUT id_state $ 1-2 id_type $ 3 id_county $ 4-6 id_unit $ 7-9 id_add $ 10-14 itemcode $ 15-17 data 18-29 year 30-33 code $ 34; id = cats(of id_state id_type id_county id_unit); RUN; * Transpose the financial information file so that every government ID number corresponds to one row and every data item has its own column; PROC TRANSPOSE data=work.FinancialData LET out=work.TransposedData name=Year; var data; by id; id itemcode; run; * Change the "year" variable in the finacnial data matrix to be the year we are currently working with; Data TransposedDates; Set work.TransposedData; Year = 2008; run; * Sort each of the matricies by ID code in preparation for merging them.; proc sort data=TransposedDates; by id; run; * Read the government information file as a fixed width text file. Dollar signs indicate fields that are coded as text.; DATA Identification; INFILE 'E:/CensusData/2008/fin_gid_2008.txt' MISSOVER; INPUT id_state $ 1-2 id_type $ 3 id_county $ 4-6 id_unit $ 7-9 id_add $ 10-14 Name $ 15-78 CountyName $ 79-113 FIPSstate $ 114-115 FIPScounty $ 116-118 FIPSplace $ 119-123 Population 124-132 PopYear $ 133-134 Enrollment 135-141 EnrollYear $ 142-143 FunctionCode 144-145 SchoolLevel $ 146-147 FYEnd $ 148-151 SurveyYear $ 152-153; id = cats(of id_state id_type id_county id_unit); RUN; * Merge the government identification file with the transposed, dated, finacial information file; Data LatestData; Merge Identification TransposedDates; By id; run;

*Concatenate the Latest data to the larger data file preserving every data element for later reorganization; Data NewData; Set NewData LatestData; Run; * * * * *Manually convert the newer data to the format of the older data and keep only variables that exist in the final data set; Data ConvertedNewData (keep= SurveyYr Year4 ID State_Code Type_Code County Name FIPS_Code_State FYEndDate YearPop SchLevCode Population Total_Revenue Total_Rev_Own_Sources General_Revenue Gen_Rev_Own_Sources Total_Taxes Property_Tax Tot_Sales___Gr_Rec_Tax Total_Gen_Sales_Tax Total_Select_Sales_Tax Alcoholic_Beverage_Tax Amusement_Tax Insurance_Premium_Tax Motor_Fuels_Tax Pari_mutuels_Tax Public_Utility_Tax Tobacco_Tax Other_Select_Sales_Tax Total_License_Taxes Alcoholic_Beverage_Lic Amusement_License Corporation_License Hunting___Fishing_License Motor_Vehicle_License Motor_Veh_Oper_License Public_Utility_License Occup_and_Bus_Lic_NEC Other_License_Taxes Total_Income_Taxes Individual_Income_Tax Corp_Net_Income_Tax Death_and_Gift_Tax Docum_and_Stock_Tr_Tax Severance_Tax Taxes_NEC Total_IG_Revenue Total_Fed_IG_Revenue Fed_IGR_Air_Transport Fed_IGR_Education Fed_IGR_Emp_Sec_Adm Fed_IGR_Gen_Rev_Shar Fed_IGR_Gen_Support Fed_IGR_Health___Hos Fed_IGR_Highways Fed_IGR_Transit_Sub Fed_IGR_Hous_Com_Dev Fed_IGR_Natural_Res Fed_IGR_Public_Welf Fed_IGR_Sewerage Fed_IGR_Other Total_State_IG_Revenue State_IGR_Education State_IGR_Tax_Relief State_IGR_Oth_Gen_Sup State_IGR_Health___Hos State_IGR_Highways State_IGR_Transit_Sub State_IGR_Hous_Com_Dev State_IGR_Public_Welf State_IGR_Sewerage State_IGR_Other Tot_Local_IG_Rev Local_IGR_InterSchool_Aid Local_IGR_Other_Education Local_IGR_Oth_Gen_Sup Local_IGR_Health___Hos Local_IGR_Highways Local_IGR_Transit_Sub Local_IGR_Hous_Com_Dev Local_IGR_Public_Welf Local_IGR_Sewerage Local_IGR_Other Tot_Chgs_and_Misc_Rev Total_General_Charges Chg_Air_Transportation Chg_Misc_Com_Activ Chg_Total_Education Chg_Elem_Ed_Sch_Lunch Chg_Elem_Ed_Tuition Chg_Elem_Ed_NEC Chg_Total_High_Ed Chg_Hospitals Chg_Regular_Highways Chg_Toll_Highways Chg_Housing___Comm_Dev Chg_Total_Nat_Res Chg_Parking Chg_Parks___Recreation Chg_Sewerage Chg_Solid_Waste_Mgmt Chg_Water_Transport Chg_All_Other_NEC Misc_General_Revenue Special_Assessments Prop_Sale_Hous_Com_Dev Prop_Sale_Other Interest_Revenue Fines_and_Forfeits Rents_and_Royalties Net_Lottery_Revenue Misc_General_Rev_NEC Liquor_Stores_Revenue Total_Utility_Revenue Water_Utility_Revenue Electric_Utility_Rev Gas_Utility_Rev Transit_Utility_Rev Total_Insur_Trust_Rev Total_Insur_Trust_Ctrb Tot_Ins_Trust_Inv_Rev Total_Emp_Ret_Rev Emp_Ret_Total_Ctrib Emp_Ret_Loc_Emp_Ctrib Emp_Ret_Loc_To_Loc_Sys Emp_Ret_From_Other_Gov Emp_Ret_Sta_To_Sta_Ctr Emp_Ret_Int_Rev Emp_Ret_Other_Earnings Total_Unemp_Rev Unemp_Payroll_Tax Unemp_Int_Revenue Unemp_Federal_Advances Total_Expenditure Total_IG_Expenditure Direct_Expenditure Total_Current_Expend Total_Current_Oper Total_Capital_Outlays Total_Construction

Tot_Assist___Subsidies Total_Interest_on_Debt Total_Insur_Trust_Ben Total_Salaries___Wages General_Expenditure IG_Exp_To_State_Govt IG_Exp_To_Local_Govts IG_Exp_To_Federal_Govt Direct_General_Expend General_Current_Expend General_Current_Oper General_Capital_Outlay General_Construction General_Assist___Sub General_Debt_Interest Air_Trans_Total_Expend Air_Trans_Direct_Expend Air_Trans_Cap_Outlay Air_Trans_Construction Air_Trans_IG_To_State Air_Trans_IG_Local_Govts Misc_Com_Activ_Tot_Exp Misc_Com_Activ_Cap_Out Misc_Com_Activ_Constr Correct_Total_Exp Correct_Direct_Exp Correct_Cap_Outlay Correct_Construct Correct_IG_To_St Correct_IG_Loc_Govts Total_Educ_Total_Exp Total_Educ_Direct_Exp Total_Educ_Assist___Sub Total_Educ_Cap_Outlay Total_Educ_Construct Elem_Educ_Total_Exp Elem_Educ_Direct_Exp Elem_Educ_Cap_Outlay Elem_Educ_Construction Elem_Educ_IG_To_State Elem_Educ_IG_Local_Govts Elem_Educ_IG_Sch_to_Sch Higher_Ed_Total_Exp Higher_Ed_Direct_Exp Higher_Ed_Cap_Outlay Higher_Ed_Construct Higher_Ed_IG_To_St Higher_Ed_IG_Loc_Govts Educ_NEC_Total_Expend Educ_NEC_Direct_Expend Educ_NEC_Assistance Educ_NEC_Cap_Outlay Educ_NEC_Construction Educ_NEC_IG_To_State Educ_NEC_IG_Local_Govts Emp_Sec_Adm_Direct_Exp Emp_Sec_Adm_Cap_Outlay Emp_Sec_Adm_Construct Fin_Admin_Total_Exp Fin_Admin_Direct_Exp Fin_Admin_Cap_Outlay Fin_Admin_Construction Fin_Admin_IG_To_State Fin_Admin_IG_Local_Govts Fire_Prot_Total_Expend Fire_Prot_Direct_Exp Fire_Prot_Cap_Outlay Fire_Prot_Construction Fire_Prot_IG_To_State Fire_Prot_IG_Local_Govts Judicial_Total_Expend Judicial_Direct_Expend Judicial_Cap_Outlay Judicial_Construction Judicial_IG_To_State Judicial_IG_Local_Govts Cen_Staff_Total_Expend Cen_Staff_Direct_Exp Cen_Staff_Cap_Outlay Cen_Staff_Construction Cen_Staff_IG_To_State Cen_Staff_IG_Local_Govts Gen_Pub_Bldg_Total_Exp Gen_Pub_Bldg_Cap_Out Gen_Pub_Bldg_Construct Health_Total_Expend Health_Direct_Expend Health_Capital_Outlay Health_Construction Health_IG_To_State Health_IG_Local_Govts Total_Hospital_Total_Exp Total_Hospital_Dir_Exp Total_Hospital_Cap_Out Total_Hospital_Construct Total_Hospital_IG_To_State Total_Hospital_IG_Loc_Govts Own_Hospital_Total_Exp Own_Hospital_Cap_Out Own_Hospital_Construct Hosp_Other_Total_Exp Hosp_Other_Direct_Exp Hosp_Other_Cap_Outlay Hosp_Other_Construct Hosp_Other_IG_To_State Hosp_Other_IG_Loc_Govts Total_Highways_Tot_Exp Total_Highways_Dir_Exp Total_Highways_Cap_Out Total_Highways_Construct Regular_Hwy_Total_Exp Regular_Hwy_Direct_Exp Regular_Hwy_Cap_Outlay Regular_Hwy_Construct Regular_Hwy_IG_To_Sta Regular_Hwy_IG_Loc_Govts Toll_Hwy_Total_Expend Toll_Hwy_Cap_Outlay Toll_Hwy_Construction Transit_Sub_Total_Exp Transit_Sub_Direct_Sub Transit_Sub_IG_To_Sta Transit_Sub_IG_Loc_Govts Transit_Sub_To_Own_Sys Hous___Com_Total_Exp Hous___Com_Direct_Exp Hous___Com_Cap_Outlay Hous___Com_Construct Hous___Com_IG_To_State Hous___Com_IG_Loc_Govts Libraries_Total_Expend Libraries_Direct_Exp Libraries_Cap_Outlay Libraries_Construction Libraries_IG_To_State Libraries_IG_Local_Govts Natural_Res_Total_Exp Natural_Res_Direct_Exp Natural_Res_Cap_Outlay Natural_Res_Construct Natural_Res_IG_To_Sta Natural_Res_IG_Loc_Govts Parking_Total_Expend Parking_Direct_Expend Parking_Capital_Outlay

Parking_Construction Parking_IG_To_State Parking_IG_Local_Govts Parks___Rec_Total_Exp Parks___Rec_Direct_Exp Parks___Rec_Cap_Outlay Parks___Rec_Construct Parks___Rec_IG_To_Sta Parks___Rec_IG_Loc_Govts Police_Prot_Total_Exp Police_Prot_Direct_Exp Police_Prot_Cap_Outlay Police_Prot_Construct Police_Prot_IG_To_Sta Police_Prot_IG_Loc_Govts Prot_Insp_Total_Exp Prot_Insp_Direct_Exp Prot_Insp_Cap_Outlay Prot_Insp_Construction Prot_Insp_IG_To_State Prot_Insp_IG_Local_Govts Public_Welf_Total_Exp Public_Welf_Direct_Exp Public_Welf_Cash_Asst Public_Welf_Cap_Outlay Public_Welf_Construct Welf_Categ_Total_Exp Welf_Categ_Cash_Assist Welf_Categ_IG_To_State Welf_Categ_IG_Loc_Govts Welf_Cash_Total_Exp Welf_Cash_Cash_Assist Welf_Cash_IG_Local_Govts Welf_Vend_Pmts_Medical Welf_Vend_Pmts_NEC Welf_State_Share_Part_D Welf_Ins_Total_Exp Welf_Ins_Cap_Outlay Welf_Ins_Construction Welf_NEC_Total_Expend Welf_NEC_Direct_Expend Welf_NEC_Cap_Outlay Welf_NEC_Construction Welf_NEC_IG_To_State Welf_NEC_IG_Local_Govts Sewerage_Total_Expend Sewerage_Direct_Expend Sewerage_Cap_Outlay Sewerage_Construction Sewerage_IG_To_State Sewerage_IG_Local_Govts SW_Mgmt_Total_Expend SW_Mgmt_Direct_Expend SW_Mgmt_Capital_Outlay SW_Mgmt_Construction SW_Mgmt_IG_To_State SW_Mgmt_IG_Local_Govts Water_Trans_Total_Exp Water_Trans_Direct_Exp Water_Trans_Cap_Outlay Water_Trans_Construct Water_Trans_IG_To_Sta Water_Trans_IG_Loc_Govts Interest_on_Gen_Debt General_NEC_Total_Exp General_NEC_Direct_Exp VetBonus General_NEC_Cap_Outlay General_NEC_Construct General_NEC_IG_To_St General_NEC_IG_Loc_Govts General_NEC_IG_To_Fed Liquor_Stores_Tot_Exp Liquor_Stores_Cap_Out Liquor_Stores_Constr Total_Util_Total_Exp Total_Util_Inter_Exp Total_Util_Cap_Outlay Total_Util_Construct Water_Util_Total_Exp Water_Util_Inter_Exp Water_Util_Cap_Outlay Water_Util_Construct Elec_Util_Total_Exp Elec_Util_Inter_Exp Elec_Util_Cap_Outlay Elec_Util_Construct Gas_Util_Total_Exp Gas_Util_Inter_Exp Gas_Util_Cap_Outlay Gas_Util_Construct Trans_Util_Total_Exp Trans_Util_Inter_Exp Trans_Util_Cap_Outlay Trans_Util_Construct Emp_Ret_Total_Expend Emp_Ret_Benefit_Paymts Emp_Ret_Withdrawals Emp_Ret_Other_Paymts Unemp_Comp_Total_Exp Unemp_Comp_Ben_Paymts Unemp_Ext___Spec_Pmts Total_Debt_Outstanding Total_Long_Term_Debt_Out ST_Debt_End_of_Year Total_Beg_LTD_Out Beg_LTD_Out_Private_Purp Beg_LTD_Out_All_Other Beg_LTD_Out_Utility Beg_LTD_Out_Water_Util Beg_LTD_Out_Elec_Util Beg_LTD_Out_Gas_Util Beg_LTD_Out_Trans_Util Beg_LTD_Out_General Beg_LTD_Out_Education Beg_LTD_Out_Priv_Purp Beg_LTD_Out_Other_NEC Total_LTD_Issued LTD_Iss_Private_Purp LTD_Iss_All_Other LTD_Iss_Utility LTD_Iss_Util_Water LTD_Iss_Util_Electric LTD_Iss_Util_Gas_Supply LTD_Iss_Util_Transit LTD_Iss_General LTD_Iss_Gen_Elem_Educ LTD_Iss_Gen_Other_Educ LTD_Iss_Gen_Other_NEC Total_LTD_Iss_FFC LTD_Iss_FFC_Utility LTD_Iss_FFC_Water_Util LTD_Iss_FFC_Elec_Util LTD_Iss_FFC_Gas_Util LTD_Iss_FFC_Trans_Util LTD_Iss_FFC_General LTD_Iss_FFC_Elem_Educ LTD_Iss_FFC_Other_Educ LTD_Iss_FFC_Other_NEC Total_LTD_Iss_NG LTD_Iss_NG_Utility LTD_Iss_NG_Water_Util LTD_Iss_NG_Elec_Util LTD_Iss_NG_Gas_Util LTD_Iss_NG_Trans_Util LTD_Iss_NG_General LTD_Iss_NG_Elem_Educ LTD_Iss_NG_Other_Educ LTD_Iss_NG_Private_Purp LTD_Iss_NG_Other_NEC Total_LTD_Iss_Unsp LTD_Iss_Unsp_Utility LTD_Iss_Unsp_Water_Util LTD_Iss_Unsp_Elec_Util LTD_Iss_Unsp_Gas_Util LTD_Iss_Unsp_Trans_Util LTD_Iss_Unsp_General LTD_Iss_Unsp_Elem_Educ LTD_Iss_Unsp_Other_Educ LTD_Iss_Unsp_Other_NEC Total_LTD_Retired LTD_Ret_Private_Purp LTD_Ret_All_Other LTD_Ret_Utility LTD_Ret_Util_Water

LTD_Ret_Util_Electric LTD_Ret_Util_Gas_Supply LTD_Ret_Util_Transit LTD_Ret_General LTD_Ret_Gen_Elem_Educ LTD_Ret_Gen_Other_Educ LTD_Ret_Gen_Other_NEC Total_LTD_Ret_FFC LTD_Ret_FFC_Utility LTD_Ret_FFC_Water_Util LTD_Ret_FFC_Elec_Util LTD_Ret_FFC_Gas_Util LTD_Ret_FFC_Trans_Util LTD_Ret_FFC_General LTD_Ret_FFC_Elem_Educ LTD_Ret_FFC_Other_Educ LTD_Ret_FFC_Other_NEC Total_LTD_Ret_NG LTD_Ret_NG_Utility LTD_Ret_NG_Water_Util LTD_Ret_NG_Elec_Util LTD_Ret_NG_Gas_Util LTD_Ret_NG_Trans_Util LTD_Ret_NG_General LTD_Ret_NG_Elem_Educ LTD_Ret_NG_Other_Educ LTD_Ret_NG_Private_Purp LTD_Ret_NG_Other_NEC Total_LTD_Ret_Unsp LTD_Ret_Unsp_Utility LTD_Ret_Unsp_Water_Util LTD_Ret_Unsp_Elec_Utili LTD_Ret_Unsp_Gas_Util LTD_Ret_Unsp_Trans_Util LTD_Ret_Unsp_General LTD_Ret_Unsp_Elem_Educ LTD_Ret_Unsp_Other_Educ LTD_Ret_Unsp_Other_NEC Total_LTD_Out LTD_Out_Private_Purp LTD_Out_All_Other Total_LTD_Out_Utility LTD_Out_Util_Water LTD_Out_Util_Electric LTD_Out_Util_Gas_Supply LTD_Out_Util_Transit LTD_Out_General LTD_Out_Gen_Elem_Educ LTD_Out_Gen_Other_Educ LTD_Out_Gen_Other_NEC Total_LTD_Out_FFC LTD_Out_FFC_Utility LTD_Out_FFC_Water_Util LTD_Out_FFC_Elec_Util LTD_Out_FFC_Gas_Util LTD_Out_FFC_Trans_Util LTD_Out_FFC_General LTD_Out_FFC_Elem_Educ LTD_Out_FFC_Other_Educ LTD_Out_FFC_Other_NEC Tot_LTD_Out_NG LTD_Out_NG_Utility LTD_Out_NG_Water_Util LTD_Out_NG_Elec_Util LTD_Out_NG_Gas_Util LTD_Out_NG_Trans_Util LTD_Out_NG_General LTD_Out_NG_Elem_Educ LTD_Out_NG_Other_Educ LTD_Out_NG_Private_Purp LTD_Out_NG_Other_NEC Total_Cash___Securities Insur_Trust_Cash___Sec Emp_Retire_Cash___Sec Emp_Retire_Cash___Dep Emp_Retire_Total_Sec Emp_Retire_Sec_Tot_Fed Emp_Retire_Sec_S_L_Secur Emp_Retire_Sec_Tot_Nong Emp_Retire_Sec_Corp_Bds Emp_Retire_Sec_Corp_Stk Emp_Retire_Sec_Mortgages Emp_Retire_Sec_Misc_Inv Emp_Retire_Sec_Oth_Nong Unemp_Comp_Cash___Sec Unemp_Comp_Bal_In_US_Trs Unemp_Comp_Other_Balance Nonin_Trust_Cash___Sec Sinking_Fd_Cash___Sec Bond_Fd_Cash___Sec Oth_Nonin_Fd_Cash___Sec FunctionCode Enrollment); set NewData; * Convert variables to ones that exist in the earlier dataset. Multiplying by 1 converts character variables to numeric formats; SurveyYr = SurveyYear*1; Year4 = Year*1; State_Code = id_state; Type_Code = id_type; County = id_County; FIPS_Code_State = FIPSstate; FYEndDate = FYEnd; YearPop = PopYear; SchLevCode = SchoolLevel; *Consolidate and name variables; *Revenue; Total_Revenue = sum(B01, B21, B22, B30, B42, B46, B50, B59, B79, B80, B89, B91, B92, B93, B94, C21, C30, C42, C46, C50, C79, C80, C89, C91, C92, C93, C94, D21, D30, D42, D46, D50, D79, D80, D89, D91, D92, D93, D94, T01, T09, T10, T11, T12, T13, T14, T15, T16, T19, T20, T21, T22, T23, T24, T25, T27, T28, T29, T40, T41, T50, T51, T53, T99, A01, A03, A09, A10, A12, A16, A18, A21, A36, A44, A45, A50, A56, A59, A60, A61, A80, A81, A87, A89, U01, U11, U20, U21, U30, U40, U41, U50, U95, U99, A90, A91, A92, A93, A94, X01, X02, X05, X08, Y01, Y02, Y04, Y11, Y12, Y51, Y52);

General_Revenue = sum(B01, B21, B22, B30, B42, B46, B50, B59, B79, B80, B89, B91, B92, B93, B94, C21, C30, C42, C46, C50, C79, C80, C89, C91, C92, C93, C94, D21, D30, D42, D46, D50, D79, D80, D89, D91, D92, D93, D94, T01, T09, T10, T11, T12, T13, T14, T15, T16, T19, T20, T21, T22, T23, T24, T25, T27, T28, T29, T40, T41, T50, T51, T53, T99, A01, A03, A09, A10, A12, A16, A18, A21, A36, A44, A45, A50, A56, A59, A60, A61, A80, A81, A87, A89, U01, U11, U20, U21, U30, U40, U41, U50, U95, U99); Gen_Rev_Own_Sources = sum(A01, A03, A09, A10, A12, A16, A18, A21, A36, A44, A45, A50, A56, A59, A60, A61, A80, A81, A87, A89, T01, T09, T10, T11, T12, T13, T14, T15, T16, T19, T20, T21, T22, T23, T24, T25, T27, T28, T29, T40, T41, T50, T51, T53, T99, U01, U11, U20, U21, U30, U40, U41, U50, U95, U99); Total_Rev_Own_Sources = sum(T01, T09, T10, T11, T12, T13, T14, T15, T16, T19, T20, T21, T22, T23, T24, T25, T27, T28, T29, T40, T41, T50, T51, T53, T99, A01, A03, A09, A10, A12, A16, A18, A21, A36, A44, A45, A50, A56, A59, A60, A61, A80, A81, A87, A89, U01, U11, U20, U21, U30, U40, U41, U50, U95, U99, A90, A91, A92, A93, A94, X01, X02, X05, X08, Y01, Y02, Y04, Y11, Y12, Y51, Y52); *Taxes; Total_Taxes = sum(T01, T09, T10, T11, T12, T13, T14, T15, T16, T19, T20, T21, T22, T23, T24, T25, T27, T28, T29, T40, T41, T50, T51, T53, T99); Property_Tax = T01; Tot_Sales___Gr_Rec_Tax = sum(T09, T10, T11, T12, T13, T14, T15, T16, T19); Total_Gen_Sales_Tax = T09; Total_Select_Sales_Tax = sum(T10, T11, T12, T13, T14, T15, T16, T19); Alcoholic_Beverage_Tax = T10; Amusement_Tax = T11; Insurance_Premium_Tax = T12; Motor_Fuels_Tax = T13; Pari_mutuels_Tax = T14; Public_Utility_Tax = T15; Tobacco_Tax = T16; Other_Select_Sales_Tax = T19; *Licenses; Total_License_Taxes = sum(T20 , T21 , T22 , T23 , T24 , T25 , T27 , T28 , T29); Alcoholic_Beverage_Lic = T20; Amusement_License = T21; Corporation_License = T22; Hunting___Fishing_License = T23; Motor_Vehicle_License = T24; Motor_Veh_Oper_License = T25; Public_Utility_License = T27; Occup_and_Bus_Lic_NEC = T28; Other_License_Taxes = T29; *Income Taxes; Total_Income_Taxes = sum(T40 , T41 , T50 , T51 , T53 , T99); Individual_Income_Tax = T40; Corp_Net_Income_Tax = T41; Death_and_Gift_Tax = T50; Docum_and_Stock_Tr_Tax = T51;

Severance_Tax = T53; Taxes_NEC = T99; * Intergovernmental Revenue; Total_IG_Revenue = sum(B01, B21, B22, B30, B42, B46, B50, B59, B79, B80, B89, B91, B92, B93, B94, C21, C30, C42, C46, C50, C79, C80, C89, C91, C92, C93, C94, D21, D30, D42, D46, D50, D79, D80, D89, D91, D92, D93, D94); * Federal; Total_Fed_IG_Revenue = sum(B01, B21, B22, B30, B42, B46, B50, B59, B79, B80, B89, B91, B92, B93, B94); Fed_IGR_Air_Transport = B01; Fed_IGR_Education = B21; Fed_IGR_Emp_Sec_Adm = B22; Fed_IGR_Gen_Rev_Shar = .; *Obsolete after 1987; Fed_IGR_Gen_Support = B30; Fed_IGR_Health___Hos = B42; Fed_IGR_Highways = B46; Fed_IGR_Transit_Sub = B94; Fed_IGR_Hous_Com_Dev = B50; Fed_IGR_Natural_Res = B59; Fed_IGR_Public_Welf = B79; Fed_IGR_Sewerage = B80; Fed_IGR_Other = B89; * State; Total_State_IG_Revenue = sum(C21, C30, C42, C46, C50, C79, C80, C89, C91, C92, C93, C94); State_IGR_Education = C21; State_IGR_Tax_Relief = .; *Obsolete after 1987; State_IGR_Oth_Gen_Sup = C30; State_IGR_Health___Hos = C42; State_IGR_Highways = C46; State_IGR_Transit_Sub = C94; State_IGR_Hous_Com_Dev = C50; State_IGR_Public_Welf = C79; State_IGR_Sewerage = C80; State_IGR_Other = C89; * Local; Tot_Local_IG_Rev = sum(D21, D30, D42, D46, D50, D79, D80, D89, D91, D92, D93, D94); Local_IGR_InterSchool_Aid = D11; Local_IGR_Other_Education = D21; Local_IGR_Oth_Gen_Sup = D30; Local_IGR_Health___Hos = D42; Local_IGR_Highways = D46; Local_IGR_Transit_Sub = D94; Local_IGR_Hous_Com_Dev = D50; Local_IGR_Public_Welf = D79; Local_IGR_Sewerage = D80; Local_IGR_Other = D89; * Charges and Misc Revenue;

Tot_Chgs_and_Misc_Rev = sum(A01, A03, A09, A10, A12, A16, A18, A21, A36, A44, A45, A50, A56, A59, A60, A61, A80, A81, A87, A89, U01, U11, U20, U21, U30, U40, U41, U50, U95, U99); * Charges; Total_General_Charges = sum(A01, A03, A09, A10, A12, A16, A18, A21, A36, A44, A45, A50, A56, A59, A60, A61, A80, A81, A87, A89); Chg_Air_Transportation = A01; Chg_Misc_Com_Activ = A03; Chg_Total_Education = sum(A09, A10, A12, A16, A18, A21); Chg_Elem_Ed_Sch_Lunch = A09; Chg_Elem_Ed_Tuition = A10; Chg_Elem_Ed_NEC = A12; Chg_Total_High_Ed = sum(A16, A18); Chg_Hospitals = A36; Chg_Regular_Highways = A44; Chg_Toll_Highways = A45; Chg_Housing___Comm_Dev = A50; Chg_Total_Nat_Res = sum(A56 , A59); Chg_Parking = A60; Chg_Parks___Recreation = A61; Chg_Sewerage = A80; Chg_Solid_Waste_Mgmt = A81; Chg_Water_Transport = A87; Chg_All_Other_NEC = A89; * Misc Revenue; Misc_General_Revenue = sum(U01, U11, U20, U21, U30, U40, U41, U50, U95, U99); Special_Assessments = U01; Prop_Sale_Hous_Com_Dev = .; *Deleted as of 2005 and reported in U11 Prop_Sale_Other; Prop_Sale_Other = U11; Interest_Revenue = U20; Fines_and_Forfeits = U30; Rents_and_Royalties = sum(U40 , U41); Net_Lottery_Revenue = U95; Misc_General_Rev_NEC = U99; * Liquor and Utilities; Liquor_Stores_Revenue = A90; Total_Utility_Revenue = sum(A91, A92, A93, A94); Water_Utility_Revenue = A91; Electric_Utility_Rev = A92; Gas_Utility_Rev = A93; Transit_Utility_Rev = A94; * Insurance Trusts; Total_Insur_Trust_Rev = sum(X01, X02, X05, X08, Y01, Y02, Y04, Y11, Y12, Y51, Y52); Total_Insur_Trust_Ctrb = sum(X01, X02, X05, Y01); Tot_Ins_Trust_Inv_Rev = sum(X08 , Y02); *Retirement Plan Data; Total_Emp_Ret_Rev = sum(X01, X02, X05, X08); Emp_Ret_Total_Ctrib = sum(X01, X02, X05); Emp_Ret_Loc_Emp_Ctrib = X01;

Emp_Ret_Loc_To_Loc_Sys = X04; Emp_Ret_From_Other_Gov = X05; Emp_Ret_Sta_To_Sta_Ctr = X06; Emp_Ret_Int_Rev = X08; Emp_Ret_Other_Earnings = .; *Consolidated with X08 Emp_Ret_Int_Rev in 1990; * Old data does not have Worker's Comp information; * Unemployment Revenue; Total_Unemp_Rev = sum(Y01, Y02, Y04); Unemp_Payroll_Tax = Y01; Unemp_Int_Revenue = Y02; Unemp_Federal_Advances = Y04; *Expenses; Total_Expenditure = sum(E01, E03, E04, E05, E12, E16, E18, E21, E22, E23, E24, E25, E26, E29, E31, E32, E36, E44, E44, E45, E50, E52, E55, E56, E59, E60, E61, E62, E66, E74, E75, E77, E79, E80, E81, E85, E87, E89, E90, E91, E92, E93, E94, I89, I91, I92, I93, I94, J19, J67, J68, J85, X11, X12, Y05, Y06, Y14, Y53, F01, F03, F04, F05, F12, F16, F18, F21, F22, F23, F24, F25, F26, F29, F31, F32, F36, F44, F45, F50, F52, F55, F56, F59, F60, F61, F62, F66, F77, F79, F80, F81, F85, F87, F89, F90, F91, F92, F93, F94, G01, G03, G04, G05, G12, G16, G18, G21, G22, G23, G24, G25, G26, G29, G31, G32, G36, G44, G45, G50, G52, G55, G56, G59, G60, G61, G62, G66, G77, G79, G80, G81, G85, G87, G89, G90, G91, G92, G93, G94, L01, L04, L05, L12, L18, L23, L25, L29, L32, L36, L44, L52, L59, L60, L61, L62, L66, L67, L79, L80, L81, L87, L89, L91, L92, L93, L94, M01, M04, M05, M12, M18, M21, M23, M24, M25, M29, M30, M32, M36, M44, M50, M52, M55, M56, M59, M60, M61, M62, M66, M67, M68, M79, M80, M81, M87, M89, M91, M92, M93, M94, Q12, Q18, S67, S74, S89); *Totals; Total_IG_Expenditure = sum(L01, L04, L05, L12, L18, L23, L25, L29, L32, L36, L44, L50, L52, L59, L60, L61, L62, L66, L67, L79, L80, L81, L87, L89, L91, L92, L93, L94, M01, M04, M05, M12, M18, M21, M23, M24, M25, M29, M30, M32, M36, M44, M50, M52, M52, M55, M56, M59, M60, M61, M62, M66, M67, M68, M79, M80, M81, M87, M89, M91, M92, M93, M94, Q12, Q18, S67, S89); Direct_Expenditure = sum(E01, E03, E04, E05, E12, E16, E18, E21, E22, E23, E24, E25, E26, E29, E31, E32, E36, E44, E45, E50, E52, E55, E56, E59, E60, E61, E62, E66, E74, E75, E77, E79, E80, E81, E85, E87, E89, E90, E91, E92, E93, E94, F01, F03, F04, F05, F12, F16, F18, F21, F22, F23, F24, F25, F26, F29, F31, F32, F36, F44, F45, F50, F52, F55, F56, F59, F60, F61, F62, F66, F77, F79, F80, F81, F85, F87, F89, F90, F91, F92, F93, F94, G01, G03, G04, G05, G12, G16, G18, G21, G22, G23, G24, G25, G26, G29, G31, G32, G36, G44, G45, G50, G52, G55, G56, G59, G60, G61, G62, G66, G77, G79, G80, G81, G85, G87, G89, G90, G91, G92, G93, G94, X11, X12, Y05, Y06, Y14, Y53, J19, J67, J68, J85, I89, I91, I92, I93, I94); Total_Current_Oper = sum(E01, E03, E04, E05, E12, E16, E18, E21, E22, E23, E24, E25, E26, E29, E31, E32, E36, E44, E45, E50, E52, E55, E56, E59, E60, E61, E62, E66, E74, E75, E77, E79, E80, E81, E85, E87, E89, E90, E91, E92, E93, E94); Total_Capital_Outlays = sum(F01, F03, F04, F05, F12, F16, F18, F21, F22, F23, F24, F25, F26, F29, F31, F32, F36, F44, F45, F50, F52, F55, F56, F59, F60, F61, F62, F66, F77, F79, F80, F81, F85, F87, F89, F90, F91, F92, F93, F94, G01, G03, G04, G05, G12, G16, G18, G21, G22, G23, G24, G25,

G26, G29, G31, G32, G36, G44, G45, G50, G52, G55, G56, G59, G60, G61, G62, G66, G77, G79, G80, G81, G85, G87, G89, G90, G91, G92, G93, G94); Total_Construction = sum(F01, F03, F04, F05, F12, F16, F18, F21, F22, F23, F24, F25, F26, F29, F31, F32, F36, F44, F45, F50, F52, F55, F56, F59, F60, F61, F62, F66, F77, F79, F80, F81, F85, F87, F89, F90, F91, F92, F93, F94); Tot_Assist___Subsidies = sum(J19, J67, J68, J85); Total_Interest_on_Debt = sum(I89, I91, I92, I93, I94); Total_Insur_Trust_Ben = sum(X11, X12, Y05, Y06, Y14, Y53); Total_Salaries___Wages = Z00; Total_Current_Expend = sum(Total_Expenditure, - Total_Capital_Outlays); * General Expenses; General_Expenditure = sum(E01, E03, E04, E05, E12, E16, E18, E21, E22, E23, E24, E25, E26, E29, E31, E32, E36, E44, E45, E50, E52, E55, E56, E59, E60, E61, E62, E66, E74, E75, E77, E79, E80, E81, E85, E87, E89, E90, E91, E92, E93, E94, F01, F03, F04, F05, F12, F16, F18, F21, F22, F23, F24, F25, F26, F29, F31, F32, F36, F44, F45, F50, F52, F55, F56, F59, F60, F61, F62, F66, F77, F79, F80, F81, F85, F87, F89, F90, F91, F92, F93, F94, G01, G03, G04, G05, G12, G16, G18, G21, G22, G23, G24, G25, G26, G29, G31, G32, G36, G44, G45, G50, G52, G55, G56, G59, G60, G61, G62, G66, G77, G79, G80, G81, G85, G87, G89, G90, G91, G92, G93, G94, X11, X12, Y05, Y06, Y14, Y53, J19, J67, J68, J85, I89, I91, I92, I93, I94); IG_Exp_To_State_Govt = sum(L01, L04, L05, L12, L18, L23, L25, L29, L32, L36, L44, L50, L52, L59, L60, L61, L62, L66, L67, L79, L80, L81, L87, L89, L91, L92, L93, L94); IG_Exp_To_Local_Govts = sum(M01, M04, M05, M12, M18, M21, M23, M24, M25, M29, M30, M32, M36, M44, M50, M52, M52, M55, M56, M59, M60, M61, M62, M66, M67, M68, M79, M80, M81, M87, M89, M91, M92, M93, M94); IG_Exp_To_Federal_Govt = sum(S67, S74, S89); Direct_General_Expend = sum(E01, E03, E04, E05, E12, E16, E18, E21, E22, E23, E24, E25, E26, E29, E31, E32, E36, E44, E45, E50, E52, E55, E56, E59, E60, E61, E62, E66, E74, E75, E77, E79, E80, E81, E85, E87, E89, E90, E91, E92, E93, E94, F01, F03, F04, F05, F12, F16, F18, F21, F22, F23, F24, F25, F26, F29, F31, F32, F36, F44, F45, F50, F52, F55, F56, F59, F60, F61, F62, F66, F77, F79, F80, F81, F85, F87, F89, F90, F91, F92, F93, F94, G01, G03, G04, G05, G12, G16, G18, G21, G22, G23, G24, G25, G26, G29, G31, G32, G36, G44, G45, G50, G52, G55, G56, G59, G60, G61, G62, G66, G77, G79, G80, G81, G85, G87, G89, G90, G91, G92, G93, G94, X11, X12, Y05, Y06, Y14, Y53, J19, J67, J68, J85, I89, I91, I92, I93, I94); General_Current_Oper = sum(E01, E03, E04, E05, E12, E16, E18, E21, E22, E23, E24, E25, E26, E29, E31, E32, E36, E44, E45, E50, E52, E55, E56, E59, E60, E61, E62, E66, E74, E75, E77, E79, E80, E81, E85, E87, E89, E90, E91, E92, E93, E94); General_Capital_Outlay = sum(F01, F03, F04, F05, F12, F16, F18, F21, F22, F23, F24, F25, F26, F29, F31, F32, F36, F44, F45, F50, F52, F55, F56, F59, F60, F61, F62, F66, F77, F79, F80, F81, F85, F87, F89, G01, G03, G04, G05, G12, G16, G18, G21, G22, G23, G24, G25, G26, G29, G31, G32, G36, G44, G45, G50, G52, G55, G56, G59, G60, G61, G62, G66, G77, G79, G80, G81, G85, G87, G89); General_Construction = sum(F01, F03, F04, F05, F12, F16, F18, F21, F22, F23, F24, F25, F26, F29, F31, F32, F36, F44, F45, F50, F52, F55, F56, F59, F60, F61, F62, F66, F77, F79, F80, F81, F85, F87, F89, F90, F91, F92, F93, F94); General_Assist___Sub = Tot_Assist___Subsidies; General_Debt_Interest = I89;

General_Current_Expend = sum(General_Expenditure, - General_Capital_Outlay); * Air Transport; Air_Trans_Total_Expend = sum(E01 , F01 , G01 , L01 , M01); Air_Trans_Direct_Expend = sum(E01 , F01 , G01); Air_Trans_Cap_Outlay = sum(F01 , G01); Air_Trans_Construction = F01; Air_Trans_IG_To_State = L01; Air_Trans_IG_Local_Govts = M01; * Misc Commercial Activities; Misc_Com_Activ_Tot_Exp = sum(E03 , F03 , G03); Misc_Com_Activ_Cap_Out = sum(F03 , G03); Misc_Com_Activ_Constr = F03; * Correctional Institutions; Correct_Total_Exp = sum(E04 , F04 , G04 , E05 , F05 , G05 , L04 , L05 , M04 , M05); Correct_Direct_Exp = sum(E04 , E05 , F04 , G04 , F05 , G05); Correct_Cap_Outlay = sum(F04 , G04 , F05 , G05); Correct_Construct = sum(F04 , F05); Correct_IG_To_St = sum(L04 , L05); Correct_IG_Loc_Govts = sum(M04 , M05); * Missing national defense code 06; * Education; Total_Educ_Total_Exp = sum(E12, F12, G12, E16, F16, G16, E18, F18, G18, J19, E21, F21, G21, L12, M12, Q12, L18, M18, L21, M21); Total_Educ_Direct_Exp = sum(E12, F12, G12, E16, F16, G16, E18, F18, G18, J19, E21, F21, G21); Total_Educ_Assist___Sub = J19; Total_Educ_Cap_Outlay = sum(F12, F16, F18, F21, G12, G16, G18, G21); Total_Educ_Construct = sum(F12 , F16 , F18 , F21); * Elementary and Secondary Education; Elem_Educ_Total_Exp = sum(E12, F12, G12, L12, M12, Q12); Elem_Educ_Direct_Exp = sum(E12, F12, G12); Elem_Educ_Cap_Outlay = sum(F12, G12); Elem_Educ_Construction = F12; Elem_Educ_IG_To_State = L12; Elem_Educ_IG_Local_Govts = M12; Elem_Educ_IG_Sch_to_Sch = Q12; * Higher Education; Higher_Ed_Total_Exp = sum(E16, E18, F16, F18, G16, G18, L18, M18); Higher_Ed_Direct_Exp = sum(E16, E18, F16, F18, G16, G18); Higher_Ed_Cap_Outlay = sum(F16, F18, G16, G18); Higher_Ed_Construct = sum(F16, F18); Higher_Ed_IG_To_St = L18; Higher_Ed_IG_Loc_Govts = M18; * Education not otherwise classified; Educ_NEC_Total_Expend = sum(E21, F21, G21, L21, M21); Educ_NEC_Direct_Expend = sum(E21, F21, G21); Educ_NEC_Assistance = .; *The prior code, E19 no longer exists in the data;

Educ_NEC_Cap_Outlay = sum(F21, G21); Educ_NEC_Construction = F21; Educ_NEC_IG_To_State = L21; Educ_NEC_IG_Local_Govts = M21; * Missing post offices code 14; *Employment Security Administration; Emp_Sec_Adm_Direct_Exp = sum(E22 , F22 , G22); Emp_Sec_Adm_Cap_Outlay = sum(F22 , G22); Emp_Sec_Adm_Construct = F22; *Financial Administration; Fin_Admin_Total_Exp = sum(E23, F23, G23, L23, M23); Fin_Admin_Direct_Exp = sum(E23, F23, G23); Fin_Admin_Cap_Outlay = sum(F23, G23); Fin_Admin_Construction = F23; Fin_Admin_IG_To_State = L23; Fin_Admin_IG_Local_Govts = M23; *Fire protection; Fire_Prot_Total_Expend = sum(E24, F24, G24, L24, M24); Fire_Prot_Direct_Exp = sum(E24, F24, G24); Fire_Prot_Cap_Outlay = sum(F24, G24); Fire_Prot_Construction = F24; Fire_Prot_IG_To_State = L24; Fire_Prot_IG_Local_Govts = M24; *Judicial Expenditures; Judicial_Total_Expend = sum(E25, F25, G25, L25, M25); Judicial_Direct_Expend = sum(E25, F25, G25); Judicial_Cap_Outlay = sum(F25, G25); Judicial_Construction = F25; Judicial_IG_To_State = L25; Judicial_IG_Local_Govts = M25; *Central Staff Services; Cen_Staff_Total_Expend = sum(E29, F29, G29, L29, M29); Cen_Staff_Direct_Exp = sum(E29, F29, G29); Cen_Staff_Cap_Outlay = sum(F29, G29); Cen_Staff_Construction = F29; Cen_Staff_IG_To_State = L29; Cen_Staff_IG_Local_Govts = M29; * General Public Buildings; Gen_Pub_Bldg_Total_Exp = sum(E31, F31, G31); Gen_Pub_Bldg_Cap_Out = sum(F31, G31); Gen_Pub_Bldg_Construct = F31; * Health; Health_Total_Expend = sum(E32, F32, G32, L32, M32); Health_Direct_Expend = sum(E32, F32, G32); Health_Capital_Outlay = sum(F32, G32); Health_Construction = F32; Health_IG_To_State = L32; Health_IG_Local_Govts = M32;

*Hospitals; Total_Hospital_Total_Exp = sum(E36, F36, G36, L36, M36); Total_Hospital_Dir_Exp = sum(E36, F36, G36); Total_Hospital_Cap_Out = sum(F36, G36); Total_Hospital_Construct = F36; Total_Hospital_IG_To_State = L36; Total_Hospital_IG_Loc_Govts = M36; *Federal Owned Hospitals - Veterans; Own_Hospital_Total_Exp = sum(E37, F37, G37); Own_Hospital_Cap_Out = sum(F37, G37); Own_Hospital_Construct = F37; * Other Hospital Expenses - Federal but not veterans; Hosp_Other_Total_Exp = sum(E39, F39, G39, L39, M39); Hosp_Other_Direct_Exp = sum(E39, F39, G39); Hosp_Other_Cap_Outlay = sum(F39, G39); Hosp_Other_Construct = F39; Hosp_Other_IG_To_State = L39; Hosp_Other_IG_Loc_Govts = M39; * Highways; Total_Highways_Tot_Exp = sum(E44, F44, G44, E45, F45, G45, L44, M44); Total_Highways_Dir_Exp = sum(E44, F44, G44, E45, F45, G45); Total_Highways_Cap_Out = sum(F44, G44, F45, G45); Total_Highways_Construct = sum(F44, F45); * Non-Toll Highways; Regular_Hwy_Total_Exp = sum(E44, F44, G44, L44, M44); Regular_Hwy_Direct_Exp = sum(E44, F44, G44); Regular_Hwy_Cap_Outlay = sum(F44, G44); Regular_Hwy_Construct = F44; Regular_Hwy_IG_To_Sta = L44; Regular_Hwy_IG_Loc_Govts = M44; * Toll Highways; Toll_Hwy_Total_Expend = sum(E45, F45, G45); Toll_Hwy_Cap_Outlay = sum(F45, G45); Toll_Hwy_Construction = F45; * Transit Subsidies - These data were eliminated in the 2005 data; Transit_Sub_Total_Exp = .; Transit_Sub_Direct_Sub = .; Transit_Sub_IG_To_Sta = .; Transit_Sub_IG_Loc_Govts = .; Transit_Sub_To_Own_Sys = .; *Housing and Community Development; Hous___Com_Total_Exp = sum(E50, F50, G50, L50, M50); Hous___Com_Direct_Exp = sum(E50, F50, G50); Hous___Com_Cap_Outlay = sum(F50, G50); Hous___Com_Construct = F50; Hous___Com_IG_To_State = L50; Hous___Com_IG_Loc_Govts = M50;

* Libraries; Libraries_Total_Expend = sum(E52, F52, G52, L52, M52); Libraries_Direct_Exp = sum(E52, F52, G52); Libraries_Cap_Outlay = sum(F52, G52); Libraries_Construction = F52; Libraries_IG_To_State = L52; Libraries_IG_Local_Govts = M52; *Natural Resources; Natural_Res_Total_Exp = sum(E55, F55, G55, M55, E56, F56, G56, M56, E59, F59, G59, L59, M59); Natural_Res_Direct_Exp = sum(E55, F55, G55, E56, F56, G56, E59, F59, G59); Natural_Res_Cap_Outlay = sum(F55, G55, F56, G56, F59, G59); Natural_Res_Construct = sum(F55, F56, F59); Natural_Res_IG_To_Sta = L59; Natural_Res_IG_Loc_Govts = sum(M55, M56 , M59); * Parking Facilities; Parking_Total_Expend = sum(E60, F60, G60, L60, M60); Parking_Direct_Expend = sum(E60, F60, G60); Parking_Capital_Outlay = sum(F60, G60); Parking_Construction = F60; Parking_IG_To_State = L60; Parking_IG_Local_Govts = M60; * Parks and Recreation; Parks___Rec_Total_Exp = sum(E61, F61, G61, L61, M61); Parks___Rec_Direct_Exp = sum(E61, F61, G61); Parks___Rec_Cap_Outlay = sum(F61, G61); Parks___Rec_Construct = F61; Parks___Rec_IG_To_Sta = L61; Parks___Rec_IG_Loc_Govts = M61; * Police Protection; Police_Prot_Total_Exp = sum(E62, F62, G62, L62, M62); Police_Prot_Direct_Exp = sum(E62, F62, G62); Police_Prot_Cap_Outlay = sum(F62, G62); Police_Prot_Construct = F62; Police_Prot_IG_To_Sta = L62; Police_Prot_IG_Loc_Govts = M62; * Protective Inspection and Regulation; Prot_Insp_Total_Exp = sum(E66, F66, G66, L66, M66); Prot_Insp_Direct_Exp = sum(E66, F66, G66); Prot_Insp_Cap_Outlay = sum(F66, G66); Prot_Insp_Construction = F66; Prot_Insp_IG_To_State = L66; Prot_Insp_IG_Local_Govts = M66; * Public Welfare; Public_Welf_Total_Exp = sum(J67, L67, M67, J68 , M68, E74, E75, S74, E77, F77, G77, E79, F79, G79, L79, M79); Public_Welf_Direct_Exp = sum(J67, J68 , E74, E75, E77, F77, G77, E79, F79, G79); Public_Welf_Cash_Asst = sum(J67, J68, M67, M68); Public_Welf_Cap_Outlay = sum(F77, G77, F79, G79);

Public_Welf_Construct = sum(F77, F79); * Public Welfare-Categorical Assistance Programs; Welf_Categ_Total_Exp = sum(J67, L67, M67); Welf_Categ_Cash_Assist = J67; Welf_Categ_IG_To_State = L67; Welf_Categ_IG_Loc_Govts = M67; * Public Welfare-Cash assistance payments; Welf_Cash_Total_Exp = sum(J68 , M68); Welf_Cash_Cash_Assist = J68; Welf_Cash_IG_Local_Govts = M68; * Public Welfare-Vendor Payments; Welf_Vend_Pmts_Medical = E74; Welf_Vend_Pmts_NEC = E75; * State Share of Medicare Part D; Welf_State_Share_Part_D = S74; * Public Welfare-Institutions; Welf_Ins_Total_Exp = sum(E77, F77, G77); Welf_Ins_Cap_Outlay = sum(F77, G77); Welf_Ins_Construction = F77; *Public Welfare not elsewhere classified; Welf_NEC_Total_Expend = sum(E79, F79, G79, L79, M79); Welf_NEC_Direct_Expend = sum(E79, F79, G79); Welf_NEC_Cap_Outlay = sum(F79, G79); Welf_NEC_Construction = F79; Welf_NEC_IG_To_State = L79; Welf_NEC_IG_Local_Govts = M79; *Sewerage; Sewerage_Total_Expend = sum(E80, F80, G80, L80, M80); Sewerage_Direct_Expend = sum(E80, F80, G80); Sewerage_Cap_Outlay = sum(F80, G80); Sewerage_Construction = F80; Sewerage_IG_To_State = L80; Sewerage_IG_Local_Govts = M80; *Solid Waste Management; SW_Mgmt_Total_Expend = sum(E81, F81, G81, L81, M81); SW_Mgmt_Direct_Expend = sum(E81, F81, G81); SW_Mgmt_Capital_Outlay = sum(F81, G81); SW_Mgmt_Construction = F81; SW_Mgmt_IG_To_State = L81; SW_Mgmt_IG_Local_Govts = M81; *Sea and Inland Port Facilities; Water_Trans_Total_Exp = sum(E87, F87, G87, L87, M87); Water_Trans_Direct_Exp = sum(E87, F87, G87); Water_Trans_Cap_Outlay = sum(F87, G87); Water_Trans_Construct = F87; Water_Trans_IG_To_Sta = L87; Water_Trans_IG_Loc_Govts = M87;

*Interest on General Debt; Interest_on_Gen_Debt = I89; * General Expenditure not elsewhere classified; General_NEC_Total_Exp = sum(E89, F89, G89, L89, M89, S89, J89); General_NEC_Direct_Exp = sum(E89, F89, G89, J89); VetBonus = J89; General_NEC_Cap_Outlay = sum(F89, G89); General_NEC_Construct = F89; General_NEC_IG_To_St = L89; General_NEC_IG_Loc_Govts = M89; General_NEC_IG_To_Fed = S89; * Liquor Stores; Liquor_Stores_Tot_Exp = sum(E90, F90, G90); Liquor_Stores_Cap_Out = sum(F90, G90); Liquor_Stores_Constr = F90; * Total Utilities; Total_Util_Total_Exp = sum(E91, I91, F91, G91, L91, M91, E92, I92, F92, G92, L92, M92, E93, I93, F93, G93, L93, M93, E94, I94, F94, G94, L94, M94); Total_Util_Inter_Exp = sum(I91, I92, I93, I94); Total_Util_Cap_Outlay = sum(F91, F92, F93, F94, G91, G92, G93, G94); Total_Util_Construct = sum(F91, F92, F93, F94); * Water Supply Utilities; Water_Util_Total_Exp = sum(E91, I91, F91, G91, L91, M91); Water_Util_Inter_Exp = I91; Water_Util_Cap_Outlay = sum(F91, G91); Water_Util_Construct = F91; * Electric Power Utilities; Elec_Util_Total_Exp = sum(E92, I92, F92, G92, L92, M92); Elec_Util_Inter_Exp = I92; Elec_Util_Cap_Outlay = sum(F92, G92); Elec_Util_Construct = F92; * Gas Supply Utilities; Gas_Util_Total_Exp = sum(E93, I93, F93, G93, L93, M93); Gas_Util_Inter_Exp = I93; Gas_Util_Cap_Outlay = sum(F93, G93); Gas_Util_Construct = F93; * Transit System Utilities; Trans_Util_Total_Exp = sum(E94, I94, F94, G94, L94, M94); Trans_Util_Inter_Exp = I94; Trans_Util_Cap_Outlay = sum(F94, G94); Trans_Util_Construct = F94; * Employee Retirement; Emp_Ret_Total_Expend = sum(X11, X12); Emp_Ret_Benefit_Paymts = X11; Emp_Ret_Withdrawals = X12; Emp_Ret_Other_Paymts = .; *This code used to be X14 is now obsolete since 2002 represented realized losses and is coded elsewhere;

* Unemployment Compensation; Unemp_Comp_Total_Exp = sum(Y05, Y06); Unemp_Comp_Ben_Paymts = Y05; Unemp_Ext___Spec_Pmts = Y06; * Debt totals; Total_Debt_Outstanding = sum(_44T, _49U, _64V); Total_Long_Term_Debt_Out = sum(_44T, _49U); ST_Debt_End_of_Year = _64V; * Beginning Long Term Debt Outstanding; Total_Beg_LTD_Out = sum(_19T, _19U); Beg_LTD_Out_Private_Purp = _19T; Beg_LTD_Out_All_Other = _19U; Beg_LTD_Out_Utility = .; *All detailed debt codes were discontinued in 2005; Beg_LTD_Out_Water_Util = .; Beg_LTD_Out_Elec_Util = .; Beg_LTD_Out_Gas_Util = .; Beg_LTD_Out_Trans_Util = .; Beg_LTD_Out_General = .; Beg_LTD_Out_Education = .; Beg_LTD_Out_Priv_Purp = .; Beg_LTD_Out_Other_NEC = .; * Long Term Debt Issued; Total_LTD_Issued = sum(_24T, _29U); LTD_Iss_Private_Purp = _24T; LTD_Iss_All_Other = _29U; LTD_Iss_Utility = .; LTD_Iss_Util_Water = .; LTD_Iss_Util_Electric = .; LTD_Iss_Util_Gas_Supply = .; LTD_Iss_Util_Transit = .; LTD_Iss_General = .; LTD_Iss_Gen_Elem_Educ = .; LTD_Iss_Gen_Other_Educ = .; LTD_Iss_Gen_Other_NEC = .; * Long-Term Debt Issued, Full-Faith and Credit; *Codes discontinued in 2005; Total_LTD_Iss_FFC = .; LTD_Iss_FFC_Utility = .; LTD_Iss_FFC_Water_Util = .; LTD_Iss_FFC_Elec_Util = .; LTD_Iss_FFC_Gas_Util = .; LTD_Iss_FFC_Trans_Util = .; LTD_Iss_FFC_General = .; LTD_Iss_FFC_Elem_Educ = .; LTD_Iss_FFC_Other_Educ = .; LTD_Iss_FFC_Other_NEC = .; * Long-Term Debt Issued, Nonguaranteed; Total_LTD_Iss_NG = .; LTD_Iss_NG_Utility = .; LTD_Iss_NG_Water_Util = .;

LTD_Iss_NG_Elec_Util = .; LTD_Iss_NG_Gas_Util = .; LTD_Iss_NG_Trans_Util = .; LTD_Iss_NG_General = .; LTD_Iss_NG_Elem_Educ = .; LTD_Iss_NG_Other_Educ = .; LTD_Iss_NG_Private_Purp = .; LTD_Iss_NG_Other_NEC = .; * Long-Term Debt Issued, Unspecified Issue; Total_LTD_Iss_Unsp = .; LTD_Iss_Unsp_Utility = .; LTD_Iss_Unsp_Water_Util = .; LTD_Iss_Unsp_Elec_Util = .; LTD_Iss_Unsp_Gas_Util = .; LTD_Iss_Unsp_Trans_Util = .; LTD_Iss_Unsp_General = .; LTD_Iss_Unsp_Elem_Educ = .; LTD_Iss_Unsp_Other_Educ = .; LTD_Iss_Unsp_Other_NEC = .; *Long-Term Debt Retired During Fiscal Year; Total_LTD_Retired = sum(_34T, _39U); LTD_Ret_Private_Purp = _34T; LTD_Ret_All_Other = _39U; LTD_Ret_Utility = .; LTD_Ret_Util_Water = .; LTD_Ret_Util_Electric = .; LTD_Ret_Util_Gas_Supply = .; LTD_Ret_Util_Transit = .; LTD_Ret_General = .; LTD_Ret_Gen_Elem_Educ = .; LTD_Ret_Gen_Other_Educ = .; LTD_Ret_Gen_Other_NEC = .; * Long-Term Debt Retired, Full-Faith and Credit; Total_LTD_Ret_FFC = .; LTD_Ret_FFC_Utility = .; LTD_Ret_FFC_Water_Util = .; LTD_Ret_FFC_Elec_Util = .; LTD_Ret_FFC_Gas_Util = .; LTD_Ret_FFC_Trans_Util = .; LTD_Ret_FFC_General = .; LTD_Ret_FFC_Elem_Educ = .; LTD_Ret_FFC_Other_Educ = .; LTD_Ret_FFC_Other_NEC = .; * Long-Term Debt Retired, Nonguaranteed; Total_LTD_Ret_NG = .; LTD_Ret_NG_Utility = .; LTD_Ret_NG_Water_Util = .; LTD_Ret_NG_Elec_Util = .; LTD_Ret_NG_Gas_Util = .; LTD_Ret_NG_Trans_Util = .; LTD_Ret_NG_General = .; LTD_Ret_NG_Elem_Educ = .; LTD_Ret_NG_Other_Educ = .;

LTD_Ret_NG_Private_Purp = .; LTD_Ret_NG_Other_NEC = .; * Long-Term Debt Retired, Unspecified; Total_LTD_Ret_Unsp = .; LTD_Ret_Unsp_Utility = .; LTD_Ret_Unsp_Water_Util = .; LTD_Ret_Unsp_Elec_Utili = .; LTD_Ret_Unsp_Gas_Util = .; LTD_Ret_Unsp_Trans_Util = .; LTD_Ret_Unsp_General = .; LTD_Ret_Unsp_Elem_Educ = .; LTD_Ret_Unsp_Other_Educ = .; LTD_Ret_Unsp_Other_NEC = .; * Long-Term Debt Outstanding; Total_LTD_Out = sum(_44T, _49U); LTD_Out_Private_Purp = _44T; LTD_Out_All_Other = _49U; Total_LTD_Out_Utility = .; LTD_Out_Util_Water = .; LTD_Out_Util_Electric = .; LTD_Out_Util_Gas_Supply = .; LTD_Out_Util_Transit = .; LTD_Out_General = .; LTD_Out_Gen_Elem_Educ = .; LTD_Out_Gen_Other_Educ = .; LTD_Out_Gen_Other_NEC = .; * Long-Term Debt Outstanding, Full-Faith and Credit; Total_LTD_Out_FFC = .; LTD_Out_FFC_Utility = .; LTD_Out_FFC_Water_Util = .; LTD_Out_FFC_Elec_Util = .; LTD_Out_FFC_Gas_Util = .; LTD_Out_FFC_Trans_Util = .; LTD_Out_FFC_General = .; LTD_Out_FFC_Elem_Educ = .; LTD_Out_FFC_Other_Educ = .; LTD_Out_FFC_Other_NEC = .; * Long-Term Debt Outstanding, Nonguaranteed; Tot_LTD_Out_NG = .; LTD_Out_NG_Utility = .; LTD_Out_NG_Water_Util = .; LTD_Out_NG_Elec_Util = .; LTD_Out_NG_Gas_Util = .; LTD_Out_NG_Trans_Util = .; LTD_Out_NG_General = .; LTD_Out_NG_Elem_Educ = .; LTD_Out_NG_Other_Educ = .; LTD_Out_NG_Private_Purp = .; LTD_Out_NG_Other_NEC = .; * Cash and Securities; Total_Cash___Securities = sum(W01, W31, W61, X21, X30, Z77, Z78, X42, X44, X47, Y07, Y08, Y21, Y61);

* Insurance Trust Funds Only Cash and Securities; Insur_Trust_Cash___Sec = sum(X21, X30, Z77, Z78, X42, X44, X47, Y07, Y08, Y21, Y61); * Employee Retirement Systems Cash and Securities; Emp_Retire_Cash___Sec = sum(X21, X30, X35, Z77, Z78, X42, X47, X44); Emp_Retire_Cash___Dep = X21; Emp_Retire_Total_Sec = sum(X30, X35, Z77, Z78, X42, X47, X44); Emp_Retire_Sec_Tot_Fed = X30; Emp_Retire_Sec_S_L_Secur = X35; Emp_Retire_Sec_Tot_Nong = sum(Z77, Z78, X42, X47, X44); Emp_Retire_Sec_Corp_Bds = Z77; Emp_Retire_Sec_Corp_Stk = Z78; Emp_Retire_Sec_Mortgages = X42; Emp_Retire_Sec_Misc_Inv = X47; Emp_Retire_Sec_Oth_Nong = X44; * Unemployment Compensation Funds Cash and Securities; Unemp_Comp_Cash___Sec = sum(Y07, Y08); Unemp_Comp_Bal_In_US_Trs = Y07; Unemp_Comp_Other_Balance = Y08; * Other Insurance Trusts Holdings Cash and Securities; Nonin_Trust_Cash___Sec = sum(W01, W31, W61); * Sinking Funds (debt service funds) Cash and Securities; Sinking_Fd_Cash___Sec = W01; * Bond Funds Cash and Securities; Bond_Fd_Cash___Sec = W31; * All Other Noninsurance Funds Cash and Securities; Oth_Nonin_Fd_Cash___Sec = W61; run; *Merge the older data with the newer data that has had its format converted; Proc append base=LargeData data=ConvertedNewData force; run; Data LargestData; Set LargeData; *Calculate several totals from revenue data and to correct for differences between old and new data; Motor_Vehicle_License_Total = sum(Motor_Vehicle_License, Motor_Veh_Oper_License); Fed_IGR_Gen_Support = sum(Fed_IGR_Gen_Support, Fed_IGR_Gen_Rev_Shar); State_IGR_Gen_Sup = sum(State_IGR_Oth_Gen_Sup, State_IGR_Tax_Relief); Chg_Total_Elem_Education = sum(Chg_Elem_Ed_Sch_Lunch, Chg_Elem_Ed_Tuition, Chg_Elem_Ed_NEC); Chg_Highways = sum(Chg_Regular_Highways, Chg_Toll_Highways); Prop_Sale_Total = sum(Prop_Sale_Hous_Com_Dev, Prop_Sale_Other); Total_Other_Capital_Outlays = sum(Total_Capital_Outlays, -Total_Construction);

General_Capital_Outlay_Other = sum(General_Capital_Outlay, -General_Construction); *Calculate current expenditure data for every function where it is missing; Air_Trans_Current_Exp = sum(Air_Trans_Direct_Expend, -Air_Trans_Cap_Outlay); Misc_Com_Activ_Current_Exp = sum(Misc_Com_Activ_Tot_Exp, -Misc_Com_Activ_Cap_Out); Correct_Current_Exp = sum(Correct_Direct_Exp, -Correct_Cap_Outlay); Total_Educ_Current_Exp = sum(Total_Educ_Direct_Exp, -Total_Educ_Cap_Outlay); Elem_Educ_Current_Exp = sum(Elem_Educ_Direct_Exp, -Elem_Educ_Cap_Outlay); Higher_Ed_Current_Exp = sum(Higher_Ed_Direct_Exp, -Higher_Ed_Cap_Outlay); Educ_NEC_Current_Exp = sum(Educ_NEC_Direct_Expend, -Educ_NEC_Cap_Outlay); Emp_Sec_Adm_Current_Exp = sum(Emp_Sec_Adm_Direct_Exp, -Emp_Sec_Adm_Cap_Outlay); Fin_Admin_Current_Exp = sum(Fin_Admin_Direct_Exp, -Fin_Admin_Cap_Outlay); Fire_Prot_Current_Exp = sum(Fire_Prot_Direct_Exp, -Fire_Prot_Cap_Outlay); Judicial_Current_Exp = sum(Judicial_Direct_Expend, -Judicial_Cap_Outlay); Cen_Staff_Current_Exp = sum(Cen_Staff_Direct_Exp, -Cen_Staff_Cap_Outlay); Gen_Pub_Bldg_Current_Exp = sum(Gen_Pub_Bldg_Total_Exp, -Gen_Pub_Bldg_Cap_Out); Health_Current_Exp = sum(Health_Direct_Expend, -Health_Capital_Outlay); Total_Hospital_Current_Exp = sum(Total_Hospital_Dir_Exp, -Total_Hospital_Cap_Out); Own_Hospital_Current_Exp = sum(Own_Hospital_Total_Exp, -Own_Hospital_Cap_Out); Hosp_Other_Current_Exp = sum(Hosp_Other_Direct_Exp, -Hosp_Other_Cap_Outlay); Total_Highways_Current_Exp = sum(Total_Highways_Dir_Exp, -Total_Highways_Cap_Out); Regular_Hwy_Current_Exp = sum(Regular_Hwy_Direct_Exp, -Regular_Hwy_Cap_Outlay); Toll_Hwy_Current_Exp = sum(Toll_Hwy_Total_Expend, -Toll_Hwy_Cap_Outlay); Hous___Com_Current_Exp = sum(Hous___Com_Direct_Exp, -Hous___Com_Cap_Outlay); Libraries_Current_Exp = sum(Libraries_Direct_Exp, -Libraries_Cap_Outlay); Natural_Res_Current_Exp = sum(Natural_Res_Direct_Exp, -Natural_Res_Cap_Outlay); Parking_Current_Exp = sum(Parking_Direct_Expend, -Parking_Capital_Outlay); Parks___Rec_Current_Exp = sum(Parks___Rec_Direct_Exp, -Parks___Rec_Cap_Outlay); Police_Prot_Current_Exp = sum(Police_Prot_Direct_Exp, -Police_Prot_Cap_Outlay); Prot_Insp_Current_Exp = sum(Prot_Insp_Direct_Exp, -Prot_Insp_Cap_Outlay);

Public_Welf_Current_Exp = sum(Public_Welf_Direct_Exp, -Public_Welf_Cap_Outlay, -Public_Welf_Cash_Asst); Welf_Ins_Current_Exp = sum(Welf_Ins_Total_Exp, -Welf_Ins_Cap_Outlay); Welf_NEC_Current_Exp = sum(Welf_NEC_Direct_Expend, -Welf_NEC_Cap_Outlay); Sewerage_Current_Exp = sum(Sewerage_Direct_Expend, -Sewerage_Cap_Outlay); SW_Mgmt_Current_Exp = sum(SW_Mgmt_Direct_Expend, -SW_Mgmt_Capital_Outlay); Water_Trans_Current_Exp = sum(Water_Trans_Direct_Exp, -Water_Trans_Cap_Outlay); General_NEC_Current_Exp = sum(General_NEC_Direct_Exp, -General_NEC_Cap_Outlay, -VetBonus); Liquor_Stores_Current_Exp = sum(Liquor_Stores_Tot_Exp, -Liquor_Stores_Cap_Out); Total_Util_Current_Exp = sum(Total_Util_Total_Exp, -Total_Util_Inter_Exp, -Total_Util_Cap_Outlay); Water_Util_Current_Exp = sum(Water_Util_Total_Exp, -Water_Util_Inter_Exp, -Water_Util_Cap_Outlay); Elec_Util_Current_Exp = sum(Elec_Util_Total_Exp, -Elec_Util_Inter_Exp, -Elec_Util_Cap_Outlay); Gas_Util_Current_Exp = sum(Gas_Util_Total_Exp, -Gas_Util_Inter_Exp, -Gas_Util_Cap_Outlay); Trans_Util_Current_Exp = sum(Trans_Util_Total_Exp, -Trans_Util_Inter_Exp, -Trans_Util_Cap_Outlay); run; *Set the order of the variables in the largest data set. Only the variables to be placed at the front of the data set need to be listed in the retain statement.; *Also drop any variables that are unreliable according to the census, or that are both unneeded and unavailable in the newest data.; Data LargestData (Drop= SortCode Census_Region Weight YearDepSch YearRetire Version ReviseDate Data_Flag JacketUnit ZeroData Imputed_Record); Retain SurveyYr Year4 YearofData ID IDChanged State_Code Type_Code County Name FIPS_Code_State FYEndDate YearPop SchLevCode Population FunctionCode Enrollment SurveyYr Year4 ID State_Code Type_Code County Name FIPS_Code_State FYEndDate YearPop SchLevCode Population Total_Revenue Total_Rev_Own_Sources General_Revenue Gen_Rev_Own_Sources Total_Taxes Property_Tax Tot_Sales___Gr_Rec_Tax Total_Gen_Sales_Tax Total_Select_Sales_Tax Alcoholic_Beverage_Tax Amusement_Tax Insurance_Premium_Tax Motor_Fuels_Tax Pari_mutuels_Tax Public_Utility_Tax Tobacco_Tax Other_Select_Sales_Tax Total_License_Taxes Alcoholic_Beverage_Lic Amusement_License Corporation_License Hunting___Fishing_License Motor_Vehicle_License Motor_Veh_Oper_License Motor_Vehicle_License_Total Public_Utility_License Occup_and_Bus_Lic_NEC Other_License_Taxes Total_Income_Taxes Individual_Income_Tax Corp_Net_Income_Tax Death_and_Gift_Tax Docum_and_Stock_Tr_Tax Severance_Tax Taxes_NEC Total_IG_Revenue Total_Fed_IG_Revenue Fed_IGR_Air_Transport Fed_IGR_Education Fed_IGR_Emp_Sec_Adm Fed_IGR_Gen_Rev_Shar Fed_IGR_Gen_Support Fed_IGR_Health___Hos Fed_IGR_Highways Fed_IGR_Transit_Sub Fed_IGR_Hous_Com_Dev Fed_IGR_Natural_Res Fed_IGR_Public_Welf Fed_IGR_Sewerage Fed_IGR_Other Total_State_IG_Revenue State_IGR_Education State_IGR_Tax_Relief State_IGR_Oth_Gen_Sup State_IGR_Gen_Sup State_IGR_Health___Hos State_IGR_Highways State_IGR_Transit_Sub State_IGR_Hous_Com_Dev State_IGR_Public_Welf

State_IGR_Sewerage State_IGR_Other Tot_Local_IG_Rev Local_IGR_InterSchool_Aid Local_IGR_Other_Education Local_IGR_Oth_Gen_Sup Local_IGR_Health___Hos Local_IGR_Highways Local_IGR_Transit_Sub Local_IGR_Hous_Com_Dev Local_IGR_Public_Welf Local_IGR_Sewerage Local_IGR_Other Tot_Chgs_and_Misc_Rev Total_General_Charges Chg_Air_Transportation Chg_Misc_Com_Activ Chg_Total_Education Chg_Total_Elem_Education Chg_Elem_Ed_Sch_Lunch Chg_Elem_Ed_Tuition Chg_Elem_Ed_NEC Chg_Total_High_Ed Chg_Hospitals Chg_Highways Chg_Regular_Highways Chg_Toll_Highways Chg_Housing___Comm_Dev Chg_Total_Nat_Res Chg_Parking Chg_Parks___Recreation Chg_Sewerage Chg_Solid_Waste_Mgmt Chg_Water_Transport Chg_All_Other_NEC Misc_General_Revenue Special_Assessments Prop_Sale_Total Prop_Sale_Hous_Com_Dev Prop_Sale_Other Interest_Revenue Fines_and_Forfeits Rents_and_Royalties Net_Lottery_Revenue Misc_General_Rev_NEC Liquor_Stores_Revenue Total_Utility_Revenue Water_Utility_Revenue Electric_Utility_Rev Gas_Utility_Rev Transit_Utility_Rev Total_Insur_Trust_Rev Total_Insur_Trust_Ctrb Tot_Ins_Trust_Inv_Rev Total_Emp_Ret_Rev Emp_Ret_Total_Ctrib Emp_Ret_Loc_Emp_Ctrib Emp_Ret_Loc_To_Loc_Sys Emp_Ret_From_Other_Gov Emp_Ret_Sta_To_Sta_Ctr Emp_Ret_Int_Rev Emp_Ret_Other_Earnings Total_Unemp_Rev Unemp_Payroll_Tax Unemp_Int_Revenue Unemp_Federal_Advances Total_Expenditure Total_IG_Expenditure Direct_Expenditure Total_Current_Expend Total_Current_Oper Total_Capital_Outlays Total_Construction Total_Other_Capital_Outlays Tot_Assist___Subsidies Total_Interest_on_Debt Total_Insur_Trust_Ben Total_Salaries___Wages General_Expenditure IG_Exp_To_State_Govt IG_Exp_To_Local_Govts IG_Exp_To_Federal_Govt Direct_General_Expend General_Current_Expend General_Current_Oper General_Capital_Outlay General_Construction General_Capital_Outlay_Other General_Assist___Sub General_Debt_Interest Air_Trans_Total_Expend Air_Trans_Direct_Expend Air_Trans_Cap_Outlay Air_Trans_Current_Exp Air_Trans_Construction Air_Trans_IG_To_State Air_Trans_IG_Local_Govts Misc_Com_Activ_Tot_Exp Misc_Com_Activ_Cap_Out Misc_Com_Activ_Current_Exp Misc_Com_Activ_Constr Correct_Total_Exp Correct_Direct_Exp Correct_Cap_Outlay Correct_Current_Exp Correct_Construct Correct_IG_To_St Correct_IG_Loc_Govts Total_Educ_Total_Exp Total_Educ_Direct_Exp Total_Educ_Assist___Sub Total_Educ_Cap_Outlay Total_Educ_Current_Exp Total_Educ_Construct Elem_Educ_Total_Exp Elem_Educ_Direct_Exp Elem_Educ_Cap_Outlay Elem_Educ_Current_Exp Elem_Educ_Construction Elem_Educ_IG_To_State Elem_Educ_IG_Local_Govts Elem_Educ_IG_Sch_to_Sch Higher_Ed_Total_Exp Higher_Ed_Direct_Exp Higher_Ed_Cap_Outlay Higher_Ed_Current_Exp Higher_Ed_Construct Higher_Ed_IG_To_St Higher_Ed_IG_Loc_Govts Educ_NEC_Total_Expend Educ_NEC_Direct_Expend Educ_NEC_Assistance Educ_NEC_Cap_Outlay Educ_NEC_Current_Exp Educ_NEC_Construction Educ_NEC_IG_To_State Educ_NEC_IG_Local_Govts Emp_Sec_Adm_Direct_Exp Emp_Sec_Adm_Cap_Outlay Emp_Sec_Adm_Current_Exp Emp_Sec_Adm_Construct Fin_Admin_Total_Exp Fin_Admin_Direct_Exp Fin_Admin_Cap_Outlay Fin_Admin_Current_Exp Fin_Admin_Construction Fin_Admin_IG_To_State Fin_Admin_IG_Local_Govts Fire_Prot_Total_Expend Fire_Prot_Direct_Exp Fire_Prot_Cap_Outlay Fire_Prot_Current_Exp Fire_Prot_Construction Fire_Prot_IG_To_State Fire_Prot_IG_Local_Govts Judicial_Total_Expend Judicial_Direct_Expend Judicial_Cap_Outlay Judicial_Current_Exp Judicial_Construction Judicial_IG_To_State

Judicial_IG_Local_Govts Cen_Staff_Total_Expend Cen_Staff_Direct_Exp Cen_Staff_Cap_Outlay Cen_Staff_Current_Exp Cen_Staff_Construction Cen_Staff_IG_To_State Cen_Staff_IG_Local_Govts Gen_Pub_Bldg_Total_Exp Gen_Pub_Bldg_Cap_Out Gen_Pub_Bldg_Current_Exp Gen_Pub_Bldg_Construct Health_Total_Expend Health_Direct_Expend Health_Capital_Outlay Health_Current_Exp Health_Construction Health_IG_To_State Health_IG_Local_Govts Total_Hospital_Total_Exp Total_Hospital_Dir_Exp Total_Hospital_Cap_Out Total_Hospital_Current_Exp Total_Hospital_Construct Total_Hospital_IG_To_State Total_Hospital_IG_Loc_Govts Own_Hospital_Total_Exp Own_Hospital_Cap_Out Own_Hospital_Current_Exp Own_Hospital_Construct Hosp_Other_Total_Exp Hosp_Other_Direct_Exp Hosp_Other_Cap_Outlay Hosp_Other_Current_Exp Hosp_Other_Construct Hosp_Other_IG_To_State Hosp_Other_IG_Loc_Govts Total_Highways_Tot_Exp Total_Highways_Dir_Exp Total_Highways_Cap_Out Total_Highways_Current_Exp Total_Highways_Construct Regular_Hwy_Total_Exp Regular_Hwy_Direct_Exp Regular_Hwy_Cap_Outlay Regular_Hwy_Current_Exp Regular_Hwy_Construct Regular_Hwy_IG_To_Sta Regular_Hwy_IG_Loc_Govts Toll_Hwy_Total_Expend Toll_Hwy_Cap_Outlay Toll_Hwy_Current_Exp Toll_Hwy_Construction Transit_Sub_Total_Exp Transit_Sub_Direct_Sub Transit_Sub_IG_To_Sta Transit_Sub_IG_Loc_Govts Transit_Sub_To_Own_Sys Hous___Com_Total_Exp Hous___Com_Direct_Exp Hous___Com_Cap_Outlay Hous___Com_Current_Exp Hous___Com_Construct Hous___Com_IG_To_State Hous___Com_IG_Loc_Govts Libraries_Total_Expend Libraries_Direct_Exp Libraries_Cap_Outlay Libraries_Current_Exp Libraries_Construction Libraries_IG_To_State Libraries_IG_Local_Govts Natural_Res_Total_Exp Natural_Res_Direct_Exp Natural_Res_Cap_Outlay Natural_Res_Current_Exp Natural_Res_Construct Natural_Res_IG_To_Sta Natural_Res_IG_Loc_Govts Parking_Total_Expend Parking_Direct_Expend Parking_Capital_Outlay Parking_Current_Exp Parking_Construction Parking_IG_To_State Parking_IG_Local_Govts Parks___Rec_Total_Exp Parks___Rec_Direct_Exp Parks___Rec_Cap_Outlay Parks___Rec_Current_Exp Parks___Rec_Construct Parks___Rec_IG_To_Sta Parks___Rec_IG_Loc_Govts Police_Prot_Total_Exp Police_Prot_Direct_Exp Police_Prot_Cap_Outlay Police_Prot_Current_Exp Police_Prot_Construct Police_Prot_IG_To_Sta Police_Prot_IG_Loc_Govts Prot_Insp_Total_Exp Prot_Insp_Direct_Exp Prot_Insp_Cap_Outlay Prot_Insp_Current_Exp Prot_Insp_Construction Prot_Insp_IG_To_State Prot_Insp_IG_Local_Govts Public_Welf_Total_Exp Public_Welf_Direct_Exp Public_Welf_Cash_Asst Public_Welf_Cap_Outlay Public_Welf_Current_Exp Public_Welf_Construct Welf_Categ_Total_Exp Welf_Categ_Cash_Assist Welf_Categ_IG_To_State Welf_Categ_IG_Loc_Govts Welf_Cash_Total_Exp Welf_Cash_Cash_Assist Welf_Cash_IG_Local_Govts Welf_Vend_Pmts_Medical Welf_Vend_Pmts_NEC Welf_State_Share_Part_D Welf_Ins_Total_Exp Welf_Ins_Cap_Outlay Welf_Ins_Current_Exp Welf_Ins_Construction Welf_NEC_Total_Expend Welf_NEC_Direct_Expend Welf_NEC_Cap_Outlay Welf_NEC_Current_Exp Welf_NEC_Construction Welf_NEC_IG_To_State Welf_NEC_IG_Local_Govts Sewerage_Total_Expend Sewerage_Direct_Expend Sewerage_Cap_Outlay Sewerage_Current_Exp Sewerage_Construction Sewerage_IG_To_State Sewerage_IG_Local_Govts SW_Mgmt_Total_Expend SW_Mgmt_Direct_Expend SW_Mgmt_Capital_Outlay SW_Mgmt_Current_Exp SW_Mgmt_Construction SW_Mgmt_IG_To_State SW_Mgmt_IG_Local_Govts Water_Trans_Total_Exp

Water_Trans_Direct_Exp Water_Trans_Cap_Outlay Water_Trans_Current_Exp Water_Trans_Construct Water_Trans_IG_To_Sta Water_Trans_IG_Loc_Govts Interest_on_Gen_Debt General_NEC_Total_Exp General_NEC_Direct_Exp VetBonus General_NEC_Cap_Outlay General_NEC_Current_Exp General_NEC_Construct General_NEC_IG_To_St General_NEC_IG_Loc_Govts General_NEC_IG_To_Fed Liquor_Stores_Tot_Exp Liquor_Stores_Cap_Out Liquor_Stores_Current_Exp Liquor_Stores_Constr Total_Util_Total_Exp Total_Util_Inter_Exp Total_Util_Cap_Outlay Total_Util_Current_Exp Total_Util_Construct Water_Util_Total_Exp Water_Util_Inter_Exp Water_Util_Cap_Outlay Water_Util_Current_Exp Water_Util_Construct Elec_Util_Total_Exp Elec_Util_Inter_Exp Elec_Util_Cap_Outlay Elec_Util_Current_Exp Elec_Util_Construct Gas_Util_Total_Exp Gas_Util_Inter_Exp Gas_Util_Cap_Outlay Gas_Util_Current_Exp Gas_Util_Construct Trans_Util_Total_Exp Trans_Util_Inter_Exp Trans_Util_Cap_Outlay Trans_Util_Current_Exp Trans_Util_Construct Emp_Ret_Total_Expend Emp_Ret_Benefit_Paymts Emp_Ret_Withdrawals Emp_Ret_Other_Paymts Unemp_Comp_Total_Exp Unemp_Comp_Ben_Paymts Unemp_Ext___Spec_Pmts Total_Debt_Outstanding Total_Long_Term_Debt_Out ST_Debt_End_of_Year Total_Beg_LTD_Out Beg_LTD_Out_Private_Purp Beg_LTD_Out_All_Other Beg_LTD_Out_Utility Beg_LTD_Out_Water_Util Beg_LTD_Out_Elec_Util Beg_LTD_Out_Gas_Util Beg_LTD_Out_Trans_Util Beg_LTD_Out_General Beg_LTD_Out_Education Beg_LTD_Out_Priv_Purp Beg_LTD_Out_Other_NEC Total_LTD_Issued LTD_Iss_Private_Purp LTD_Iss_All_Other LTD_Iss_Utility LTD_Iss_Util_Water LTD_Iss_Util_Electric LTD_Iss_Util_Gas_Supply LTD_Iss_Util_Transit LTD_Iss_General LTD_Iss_Gen_Elem_Educ LTD_Iss_Gen_Other_Educ LTD_Iss_Gen_Other_NEC Total_LTD_Iss_FFC LTD_Iss_FFC_Utility LTD_Iss_FFC_Water_Util LTD_Iss_FFC_Elec_Util LTD_Iss_FFC_Gas_Util LTD_Iss_FFC_Trans_Util LTD_Iss_FFC_General LTD_Iss_FFC_Elem_Educ LTD_Iss_FFC_Other_Educ LTD_Iss_FFC_Other_NEC Total_LTD_Iss_NG LTD_Iss_NG_Utility LTD_Iss_NG_Water_Util LTD_Iss_NG_Elec_Util LTD_Iss_NG_Gas_Util LTD_Iss_NG_Trans_Util LTD_Iss_NG_General LTD_Iss_NG_Elem_Educ LTD_Iss_NG_Other_Educ LTD_Iss_NG_Private_Purp LTD_Iss_NG_Other_NEC Total_LTD_Iss_Unsp LTD_Iss_Unsp_Utility LTD_Iss_Unsp_Water_Util LTD_Iss_Unsp_Elec_Util LTD_Iss_Unsp_Gas_Util LTD_Iss_Unsp_Trans_Util LTD_Iss_Unsp_General LTD_Iss_Unsp_Elem_Educ LTD_Iss_Unsp_Other_Educ LTD_Iss_Unsp_Other_NEC Total_LTD_Retired LTD_Ret_Private_Purp LTD_Ret_All_Other LTD_Ret_Utility LTD_Ret_Util_Water LTD_Ret_Util_Electric LTD_Ret_Util_Gas_Supply LTD_Ret_Util_Transit LTD_Ret_General LTD_Ret_Gen_Elem_Educ LTD_Ret_Gen_Other_Educ LTD_Ret_Gen_Other_NEC Total_LTD_Ret_FFC LTD_Ret_FFC_Utility LTD_Ret_FFC_Water_Util LTD_Ret_FFC_Elec_Util LTD_Ret_FFC_Gas_Util LTD_Ret_FFC_Trans_Util LTD_Ret_FFC_General LTD_Ret_FFC_Elem_Educ LTD_Ret_FFC_Other_Educ LTD_Ret_FFC_Other_NEC Total_LTD_Ret_NG LTD_Ret_NG_Utility LTD_Ret_NG_Water_Util LTD_Ret_NG_Elec_Util LTD_Ret_NG_Gas_Util LTD_Ret_NG_Trans_Util LTD_Ret_NG_General LTD_Ret_NG_Elem_Educ LTD_Ret_NG_Other_Educ LTD_Ret_NG_Private_Purp LTD_Ret_NG_Other_NEC Total_LTD_Ret_Unsp LTD_Ret_Unsp_Utility LTD_Ret_Unsp_Water_Util LTD_Ret_Unsp_Elec_Utili LTD_Ret_Unsp_Gas_Util LTD_Ret_Unsp_Trans_Util LTD_Ret_Unsp_General LTD_Ret_Unsp_Elem_Educ LTD_Ret_Unsp_Other_Educ LTD_Ret_Unsp_Other_NEC Total_LTD_Out LTD_Out_Private_Purp LTD_Out_All_Other Total_LTD_Out_Utility LTD_Out_Util_Water LTD_Out_Util_Electric LTD_Out_Util_Gas_Supply LTD_Out_Util_Transit LTD_Out_General LTD_Out_Gen_Elem_Educ LTD_Out_Gen_Other_Educ LTD_Out_Gen_Other_NEC Total_LTD_Out_FFC

LTD_Out_FFC_Utility LTD_Out_FFC_Water_Util LTD_Out_FFC_Elec_Util LTD_Out_FFC_Gas_Util LTD_Out_FFC_Trans_Util LTD_Out_FFC_General LTD_Out_FFC_Elem_Educ LTD_Out_FFC_Other_Educ LTD_Out_FFC_Other_NEC Tot_LTD_Out_NG LTD_Out_NG_Utility LTD_Out_NG_Water_Util LTD_Out_NG_Elec_Util LTD_Out_NG_Gas_Util LTD_Out_NG_Trans_Util LTD_Out_NG_General LTD_Out_NG_Elem_Educ LTD_Out_NG_Other_Educ LTD_Out_NG_Private_Purp LTD_Out_NG_Other_NEC Total_Cash___Securities Insur_Trust_Cash___Sec Emp_Retire_Cash___Sec Emp_Retire_Cash___Dep Emp_Retire_Total_Sec Emp_Retire_Sec_Tot_Fed Emp_Retire_Sec_S_L_Secur Emp_Retire_Sec_Tot_Nong Emp_Retire_Sec_Corp_Bds Emp_Retire_Sec_Corp_Stk Emp_Retire_Sec_Mortgages Emp_Retire_Sec_Misc_Inv Emp_Retire_Sec_Oth_Nong Unemp_Comp_Cash___Sec Unemp_Comp_Bal_In_US_Trs Unemp_Comp_Other_Balance Nonin_Trust_Cash___Sec Sinking_Fd_Cash___Sec Bond_Fd_Cash___Sec Oth_Nonin_Fd_Cash___Sec FunctionCode Enrollment; Set LargestData; run; * Write the final file to a delinimated text file, change this path to define a valid location for the file on your system; Proc Export Data=work.LargestData outfile='E:/CensusData/AllCensusData.csv' dbms=CSV replace; run;