
THE GOVERNANCE OF NON-PROFITS AND THEIR SOCIAL …
71
1 THE GOVERNANCE OF NON-PROFITS AND THEIR SOCIAL IMPACT: EVIDENCE FROM A RANDOMIZED PROGRAM IN HEALTHCARE IN THE DEMOCRATIC REPUBLIC OF CONGO ANICET A. FANGWA HEC Paris [email protected] CAROLINE FLAMMER Boston University [email protected] MARIEKE HUYSENTRUYT HEC Paris [email protected] BERTRAND V. QUÉLIN HEC Paris [email protected] July 2021 ABSTRACT How can non-profit organizations improve their governance to increase their social impact? This study examines the effectiveness of a bundle of governance mechanisms—consisting of social performance- based incentives combined with auditing and feedback—in the context of a randomized governance program conducted in the Democratic Republic of Congo’s healthcare sector. Within the program, a set of health centers were randomly assigned to a governance treatment while others were not. We find that the governance treatment leads to i) higher operating efficiency and ii) improvements in social performance (measured by a reduction in the occurrence of stillbirths and neonatal deaths). Furthermore, we find that funding is not a substitute for governance—health centers that only receive funding increase their scale, but do not show improvements in operating efficiency nor social performance. Overall, our results suggest that governance plays an important role in achieving the non-profits’ objectives and increasing the social impact of the funds invested. Keywords: non-profit governance; non-profit organizations; social impact; healthcare; Sustainable Development Goals (SDGs); developing countries; randomized experiment. * We are grateful to Ruth Aguilera, Marco Becht, Vanessa Burbano, Olga Hawn, Natasha Hochberg, Steve Lydenberg, Mary-Hunter McDonnell, Ivan Png, Gui Deng Say, David Stolow, Haitao Yu, as well as seminar participants at Boston University, Georgia Institute of Technology, George Mason University, HEC Paris, IESE, Ivey, Lancaster University, Singapore Management University, Toulouse School of Economics, UCLA, University of Manchester, University of Zurich, UT Austin, the Ackerman Corporate Governance Conference (Tel Aviv), the Swiss Economists Abroad Conference (Geneva), and the Strategic Management Society Annual Conference (Minnesota) for helpful comments and suggestions. We thank Bluesquare for providing us with the data as well as their help and insights. This research is supported by a grant of the French National Research Agency (ANR) “Investissements d’Avenir” (LabEx Ecodec).
Transcript of THE GOVERNANCE OF NON-PROFITS AND THEIR SOCIAL …
1
THE GOVERNANCE OF NON-PROFITS AND THEIR SOCIAL IMPACT:
EVIDENCE FROM A RANDOMIZED PROGRAM IN HEALTHCARE IN THE DEMOCRATIC
REPUBLIC OF CONGO
ANICET A. FANGWA HEC Paris
CAROLINE FLAMMER
Boston University [email protected]
MARIEKE HUYSENTRUYT
HEC Paris [email protected]
BERTRAND V. QUÉLIN
HEC Paris [email protected]
July 2021
ABSTRACT
How can non-profit organizations improve their governance to increase their social impact? This study
examines the effectiveness of a bundle of governance mechanisms—consisting of social performance-
based incentives combined with auditing and feedback—in the context of a randomized governance
program conducted in the Democratic Republic of Congo’s healthcare sector. Within the program, a set of
health centers were randomly assigned to a governance treatment while others were not. We find that the
governance treatment leads to i) higher operating efficiency and ii) improvements in social performance
(measured by a reduction in the occurrence of stillbirths and neonatal deaths). Furthermore, we find that
funding is not a substitute for governance—health centers that only receive funding increase their scale, but
do not show improvements in operating efficiency nor social performance. Overall, our results suggest that
governance plays an important role in achieving the non-profits’ objectives and increasing the social impact
of the funds invested.
Keywords: non-profit governance; non-profit organizations; social impact; healthcare; Sustainable
Development Goals (SDGs); developing countries; randomized experiment.
* We are grateful to Ruth Aguilera, Marco Becht, Vanessa Burbano, Olga Hawn, Natasha Hochberg, Steve Lydenberg, Mary-Hunter McDonnell, Ivan Png, Gui Deng Say, David Stolow, Haitao Yu, as well as seminar participants at Boston University, Georgia Institute of Technology, George Mason University, HEC Paris, IESE, Ivey, Lancaster University, Singapore Management University, Toulouse School of Economics, UCLA, University of Manchester, University of Zurich, UT Austin, the Ackerman Corporate Governance Conference (Tel Aviv), the Swiss Economists Abroad Conference (Geneva), and the Strategic Management Society Annual Conference (Minnesota) for helpful comments and suggestions. We thank Bluesquare for providing us with the data as well as their help and insights. This research is supported by a grant of the French National Research Agency (ANR) “Investissements d’Avenir” (LabEx Ecodec).

2
1. Introduction
Every year, considerable efforts and large amounts of funds are invested in social and environmental causes
aiming to achieve the United Nations’ Sustainable Development Goals (SDGs). Those include ending
poverty, reducing hunger, promoting healthy lives and well-being, reducing inequalities, promoting the
development of sustainable cities and communities, addressing climate change, and protecting the world’s
biodiversity, among others. Accounting for about one-third of total employment in the social sector, non-
profit organizations represent a large part of the global economy and constitute a major player in achieving
the SDGs (United Nations 2018a).1
To help tackle these grand societal challenges and achieve the SDGs, it is important to understand
how to improve the effectiveness of non-profit organizations. Arguably, this is a critical question not only
for academics but also, and more importantly, for the non-profit organizations themselves and the
beneficiaries of their services—affected individuals, communities, and the natural environment. What is
more, the efficient use of funds is also important for donors and impact investors who aim to make a
difference in this world and maximize their funds’ social impact. In sum, understanding what mechanisms
are available and effective in improving the social impact of non-profit organizations is important for the
organizations per se, the donors and impact investors, as well as society at large and the natural
environment.
The question of how to improve the governance of non-profits is difficult to answer, both
theoretically and empirically. The insights from the existing literature on governance offer only limited
guidance in this regard since it has largely focused its attention on for-profit organizations, which are
fundamentally different from non-profit organizations.2
1 For example, in the U.S., the non-profit sector represents 10.2% of the private sector’s labor force in 2017 (Salamon and Newhouse 2020). 2 By their very nature, non-profits pursue social as opposed to financial objectives. In this regard, an inherent feature of non-profits is the “non-distribution constraint” (Hansmann 1980)—that is, non-profits are not allowed to distribute profits to donors or employees; instead, any surplus they generate must be retained and devoted to their social objectives. A direct implication of this non-distribution constraint is that non-profits do not have owners. The investors who fund non-profits, through donations, do not have any claim to the non-profits’ revenues and assets, nor do they
3
From a theoretical perspective, it is unclear what governance mechanisms are available and
effective for non-profits to maximize the social impact of the funds invested, as well as when and where
they matter more or less. In order to be effective, appropriate governance mechanisms need to take into
account the unique nature of and obstacles faced by non-profit organizations. First, non-profits are often
cash-constrained, their employees might be purpose-driven and intrinsically motivated, and key (non-
financial) performance metrics might be difficult to measure and evaluate. Second, many non-profits
operate in countries that are resource-constrained (e.g., in terms of financial resources and qualified
personnel). In this regard, the provision of additional funding is likely helpful. However, funding per se
need not be sufficient to bring about tangible improvements in the non-profits’ social impact. In particular,
their managers and employees may lack the necessary knowledge on how to improve the organization’s
operating efficiency and service quality. Accordingly, even if they had access to more funding, they might
not be able to put this funding to good use without better governance and management practices. For
example, in the context of the health sector in the Democratic Republic of Congo (DRC), the WHO has
identified several sources of inefficiencies such as the lack of strategic and managerial planning, inadequate
priorities in resource allocation, lack of transparency, lack of managerial competencies, and insufficient
medical training of health workers (WHO 2015). These sources of inefficiencies are unlikely unique to the
health sector in the DRC, but rather a common challenge found across sectors and across (low-income)
countries.
What is more, these countries may lag behind several of the SDGs. Indeed, taking the example of
the healthcare sector in the DRC, the promotion of healthy lives and well-being is a complex issue that not
only requires access to effective healthcare services, but also access to affordable and clean energy, clean
water and sanitation, education, and the achievement of several other SDGs. Achieving the SDGs is a
complex task that likely takes a concerted effort by non-profits, for-profits, governments, and society more
generally. As such, it is unclear whether and to what extent the provision of funding and better governance
have any control rights over the organization. Accordingly, many of the governance tools available to for-profits (e.g., managerial ownership) are not available to non-profits.

4
can truly move the needle and bring about substantial improvements in operating efficiency and service
quality.
From an empirical perspective, making ground on these questions is challenging. There are two
main obstacles. First, it is difficult to obtain fine-grained microdata on non-profit organizations, their
governance, as well as their social impact. Second, even if detailed microdata were available, the adoption
of governance practices is likely endogenous with respect to organizational outcomes—that is,
unobservables may drive a spurious relationship between the adoption of different governance mechanisms
and organizational outcomes. Addressing the endogeneity of governance requires a source of exogenous
variation in the adoption of governance practices.
To overcome these obstacles, we study the governance of non-profits in the context of a randomized
governance program implemented in the healthcare sector of the Democratic Republic of Congo (DRC). In
the DRC, primary healthcare services—and especially maternity and childbirth services—are administered
in non-profit health centers spread across the country. The randomized governance program we exploit in
this paper was administered in about 1,000 health centers at the beginning of 2017. Health centers in the
program were randomly assigned to a treatment group and control group, respectively. While health centers
in both groups received funding from the program, only those in the treatment group were subject to a
“governance treatment” consisting of social performance-based incentives combined with auditing and
feedback (A&F).3 Hence, by design, this randomized governance program provides an ideal setup to study
how the adoption of governance practices affects health centers’ outcomes (e.g., their operating efficiency
and social impact), holding everything else, including funding, constant.
Using a difference-in-differences methodology, we find that, within a 10-quarter period following
the treatment, health centers in the treatment group experience significant improvements in both operating
efficiency (captured by an increase in the number of services provided per employee) and social
3 Social performance-based incentives are a form of pay-for-social-performance. Specifically, additional funding is provided to the non-profit organization contingent on the organization’s social performance. See Section 3.2 for details.

5
performance (captured by a reduction in the probability of stillbirths and neonatal deaths, respectively).
These findings suggest that the adoption of governance mechanisms (in the form of social performance-
based incentives and A&F) is beneficial to non-profits and contributes to their ability to achieve their
intended social impact.
We further document that the treatment effect takes several quarters to materialize, consistent with
a “learning” interpretation—that is, the health center staff progressively learn how to improve their
operations from the quarterly rounds of feedback, while having incentives to act on this feedback. When
we examine the heterogeneity in the treatment effect, we find further evidence that points toward the
importance of learning. Specifically, we find that the treatment effect is stronger in areas with a lower
density of health centers (that is, areas where it is harder to learn and adopt best practices from their peers).
Moreover, we find that i) the increase in operating efficiency is higher for health centers with lower ex ante
operating efficiency, and ii) the decrease in infant mortality is more pronounced for health centers with
higher ex ante mortality. Collectively, these findings indicate that the improvements brought about by the
treatment are larger when there is more to improve and learn to begin with.
Finally, we examine whether funding can serve as a substitute for governance. This question is not
only relevant from a societal perspective but also from an implementation and policy perspective. Indeed,
transferring money is relatively straightforward, while it is more challenging to implement better
governance and management practices. To shed light on this question, we compare health centers in- and
outside the governance program. We refer to the latter group as the “outside group.” Unlike the treatment
group (i.e., health centers that receive both funding and the governance treatment) and the control group
(i.e., health centers that only receive funding), health centers in the outside group receive neither.
Accordingly, by comparing the treatment group versus the outside group, we can estimate the impact of the
combination of ‘funding and governance’ on health center outcomes. Similarly, by comparing the control
group versus the outside group, we can measure the impact of ‘funding’ as standalone. This analysis reveals
that funding is not a substitute for governance—health centers that only receive funding increase their scale,
but do not show improvements in operating efficiency nor social performance. In contrast, health centers

6
that receive both funding and the governance treatment improve both their scale as well as their operating
efficiency and social performance.
Overall, our results suggest that governance plays an important role in contributing to non-profits’
objectives and increasing their social impact, and that funding alone does not serve as a substitute for
governance. Naturally, we caution that our findings are specific to the healthcare sector in a low-income
country, and hence need not generalize to the overall non-profit sector. Nevertheless, studying this specific
context is important—it speaks to the effective pursuit of one of the United Nations’ SDGs, namely the
promotion of healthy lives and well-being, especially with respect to children’s health. In the past years,
major progress has been made in improving the health of millions of people, reducing premature deaths and
increasing their life expectancy. In particular, according to the World Health Organization (WHO), the
mortality rate of children under the age of five decreased from 9.3% (i.e., 93 deaths per 1,000 live births)
in 1990, to 3.9% in 2017 (WHO 2018). This corresponds to a worldwide decline from 12.6 million deaths
in 1990, to 5.4 million in 2017. Yet, despite this overall progress, stark disparities exist across regions and
countries. In particular, Sub-Saharan Africa remains the region with the highest under-5 mortality rate in
the world, with one child in thirteen dying before their fifth birthday—this is fourteen times higher than in
high-income countries (WHO 2018). A similar picture arises with the mortality rate of infants under one-
year old. As Figure A1 shows, the DRC is among the countries with the highest infant mortality rates in the
world. An estimated 7% of infants died within the first year of their life in 2017, compared to 0.4% in
France and 0.6% in the U.S. (United Nations 2018b). Reducing children mortality is of foremost
importance, and this study helps inform how governance can contribute to this objective.
2. The role of governance in improving non-profits’ operating efficiency and their social impact
In the following, we discuss the potential effectiveness of a bundle of governance mechanisms—consisting
of social performance-based incentives combined with auditing and feedback (A&F)—for improving the
non-profit organizations’ operating efficiency and social outcomes. This governance bundle is used in the
randomized governance program we study in the empirical analysis.

7
Social performance-based incentives
To motivate managers and employees to use the non-profits’ resources efficiently and maximize their social
impact, donors (and other impact investors) can provide social performance-based incentives. That is,
additional funding is provided to the non-profit organization conditional on meeting specific social criteria.
As such, social performance-based incentives differ from the more traditional financial incentives in two
ways: i) the additional funding is tied to social criteria in lieu of financial criteria, and ii) the direct
beneficiary of social performance-based incentives is the non-profit organization itself as opposed to the
managers and employees, respectively.
Social performance-based incentives may motivate non-profit managers and employees in two
ways. First, by providing such incentives, non-profits can leverage managers’ and employees’ intrinsic
motivation to obtain additional funding for the non-profit’s cause.4 Second, social performance-based
incentives may provide direct benefits to the managers and employees. Indeed, the additional funding
allows non-profit organizations to, e.g., upgrade their equipment, provide training to their employees, pay
higher wages, extend the scope of their services, all of which increase the attractiveness of the workplace
and, as a result, can have a motivational effect on individuals’ work behavior.5 On top of the motivational
aspect, providing employees and managers with training, upgraded equipment, etc., may empower them to
further increase their productivity.
While the provision of social performance-based incentives may positively affect the motivation
and productivity of the non-profits’ managers and employees, there are also several reasons as to why they
may not be effective, or even backfire.
4 Relatedly, recent studies in the context of for-profits in high-income countries have shown that employees across various occupations (e.g., consultants, lawyers, and online workers) are willing to forgo financial compensation for the pursuit of “meaningful” work (e.g., Bode and Singh 2018, Burbano 2016, Carnahan, Kryscynski, and Olson 2017, Cassar 2019, Cassar and Meier 2018). 5 In a similar spirit, non-financial benefits awarded to employees (e.g., through employer recognition, social visibility, or employee satisfaction programs) are found to motivate employees and improve their productivity (e.g., Ashraf, Bandiera, and Jack 2014, Ashraf, Bandiera, and Lee 2014, Dur, Non, and Roelfsema 2010, Flammer and Luo 2017, Gallus and Frey 2016, Gubler, Larkin, and Pierce 2017).

8
First, employees of non-profits are likely to be purpose-driven and intrinsically motivated. In this
regard, the provision of performance-based incentives could crowd out their intrinsic motivation and
ultimately reduce their engagement and job satisfaction.6 In addition to decreasing employees’ intrinsic
motivation, such incentives may reduce performance if the employees lack the necessary knowledge on
how to improve (Huillery and Seban 2019). Second, compared to financial performance metrics, non-
financial performance metrics are difficult to measure and hence likely less suitable as a basis for incentive
schemes.7 Moreover, the difficulty of measuring, tracking, and verifying non-financial performance might
increase the risk of manipulating performance records to increase payouts (Linden and Shastry 2012).
Third, in the presence of multi-tasking activities, performance incentives may encourage substitution away
from non-incentivized activities, reorienting the employees’ attention toward those activities with a greater
pay-for-performance component or/and those that require lower effort (Basinga et al. 2011, Holmstrom and
Milgrom 1991).
Auditing and feedback (A&F)
In addition to social performance-based incentives, A&F can be introduced to enhance the non-profits’
operating efficiency and social performance. Specifically, by conducting audits on a regular basis,
independent third parties can verify that best practices and protocols are followed, adequate priorities are
set in terms of resource allocation, a strategic and managerial plan is developed and pursued, and that the
organization’s practices and performance are correctly documented.8
Through such audits, the non-profits also obtain data-based feedback on discrepancies between
current and target performance. The recognition of underperformance may encourage them to take action
6 This argument echoes the findings of studies in the context of for-profit organizations and the provision of financial performance-based incentives (e.g., Bowles 2016, Cassar and Meier 2021, Gubler, Larkin, and Pierce 2016, Wrzesniewski et al. 2014). 7 In the for-profit context, pay-for-social performance incentive schemes have been shown to be ineffective when they are vague and insufficiently specified (Flammer, Hong, and Minor 2019). 8 For example, in the context of the DRC’s health centers examined in this study, regular visits of independent auditors can ensure that general guidelines provided by the WHO are followed (PDSS 2016).

9
and improve their practices. Moreover, given their business expertise, auditors can play an important role
in providing feedback and recommendations to the non-profits’ managers and employees, thereby acting
as informal coaches.9 Such coaching might be of foremost importance. Indeed, an inherent challenge faced
by non-profits in low-income countries is to find competent managers and well-trained personnel. The lack
of know-how can lead to, e.g., unrealistic planning, inefficient work deployment, inadequate priorities in
resource allocation, improper interpretation and implementation of guidelines and procedures, and overall
poor decision-making; all of which are likely to result in the inefficient use of the non-profit’s already
limited financial resources, inventory, and human capital. Accordingly, by sharing valuable insights,
auditors can help transfer best practices and improve the non-profits’ effectiveness in terms of both their
operating efficiency and quality of services. Moreover, feedback can be reassuring for individuals and help
them build up their self-confidence that they are doing things right (Bandiera et al. 2015).
On the other hand, A&F may also have detrimental effects on employees. In particular, rating
employees may reduce their self-esteem and create animosity and competition among peers (Smither et al.
2005). Relatedly, managers’ evaluation of subordinates (which is commonly done in traditional
performance evaluation and in “rank-and-yank” performance appraisals) has been found to crowd out
creativity, as employees can hesitate to suggest unusual, creative ideas for fear of a harsh evaluation
(Amabile et al. 1990).
Financial subsidies
In addition to governance, financial subsidies can play an important role in enhancing the social impact of
non-profits, especially in resource-constrained environments. The provision of financial subsidies helps
alleviate financing constraints and allows non-profits to invest in, e.g., upgrading their equipment, hiring
more employees, and extending the scope of their services. This likely increases the scale of the non-profits’
operations. Thus, the provision of financial subsidies in combination with the implementation of
9 For instance, auditors of the DRC’s health centers examined in this study provide feedback to the audited health centers in order to improve their operations and help them follow best practices (PDSS 2016).

10
governance mechanisms may lead to improvements in both i) the non-profit’s scale of operations, as well
as ii) the non-profit’s operating efficiency and social performance. As such, financial subsidies and
governance mechanisms might serve as complements toward the objective of increasing the non-profit’s
overall social impact.
That being said, it is unclear whether financial subsidies alone (i.e., without improving the non-
profit’s governance and management practices) are sufficient to help improve operating efficiency and the
quality of services. Indeed, given the challenges and unique nature of non-profits, the sole provision of
financial subsidies need not yield improvements along these dimensions as funding per se does not foster
knowledge transfer and competence building, nor does it provide incentives to improve the organization’s
practices.
In the following, we explore the role of governance in improving non-profits’ operating efficiency
and their social impact in the context of a randomized governance program conducted in the DRC’s
healthcare sector (Sections 3-5). We also examine the interplay between governance and financial subsidies
in the context of this program (Section 6).
3. Program and experimental design
In this section, we describe the PDSS program and experimental design. This section draws from the PDSS
manual (PDSS 2016) that contains detailed information about the program.
3.1 The PDSS program
The PDSS program, known formally as “Projet de Développement du Système de Santé” (officially
translated by the World Bank as “Health System Strengthening for Better Maternal and Child Health
Results Project”) is a five-year nationwide public health program that was launched by the government of
the DRC with the aim to improve the utilization and quality of maternal and infant healthcare services in
targeted health zones in the country’s territory. The program began in 2017 in 156 health districts in 11 of
the country’s 26 provinces: Kwango, Kwilu, Mai-Ndombe, Équateur, Mongala, Sud-Ubangi, Tshuapa,
Haut-Katanga, Haut-Lomami, Lualaba, and Maniema. The program cost of $521 million is financed by the
11
DRC government, the World Bank, UNICEF, GAVI, UNDP, and donor country support.
The PDSS program attempts to improve the quantity and quality of primary healthcare services at
the health facility level through two main mechanisms. First, the program presents health facilities with
financial incentives to provide a “paquet minimum d’activités” (“minimum package of activities”). Defined
by the World Health Organization (WHO), these packages put a strong emphasis on maternal and child
health. Second, the program presents health facilities with a summary of their performance on a quarterly
basis. This information is collected by the contracting and verification agencies (“établissements d’utilité
publique,” EUPs) established at the provincial level. These are semi-autonomous entities appointed by the
DRC’s Ministry of Health and Ministry of Finance to manage the contracting and procurement of health
services with the health facilities. Concretely, they monitor and verify the health performance outcomes of
each facility and provide feedback on the facility’s quarterly management plans.
Prior to the PDSS program, other performance-based financing schemes were piloted in the DRC.
These schemes presented a select number of health facilities with different rewards, initially taking the form
of generic drugs only (2007-2009), thereafter generic drugs and cash (2009-2010), and finally cash only
(2011-2017). Further, they were implemented initially in South Kivu only, later in North Kivu, Orientale,
Kasai-Occidental and Kasai-Oriental, and lastly in Katanga. Notice that these initial pilots with
performance-based financing were undertaken in only a limited number of health zones, which were
different from the zones targeted by the PDSS program. Aside from these pilot schemes, we are not aware
of major reforms in healthcare that coincided with our period of study, nor of other programs that may have
differentially affected our treated health centers and thus biased our estimates.
Assessments of these pilot schemes were at best mixed. Mayaka et al. (2011) evaluated the first
two pilot schemes using a qualitative research approach. They highlight the complexity of the schemes, a
lack of shared understanding by key stakeholders, a lack of community engagement, and public sector
mismanagement, especially corruption, as the main reasons for why the pilots led to mediocre outcomes.
Huillery and Seban (2019) examined the impact of the fee (cash only)-for-performance system on health
service utilization and health providers’ motivation in 152 health facilities in Haut Katanga. They find that,

12
relative to the fixed payment system, the fee-for-performance mechanism slightly reduced service
utilization, and argue that the main explanation for this result is health workers’ lowered motivation at work
due to a lack of understanding of how to best perform.
Guided by these lessons learned, the design of the PDSS program departed from previous
performance-based financing schemes in healthcare in the DRC in three important ways. First, to address
the lack of awareness and understanding about evidence-based practices, the PDSS program provides not
only financial incentives but also auditing and feedback (A&F) to health facilities. Second, to mitigate
problems of mismanagement, the control over the contracting and procurement relationships with each
health facility was delegated by the government to third-party agencies at the provincial level. Furthermore,
the PDSS program also introduced a community verification system, whereby local associations are
mandated to check the actual existence of patients indicated in the facilities’ registries and collect
information about patients’ satisfaction. Taken together, these three distinct design features aimed to
improve the accountability of government and health workers, and the alignment of interests between the
health system’s key stakeholders: health workers, funders of the PDSS program, national and provincial
governments, and patient communities.
The background context in which the PDSS program was conceived is one marked not just by poor
health outcomes but also serious health system challenges. The DRC’s human development indicators are
among the lowest in the world, and four decades of conflict and mismanagement severely weakened the
country’s institutions and infrastructure. Moreover, the DRC is not on track to achieve any of the
Millennium Development Goals (MDGs), including those related to maternal and child health. The main
maternal and child health indicators remain very poor. According to UNICEF (2016), the maternal mortality
ratio is 693 (per 100,000 live births) and the under-five child mortality rate is 98 (per 1,000 live births).
Decreasing these mortality rates requires improvements in both the quantity and quality of reproductive
and child health services. Together, these challenges help explain why the PDSS program is designed the
way it is, and in particular why the financial incentives provided by the PDSS program are primarily linked
to maternal and child health outcomes.

13
3.2 Performance incentives
The PDSS program presents health facilities with financial incentives based on performance indicators
measured at the health facility level (as opposed to the level of individual health workers). The size of the
financial transfers (T) that health facilities receive depends on the performance along 22 health indicators
and overall service quality. The transfers paid to the health facilities are mainly used for purchasing essential
equipment. No more than fifty percent can be used toward health workers’ salaries. Payments are made
directly to the health facilities.
The overall transfer is comprised of two parts:
𝑇 𝑝 𝑞 𝛼
where the first part of the transfer reflects the performance along the 22 healthcare performance indicators
listed in Table A1. For each indicator, a target is set depending on the size of the population served by the
health facility. The payment amount per unit of health service i provided, pis, varies depending on the
percentage share s of the target performance achieved. For each indicator i, the closer the actual
performance is to the targeted performance, the higher the unit price. Some of these indicators refer to the
reasons for a visit (such as prenatal care or delivery), whereas others refer to the type of services provided
during a visit (such as tetanus vaccination during prenatal care). All the indicators and payment amounts
are defined in concordance with WHO guidelines.
The second part of the transfer reflects the overall health service quality. The parameter α denotes
the “quality bonus,” a supplement of up to 25% of ∑ 𝑝 𝑞 . Quality is assessed using a quality assessment
grid that consists of a longlist of evidence-based practices. The grid considers practices in 15 distinct
domains, ranging from the overall organization and management of the health facility to practices in terms
of HIV/tuberculosis, and hygiene and sterilization. The list is provided in Table A2. A total of 400 points
can be earned. To receive a bonus, the health center must secure a minimum of 200 points, that is, obtain a
quality score of at least 50 percent. When the quality score is above 50 but below 80 percent, the quality

14
bonus is given by α = quality score × 25% × ∑ 𝑝 𝑞 . When the quality score is above 80 percent, then
the quality bonus is given by α = 25% × ∑ 𝑝 𝑞 .
Health facilities submit monthly activity reports and quarterly requests for payment to the EUPs,
who are responsible for the verification of data and authorization of payments. A team of auditors verifies
the reported number of medical acts in the minimum package of activities (MPA) delivered by the center
during the period, and reviews the quality of the services provided using the quality assessment grid. The
auditors are recruited by and are accountable to the EUPs. They are helped by local associations whose role
is to question the community to i) find out whether the patients declared by the centers have effectively
received the corresponding treatments, and ii) gather feedback regarding their satisfaction. The team of
auditors not only assesses the health facilities’ performance outcomes and practices, it also provides
feedback and recommendations. The grid provides objective data regarding discrepancies between current
practices and target performance. Every quarter, the health facilities are expected to draw on these inputs
to plan realistic and progressive improvements. The auditors support the write-up of the quarterly
management plans that define how the improvements can be achieved. They also provide training in
finances and stock management.10
3.3 Selection into the program and randomization
The PDSS program was implemented in 11 of the DRC’s 26 provinces. The 11 provinces were selected
based on three criteria: poor health indicators, limited access to health services, and the ability to build on
or expand an ongoing partnership with an international organization. Only health centers registered with
the DRC Ministry of Health were eligible for the program. (They need not be affiliated with the government,
though.) Within each province, the selection of health facilities was made by Médecins d’Afrique (MDA),
an international NGO, in close collaboration with the World Bank’s impact assessment team and the PDSS
10 The auditors are members of the World Bank’s Development Policy Staff (DPS) who were previously deployed in the DRC and have expertise in healthcare. On top of their medical training, they received additional training by World Bank specialists in performance-based financing. Note that it is usually the same team of auditors who visit a given health center each quarter. This is meant to ensure a certain continuity in the feedback that is provided. A given team of auditors is often affected to several health zones within a given province.
15
project unit. Together, they conducted a baseline evaluation for which they designed questionnaires and
protocols for establishing the selection. They then assessed the health centers’ suitability for the program
as health centers were required to have a minimum level of quantity and quality of services. The baseline
evaluation was conducted between June 2015 and March 2016. The selected health centers were then
randomly assigned into a treatment group (“Groupe cas”) and control group (“Groupe témoin”). The
randomization itself was done in Excel, and every third health center was assigned into the control group.
It is important to note that both the treated and control health centers are part of the PDSS program,
in that they both receive funding from the program. The payments are twofold. First, at the beginning of
the program (first quarter of 2017), health centers in both the treatment and control groups receive an initial
subsidy (called “unité d’investissement”) that is meant to finance the purchase of essential equipment.
Second, in the first month of each quarter (starting in the second quarter of 2017), the performance-based
subsidy is paid out to the treated health centers based on the auditors’ assessment conducted in the previous
quarter (the formula used to compute the subsidy is described above in Section 3.2). Control health centers
also receive a quarterly subsidy that matches the average subsidy received by the treated health centers in
the same quarter. As such, the quarterly payments are on average the same in both the treatment and control
groups.
By design, the PDSS program provides an ideal setup for our study. By comparing health centers
that are randomly assigned to the treatment versus control group, we are able to identify the impact of the
governance intervention—that is the provision of performance-based incentives combined with A&F—on
health centers’ operating efficiency and social performance, holding everything else, including funding,
constant.
4. Data and methodology
4.1 Data sources
The data on the DRC health centers are obtained from administrative records of the DRC Ministry of Health
that are maintained in the DRC’s Système National d’Information Sanitaire (SNIS). They include detailed

16
information on the health centers’ operations (e.g., staff, number of consultations, number of births), along
with the name and location of each health center.
These data were supplemented with identifiers for the treated and control health centers provided
by the World Bank. Our baseline sample includes a total of 999 health centers, out of which 674 were
assigned to the treatment group, and 325 to the control group. For each health center, we were granted
access to 14 quarters of data, ranging from the first quarter of 2016 until the second quarter of 2019. That
is, our dataset includes four quarters before and ten quarters after the program’s launch.
Note that, while the large-scale implementation of the PDSS program took place in the first quarter
of 2017, a small number of health centers were already treated in 2016 in a pilot-like setting. Those are
excluded from our sample.
4.2 Outcome variables
Our objective is to study how the governance intervention—that is, the provision of performance-based
incentives combined with A&F—affects health centers’ outcomes. In what follows, we describe the
outcome variables.
Health center’s operating efficiency
We compute a health center’s operating efficiency as the number of primary healthcare services performed
divided by the number of employees. This measure captures the health center’s labor productivity (i.e.,
output per employee). Note that the health centers in our sample only offer primary healthcare services.
Secondary healthcare services are typically administered at hospitals, often upon referrals from the health
centers.
Health center’s employees
We use several variables to examine changes in the health center’s staff. First, we use the total number of
employees working at the health center. Second, we decompose this total into the number of doctors, nurses,
and administrative personnel, respectively.

17
Volume of healthcare services
To measure the volume (or “quantity”) of healthcare services, we use the number of primary healthcare
services performed. Since antenatal care and childbirth are the main services performed at the health
centers, we also use two additional metrics: the number of maternity and childhood healthcare services
performed, and the number of births.
Quality of healthcare services
To measure the quality of healthcare services, we focus on infant mortality at birth. This is a key metric in
our context since antenatal care and childbirth are the main services performed at the health centers. Infant
mortality at birth can occur in two forms: stillbirth and neonatal death. Stillbirth refers to a baby born with
no sign of life at or after 28 weeks of gestation; neonatal death refers to a baby who dies within the first 28
days of life (WHO 2019a, 2019b). We compute the ratio of stillborn babies to the total number of births
(henceforth “share of stillbirths”), the ratio of neonatal deaths to the total number of births (“share of
neonatal deaths”), and the complement (“share of live births”). These three ratios allow us to assess not
only the quality of the childbirth services per se, but also the quality of antenatal care services. Indeed,
medical research has shown that antenatal care reduces the likelihood of stillbirth and neonatal death (Adam
et al. 2005, Hollowell et al. 2011). As such, the above measures capture the quality of the main services
performed at the health centers.
4.3 Summary statistics
Table 1 provides summary statistics for the 999 health centers in our sample. All statistics refer to the fourth
quarter of 2016 (i.e., the quarter that precedes the start of the PDSS program). On average, health centers
in our sample performed 1,611 primary healthcare services (236 on a per employee basis). The majority
(957 out of 1,611) were maternity and childhood healthcare services. As discussed above, antenatal care
and childbirth are the main services performed at the health centers; the summary statistics reflect this
institutional feature of the DRC’s healthcare system.

18
----- Insert Table 1 about here ----
Other statistics are worth highlighting. The average number of employees is 7.1, consisting mainly
of nurses and administrative personnel. The average (quarterly) number of births is 53.8, out of which
0.70% are stillbirths, and 0.17% neonatal deaths. Lastly, as can be seen from the bottom panel, the average
health center is located in a health district of 204,409 inhabitants, and a health area of 11,135 inhabitants.11
To further characterize the health centers from our sample, Figure 1 provides photographs featuring three
of them.
----- Insert Figure 1 about here ----
4.4 Randomization tests
Our identification strategy relies on the random assignment of health centers to the treatment and control
groups. Since randomization is a feature of the PDSS program, this requirement should hold by design.
To empirically assess the validity of the randomization, we can examine the covariate balance prior
to the treatment—intuitively, if the assignment is truly random, there should be no systematic difference
between health centers in the treatment and control groups based on pre-treatment characteristics.
We conduct this analysis in Table 2, where we report the same set of summary statistics as in Table
1, but separately for the 674 health centers in the treatment group and the 325 health centers in the control
group. The statistics are again computed in the fourth quarter of 2016 (i.e., the quarter that precedes the
launch of the PDSS program). The last two columns of the table provide the p-value of the difference-in-
means test and the Kolmogorov-Smirnov (KS) test of identical distributions, respectively, for each
covariate.
----- Insert Table 2 about here ----
As can be seen, there is no systematic difference between the treated and control health centers.
For all covariates, the summary statistics are very similar in economic terms. They are similar in statistical
11 The DRC is partitioned into 516 health districts (also called health “zones”) and 8,504 health areas. Appendix A provides a description of the DRC’s health system along with a characterization of the health districts and health areas, respectively.

19
terms as well. Specifically, the difference-in-means test (reported in the penultimate column) is always
insignificant, with p-values ranging from 0.196 to 0.981. Similarly, the KS test of identical distributions
(reported in the last column) is always insignificant as well, with p-values ranging from 0.140 to 0.980.
Overall, the evidence from Table 2 confirms the random assignment of health centers.12
This randomization is further illustrated in Figure A3, where we plot the distribution of each
outcome variable in the treatment vs. control groups in the quarter preceding the treatment. As can be seen,
the distributions are very similar for each variable. The formal test for identical distributions—the KS test
from Table 2 mentioned above—confirms that the null of identical distributions cannot be rejected for all
variables.
4.5 Methodology
To examine how the treatment affects health center outcomes, we use a difference-in-differences
methodology. For each health center and each outcome variable y (e.g., share of stillbirths, share of neonatal
deaths, operating efficiency), we compute the change from t – 1 (the quarter preceding the intervention, Q4
2016) until t + 9 (nine quarters after the intervention, Q2 2019), which we denote by Δyt‒1,t+9. Note that the
quarter of the treatment is denoted by t = 0 (Q1 2017), and hence the post-treatment period consists of 10
quarters from t = 0 until t = 9. Whenever y is a ratio (e.g., the share of stillbirths), Δy represents the difference
in the ratio; whenever y is a level (e.g., the number of employees), Δy represents the percentage change
(denoted by %Δy in the tables). We then estimate the following difference-in-differences specification:
Δyi,t-1,t+9 = αp + β × treatmenti + εi (1)
where i denotes health centers; αp are province fixed effects; treatment is the treatment indicator, which is
equal to one for health centers in the treatment group (and zero for those in the control group); and ε is the
12 In Figure A2, we plot the location of the health centers in the control group (blue markers) and treatment group (green markers) on the DRC map. We caution that the map is incomplete as granular geo-codes (and hence the longitude-latitude coordinates) are only available for about 73% of the sample. As can be seen, there is no apparent imbalance between the two groups. More formally, when we examine the distribution of the control and treated health centers within each province, we find no significant deviation from the program’s targeted 2/3 of treated health centers. Specifically, the null of a 2/3 distribution within each province cannot be rejected with a p-value of 0.268.

20
error term. We cluster standard errors at the health district level to account for potential dependence of the
error term at the local level. The coefficient of interest is β, which measures the difference in Δyt‒1,t+9
between the treated and control health centers (i.e., the difference-in-differences). In other words, it
measures the effect of the governance treatment on y accounting for contemporaneous changes in y at the
control health centers. Note that the inclusion of province fixed effects ensures that we compare treated and
control health centers within the same province. (In robustness tests, we show that our results hold
regardless of their inclusion.)
In our main analyses, we also estimate variants of equation (1) to examine the dynamics.
Specifically, we consider Δyt-4,t-1, Δyt-3,t-1, and Δyt-2,t-1, to test for pre-trends, and Δyt-1,t, Δyt-1,t+1, …, Δyt-1,t+9
to characterize the dynamics of the treatment effect.
5. Results
5.1 Impact of the governance treatment on health center outcomes
Main results
Table 3 presents our main results. The estimates are obtained from regression (1) using the 999 health
centers in our sample. In columns (1) and (9)-(11), where the dependent variable y is a ratio, Δy represents
the difference in y from t – 1 to t + 9. In columns (2)-(8), where the dependent variable y is a level, %Δy
represents the percentage change in y from t – 1 to t + 9.
----- Insert Table 3 about here ----
As can be seen from column (1), operating efficiency increases significantly following the
governance treatment. The coefficient of 101.4 (p-value = 0.000) implies that the number of primary
healthcare services per employee increases by 101.4. Given a pre-treatment average of 238.5 (Table 2), this
corresponds to a 42.5% increase in operating efficiency. This finding indicates that the governance
intervention leads to higher operating efficiency.
In columns (2)-(8), we unpack this change in operating efficiency by examining changes in the
numerator (number of services performed) and denominator (number of employees). In terms of the

21
denominator, we find that, following the treatment, health centers significantly reduce their administrative
staff—the number of administrative employees decreases by 9.6% (p-value = 0.085)—while there is
virtually no change in the number of doctors and nurses. In terms of the numerator, we find that the level
of services performed increases, but not significantly so. Overall, this finer analysis suggests that the
efficiency gains are derived mainly from a reduction in administrative overhead.
Note that the decrease in administrative overhead is not about layoffs per se. In fact, both the
treatment and control group increase their staff from t – 1 to t + 9. The observed difference between the two
groups indicates that treated health centers hire fewer additional administrative employees compared to the
control group.
In columns (9)-(11), we find that the quality of healthcare services increases significantly following
the treatment. Specifically, we find that the share of stillbirths decreases by 0.32 percentage points (p-value
= 0.006), and the share of neonatal deaths by 0.23 percentage points (p-value = 0.032). Correspondingly,
the share of life births increases by 0.55 percentage points (p-value = 0.002). Put differently, for every 1,000
new births, the governance treatment helped save about 3.2 lives at birth (reduction in stillbirths) and 2.3
lives within the first 28 days after birth (reduction in neonatal deaths). These are large effects in light of the
baseline probabilities. Indeed, the pre-treatment share of stillbirths and neonatal deaths is on average 0.91
percentage points (Table 2). Hence, a decrease by 0.55 percentage points in the share of stillbirths and
neonatal deaths corresponds to a 60.4% reduction in infant mortality. Overall, these results indicate that the
governance intervention brought about large improvements in social performance.13
Dynamics
In Table 4, we examine the dynamics of the treatment. To do so, we re-estimate regression (1), but instead
of computing changes in outcomes from t – 1 to t + 9, we compute changes in outcomes for increasing time
13 In Appendix B, we present several robustness checks. Specifically, we show that our results are robust if we i) do not include province fixed effects (Table A3), ii) do not cluster standard errors (Table A4), and iii) re-estimate the regressions of the share of stillbirths, neonatal deaths, and live births using weighted least squares (WLS), weighting observations by the number of births, thereby accounting for the fact that ratios of births are more accurately measured when the number of births is higher (Table A5).

22
intervals on a quarterly basis (Δyt-1,t, Δyt-1,t+1, …, Δyt-1,t+9) and also consider pre-trends (Δyt-4,t-1, Δyt-3,t-1, and
Δyt-2,t-1). Each estimate in the table is obtained from a different regression, depending on the outcome
variable (columns) and time horizon (rows). In Figure 2, we plot the coefficients in event time (along with
90% confidence bounds) for each outcome variable.
----- Insert Table 4 and Figure 2 about here ----
As can be seen, we find no evidence for pre-trends; the corresponding point estimates are all small
and insignificant. We also find no evidence for an immediate response at the time of the intervention.
Rather, the benefits from the treatment take a few quarters to materialize. The first tangible effect is
observed after four quarters, when the increase in operating efficiency (and the underlying reduction in
administrative overhead) becomes significant. The improvements in the quality of healthcare services take
even longer to materialize. It is only after seven quarters that the birth mortality statistics start showing
significant improvements.
The delayed response is consistent with the gradual adoption and learning of better practices. This
was confirmed in a series of interviews we conducted with program participants (N = 20).14 Collectively,
the respondents highlighted that a key challenge was the lack of adequate training and organizational know-
how. In this regard, the quarterly rounds of feedback (combined with incentives to actually act on this
feedback) were seen as essential in inducing tangible changes that would ultimately translate into higher
efficiency and quality of services.
It is also worth noting that the long learning curve of the health centers’ employees was a key
consideration in designing the PDSS program. As discussed in Section 3.1, prior to the PDSS program,
pilot programs using performance-based financing designs were run in selected parts of the DRC. These
programs were unsuccessful, suggesting that the mere use of performance-based financing is insufficient
to induce tangible improvements. This led to the innovative design of the PDSS that combines
14 We conducted 20 interviews with individuals involved in the PDSS program, out of which 17 were based in the DRC. The interviewees included health center employees (nurses and doctors), auditors, and programs administrators. The recordings of these interviews are available upon request.

23
performance-based incentives with A&F.
Lastly, the longer lag we observe for the improvements in infant mortality (7 quarters, compared
to 4 quarters for the improvements in operating efficiency) reflects the type of services provided at the
health centers. Indeed, the bulk of the health centers’ services pertain to pre-natal care. By their very nature,
improvements in pre-natal care reduce the risk of stillbirths and neonatal deaths several months in the
future, and are likely more effective when higher-quality services are provided throughout the full
pregnancy cycle. This likely explains the longer lag we observe in the data.
Economic magnitudes
As mentioned above, our baseline estimates are large in economic terms—the estimates from Table 3 imply
that operating efficiency increases by 43% and infant mortality decreases by 60%. Our interviews of
program participants help shed light on these magnitudes. All respondents (N = 20) expected the
improvements to be large, citing the low education level and inadequate training of the health center
employees as key rationales for a steep learning curve. One respondent even qualified the benefits of the
program as “énormes” (enormous) due to the above reasons.
While interviews are subjective in nature, a perhaps more objective benchmark is provided by the
World Bank, who targeted to reach a 65% quality score for the treated health centers, compared to a 20%
score prior to the start of the PDSS program (World Bank 2018). This corresponds to more than a three-
fold increase in quality.
To further assess the magnitudes, and put them into perspective, we benchmark our estimates
against related estimates from the literature. In this regard, the literature on management practices is
especially informative, as considerable effort has been put into quantifying the productivity gains from
different management practices. (In spirit, our governance treatment consisting of social performance-
based incentives combined with A&F can be seen as a form of “structured management practice” in the
terminology of Bloom et al. 2019). Specifically, in their study of management practices at U.S.
manufacturing plants, Bloom et al. (2019) find that a one standard deviation increase in their score of

24
structured management is associated with a 26% percent increase in labor productivity, noting that “[t]he
magnitude of the productivity-management relationship is large” (p. 1649). Giorcelli (2019) finds that
Italian companies who participated in a management assistance program achieved a 49% increase in
productivity. Similarly, Bruhn et al. (2017) find that Mexican small and medium enterprises that were
offered a one-year access to management consulting services achieved a 27% increase in productivity.
Naturally, we caution that the benefits of the improved management practices considered in these
articles need not be directly comparable to those of the intervention considered in our study given the
different nature of non-profit organizations. Nevertheless, they do provide guidance in terms of how
changes in business practices can affect operating efficiency. Collectively, they indicate that the efficiency
gains can be substantial, in the ballpark of what we find in our setting. In addition, such efficiency gains
might be larger in developing countries such as the DRC due to the potentially bigger room for
improvement, as several respondents pointed out in our interviews.15
Post-treatment distributions
In Figure A4, we plot the post-treatment distributions of each outcome variable in the treatment and control
groups, respectively. In principle, the intervention could lead to a separation of the treated health centers
into “superstar” health centers (i.e., those that do well based on the performance targets) and “failure” health
centers (i.e., those that do not). In this scenario, the tails of the performance improvements would be wider
in the treatment vs. control group. In Panel A of the figure, we plot the post-treatment distributions of
operating efficiency in the treatment and control groups. As can be seen, we find that the right tail improves
in the treatment (vs. control) group. However, we do not find evidence for a deterioration in the left tail. In
15 Another way to put the magnitudes into perspective is through the VSL (value of a statistical life) framework. Viscusi and Masterman (2017) estimate a VSL of $71,000 for the DRC (compared to a VSL of $9.6M for the U.S.). Our baseline results in Table 3 suggest that the governance treatment reduces infant mortality by 0.55%. Factoring in the number of treated health centers (674) and the average number of births per health center (55.7, see Table 2), the governance intervention corresponds to VSL gains in the amount of $14.7M. Compared to the cost of the program ($521M), this translates into a VSL-ROI of about 3% from governance alone. Naturally, we caution that this number likely represents a lower bound since the improvements brought about by the governance intervention are likely to improve patient health in ways that are not captured by our infant mortality metrics.

25
fact, the left tail improves as well. More broadly, the whole distribution seems to shift to the right (compared
to the control group). In Panel K, we observe a similar pattern when looking at the post-treatment
distributions of the share of live births. (A consistent pattern is also observed in Panels I and J when looking
at the share of stillbirths and share of neonatal deaths, respectively.) Overall, this suggests that the treated
health centers that score low in the quarterly assessments (and hence receive less funding than the control
health centers) do not perform worse than the control group.
This finding is consistent with the World Bank’s insights from their earlier pilot programs in which
they found that the sole provision of performance-based funding did not affect the performance of health
centers in the RDC. This is also consistent with our auxiliary findings based on the “outside” group, where
we find that funding per se is not associated with subsequent changes in performance (see Section 6).
Rather, this finding highlights the importance of combining performance-based incentives with quarterly
rounds of auditing and feedback. By implementing at least some of the feedback—which is likely to be the
case for most treated health centers—performance improves. In contrast, not implementing the feedback is
conducive to the status quo and hence need not hurt performance (compared to the counterfactual provided
by the control group).
5.2 Potential challenges and alternative interpretations
In this subsection, we discuss potential challenges of the PDSS experiment, and provide additional evidence
that mitigates alternative interpretations of our findings.
Contamination
An important concern is that the treatment might be contaminated by strategic interactions among nearby
health facilities. In particular, health centers may try to “game” the performance-based incentives by
strategically refusing high-risk patients (e.g., pregnant mothers who face a high risk of stillbirth), referring
them to nearby health centers and hospitals. Such gaming behavior could potentially explain our results.
Nevertheless, this concern is mitigated, for two reasons. First, as part of their assessment protocol,
the auditors conduct interviews among the local community. Accordingly, if health centers were to transfer

26
high-risk patients elsewhere, they would likely find out. Second, in Panel A of Table 5, we examine whether
the share of stillbirths and neonatal deaths increases (and the share of live births decreases, respectively) at
other healthcare facilities that are located in the same health district as the treated health centers. Those
include hospitals (columns (1)-(3)), control health centers (columns (4)-(6)), and health centers not in the
PDSS program (columns (7)-(9)) that are located in the same health district as the treated health centers.
As can be seen, we find that all point estimates are small and insignificant, which is inconsistent with the
gaming interpretation. In Panel B of Table 5, we further examine whether the number of services changes
at the nearby healthcare facilities (number of primary healthcare services, number of maternal and
childhood healthcare services, and number of births). Again, we find no such evidence.
----- Insert Table 5 about here ----
A related concern is that the treated health centers may expand their capacity post-treatment, and
hence be able to see a higher number of low-risk patients who would have otherwise relied on home care.
In this scenario, the treated health centers would have a higher share of low-risk patients, which could
explain the improvements in the birth statistics. Nevertheless, as shown in column (8) of Tables 3 and 4,
the increase in the number of deliveries is not significantly higher in the treatment vs. control group. This
mitigates the possibility that the improvements in infant mortality are purely driven by “scale” (and the fact
that higher scale may help clinics admit a large share of low-risk patients). Moreover, in our interviews, it
was noted that the choice to deliver at home or at the health center is not made based on the risk assessment
of the pregnancy, as women themselves cannot easily assess the level of risk of their pregnancy. Rather,
the stated rationales were the perceived quality of services offered by the health centers and the value for
money of these services. Neither is related to the pregnancy’s riskiness.
Corruption
Another potential challenge is that the health center staff may attempt to bribe the auditors. To alleviate this
possibility, the PDSS program has explicit protocols to prevent and sanction fraud. Specifically, the
program collaborates with an external counter-audit agency that periodically audits the auditors and helps

27
guarantee the integrity of the process. In case of a discrepancy between the evaluation of the auditors and
the evaluation of the counter-audit agency, and if the discrepancy exceeds 10% of the composite score (and
no qualitative justification is provided to explain the difference), both the auditor and the health center are
sanctioned. For auditors, the first offense triggers the retention of 30% of the auditor team’s compensation,
and the second offense triggers the suspension of the auditor contract until administrative measures are
taken. For health centers, the first penalty is a retention of 30% of the total subsidies from the next quarterly
payment, and the second penalty is the termination of the performance contract until administrative
measures are taken (such as the replacement of the head of the health center by a candidate whose
application is approved by the Ministry of Health).
While these protocols alleviate the possibility of misreporting, it is worth noting that—even if
misreporting occurs—it is unlikely to contaminate our analysis. Indeed, our data on health center outcomes
are obtained from the DRC Ministry of Health (not the World Bank). Accordingly, we do not examine the
specific performance indicators used by the World Bank, but instead study performance outcomes (such as
the number of stillbirths, neonatal deaths, etc.) that are collected independently of the PDSS program.
Employee turnover
Our results show that the treated health centers hire fewer administrative employees post-treatment, while
there is no significant change in the hiring of nurses and doctors. That being said, even if we observe no
significant change in a given employee category, it could be that low-skill employees were replaced by
high-skill employees. In this scenario, our results could be driven by the recruitment of higher-skilled
employees, as opposed to the governance treatment itself. Unfortunately, we do not have disaggregated
data at the employee level that could be used to examine this alternative. Nevertheless, we believe it is
unlikely to explain our results, for the following reasons.
First, the labor market for health workers is very thin in the DRC. The WHO estimates that the
DRC only has 6 qualified health workers per 10,000 population, as compared to the WHO’s recommended
minimum of 23 per 10,000 population (WHO 2016). Second, and importantly, the mobility of health

28
workers is highly restricted, as their allocation is centralized at the province level. The entry-level market
relies on the initial training of medical staff that is exclusively done in the major cities and abroad.
Periodically, the National Ministry of Health allocates new health workers to each province, and the
respective Provincial Ministry of Health then allocates them to health centers within the province. The
reallocation of health workers across health centers is also handled by the respective Provincial Ministry of
Health. In other words, each Provincial Ministry of Health has full decision rights over the recruitment and
distribution of medical staff across health centers.
Accordingly, labor mobility is not under the direct control of the health centers nor the health
workers. What health centers can do is sanction or request the mobility of a specific health worker. The
request is then handled at the provincial level. Similarly, health centers can request an increase in their
medical staff, but have little influence on the selection process of the personnel they receive. For this reason,
it is unlikely that the treated health centers will be able to hire “better” medical staff post-intervention.16
Hawthorne effect
A potential concern with randomized controlled trials is the so-called “Hawthorne effect”—that is, the
possibility that the treated subjects might feel observed and alter their behavior in response (for reasons
unrelated to the treatment). In particular, it could be that being in the PDSS program induces a status boost
that could affect the staff’s behavior regardless of the intervention per se. Nevertheless, this concern is
mitigated, for two reasons. First, control health centers were an integral part of the PDSS program, as they
received a significant amount of subsidies from the program (the same average amount as the treated health
centers). Our qualitative interviews further confirmed that the control health centers clearly felt part of the
PDSS program. Second, a pure status boost would likely affect outcomes already in the early quarters of
the program, while we find that the effects materialize with a lag of several quarters.
16 In contrast to the medical staff, non-medical staff (that is, administrative employees) are recruited by the health center board. As such, their number can be optimized at the health center level. Nevertheless, the higher mobility of administrative employees is unlikely to explain the higher quality of medical services per se, as administrative employees are barred from performing medical acts by the PDSS guidelines.

29
Implementation challenges
In our interviews of program participants, two implementation challenges were mentioned. First, a non-
trivial challenge was accessibility. Some villages and health facilities were harder to access due to poor
road conditions, locations in flooded riverine areas, or because of security problems. In several instances,
auditors had to use canoes and motorcycles. The second challenge was connectivity. Although auditors
were equipped with cell phones and tablets, some teams were out of range of communication systems for
days. This limited their ability to take full advantage of the features of the platforms used to enable online
data collection and retrieval. These logistical challenges led to occasional delays in conducting the auditing.
That being said, given their idiosyncratic nature, they are unlikely to substantially affect our analysis.17
5.3 Cross-sectional heterogeneity
The results presented so far indicate that the governance intervention—i.e., the provision of performance-
based incentives combined with A&F—brings about large improvements in operating and social
performance. As discussed above, these findings point toward a “learning” interpretation. In particular, the
fact that the effects materialize after a few quarters (as opposed to the very short run) is consistent with the
health center staff progressively learning from the quarterly rounds of feedback, and having incentives to
act on this feedback.
To shed further light on the mechanism, we examine how our results differ depending on various
cross-sectional characteristics. The first variable we consider is the density of health centers in the health
district, measured as the number of health centers per capita (i.e., the number of health centers divided by
the health district’s population). In low-density areas, health centers have limited opportunities to learn and
adopt best practices from their peers. Accordingly—to the extent that the auditors’ quarterly rounds of
feedback help transfer useful knowledge and best practices—the treatment effect might be stronger among
those.
17 Another potential challenge was the Ebola outbreak of 2014-2016 that preceded the launch of the PDSS program. While the Ebola crisis most certainly affected the health centers in our sample, it is unlikely to significantly distort our estimates as it affected both the treatment and control health centers.

30
The second set of variables we consider are measures of ex ante performance, namely i) operating
efficiency and ii) infant mortality (the sum of stillbirths and neonatal deaths, divided by the number of
births). Low-performing health centers are more likely to lack proper know-how and hence might be more
responsive to the treatment. Finally, we also consider the moderating role of health center size, as smaller
health centers might have a lower knowledge base to begin with.
In Table 6, we augment regression (1) by interacting treatment with the four measures described
above. Note that all interaction terms are measured in the quarter that precedes the intervention (that is, at
t – 1), except for infant mortality which is measured over the four quarters prior to the treatment (that is,
from t – 4 to t – 1). We use four quarters to ensure that infant mortality has enough cross-sectional variation,
as infant mortality is often 0 for a given health center in a given quarter. For ease of interpretation, we
standardize each interaction term. That is, the coefficients capture the differential treatment effect for a one-
standard deviation increase in the variable of interest. Note that the regressions also include the interacted
variables as standalone controls.
----- Insert Table 6 about here ----
As can be seen, we find that the local density of health centers significantly moderates our results.
Specifically, we find that health centers in low-density areas experience a higher increase in operating
efficiency and a larger decrease in infant mortality. These findings are consistent with the learning
interpretation, as they suggest that health centers benefit more from the treatment when it is harder to learn
and adopt best practices from their peers. Moreover, we find that i) the increase in operating efficiency is
higher for health centers with lower ex ante operating efficiency, and ii) the decrease in infant mortality is
more pronounced for health centers with higher ex ante mortality. These findings indicate that the
improvements brought about by the treatment are larger when there is more to improve and learn to begin
with, which again points toward the learning interpretation. In contrast, health center size per se does not
significantly moderate the treatment effect.
Naturally, we caution that the results in Table 6 are correlational, as we do not have instruments

31
for the interacted variables.18 Nevertheless, collectively, these results lend support to the learning
interpretation—that is, the health center staff learn from the quarterly rounds of feedback (while being
incentivized to act on this feedback), which ultimately translates into higher operating efficiency and social
performance.
In Table A6, we refine the analysis of past performance by considering the lower tail of the ex ante
performance distribution. Specifically, instead of using continuous measures, we now use two dummy
variables that indicate whether the health center is in the bottom 25% and 10%, respectively, of economic
performance (measured using operating efficiency; columns (1)-(2)) and social performance (measured
using infant mortality; columns (3)-(4)). We find that the treatment effect is significantly stronger among
the worse-performing clinics. The increase in operating efficiency is 0.4 (0.5) times larger for clinics in the
bottom 25% (10%) of economic performance; the decrease in infant mortality is 1.7 (1.9) times larger for
clinics in the bottom 25% (10%) of social performance. This confirms that the effectiveness of the
intervention is greater among low-performing clinics. Interestingly, we find that the treatment effect, albeit
smaller in economic terms, remains significant even outside the bottom 25% of clinics based on their ex
ante performance. Arguably, given the many challenges faced by the healthcare sector in the DRC, there is
considerable room for improvement, even leaving aside the lowest-performing clinics.
6. Funding vs. governance: auxiliary evidence from health centers outside the PDSS program
In the analysis presented so far, we focused on health centers that were selected for the PDSS program—
that is, health centers that were either in the control group (receiving PDSS funding) or in the treatment
group (receiving PDSS funding and the governance treatment).
In this section, we consider a third group of health centers, namely those that are not part of the
PDSS program. We refer to this group as the “outside group.” By construction, the outside group does not
18 In particular, we note that health centers in low-density areas tend to be smaller, have lower operating efficiency, and higher infant mortality. Specifically, density has a correlation of 7.1% (p-value = 0.024) with size, 10.2% (p-value = 0.001) with operating efficiency, and –7.9% (p-value = 0.013) with infant mortality. The inclusion of all four characteristics in the same specification alleviates the possibility that density may merely capture the moderating role of these correlated characteristics.

32
receive any funding nor the governance intervention from the PDSS program. Accordingly, we can use the
outside group to examine the relationship between funding and governance. Specifically, by comparing the
treatment group (that receives funding and the governance treatment) versus the outside group (that receives
neither), we can assess the benefits of the ‘funding and governance’ bundle. Similarly, by comparing the
control group (that receives funding) versus the outside group, we can assess the effectiveness of ‘funding
only.’
Our dataset from the DRC Ministry of Health covers a total of 5,832 health centers in the outside
group. Table A7 provides summary statistics for those. Compared to the 999 health centers in our sample,
the “outside” health centers are on average smaller (5.2 versus 7.1 employees) and provide a lower volume
of services (1,153 versus 1,611 primary healthcare services performed). These differences are not
surprising. Indeed, as described in Section 3.3, inclusion in the PDSS program is not random. (What is
random is the assignment to the treatment versus control group within the PDSS program.) Hence, a caveat
of using the outside group is that we can no longer rely on randomization, and hence any such analysis is
correlational per se.
To mitigate this caveat, we use a nearest-neighbor matching in which health centers in the treatment
group (and control group, respectively) are matched to health centers in the outside group based on a large
set of observables. Specifically, for each of the 674 health centers in the treatment group (and for each of
the 325 health centers in the control group, respectively), we match the nearest—i.e., most similar—health
center out of the pool of 5,832 health centers in the outside group. The matching is done in two steps. First,
we require that the matched health center be located in the same health district as the treated health center.
(If less than 10 outside health centers are available within the relevant district, we relax this requirement
and require that the matched health center be located in the same province as the treated health center.)
Second, out of the remaining candidates, we select the nearest neighbor based on the health center
characteristics in Table A7 (measured in the quarter that precedes the PDSS program). The nearest neighbor
is then the one with the lowest Mahalanobis distance to the treated health center along the matching

33
characteristics.19
This matching procedure ensures that the matched health centers from the outside group are as
similar as possible to the treated health centers (and control health centers, respectively) ex ante. The
covariate balance, provided in Table A8, confirms that there is no significant difference between the
respective groups.
Treatment group versus outside group: assessing the effectiveness of funding and governance combined
To compare outcomes in the treatment versus outside groups, we estimate a variant of regression (1), using
the outside group in lieu of the control group. That is, we now compare health centers in the treatment group
versus health centers in the outside group (i.e., health centers that receive neither PDSS funding nor the
governance treatment). This comparison allows us to examine how the combination of both funding and
governance affects health center outcomes.
The results are provided in Panel A of Table 7. As can be seen, we find again that operating
efficiency (column (1)) and the quality of healthcare services (columns (9)-(11)) significantly improve
following the treatment. These results mirror those from Table 3. Importantly, compared to the outside
group, we find that the treated health centers significantly increase the scale of their operations—the number
of employees increases by 13.7% (p-value = 0.001), the number of primary healthcare services by 89.7%
(p-value = 0.001), the number of maternal and childhood healthcare services by 92.4% (p-value = 0.001),
and the number of births by 69.1% (p-value = 0.000). Arguably, the ‘funding and governance’ bundle
benefits the treated health centers in two ways: the additional funding allows them to grow their operations,
while the governance intervention helps them improve their economic and social performance.
----- Insert Table 7 about here ----
Control group versus outside group: assessing the effectiveness of funding alone
In Panel B of Table 7, we compare health centers in the control group versus health centers in the outside
19 Formally, the Mahalanobis distance δ between treated health center i and candidate health center j is given by δ = [(Xi – Xj)’ Σ-1 (Xi – Xj)]½, where X is the vector of matching characteristics and Σ the covariance matrix.

34
group. Since the control group receives PDSS funding, and the outside group does not, this comparison
allows us to examine how funding as standalone (i.e., without governance improvements) affects health
center outcomes.
As is shown, we find that funding as standalone leads to increases in the scale of the health center’s
operations—the number of employees increases by 13.0% (p-value = 0.001), the number of primary
healthcare services by 52.4% (p-value = 0.015), the number of maternal and childhood healthcare services
by 57.4% (p-value = 0.042), and the number of births by 38.6% (p-value = 0.088)—but does not bring
about significant improvements in operating efficiency (column (1)) nor in the quality of healthcare services
(columns (9)-(11)).
Taken together, the results from Tables 3 and 7 suggest that i) governance alone increases operating
efficiency and social performance, but not the scale of the health centers (Table 3); ii) funding alone
increases the scale of the health centers, but does not improve operating efficiency nor social performance
(Panel B of Table 7); and iii) the combination of funding and governance leads to improvements in both
the scale of the health centers, as well in health centers’ operating efficiency and social performance (Panel
A of Table 7). As such, these results suggest that funding is not a substitute for governance. Instead, they
complement each other in improving the health centers’ social impact in terms of both scale and
performance.20
7. Discussion and conclusion
How can non-profit organizations improve their governance in order to maximize their intended social and
environmental impact? This question is of foremost importance not only for the non-profits themselves (as
well as their donors and impact investors), but also for achieving the United Nations’ SDGs. In short,
20 In Table A9, we consider the same set of moderators as in Table 6, but with respect to the regressions of Table 7. In Panel A, we continue to find that i) density moderates the impact of the treatment on operating efficiency and infant mortality, ii) the increase in operating efficiency is higher for health centers with lower ex ante operating efficiency, and iii) the decrease in infant mortality is more pronounced for health centers with higher ex ante mortality. In addition, in both Panels A and B, we find that smaller health centers are more likely to increase their scale following the provision of PDSS funding.

35
improving the governance of the non-profit sector is important from an economic, environmental, and social
perspective.
In this study, we shed light on this question by exploiting a randomized governance program
conducted in the DRC’s healthcare sector. The program was administered in about 1,000 non-profit health
centers that were randomly assigned into a treatment and control group. While health centers in both groups
received financial subsidies from the program, only those in the treatment group were subject to the
“governance treatment” consisting of social performance-based incentives combined with A&F. As such,
this randomized program provides an ideal setup to study how the adoption of governance mechanisms
affects health centers’ outcomes, holding everything else (including financial subsidies) constant.
We find that the governance treatment led to i) a significant increase in the number of services
performed per employee, and ii) a significant reduction in the share of stillbirths and neonatal deaths. These
findings indicate that governance plays an important role in improving non-profits’ operating efficiency
and social performance, respectively.
We further explore the underlying mechanism and document that the effect of the governance
treatment is stronger in areas with a lower density of health centers (that is, areas where it is harder to adopt
best practices from other clinics) and among health centers with lower (ex ante) operating efficiency and
social performance, respectively, which points toward the importance of learning in explaining the
treatment effect—that is, the health center staff learn how to improve their operations from the auditors’
feedback, while being incentivized to incorporate and act on this feedback going forward.
Finally, we examine whether financial subsidies could potentially serve as a substitute for
governance. We find that this is unlikely to be the case. Specifically, we find that health centers that only
receive financial subsidies increase their scale, but do not show improvements in operating efficiency nor
in the quality of their services. In contrast, health centers that receive both financial subsidies and the
governance treatment improve both their scale as well as their operating efficiency and the quality of their
services. This suggests that financial subsidies and governance operate as complements toward the
objective of increasing the non-profit’s overall social impact.

36
Our study contributes to several strands of the literature. First, by exploring the role of governance
(in the form of social performance-based incentives and A&F) in enhancing the social impact of non-profits
operating in a resource-constrained environment, this study relates to the large literature that has studied
the role of governance and management practices in the context of for-profit organizations (e.g., Aguilera
et al. 2016, Blader, Gartenberg, and Prat 2020, Bloom and Van Reenen 2007, Bloom et al. 2013, Bryan,
Tilcsik, and Zhu 2017, Cai and Szeidl 2018, Chatterji et al. 2019, De Mel, McKenzie, and Woodruff 2014,
Dimitriadis and Koning 2020, McKenzie 2021, McKenzie and Woodruff 2014, 2017). Since the non-profit
and for-profit contexts are fundamentally different, it is a priori unclear i) which governance and
management practices are available and effective for non-profits in a resource-constrained setting, as well
as ii) when and where those practices matter more or less. Our study sheds light on these questions and
highlights the effectiveness of a bundle of governance mechanisms that consists of social performance-
based incentives combined with A&F. Moreover, we show that, although financial subsidies cannot
substitute for governance, they can enhance the effectiveness of the governance bundle.
In addition, our study contributes to the literature that examines the social performance of i) for-
profit organizations (e.g., Eccles, Ioannou, and Serafeim 2014, Flammer 2015, Flammer, Hong, and Minor
2019, King and Lenox 2001); ii) for-profit organizations in collaboration with non-profits and non-
governmental organizations (e.g., Ballesteros and Gatignon 2019, Cabral et al. 2019, Chatain and
Plaksenkova 2019, Durand and Huysentruyt 2021, Rousseau, Berrone, and Gelabert 2019); iii) hybrid
organizations (e.g., Battilana and Dorado 2010, Cobb, Wry, and Zhao 2016, Jay 2013, Pache and Santos
2013, Quélin, Kivleniece, and Lazzarini 2017); iv) non-profit organizations in the healthcare sector (e.g.,
Kellogg 2009); as well as v) non-profit organizations in developing countries (e.g., Mair, Marti, and
Ventresca 2012). Our study complements this vibrant line of work by exploring how the governance of
non-profits (along with the interplay between governance and financial subsidies) can contribute to their
social impact in a resource-constrained environment and the attainment of the United Nations’ SDGs. In
this regard, our study also adds to the growing literature that examines how management research can help

37
understand and address grand societal challenges (e.g., Berrone et al. 2016, George et al. 2016a, Vakili and
McGahan 2016).
Moreover, our study examines an underexplored institutional context: Africa, and more specifically
the DRC in Sub-Saharan Africa. While most of the insights from the governance literature have been
obtained by studying organizations in developed and emerging countries, much less is known about (for-
profit and non-profit) organizations in developing countries, and especially Africa (George et al. 2016b).21
Yet, understanding how to improve the governance of these organizations—and the implications for
operating efficiency and social performance—is crucial in order to promote their development and the
attainment of the United Nations’ SDGs.
Our study calls for future research. First, our findings are specific to the healthcare sector in a low-
income country (namely, the DRC). In this regard, a fruitful avenue for future research is to examine
whether our findings have external validity across sectors and countries, including higher-income countries.
Arguably, the challenges faced by non-profit organizations in higher-income countries are similar but likely
less severe than in low-income countries. As such, the effectiveness of the governance bundle considered
in this study might differ. Future research may find it worthwhile to explore and characterize these
differences. Second, a limitation of the PDSS program is that the “governance treatment” is administered
through a bundle of governance mechanisms (i.e., social performance-based incentives combined with
A&F), and hence we cannot separate between them. Accordingly, another exciting avenue for future
research would be to “un-bundle” the governance bundle and examine how individual governance practices
contribute to non-profits’ social impact. Third, and relatedly, future research could explore the effectiveness
of other types of governance and management practices available to non-profit organizations.
Lastly—and perhaps most importantly—our findings have important implications for practice.
Every year, large amounts of funding are invested in non-profit organizations pursuing social and
21 Similarly, the operations research literature in healthcare—which studies how to optimize hospitals’ operating processes—has focused on large-scale hospitals in the U.S. and other high-income countries (Berry Jaeker and Tucker 2016, Roth, Tucker, and Venkataraman 2019, Song et al. 2018).

38
environmental causes and aiming to achieve the seventeen SDGs of the United Nations (e.g., ending
poverty, reducing hunger, promoting healthy lives and well-being, reducing inequalities, addressing climate
change, protecting life on land and below water). The insights of this study help inform non-profit
organizations, as well as their donors and impact investors, about the governance mechanisms that are
available and effective in achieving the non-profits’ objectives and maximizing the social impact of the
funds invested.
References
Adam T, Lim SS, Mehta S, Bhutta ZA, Fogstad H, Mathai M, Zupan J, Darmstadt GL (2005) Cost effectiveness analysis of strategies for maternal and neonatal health in developing countries. British Medical J. 331(7525):1107.
Aguilera R, Florackis C, Kim H (2016) Advancing the corporate governance research agenda. Corporate Governance: An International Rev. 24(3):172–180.
Amabile TM, Goldfarb P, Brackfield SC (1990) Social influences on creativity: evaluation, coaction, and surveillance. Creativity Research J. 3(1):6–21.
Ashraf N, Bandiera O, Jack BK (2014) No margin, no mission? A field experiment on incentives for public service delivery. J. Public Econom. 120(6):1–17.
Ashraf N, Bandiera O, Lee S (2014) Awards unbundled: evidence from a natural field experiment. J. Econom. Behav. Organ. 100(4):44–63.
Ballesteros L, Gatignon A (2019) The relative value of firm and nonprofit experience: tackling large-scale social issues across institutional contexts. Strategic Management J. 40(4):631–657.
Bandiera O, Larcinese V, Rasul I (2015) Blissful ignorance? A natural experiment on the effect of feedback on students’ performance. Labour Econom. 34(C):13–25.
Basinga P, Gertler PJ, Binagwaho A, Soucat AL, Sturdy J, Vermeersch CM (2011) Effect on maternal and child health services in Rwanda of payment to primary health-care providers for performance: an impact evaluation. Lancet 377(9775):1421–1428.
Battilana J, Dorado S (2010) Building sustainable hybrid organizations: the case of commercial microfinance organizations. Acad. Management J. 53(6):1419–1440.
Berrone P, Gelabert L, Massa-Saluzzo F, Rousseau HE (2016) Understanding community dynamics in the study of grand challenges: how nonprofits, institutional actors, and the community fabric interact to influence income inequality. Acad. Management J. 59(6):1940–1964.
Berry Jaeker JA, Tucker AL (2016) Past the point of speeding up: the negative effects of workload saturation on efficiency and patient severity. Management Sci. 63(4):1042–1062.
Blader S, Gartenberg C, Prat A (2020) The contingent effect of management practices. Rev. Economic Stud. 87(2):721–749.
Bloom N, Brynjolfsson E, Foster L, Jarmin R, Patnaik M, Saporta-Eksten I, Van Reenen J (2019) What drives differences in management practices? American Econom. Rev. 109(5):1648–1683.
Bloom N, Eifert B, Mahajan A, McKenzie D, Roberts J (2013) Does management matter? Evidence from India. Quart. J. Econom. 128(1):1–51.

39
Bloom N, Van Reenen J (2007) Measuring and explaining management practices across firms and countries. Quart. J. Econom. 122(4):1351–1408.
Bode C, Singh J (2018) Taking a hit to save the world? Employee participation in a corporate social initiative. Strategic Management J. 39(4):1003–1030.
Bowles S (2016) The Moral Economy: Why Good Incentives are no Substitute for Good Citizens (Yale University Press, New Haven, CT).
Bruhn M, Karlan D, Schoar A (2018) The impact of consulting services on small and medium enterprises: evidence from a randomized trial in Mexico. J. Political Economy 126(2):635–687.
Bryan KA, Tilsick A, Zhu B (2017) Which entrepreneurs are coachable and why? American Econom. Rev. 107(5):312–316.
Burbano VC (2016) Social responsibility messages and worker wage requirements: field experimental evidence from online labor marketplaces. Organ. Sci. 27(4):1010–1028.
Cabral S, Mahoney JT, McGahan AM, Potoski M (2019) Value creation and value appropriation in public and nonprofit organizations. Strategic Management J. 40(4):465–475.
Cai J, Szeidl A (2018) Interfirm relationships and business performance. Quart. J. Econom. 133(3):1229–1282.
Carnahan S, Kryscynski D, Olson D (2017) When does corporate social responsibility reduce employee turnover? Evidence from attorneys before and after 9/11. Acad. Management J. 60(5):1932–1962.
Cassar L (2019) Job mission as a substitute for monetary incentives: benefits and limits. Management Sci. 65(2):896–912.
Cassar L, Meier S (2018) Nonmonetary incentives and the implications of work as a source of meaning. J. Economic Perspectives 32(3):215–238.
Cassar L, Meier S (2021) Intentions for doing good matter for doing well: the negative effects of prosocial incentives. The Economic J. 131(637):1988–2017.
Chatain O, Plaksenkova E (2019) NGOs and the creation of value in supply chains. Strategic Management J. 40(4):604–630.
Chatterji A, Delecourt S, Hasan S, Koning R (2019) When does advice impact startup performance? Strategic Management J. 40(3):331–356.
Cobb JA, Wry T, Zhao EY (2016) Funding financial inclusion: institutional logics and the contextual contingency of funding for microfinance organizations. Acad. Management J. 59(6):2103–2131.
De Mel S, McKenzie D, Woodruff C (2014) Business training and female enterprise start-up, growth, and dynamics: experimental evidence from Sri Lanka. J. Development Econom. 106(C):199–210.
Dimitriadis S, Koning R (2020) Social skills improve business performance: evidence from a randomized control trial with entrepreneurs in Togo. Working paper, University of Toronto and Harvard Business School.
Dur R, Non A, Roelfsema H (2010) Reciprocity and incentive pay in the workplace. J. Economic Psychology 31(4):676–686.
Durand R, Huysentruyt M (2021) Performance of corporate social initiatives: evidence from a field experiment in France. Working paper, HEC Paris.
Eccles RG, Ioannou I, Serafeim G (2014) The impact of corporate sustainability on organizational processes and performance. Management Sci. 60(11):2835–2857.
Flammer C (2015) Does corporate social responsibility lead to superior financial performance? A regression discontinuity approach. Management Sci. 61(11):2549–2568.

40
Flammer C, Hong B, Minor DB (2019) Corporate governance and the rise of integrating corporate social responsibility criteria in executive compensation: effectiveness and implications for firm outcomes. Strategic Management J. 40(7):1097–1122.
Flammer C, Luo J (2017) Corporate social responsibility as an employee governance tool: evidence from a quasi-experiment. Strategic Management J. 38(2):163–183.
Gallus J, Frey BS (2016) Awards: a strategic management perspective. Strategic Management J. 37(8):1699–1714.
George G, Howard-Grenville J, Joshi A, Tihanyi L (2016a) Understanding and tackling societal grand challenges through management research. Acad. Management J. 59(6):1880–1895.
George G, Corbishley C, Khayesi JN, Haas MR, Tihanyi L (2016b). Bringing Africa in: promising directions for management research. Acad. Management J. 59(2):377–393.
Giorcelli M (2019) The long-term effects of management and technology transfers. American Econom. Rev. 109(1):121–152.
Gubler T, Larkin I, Pierce L (2016) Motivational spillovers from awards: crowding out in a multitasking environment. Organ. Sci. 27(2):286–303.
Gubler T, Larkin I, Pierce L (2017) Doing well by making well: the impact of corporate wellness programs on employee productivity. Management Sci. 64(11):4967–4987.
Hansmann HB (1980) The role of nonprofit enterprise. Yale Law J. 89(5):835–901. Hollowell J, Oakley L, Kurinczuk JJ, Brocklehurst P, Gray R (2011) The effectiveness of antenatal care
programmes to reduce infant mortality and preterm birth in socially disadvantaged and vulnerable women in high-income countries: a systematic review. BMC Pregnancy and Childbirth 11(1):13.
Holmstrom B, Milgrom P (1991) Multitask principal-agent analyses: incentive contracts, asset ownership, and job design. J. Law Econom. Organ. 7:24–52.
Huillery E, Seban J (2019) Financial incentives, efforts, and performances in the health sector: experimental evidence from the Democratic Republic of Congo. Econom. Development and Cultural Change, forthcoming.
Jay J (2013) Navigating paradox as a mechanism of change and innovation in hybrid organizations. Acad. Management J. 56(1):137–159.
Kellogg KC (2009) Operating room: relational spaces and micro-institutional change in surgery. American J. of Sociology 115(3):657–711.
King AA, Lenox MJ (2001) Does it really pay to be green? An empirical study of firm environmental and financial performance. J. Industrial Ecology 5(1):105–116.
Linden LL, Shastry GK (2012) Grain inflation: identifying agent discretion in response to a conditional school nutrition program. J. Development Econom. 99(1):128–138.
Mair J, Marti I, Ventresca MJ (2012) Building inclusive markets in rural Bangladesh: how intermediaries work institutional voids. Acad. Management J. 55(4):819–850.
Mayaka MS, Muvudi Lushimba M, Bertone MP, de Borman N (2011) Le financement basé sur la performance en République Démocratique du Congo: comparaison de deux expériences pilotes. PBF CoP Working Paper WP6 (Performance-based Financing Community of Practice, Antwerp, Belgium).
McKenzie D (2021) Small business training to improve management practices in developing countries: reassessing the evidence for “training doesn’t work.” Oxford Rev. Econom. Policy 37(2):276–301.
McKenzie D, Woodruff C (2014) What are we learning from business training evaluations around the

41
developing world? World Bank Research Observer 29(1):48–82. McKenzie D, Woodruff C (2017) Business practices in small firms in developing countries. Management
Sci. 63(9):2967–2981. Pache AC, Santos F (2013) Inside the hybrid organization: selective coupling as a response to competing
institutional logics. Acad. Management J. 56(4):972–1001. PDSS (2016) Manuel Opérationnel du Financement Basé sur la Performance (Ministry of Health,
Democratic Republic of Congo). Quélin BV, Kivleniece I, Lazzarini S (2017) Public-private collaboration, hybridity and social value:
towards new theoretical perspectives. J. Management Stud. 54(6):763–792. Roth A, Tucker AL, Venkataraman S (2019) Being on the productivity frontier: identifying “triple aim
performance” hospitals. Production and Operations Management 28(9):2165–2183. Rousseau HE, Berrone P, Gelabert L (2019) Localizing sustainable development goals: nonprofit density
and city sustainability. Acad. Management Discoveries 5(4):487–513. Salamon LM, Newhouse CL (2020) The 2020 nonprofit employment report. Nonprofit Economic Data
Bulletin 48 (Johns Hopkins Center for Civil Society Studies, Baltimore, MD). Smither JW, London M, Reilly RR (2005) Does performance improve following multisource feedback? A
theoretical model, meta-analysis, and review of empirical findings. Personnel Psych. 58(1):33–66. Song H, Tucker AL, Murrel KL, Vinson DR (2018) Closing the productivity gap: improving worker
productivity through public relative performance feedback and validation of best practices. Management Sci. 64(6):2628–2649.
UNICEF (2016) Maternal and Newborn Health Disparities: Democratic Republic of the Congo (UNICEF, New York, NY).
United Nations (2018a) Satellite Account on Non-profit and Related Institutions and Volunteer Work (The United Nations, New York, NY).
United Nations (2018b) Levels & Trends in Child Mortality (The United Nations Inter-Agency Group for Child Mortality Estimation, New York, NY).
Vakili K, McGahan AM (2016) Health care’s grand challenge: stimulating basic science on diseases that primarily afflict the poor. Acad. Management J. 59(6):1917–1939.
Viscusi WK, Masterman CJ (2017) Income elasticities and global values of a statistical life. J. Benefit-Cost Anal. 8(2):226–250.
WHO (2015) Democratic Republic of the Congo: Improving Aid Coordination in the Health Sector (World Health Organization, Geneva).
WHO (2016) Achieving the Health-Related MDGs. It Takes a Workforce! (World Health Organization, Geneva).
WHO (2018) Children: Reducing Mortality (World Health Organization, Geneva). WHO (2019a) Stillbirths (World Health Organization, Geneva). WHO (2019b) Neonatal Mortality (World Health Organization, Geneva). World Bank (2018) Health System Strengthening for Better Maternal and Child Health Results Project
(World Bank, Washington, DC). Wrzesniewski A, Schwartz B, Cong X, Kane M, Omar A, Kolditz T (2014) Multiple types of motives don’t
multiply the motivation of West Point cadets. Proceedings of the National Acad. of Sciences 111(30):10990–10995.

42
Figure 1. Examples of health centers
Source: Bluesquare.

43
Figure 2. Dynamics
A. Primary healthcare services per employee
Treatment vs. control, relative to Q4 2016 (t = –1), with 90% CI
B. Employees
Treatment vs. control, relative to Q4 2016 (t = –1), with 90% CI
C. Doctors
Treatment vs. control, relative to Q4 2016 (t = –1), with 90% CI
D. Nurses
Treatment vs. control, relative to Q4 2016 (t = –1), with 90% CI
E. Administrative employees
Treatment vs. control, relative to Q4 2016 (t = –1), with 90% CI
F. Primary healthcare services
Treatment vs. control, relative to Q4 2016 (t = –1), with 90% CI
-100
-50
0
50
100
150
200
-4 -3 -2 -1 0 1 2 3 4 5 6 7 8 9-0.2
-0.1
0
0.1
0.2
-4 -3 -2 -1 0 1 2 3 4 5 6 7 8 9
-0.1
-0.05
0
0.05
0.1
-4 -3 -2 -1 0 1 2 3 4 5 6 7 8 9-0.3
-0.2
-0.1
0
0.1
0.2
0.3
-4 -3 -2 -1 0 1 2 3 4 5 6 7 8 9
-0.3
-0.2
-0.1
0
0.1
0.2
-4 -3 -2 -1 0 1 2 3 4 5 6 7 8 9-0.5
-0.25
0
0.25
0.5
0.75
1
-4 -3 -2 -1 0 1 2 3 4 5 6 7 8 9
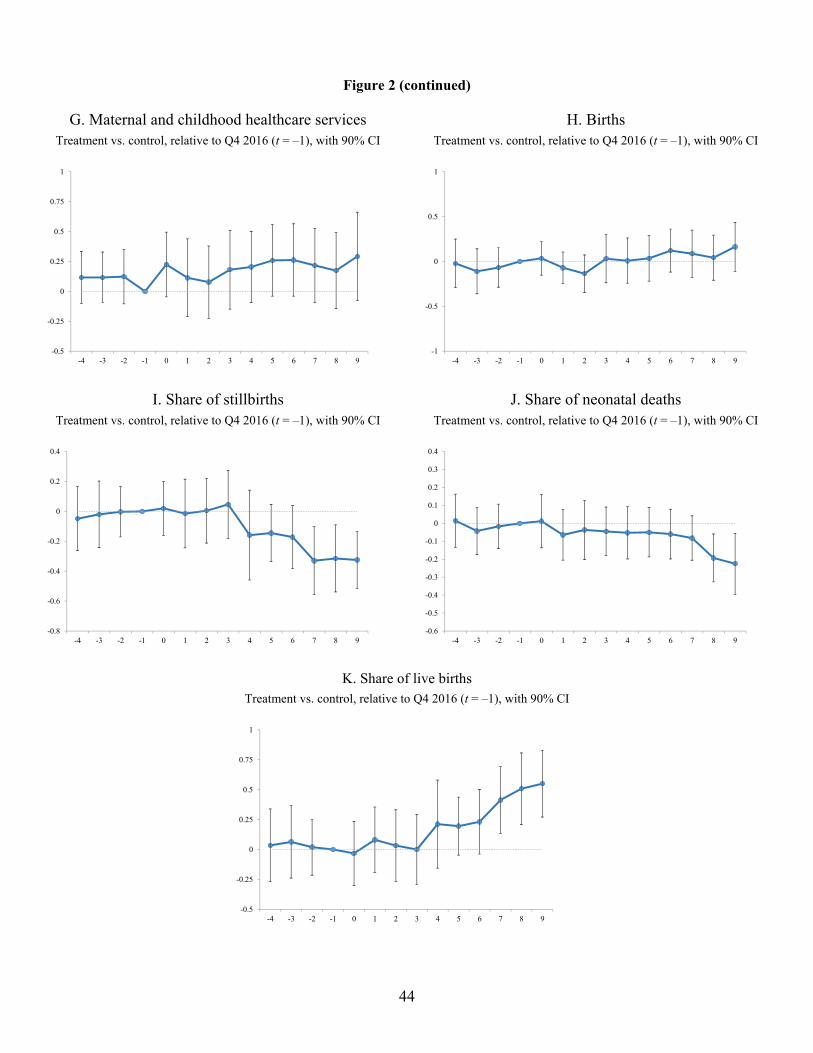
44
Figure 2 (continued)
G. Maternal and childhood healthcare services
Treatment vs. control, relative to Q4 2016 (t = –1), with 90% CI
H. Births
Treatment vs. control, relative to Q4 2016 (t = –1), with 90% CI
I. Share of stillbirths
Treatment vs. control, relative to Q4 2016 (t = –1), with 90% CI
J. Share of neonatal deaths
Treatment vs. control, relative to Q4 2016 (t = –1), with 90% CI
K. Share of live births
Treatment vs. control, relative to Q4 2016 (t = –1), with 90% CI
-0.5
-0.25
0
0.25
0.5
0.75
1
-4 -3 -2 -1 0 1 2 3 4 5 6 7 8 9-1
-0.5
0
0.5
1
-4 -3 -2 -1 0 1 2 3 4 5 6 7 8 9
-0.8
-0.6
-0.4
-0.2
0
0.2
0.4
-4 -3 -2 -1 0 1 2 3 4 5 6 7 8 9-0.6
-0.5
-0.4
-0.3
-0.2
-0.1
0
0.1
0.2
0.3
0.4
-4 -3 -2 -1 0 1 2 3 4 5 6 7 8 9
-0.5
-0.25
0
0.25
0.5
0.75
1
-4 -3 -2 -1 0 1 2 3 4 5 6 7 8 9

45
Table 1. Summary statistics
Obs. Mean Median Std. Dev.
Panel A. Health centers statistics
Primary healthcare services per employee 999 235.76 184.88 214.01
Employees 999 7.13 6 6.30
Doctors 999 0.06 0 0.31
Nurses 999 3.55 3 3.70
Administrative 999 3.53 3 3.37
Primary healthcare services 999 1,611 1,344 1,195
Maternal and childhood healthcare services 999 957 705 940
Births 999 53.80 45 39.46
Stillbirths (in %) 999 0.70 0 1.51
Neonatal deaths (in %) 999 0.17 0 0.68
Live births (in %) 999 99.12 100 1.76
Panel B. Population statistics
Population in center’s health area 999 11,135 9,508 7,734
Population in center’s health district 999 204,409 181,565 80,683

46
Table 2. Randomization tests
Notes. All variables are recorded in the quarter preceding the PDSS intervention (that is, Q4 2016). The penultimate column reports the p-value of the difference-in-means test comparing treated and control health centers. The last column reports the p-value of the Kolmogorov-Smirnov (KS) test of identical distributions comparing treated and control health centers. *, **, and *** denotes significance at the 10%, 5%, and 1% level, respectively.
Obs. Mean Median Std. Dev. p -value p -value
(diff. means) (KS test)
Panel A. Health centers statistics
Primary healthcare services per employee Treated 674 238.53 176.62 231.07 0.780 0.156
Control 325 230.02 200.29 173.55
Employees Treated 674 7.43 6 7.21 0.196 0.140
Control 325 6.50 6 3.67
Doctors Treated 674 0.06 0 0.33 0.457 0.885
Control 325 0.04 0 0.25
Nurses Treated 674 3.79 3 4.26 0.135 0.675
Control 325 3.05 3 2.03
Administrative Treated 674 3.58 3 3.66 0.710 0.453
Control 325 3.42 3 2.68
Primary healthcare services Treated 674 1,660 1,361 1,273 0.351 0.213
Control 325 1,508 1,338 1,009
Maternal and childhood healthcare services Treated 674 988 710 1,010 0.494 0.729
Control 325 892 684 770
Births Treated 674 55.71 45 41.42 0.348 0.342
Control 325 49.84 45 34.78
Stillbirths (in %) Treated 674 0.73 0 1.53 0.500 0.871
Control 325 0.64 0 1.45
Neonatal deaths (in %) Treated 674 0.18 0 0.68 0.981 0.980
Control 325 0.17 0 0.68
Live births (in %) Treated 674 99.09 100 1.772 0.584 0.863
Control 325 99.18 100 1.749
Panel B. Population statistics
Population in center’s health area Treated 674 11,090 9,491 6,377 0.896 0.776
Control 325 11,227 9,847 9,988
Population in center’s health district Treated 674 201,829 181,565 73,925 0.716 0.458
Control 325 209,760 177,275 93,047

47
Table 3. The impact of the governance treatment on health center outcomes
Notes. For each dependent variable we compute the change between t – 1 (the quarter preceding the intervention, Q4 2016) and t + 9 (nine quarters after the intervention, Q2 2019). When the dependent variable is a ratio—i.e., in columns (1) and (9)-(11)—Δy represents the difference in y from t – 1 to t + 9. When the dependent variable is a level—i.e., in columns (2)-(8)—%Δy represents the percentage change in y from t – 1 to t + 9. In column (1), the units are in number of primary healthcare services per employee; in columns (9)-(11), the units are in percentage points. Standard errors (reported in parentheses) are clustered at the health district level. *, **, and *** denotes significance at the 10%, 5%, and 1% level, respectively.
Health center
operating
efficiency
Δ Primary %Δ Emp. %Δ Doctors %Δ Nurses %Δ Admin. %Δ Primary %Δ Maternal %Δ Births Δ Share of Δ Share of Δ Share of
healthcare employees healthcare and childhood stillbirths neonatal live births
services per services healthcare deaths
employee services
(1) (2) (3) (4) (5) (6) (7) (8) (9) (10) (11)
Treatment 101.351*** -0.060 0.005 0.002 -0.096* 0.270 0.292 0.163 -0.325*** -0.225** 0.550***
(24.855) (0.047) (0.010) (0.071) (0.055) (0.221) (0.224) (0.165) (0.115) (0.103) (0.169)
Province fixed effects Yes Yes Yes Yes Yes Yes Yes Yes Yes Yes Yes
R-squared 0.334 0.070 0.012 0.057 0.036 0.203 0.172 0.125 0.017 0.013 0.019
Observations 999 999 999 999 999 999 999 999 999 999 999
Health center employees Volume of healthcare services Quality of healthcare services

48
Table 4. Dynamics
Notes. This table presents variants of the regressions in Table 3, in which different time intervals (from t – 4 until t + 9) are used to compute changes in the dependent variables relative to t – 1. Standard errors are clustered at the health district level. *, **, and *** denotes significance at the 10%, 5%, and 1% level, respectively.
Health center
operating
efficiency
Δ Primary %Δ Emp. %Δ Doctors %Δ Nurses %Δ Admin. %Δ Primary %Δ Maternal %Δ Births Δ Share of Δ Share of Δ Share of
healthcare employees healthcare and childhood stillbirths neonatal live births
services per services healthcare deaths
employee services
(1) (2) (3) (4) (5) (6) (7) (8) (9) (10) (11)
Treatment (Δ t -4, t -1) -9.666 0.027 0.011 0.005 -0.018 0.164 0.117 -0.022 -0.049 0.014 0.035
(16.975) (0.018) (0.010) (0.030) (0.054) (0.147) (0.131) (0.164) (0.130) (0.090) (0.184)
Treatment (Δ t -3, t -1) 1.726 0.011 0.005 0.025 -0.046 0.139 0.117 -0.110 -0.020 -0.043 0.063
(15.338) (0.017) (0.010) (0.023) (0.046) (0.183) (0.128) (0.152) (0.135) (0.079) (0.183)
Treatment (Δ t -2, t -1) -13.905 0.011 0.007 0.030 -0.041 0.024 0.123 -0.068 -0.003 -0.017 0.019
(15.326) (0.016) (0.009) (0.023) (0.044) (0.135) (0.138) (0.133) (0.102) (0.075) (0.142)
Treatment (Δ t -1, t ) 8.833 -0.004 -0.008 0.009 -0.023 0.136 0.224 0.035 0.020 0.012 -0.032
(12.354) (0.020) (0.011) (0.023) (0.037) (0.098) (0.164) (0.114) (0.109) (0.090) (0.162)
Treatment (Δ t -1, t +1) 15.267 -0.014 0.005 0.013 -0.035 0.042 0.113 -0.070 -0.015 -0.065 0.081
(16.172) (0.030) (0.006) (0.042) (0.030) (0.143) (0.197) (0.106) (0.139) (0.085) (0.166)
Treatment (Δ t -1, t +2) 14.142 -0.033 0.006 0.005 -0.043 0.024 0.077 -0.136 0.004 -0.037 0.033
(17.572) (0.029) (0.008) (0.041) (0.030) (0.135) (0.183) (0.126) (0.131) (0.100) (0.181)
Treatment (Δ t -1, t +3) 17.192 -0.005 0.006 0.041 -0.035 0.139 0.181 0.030 0.046 -0.045 -0.000
(19.290) (0.037) (0.008) (0.055) (0.033) (0.183) (0.200) (0.163) (0.137) (0.082) (0.176)
Treatment (Δ t -1, t +4) 37.163* -0.018 -0.002 0.042 -0.066* 0.164 0.204 0.007 -0.159 -0.053 0.212
(20.933) (0.036) (0.010) (0.062) (0.037) (0.147) (0.180) (0.154) (0.182) (0.088) (0.223)
Treatment (Δ t -1, t +5) 42.791* 0.008 0.004 0.103 -0.069* 0.215 0.258 0.035 -0.145 -0.050 0.195
(23.566) (0.043) (0.008) (0.063) (0.041) (0.159) (0.181) (0.154) (0.116) (0.083) (0.147)
Treatment (Δ t -1, t +6) 78.975*** -0.022 -0.013 0.060 -0.071* 0.256 0.262 0.121 -0.172 -0.060 0.232
(23.841) (0.036) (0.010) (0.049) (0.041) (0.156) (0.183) (0.145) (0.128) (0.084) (0.164)
Treatment (Δ t -1, t +7) 57.070** -0.020 -0.012 0.082 -0.087* 0.167 0.216 0.086 -0.330** -0.082 0.413**
(24.665) (0.045) (0.010) (0.059) (0.046) (0.166) (0.189) (0.159) (0.138) (0.075) (0.169)
Treatment (Δ t -1, t +8) 92.801*** -0.036 -0.003 0.053 -0.109** 0.136 0.174 0.042 -0.315** -0.193** 0.508***
(31.394) (0.044) (0.010) (0.062) (0.052) (0.174) (0.192) (0.152) (0.136) (0.081) (0.181)
Treatment (Δ t -1, t +9) 101.351*** -0.060 0.005 0.002 -0.096* 0.270 0.292 0.163 -0.325*** -0.225** 0.550***
(24.855) (0.047) (0.010) (0.071) (0.055) (0.221) (0.224) (0.165) (0.115) (0.103) (0.169)
Health center employees Volume of healthcare services Quality of healthcare services
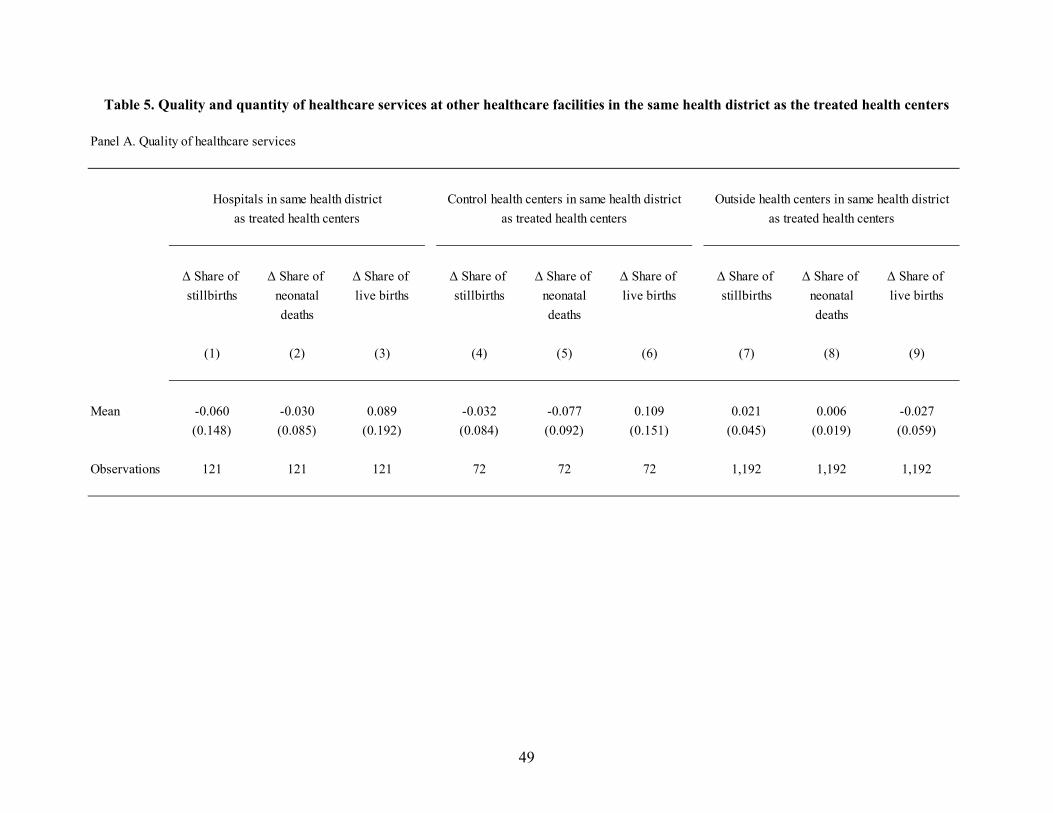
49
Table 5. Quality and quantity of healthcare services at other healthcare facilities in the same health district as the treated health centers
Panel A. Quality of healthcare services
as treated health centers as treated health centers as treated health centers
Δ Share of Δ Share of Δ Share of Δ Share of Δ Share of Δ Share of Δ Share of Δ Share of Δ Share of
stillbirths neonatal live births stillbirths neonatal live births stillbirths neonatal live births
deaths deaths deaths
(1) (2) (3) (4) (5) (6) (7) (8) (9)
Mean -0.060 -0.030 0.089 -0.032 -0.077 0.109 0.021 0.006 -0.027
(0.148) (0.085) (0.192) (0.084) (0.092) (0.151) (0.045) (0.019) (0.059)
Observations 121 121 121 72 72 72 1,192 1,192 1,192
Hospitals in same health district Control health centers in same health district Outside health centers in same health district

50
Table 5 (continued)
Notes. This table reports the mean of the dependent variable Δyt‒1,t+9 across healthcare facilities (hospitals in columns (1)-(3), control health centers in columns (4)-(6), and health centers outside the PDSS program in columns (7)-(9)) that are located within the same health district as the treated health centers. Standard errors are clustered at the health district level. *, **, and *** denotes significance at the 10%, 5%, and 1% level, respectively.
Panel B. Volume of healthcare services
as treated health centers as treated health centers as treated health centers
%Δ Primary %Δ Maternal %Δ Births %Δ Primary %Δ Maternal %Δ Births %Δ Primary %Δ Maternal %Δ Births
healthcare and childhood healthcare and childhood healthcare and childhood
services healthcare services healthcare services healthcare
services services services
(1) (2) (3) (4) (5) (6) (7) (8) (9)
Mean 0.100 0.067 0.146 -0.083 0.042 0.140 0.127 0.108 0.117
(0.276) (0.283) (0.191) (0.121) (0.272) (0.231) (0.188) (0.169) (0.079)
Observations 121 121 121 72 72 72 1,192 1,192 1,192
Hospitals in same health district Control health centers in same health district Outside health centers in same health district

51
Table 6. Cross-sectional heterogeneity
Notes. This table presents variants of the regressions in Table 3, interacting treatment with various characteristics measured prior to the PDSS intervention. For ease of interpretation, all interacted characteristics are standardized. All regressions also include the interacted variables as standalone controls. Standard errors are clustered at the health district level. *, **, and *** denotes significance at the 10%, 5%, and 1% level, respectively.
Health center
operating
efficiency
Δ Primary %Δ Emp. %Δ Doctors %Δ Nurses %Δ Admin. %Δ Primary %Δ Maternal %Δ Births Δ Share of Δ Share of Δ Share of
healthcare employees healthcare and childhood stillbirths neonatal live births
services per services healthcare deaths
employee services
(1) (2) (3) (4) (5) (6) (7) (8) (9) (10) (11)
Treatment 107.947*** -0.053 0.005 0.006 -0.091* 0.296 0.320 0.159 -0.295** -0.195* 0.489***
(25.673) (0.042) (0.009) (0.068) (0.054) (0.200) (0.209) (0.146) (0.115) (0.103) (0.172)
Treatment × Density of health centers -26.072** 0.016 -0.004 0.004 0.025 -0.031 -0.150 -0.041 0.073 0.244** -0.317**
(13.303) (0.020) (0.005) (0.041) (0.020) (0.118) (0.148) (0.069) (0.067) (0.104) (0.142)
Treatment × Infant mortality 6.156 -0.004 -0.002 -0.001 -0.001 0.037 0.014 -0.043 -0.126 -0.103** 0.229*
(5.758) (0.009) (0.005) (0.016) (0.011) (0.029) (0.027) (0.029) (0.093) (0.050) (0.137)
Treatment × Size -16.859 -0.049 0.015 -0.032 -0.056 0.034 -0.002 -0.008 0.039 -0.072 0.032
(15.777) (0.052) (0.013) (0.073) (0.045) (0.183) (0.197) (0.095) (0.106) (0.103) (0.174)
Treatment × Operating efficiency -31.100* 0.005 0.003 -0.063 0.023 -0.159 -0.197 0.038 -0.003 0.041 -0.038
(17.931) (0.025) (0.008) (0.049) (0.029) (0.112) (0.124) (0.064) (0.060) (0.039) (0.078)
Province fixed effects Yes Yes Yes Yes Yes Yes Yes Yes Yes Yes Yes
Controls Yes Yes Yes Yes Yes Yes Yes Yes Yes Yes Yes
R-squared 0.369 0.193 0.016 0.155 0.074 0.384 0.334 0.221 0.024 0.056 0.040
Observations 999 999 999 999 999 999 999 999 999 999 999
Health center employees Volume of healthcare services Quality of healthcare services

52
Table 7. Funding vs. governance
Panel A. Treatment group vs. outside group
Health center
operating
efficiency
Δ Primary %Δ Emp. %Δ Doctors %Δ Nurses %Δ Admin. %Δ Primary %Δ Maternal %Δ Births Δ Share of Δ Share of Δ Share of
healthcare employees healthcare and childhood stillbirths neonatal live births
services per services healthcare deaths
employee services
(1) (2) (3) (4) (5) (6) (7) (8) (9) (10) (11)
Treatment vs. outside 86.233*** 0.137*** -0.010 0.224*** 0.031 0.897*** 0.924*** 0.691*** -0.247* -0.215** 0.462**
(18.102) (0.041) (0.010) (0.063) (0.038) (0.264) (0.260) (0.149) (0.105) (0.084) (0.187)
Province fixed effects Yes Yes Yes Yes Yes Yes Yes Yes Yes Yes Yes
R-squared 0.315 0.130 0.025 0.109 0.049 0.164 0.137 0.160 0.019 0.024 0.022
Observations 1,348 1,348 1,348 1,348 1,348 1,348 1,348 1,348 1,348 1,348 1,348
Health center employees Volume of healthcare services Quality of healthcare services

53
Table 7 (continued)
Notes. This table presents variants of the regressions in Table 3, except that the treatment group is compared to the outside group in Panel A, and the control group is compared to the outside group in Panel B. Health centers from the outside group are matched to health centers in the treatment and control groups, respectively, using the nearest-neighbor matching described in Section 6. Standard errors (reported in parentheses) are clustered at the health district level. *, **, and *** denotes significance at the 10%, 5%, and 1% level, respectively.
Panel B. Control group vs. outside group
Health center
operating
efficiency
Δ Primary %Δ Emp. %Δ Doctors %Δ Nurses %Δ Admin. %Δ Primary %Δ Maternal %Δ Births Δ Share of Δ Share of Δ Share of
healthcare employees healthcare and childhood stillbirths neonatal live births
services per services healthcare deaths
employee services
(1) (2) (3) (4) (5) (6) (7) (8) (9) (10) (11)
Control vs. outside 19.831 0.130*** -0.001 0.162** 0.085* 0.524** 0.574** 0.386* 0.073 0.176 -0.250
(23.906) (0.038) (0.009) (0.064) (0.047) (0.211) (0.278) (0.224) (0.174) (0.160) (0.273)
Province fixed effects Yes Yes Yes Yes Yes Yes Yes Yes Yes Yes Yes
R-squared 0.210 0.125 0.019 0.095 0.078 0.373 0.252 0.210 0.089 0.020 0.078
Observations 650 650 650 650 650 650 650 650 650 650 650
Health center employees Volume of healthcare services Quality of healthcare services

54
Appendix
Appendix A. Structure of the DRC’s health system
This appendix provides a brief description of the structure of the DRC’s health system.22 The health system
of the DRC is organized in three levels (central, provincial, and operational):
At the central level (also referred to as “national level”), the Ministry of Health develops health
policies and health standards. It plays a normative role, regulating and supporting the provincial
health divisions.
At the provincial level (also referred to as “intermediate level”), each province has a provincial
ministry of health with its own provincial health division. Provincial health divisions are mainly
responsible for the technical supervision and logistic support of health districts (at the operational
level). They also manage the provincial hospital as well as other provincial health structures.
At the operational level, the DRC is divided into 516 health districts (also called “health zones”) that
cover a population of roughly 100,000 to 200,000. Each health district is administered by a health
district management team (“équipe cadre de la zone”) that manages a network of health centers and
the district hospital. Health districts are further divided into 8,504 health areas. Each health area
contains approximately one health center.
Appendix B. Robustness
In this appendix, we describe several robustness checks that are variants of the baseline specifications
presented in Table 3.
Specifications without province fixed effects. In Table A3, we re-estimate our baseline regressions
without including province fixed effects, that is, without enforcing within-province comparisons of treated
vs. control health centers. Due to the randomization, our point estimates should not be affected by the
22 For a more detailed description, see WHO (2015).

55
inclusion of fixed effects. As can be seen, we indeed find that our results are very similar without including
province fixed effects.
Specifications without clustered standard errors. In Table A4, we re-estimate our baseline
regressions without clustering standard errors. As is shown, the statistical significance of our estimates is
stronger without clustering.
Weighted least squares. In Table A5, we re-estimate the regressions from columns (9)-(11) of Table
3—that is, the regressions pertaining to the number of stillbirths, the number of neonatal deaths, and the
number of live births, respectively—using weighted least squares (WLS), weighting observations by the
number of births. Doing so accounts for the fact that ratios of births are more accurately measured when
the number of births is higher. As can be seen, we find that our results are slightly stronger when estimated
by WLS.

56
Figure A1. Infant mortality rate
Notes. Infant mortality rate is measured by the number of deaths of infants under one-year old per 1,000 births alive. Source: United Nations Inter-Agency Group for Child Mortality Estimation (https://childmortality.org/data).

57
Figure A2. Location of treated and control health centers
Notes. This figure plots the location of the health centers in the control group (blue markers) and treatment group (green markers), for the health centers in our sample that have non-missing geo-codes (73% of the sample). The map was generated using the online mapping software Maptive.
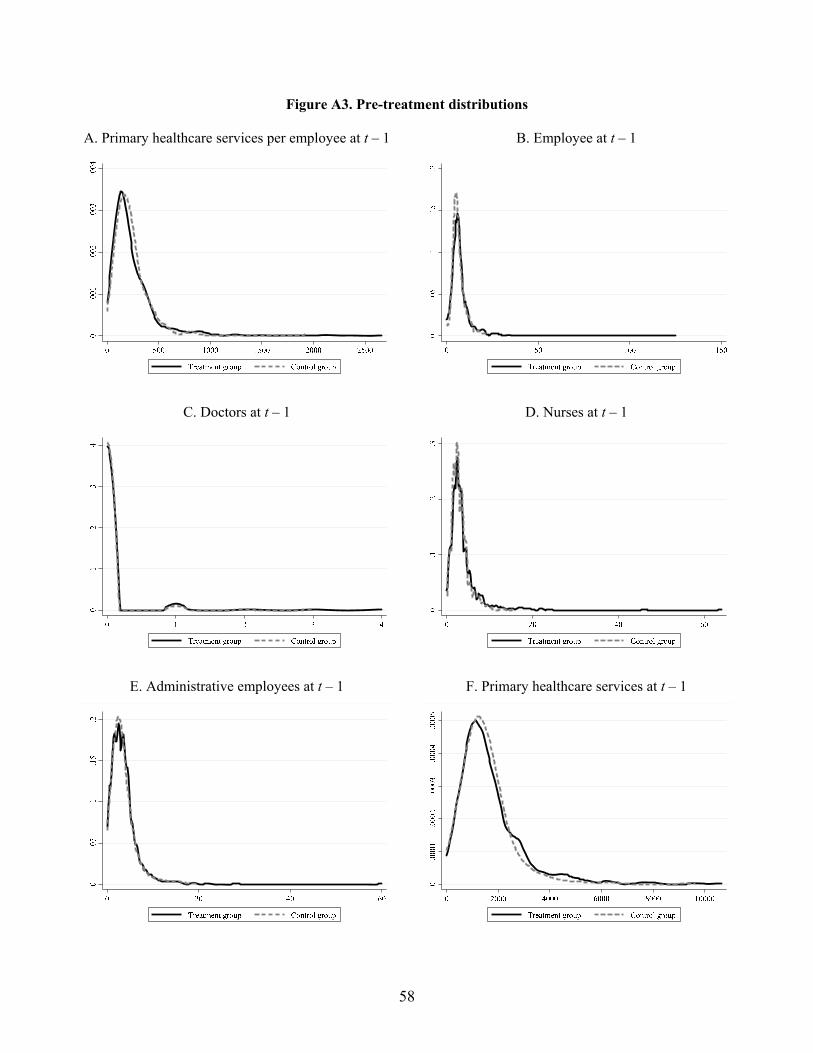
58
Figure A3. Pre-treatment distributions
A. Primary healthcare services per employee at t – 1
B. Employee at t – 1
C. Doctors at t – 1
D. Nurses at t – 1
E. Administrative employees at t – 1
F. Primary healthcare services at t – 1
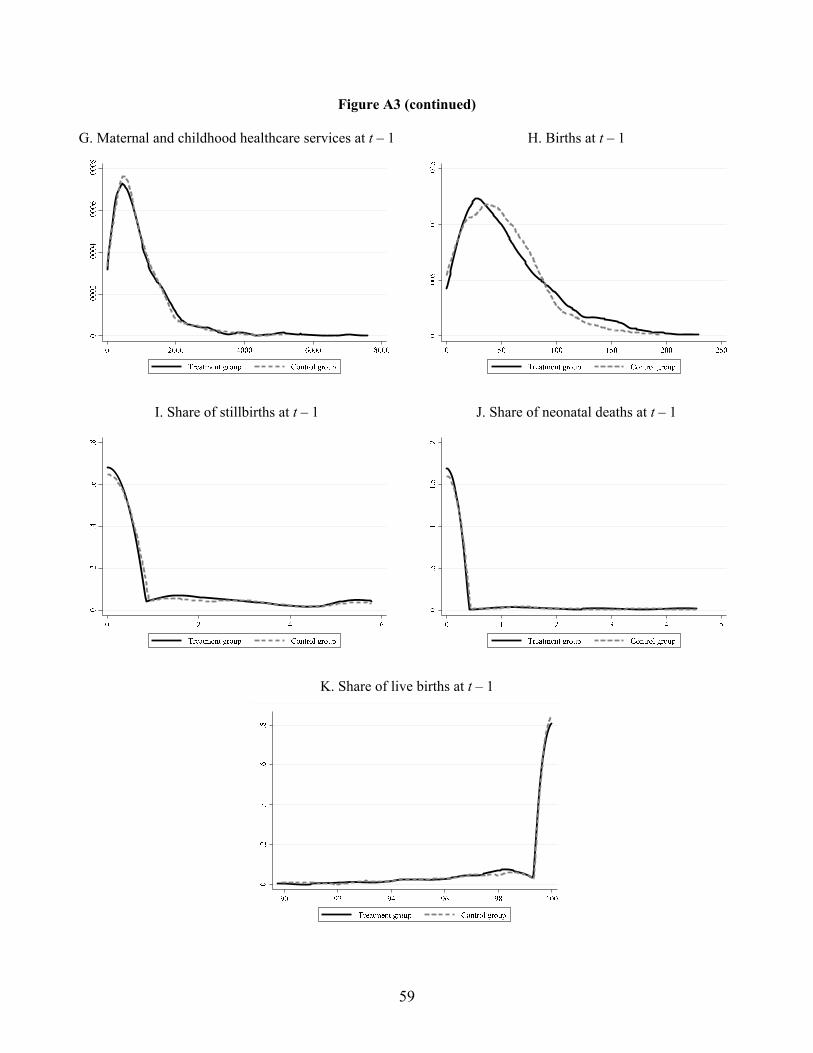
59
Figure A3 (continued)
G. Maternal and childhood healthcare services at t – 1
H. Births at t – 1
I. Share of stillbirths at t – 1
J. Share of neonatal deaths at t – 1
K. Share of live births at t – 1
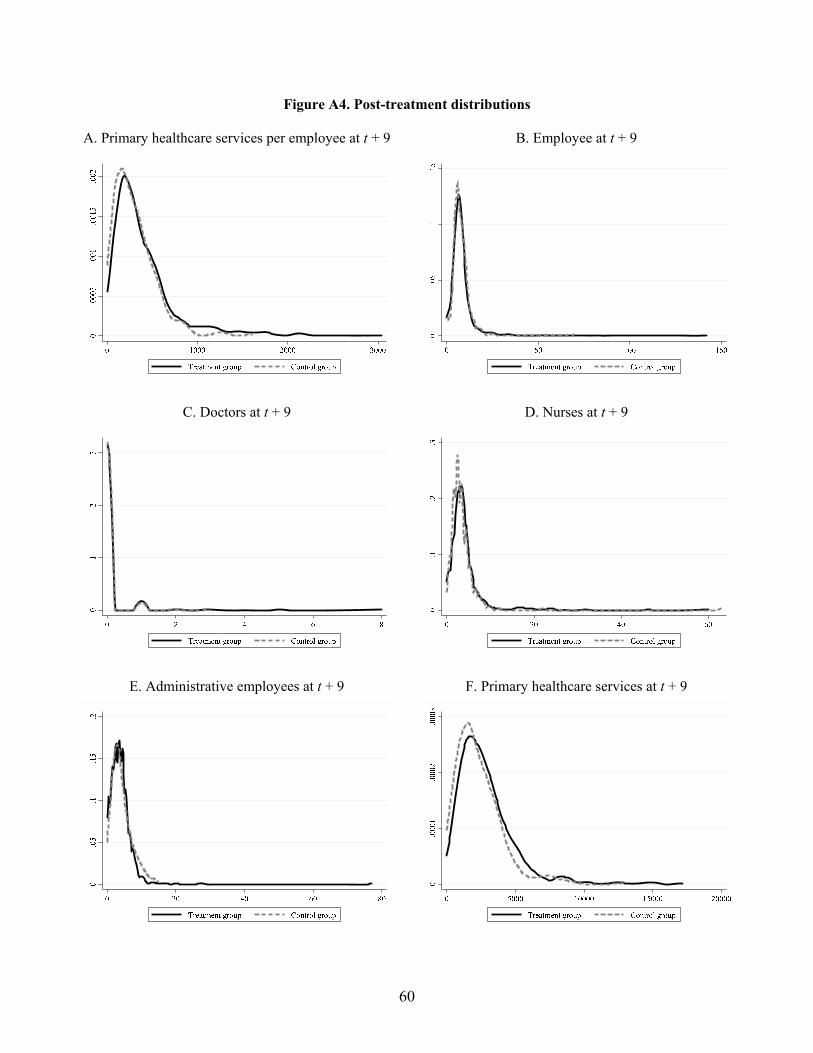
60
Figure A4. Post-treatment distributions
A. Primary healthcare services per employee at t + 9
B. Employee at t + 9
C. Doctors at t + 9
D. Nurses at t + 9
E. Administrative employees at t + 9
F. Primary healthcare services at t + 9
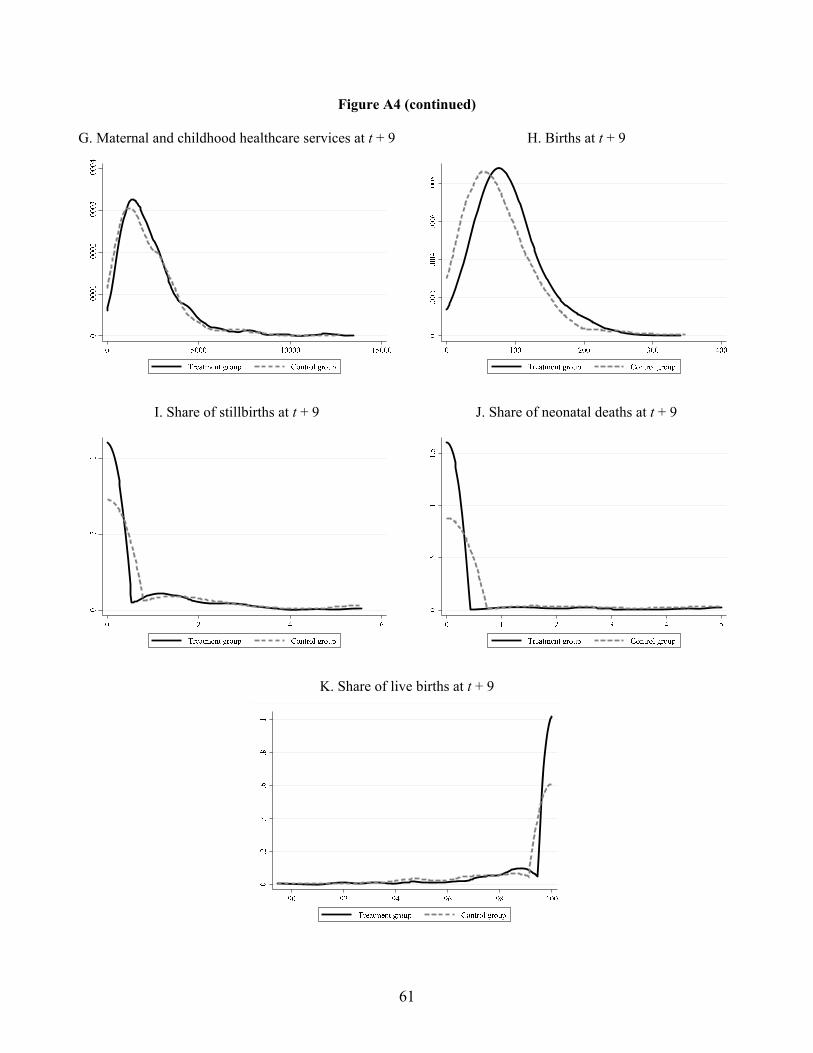
61
Figure A4 (continued)
G. Maternal and childhood healthcare services at t + 9
H. Births at t + 9
I. Share of stillbirths at t + 9
J. Share of neonatal deaths at t + 9
K. Share of live births at t + 9

62
Table A1. Output indicators
Source: PDSS (2016, pp. 60-61).
1 Number of new curative care visits
2 Number of new curative care visits (vulnerable groups)
3 Number of minor surgeries
4 Number of severe cases referred to hospitals
5 Number of children immunized
6 Number of women receiving at least two doses of tetanus toxoid vaccine during prenatal care
7 Number of women receiving three doses of sulfadoxine-pyrimethamine during prenatal care
8 Number of first prenatal care visits
9 Number of fourth prenatal care visits
10 Number of second and third postnatal care visits
11 Number of assisted deliveries
12 Number of first-time family planning visits pertaining to short-acting contraceptive methods (injectable or oral)
13 Number of first-time family planning visits pertaining to long-term contraceptive methods (IUD or implants)
14 Number of growth-monitoring visits for children aged between 6 and 23 months (preventive care)
15 Number of growth-monitoring visits for children aged between 24 and 59 months (preventive care)
16 Number of home visits
17 Number of voluntary HIV counseling and testing visits
18 Number of HIV+ pregant women receiving antiretroviral therapy
19 Number of HIV+ newborns receiving antiretroviral therapy
20 Number of HIV+ patients receiving antiretroviral therapy
21 Number of patients tested for pulmonary tuberculosis
22 Number of patients cured from pulmonary tuberculosis

63
Table A2. Weights for the quality score
Source: PDSS (2016, p. 92).
Maximum Weight
quality score
1 Overall organization 31 7.8%
2 Management plan 9 2.3%
3 Finance 15 3.8%
4 Indigent committee 20 5.0%
5 Hygiene and sterilization 31 7.8%
6 External consultations 128 32.0%
7 Family planning 32 8.0%
8 Laboratory 17 4.3%
9 Screening services 6 1.5%
10 Drugs and consumables 25 6.3%
11 Tracer drugs 17 4.3%
12 Maternity care 24 6.0%
13 Vaccination 20 5.0%
14 Pre-natal care 12 3.0%
15 HIV and tuberculosis care 13 3.3%
Total 400 100.0%

64
Table A3. Robustness—specifications without fixed effects
Notes. This table reports variants of the regressions in Table 3, but without including province fixed effects. Standard errors are clustered at the health district level. *, **, and *** denotes significance at the 10%, 5%, and 1% level, respectively.
Health center
operating
efficiency
Δ Primary %Δ Emp. %Δ Doctors %Δ Nurses %Δ Admin. %Δ Primary %Δ Maternal %Δ Births Δ Share of Δ Share of Δ Share of
healthcare employees healthcare and childhood stillbirths neonatal live births
services per services healthcare deaths
employee services
(1) (2) (3) (4) (5) (6) (7) (8) (9) (10) (11)
Treatment 75.594** -0.037 0.007 -0.001 -0.063 0.355 0.267 0.225 -0.243** -0.224** 0.467***
(34.444) (0.046) (0.009) (0.066) (0.048) (0.256) (0.261) (0.174) (0.122) (0.087) (0.163)
Province fixed effects No No No No No No No No No No No
R-squared 0.027 0.002 0.001 0.000 0.005 0.009 0.005 0.010 0.005 0.009 0.011
Observations 999 999 999 999 999 999 999 999 999 999 999
Health center employees Volume of healthcare services Quality of healthcare services

65
Table A4. Robustness—specifications without clustered standard errors
Notes. This table reports variants of the regressions in Table 3, but without clustering standard errors. *, **, and *** denotes significance at the 10%, 5%, and 1% level, respectively.
Health center
operating
efficiency
Δ Primary %Δ Emp. %Δ Doctors %Δ Nurses %Δ Admin. %Δ Primary %Δ Maternal %Δ Births Δ Share of Δ Share of Δ Share of
healthcare employees healthcare and childhood stillbirths neonatal live births
services per services healthcare deaths
employee services
(1) (2) (3) (4) (5) (6) (7) (8) (9) (10) (11)
Treatment 101.351*** -0.060** 0.005 0.002 -0.096*** 0.270** 0.292*** 0.163** -0.325*** -0.225*** 0.550***
(12.182) (0.028) (0.009) (0.042) (0.030) (0.113) (0.112) (0.072) (0.117) (0.085) (0.158)
Province fixed effects Yes Yes Yes Yes Yes Yes Yes Yes Yes Yes Yes
R-squared 0.334 0.070 0.012 0.057 0.036 0.203 0.172 0.125 0.017 0.013 0.019
Observations 999 999 999 999 999 999 999 999 999 999 999
Health center employees Volume of healthcare services Quality of healthcare services

66
Table A5. Robustness—birth-weighted regressions
Notes. This table provides variants of the regressions in columns (9)-(11) of Table 3, but estimating the regressions by weighted least squares (WLS), weighting observations by the number of births. Standard errors are clustered at the health district level. *, **, and *** denotes significance at the 10%, 5%, and 1% level, respectively.
Δ Share of Δ Share of Δ Share of
stillbirths neonatal live births
deaths
(1) (2) (3)
Treatment -0.358*** -0.253** 0.611***
(0.118) (0.109) (0.179)
Province fixed effects Yes Yes Yes
R-squared 0.020 0.014 0.022
Observations 999 999 999

67
Table A6. Low-performing health centers
Notes. This table presents variants of the regressions in columns (1) and (11) of Table 3, interacting treatment with two dummy variables that indicate whether operating efficiency and infant mortality, respectively, are in the bottom quartile (“bottom 25%”) and bottom decile (“bottom 10%”) of their distribution prior to the PDSS intervention. The regressions include the interacted variables as standalone controls. Standard errors are clustered at the health district level. *, **, and *** denotes significance at the 10%, 5%, and 1% level, respectively.
Δ Primary Δ Primary Δ Share of Δ Share of
healthcare healthcare live births live births
services per services per
employee employee
(1) (2) (3) (4)
Treatment 93.130*** 96.631*** 0.374** 0.443**
(27.195) (25.858) (0.176) (0.175)
Treatment × Operating efficiency (bottom 25%) 32.977*
(19.805)
Treatment × Operating efficiency (bottom 10%) 48.327*
(28.082)
Treatment × Infant mortality (bottom 25%) 0.622**
(0.305)
Treatment × Infant mortality (bottom 10%) 0.864*
(0.505)
Province fixed effects Yes Yes Yes Yes
Controls Yes Yes Yes Yes
R-squared 0.337 0.337 0.028 0.029
Observations 999 999 999 999
operating efficiency
Health center Quality of
healthcare services

68
Table A7. Summary statistics for the outside group
Obs. Mean Median Std. Dev.
Panel A. Health centers statistics
Primary healthcare services per employee 5,832 168.10 80.07 429.14
Employees 5,832 5.20 4 6.64
Doctors 5,832 0.23 0 0.86
Nurses 5,832 2.82 2 4.69
Administrative 5,832 2.15 1 2.59
Primary healthcare services 5,832 1,153 421 2,843
Maternal and childhood healthcare services 5,832 607 262 979
Births 5,832 26.77 13 41.39
Stillbirths (in %) 5,832 0.41 0 1.30
Neonatal deaths (in %) 5,832 0.37 0 1.95
Live births (in %) 5,832 99.22 100 2.55
Panel B. Population statistics
Population in center’s health area 5,832 11,918 9,495 8,700
Population in center’s health district 5,832 215,158 194,315 94,966
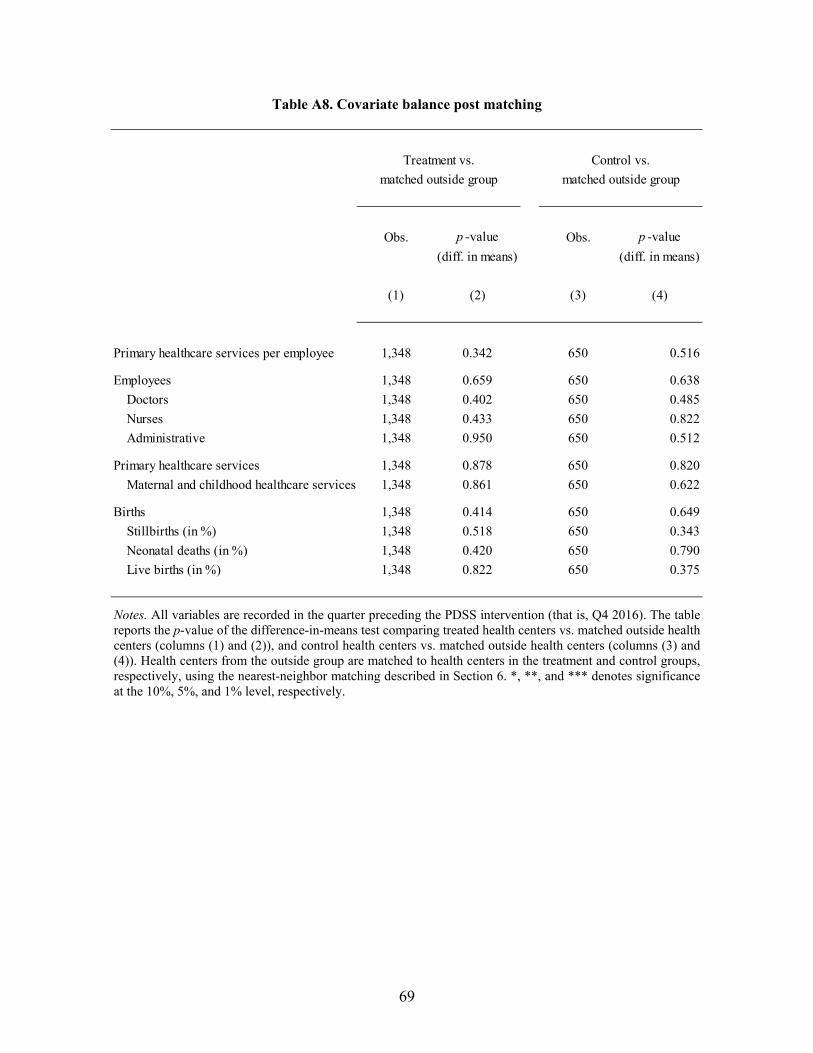
69
Table A8. Covariate balance post matching
Notes. All variables are recorded in the quarter preceding the PDSS intervention (that is, Q4 2016). The table reports the p-value of the difference-in-means test comparing treated health centers vs. matched outside health centers (columns (1) and (2)), and control health centers vs. matched outside health centers (columns (3) and (4)). Health centers from the outside group are matched to health centers in the treatment and control groups, respectively, using the nearest-neighbor matching described in Section 6. *, **, and *** denotes significance at the 10%, 5%, and 1% level, respectively.
Obs. p -value Obs. p -value
(diff. in means) (diff. in means)
(1) (2) (3) (4)
Primary healthcare services per employee 1,348 0.342 650 0.516
Employees 1,348 0.659 650 0.638
Doctors 1,348 0.402 650 0.485
Nurses 1,348 0.433 650 0.822
Administrative 1,348 0.950 650 0.512
Primary healthcare services 1,348 0.878 650 0.820
Maternal and childhood healthcare services 1,348 0.861 650 0.622
Births 1,348 0.414 650 0.649
Stillbirths (in %) 1,348 0.518 650 0.343
Neonatal deaths (in %) 1,348 0.420 650 0.790
Live births (in %) 1,348 0.822 650 0.375
Treatment vs. Control vs.
matched outside group matched outside group

70
Table A9. Funding vs. governance—cross-sectional heterogeneity
Panel A. Treatment group vs. outside group
Health center
operating
efficiency
Δ Primary %Δ Emp. %Δ Doctors %Δ Nurses %Δ Admin. %Δ Primary %Δ Maternal %Δ Births Δ Share of Δ Share of Δ Share of
healthcare employees healthcare and childhood stillbirths neonatal live births
services per services healthcare deaths
employee services
(1) (2) (3) (4) (5) (6) (7) (8) (9) (10) (11)
Treatment vs. outside 86.873*** 0.165*** -0.005 0.278*** 0.045 0.826*** 0.817*** 0.631*** -0.307*** -0.277*** 0.584***
(18.005) (0.034) (0.011) (0.060) (0.036) (0.231) (0.187) (0.112) (0.113) (0.080) (0.213)
Treatment vs. outside × Density of health centers -19.744** 0.041 0.006 0.032 0.029 -0.144 -0.119 -0.118 0.198* 0.176** -0.374**
(7.891) (0.039) (0.010) (0.051) (0.020) (0.293) (0.304) (0.159) (0.116) (0.083) (0.143)
Treatment vs. outside × Infant mortality -8.794 -0.003 0.012 0.011 -0.026 -0.095 0.046 -0.081 -0.115 -0.191* 0.306**
(11.338) (0.043) (0.012) (0.050) (0.038) (0.208) (0.248) (0.113) (0.087) (0.097) (0.136)
Treatment vs. outside × Size -13.342 -0.127*** 0.012 -0.137** -0.104** -0.466** -0.458* -0.281** -0.032 0.046 -0.013
(10.393) (0.038) (0.018) (0.053) (0.049) (0.185) (0.250) (0.141) (0.134) (0.087) (0.234)
Treatment vs. outside × Operating efficiency -23.522* 0.024 0.004 0.032 0.044 -0.162 -0.173 -0.129 -0.078 -0.044 0.121
(13.898) (0.024) (0.007) (0.040) (0.028) (0.310) (0.322) (0.139) (0.064) (0.113) (0.138)
Province fixed effects Yes Yes Yes Yes Yes Yes Yes Yes Yes Yes Yes
Controls Yes Yes Yes Yes Yes Yes Yes Yes Yes Yes Yes
R-squared 0.555 0.209 0.063 0.184 0.076 0.291 0.244 0.229 0.090 0.094 0.097
Observations 1,348 1,348 1,348 1,348 1,348 1,348 1,348 1,348 1,348 1,348 1,348
Health center employees Volume of healthcare services Quality of healthcare services

71
Table A9 (continued)
Notes. This table presents variants of the regressions in Table 7, interacting treatment vs. outside and control vs. outside with various characteristics measured prior to the PDSS intervention. For ease of interpretation, all interacted characteristics are standardized. All regressions also include the interacted variables as standalone controls. Standard errors are clustered at the health district level. *, **, and *** denotes significance at the 10%, 5%, and 1% level, respectively.
Panel B. Control group vs. outside group
Health center
operating
efficiency
Δ Primary %Δ Emp. %Δ Doctors %Δ Nurses %Δ Admin. %Δ Primary %Δ Maternal %Δ Births Δ Share of Δ Share of Δ Share of
healthcare employees healthcare and childhood stillbirths neonatal live births
services per services healthcare deaths
employee services
(1) (2) (3) (4) (5) (6) (7) (8) (9) (10) (11)
Control vs. outside 17.769 0.138*** -0.001 0.183*** 0.092** 0.441** 0.494** 0.393** 0.104 0.139 -0.243
(13.971) (0.033) (0.010) (0.066) (0.044) (0.183) (0.246) (0.181) (0.178) (0.129) (0.211)
Control vs. outside × Density of health centers -13.892 -0.033 0.011 -0.051 -0.049 -0.039 -0.031 -0.156 -0.160 -0.130 0.291
(11.030) (0.041) (0.010) (0.060) (0.032) (0.103) (0.145) (0.145) (0.155) (0.120) (0.218)
Control vs. outside × Infant mortality -4.375 -0.036 -0.014 -0.045 -0.012 -0.037 0.030 -0.033 -0.167 -0.137 0.303
(12.590) (0.026) (0.009) (0.040) (0.032) (0.136) (0.273) (0.137) (0.154) (0.167) (0.236)
Control vs. outside × Size -0.597 -0.105** -0.014 -0.124** -0.091** -0.195* -0.240* -0.283** 0.110 -0.019 -0.091
(6.436) (0.047) (0.010) (0.058) (0.042) (0.112) (0.142) (0.116) (0.139) (0.128) (0.234)
Control vs. outside × Operating efficiency -21.640 -0.024 0.009 0.037 -0.063 -0.230 -0.239 0.172 -0.132 0.080 0.052
(23.147) (0.054) (0.006) (0.075) (0.060) (0.180) (0.260) (0.181) (0.133) (0.127) (0.109)
Province fixed effects Yes Yes Yes Yes Yes Yes Yes Yes Yes Yes Yes
Controls Yes Yes Yes Yes Yes Yes Yes Yes Yes Yes Yes
R-squared 0.573 0.196 0.036 0.174 0.154 0.560 0.388 0.365 0.153 0.111 0.181
Observations 650 650 650 650 650 650 650 650 650 650 650
Health center employees Volume of healthcare services Quality of healthcare services