A Study on Commodity Market Wrt Gold at Edelweiss Karimnagar
Upload
hoangnguyetCategory
view
214download
1
The Gold Commodity: Economic Determinants & Future Prospects
Credit Libanais Economic Research Unit
April 2014
Fadlo Choueiri, CFA Patrick Karawani +961-1-200028 Ext: 235 +961-1-200028 Ext: 275 [email protected] [email protected]

The Gold Commodity: Economic Determinants & Future Prospects
Credit Libanais Economic Research Unit 2
Table of Contents
I. OVERVIEW ON GOLD AND THE EVOLUTION OF GOLD PRICES p3
A. Historical Evolution p3 B. Recent Evolution p4
II. DETERMINANTS OF GOLD PRICES p6
A. The Variables Influencing Gold Prices p6 B. The Empirical Model p9
1. Methodology p9 2. Regressions and Results p10 3. Summary of Results p15
III. FORECASTS p16
A. Technical Analysis p16 B. Forecasts based on the VAR Model p17
IMPORTANT NOTICE
This economic research publication has been prepared by the economic research unit at Credit Libanais SAL on the basis of published information and other sources which are deemed reliable. It is intended for limited use only and its re-distribution without the prior written consent of Credit Libanais is strictly prohibited.
Credit Libanais does not make any warranty or representation, expressed or implied, as to the accuracy or completeness of the materials contained herein. Neither the information nor the opinions expressed herein constitute, or are to be construed as an offer or solicitation of an offer to buy or sell investments. Opinions and data expressed herein are subject to change without prior notice.
The Gold Commodity: Economic Determinants & Future Prospects
Credit Libanais Economic Research Unit 3
I. OVERVIEW ON GOLD AND THE EVOLUTION OF GOLD PRICES
The different variables explaining gold prices’ volatility can be grouped under supply and demand components, with gold prices being entwined with any shock striking a variable under said components. In this context, the following paper aims at analyzing the interaction between macroeconomic variables that normally feel the pinch of such shocks and the evolution of gold prices. The results show that stock markets’ volatility is the most pertinent variable explaining gold prices fluctuations, while inflation and the US Dollar exchange rate against a basket of currencies are in most cases not statistically significant. These findings partly explain the astounding rally in gold prices witnessed since the onset of the year 2007 amid the global financial crisis which led to a collapse in US and international stock markets.
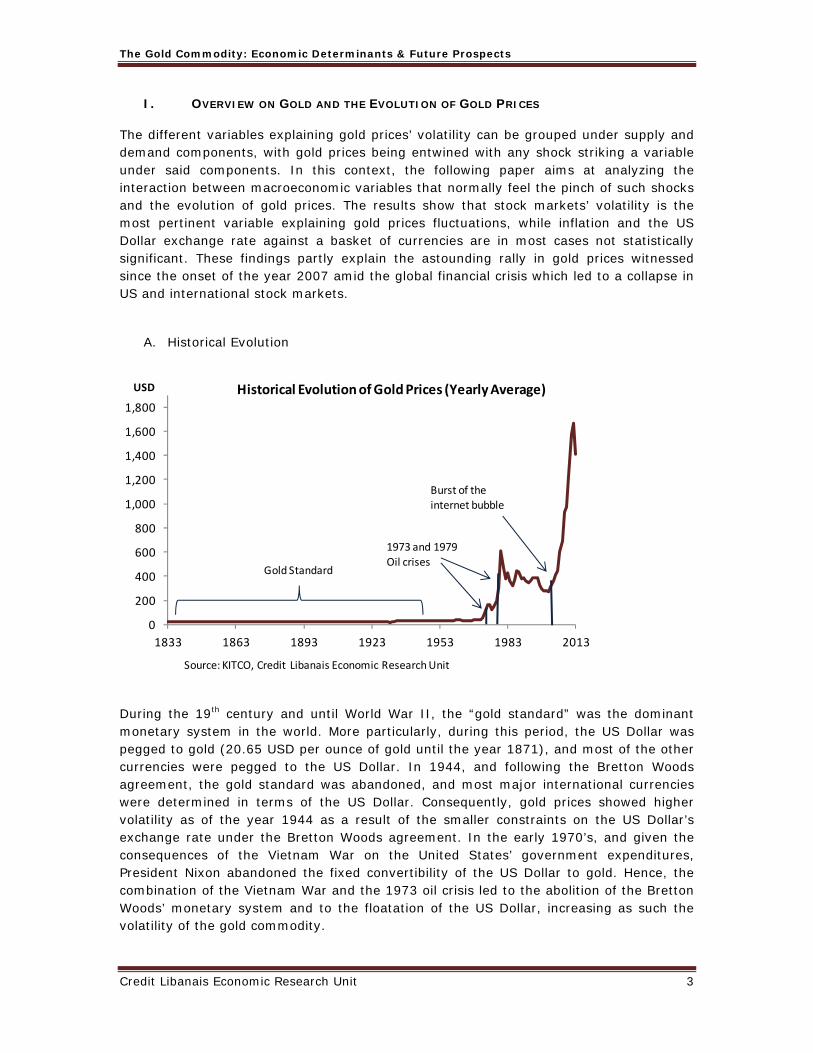
A. Historical Evolution
During the 19th century and until World War II, the “gold standard” was the dominant monetary system in the world. More particularly, during this period, the US Dollar was pegged to gold (20.65 USD per ounce of gold until the year 1871), and most of the other currencies were pegged to the US Dollar. In 1944, and following the Bretton Woods agreement, the gold standard was abandoned, and most major international currencies were determined in terms of the US Dollar. Consequently, gold prices showed higher volatility as of the year 1944 as a result of the smaller constraints on the US Dollar’s exchange rate under the Bretton Woods agreement. In the early 1970’s, and given the consequences of the Vietnam War on the United States’ government expenditures, President Nixon abandoned the fixed convertibility of the US Dollar to gold. Hence, the combination of the Vietnam War and the 1973 oil crisis led to the abolition of the Bretton Woods’ monetary system and to the floatation of the US Dollar, increasing as such the volatility of the gold commodity.
0
200
400
600
800
1,000
1,200
1,400
1,600
1,800
1833 1863 1893 1923 1953 1983 2013
Historical Evolution ofGold Prices (Yearly Average)
Gold Standard
Source: KITCO, Credit Libanais Economic Research Unit
Burst of the internet bubble
1973 and 1979 Oil crises
USD

The Gold Commodity: Economic Determinants & Future Prospects
Credit Libanais Economic Research Unit 4
Subsequently, gold prices rose steadily during the past 40 years to settle at around $632 per ounce as at year-end 2006, before increasing sharply in 2007 as detailed in the following section.
B. Recent Evolution
The gold commodity has always been eyed as a safe-haven investment and a hedge against inflation and financial instability, attracting investors during periods of stock market volatility and macroeconomic turbulences. In fact, and after several years of relative stability, gold prices have soared throughout the global financial crisis era, peaking at around $1,900/ounce in September 2011. Since then, gold prices have been steadily decreasing amid the gradual economic recovery in the United States along with the corrections witnessed in major stock markets.
The chart hereunder captures the monthly evolution of gold prices during the past eight years, shedding light on the consequences of the subprime crisis and the gradual economic recovery:
More recently, gold prices reached a four-month high in early March 2014 ($1,349.5 per ounce) amid the growing fears of the deterioration of the Ukrainian conflict which could initiate a reallocation of investments towards safe havens. Hence, the evolution of gold prices in the near future is likely to be directly linked to the developments in said conflict and its consequences on stock markets.
The tables on the following page portray the distribution of gold reserves in the world as at mid March 2014, shedding light on the high concentration of gold reserves in the United States (8,133.5 tons of gold), trailed by far by Germany (3,387.1 tons of gold) and the IMF (2,814 tons of gold).
Accordingly, these countries’ monetary policies (in particular a change in gold supply or demand) will certainly affect gold prices.
0
200
400
600
800
1000
1200
1400
1600
1800
2000
J J J F F M M M A
MonthlyEvolution of Gold Prices
2006 2007 2008 2009 2010 2011 2012 2013
USD/Ounce
Source: KITCO, Credit Libanais Economic Research Unit
MonthYear

The Gold Commodity: Economic Determinants & Future Prospects
Credit Libanais Economic Research Unit 5
As far as the MENA region is concerned, Saudi Arabia topped the list in terms of total gold reserves (322.9 tons of gold; world rank: 17th), followed by Lebanon (286.8 tons of gold; world rank: 19th), and Algeria (173.6 tons of gold; world rank: 24th).
It is worth noting that, according to the World Gold Council, Turkey’s official gold reserves increased by 44.7 tons in July 2012, as a consequence of the Central Bank’s decision to accept gold from commercial banks as reserve requirements1.
Overall, countries purchased 369 tons of gold in the year 2013, down from 544 tons a year earlier. This drop in gold demand partly explains the 27.24% contraction in gold prices witnessed during the year 2013.
More recently, the Central Bank of Iraq acquired 36 tons of gold (worth some $1.56 billion) in March 2014, in an attempt to stabilize the Iraqi Dinar’s exchange rate against foreign currencies1, the highest gold purchase transaction since Mexico acquired 78.5 tons in March 2011.
1 Bloomberg, March 25, 2014
Gold Reserves (Tons) World Rank
United States 8,133.5 1Germany 3,387.1 2IMF 2,814.0 3Italy 2,451.8 4France 2,435.4 5China 1,054.1 6Switzerland 1,040.1 7Russia 1,034.7 8Japan 765.2 9Netherlands 612.5 10India 557.7 11ECB 503.2 12Turkey 488.6 13Taiwan 423.6 14Portugal 382.5 15Venezuela 367.6 16Saudi Arabia 322.9 17United Kingdom 310.3 18Lebanon 286.8 19Spain 281.6 20Source: World Gold Council
0.0
1,000.0
2,000.0
3,000.0
4,000.0
5,000.0
6,000.0
7,000.0
8,000.0
9,000.0
United States
Germany IMF Italy France China
8,133.5
3,387.12,814.0
2,451.8 2,435.4
1,054.1
Tonsof Gold
Source: World Gold Council
Distribution of Gold Reserves

The Gold Commodity: Economic Determinants & Future Prospects
Credit Libanais Economic Research Unit 6
II. DETERMINANTS OF GOLD PRICES
A. The Variables Influencing Gold Prices
Gold prices are determined by several factors, either on the demand or on the supply side. Given the relative stability of gold prices, and the fact that gold rarely loses value on the long run, it is considered as safe haven by investors, and is also used as a hedge against inflation. Accordingly, and based on these assumptions, gold prices should, in theory, be negatively correlated to financial assets and positively correlated to the world inflation rate.
The following chart describes the annual percentage change in gold prices against the change in the S&P 500 stock index:
Gold Reserves (Tons)
Rank Among MENA Countries World Rank
Saudi Arabia 322.9 1 17Lebanon 286.8 2 19Algeria 173.6 3 24Kuwait 79.0 4 38Egypt 75.6 5 40Iraq 29.8 6 55Syria 25.8 7 57Morocco 22.0 8 59Jordan 14.6 9 64Qatar 12.4 10 68Tunisia 6.0 11 79Bahrain 4.7 12 84Source: World Gold Council
0.0
50.0
100.0
150.0
200.0
250.0
300.0
350.0
Saudi Arabia
Lebanon Algeria Kuwait Egypt Iraq
322.9
286.8
173.6
79.0 75.6
29.8
Tonsof Gold
Source: World Gold Council
Gold Reserves in the MENA Region
‐40.00%
‐30.00%
‐20.00%
‐10.00%
0.00%
10.00%
20.00%
30.00%
40.00%
1981 1986 1991 1996 2001 2006 2011
Gold S&P
Annual% Change in Gold Prices v/s the Annual Change in the S&P 500 Stock Index
Source: Credit Libanais Economic Research Unit

The Gold Commodity: Economic Determinants & Future Prospects
Credit Libanais Economic Research Unit 7
Gold prices appear to be negatively correlated to the S&P 500 stock index over the past thirty years as illustrated in the chart above, which seems to validate the assumptions often adopted concerning gold as a hedge against stock markets volatility. For instance, as previously mentioned, gold prices skyrocketed in recent years in the aftermath of the 2007 crisis which struck financial markets across the world, and drove gold prices to record highs. More particularly, at a time when the S&P 500 stock index reached 752.44 in November 20, 2008 (its lowest level since the year 1997), the gold ounce rallied to $952 three months later. Concurrently, towards the end of the subprime crisis, gold prices bucked their gaining streak. More recently, the ongoing improvement in the US stock markets saw a downturn in gold prices, a trend that can be sustained as long as stock markets recovery continues.
In parallel, and as depicted by the chart herein, gold also proves to be a hedge against inflation in periods of monetary instability. In fact, gold prices seem to move in line with the world inflation rate over the 1990-2013 period, even though the correlation is less visible than with stock indices.
The chart on the following page highlights the evolution of the annual percentage change in the US Dollar index (USD exchange rate against a basket of international currencies) compared to the change in gold prices. The negative correlation between both variables is not clear, however, and varies between a sub-period and another.
‐50.00%
‐30.00%
‐10.00%
10.00%
30.00%
50.00%
70.00%
90.00%
110.00%
1990 1995 2000 2005 2010
Gold Change in World Inflation
Annual% Change in Gold Prices v/s the Change in the World Inflation Rate
Source: Credit Libanais Economic Research Unit

The Gold Commodity: Economic Determinants & Future Prospects
Credit Libanais Economic Research Unit 8
The impact of a change in interest rates on gold prices is more complex to establish, depending on the nature of the modification. For instance, if the rise in nominal interest rates aims to reduce inflation, it is highly likely that gold prices will be negatively correlated with interest rates, while on the other hand, in the event the rise in interest rates aims to combat the formation of a financial bubble on stock markets, interest rates and gold prices could be positively correlated. The trend in gold prices fluctuations v/s that of the Euro-Dollar deposit rate during the 1981-2013 period is depicted by the following chart:
The table on the following page portrays the correlation coefficients between gold prices and all aforementioned variables:
‐40.00%
‐30.00%
‐20.00%
‐10.00%
0.00%
10.00%
20.00%
30.00%
40.00%
1981 1986 1991 1996 2001 2006 2011
Gold USD Index
Annual % Change in Gold Prices v/s the Change in the USD Index
Source: Fed, Credit Libanais Economic Research Unit
‐80.00%
‐30.00%
20.00%
70.00%
120.00%
170.00%
1981 1986 1991 1996 2001 2006 2011
Gold Euro‐Dollar Deposit Rate
Annual% Change in Gold Prices v/s the Change in the Euro‐Dollar Deposit Rate
Source: Fed, Credit Libanais Economic Research Unit

The Gold Commodity: Economic Determinants & Future Prospects
Credit Libanais Economic Research Unit 9
Based on these figures, the variation in gold prices seems to be negatively correlated with the change in the S&P 500 stock index, and positively correlated with the variation in the world’s inflation rate. Said results validate the propositions exposed in the previous section concerning the role of gold as a hedge against inflation and stock markets’ volatility.
In parallel, both coefficients of correlation of the change in gold prices and the change in the US Dollar index, on the one hand, and the Euro-Dollar deposit rate on the other are negative, suggesting that a drop in one of these variables would generate a rise in gold prices.
B. The Empirical Model
1. Methodology
In order to identify the origin of the fluctuations in gold prices, we used the Vector Auto Regression Estimates (VAR) methodology, which allows us to find the equations explaining all endogenous variables in the model as a function of their own lags and the lags of the other chosen endogenous variables. Accordingly, the equations of the VAR model are computed as follows:
Where X and Y are the variables of the VAR model, and and represent the residuals. It is worth noting that, in order to avoid risks of fallacious regressions, said residuals should be stationary.
In the model developed hereunder, we include the variables described in the previous section, which we believe can influence gold prices.
Correlation Coefficients
Change in S&P 500 Stock Index
Change in World Inflation
Change in the USD Index
Change in 1 Month Euro‐Dollar Deposit
RateChange in Gold Prices
‐0.30783141 0.22069402 ‐0.098801455 ‐0.497280864

The Gold Commodity: Economic Determinants & Future Prospects
Credit Libanais Economic Research Unit 10
2. Regressions and Results
In the following model we try to estimate the relationship between gold prices (the dependent variable) and explanatory variables, namely inflation, the S&P 500 stock index, the Euro-Dollar deposit rate, world economic growth, and the US Dollar index.
Hence, our empirical analysis is based on the following equation:
With lnG being the natural logarithm of end of year’s gold prices;
the world’s inflation rate;
gy the world’s real GDP growth rate;
ln(SP) the natural logarithm of end of year’s S&P 500 stock index;
I the 1-month Euro-Dollar deposit rate;
ln(USD) the natural logarithm of the USD’s exchange rate against a basket of currencies.
The Augmented Dickey-Fuller and Phillips-Peron tests are then performed on the different variables to determine whether they are stationary or not, and avoid the risks of fallacious regressions. Both tests show that all chosen variables (except interest rates on Euro-Dollar deposits) are non-stationary I(1), and hence were included in the model in first differences.
When including all variables discussed in the section above in the regression model, none of them seems to be statistically significant, and the model fails to explain gold prices, as sketched by the table on the following page:

The Gold Commodity: Economic Determinants & Future Prospects
Credit Libanais Economic Research Unit 11
Hence, we perform various regressions by sequentially omitting some of the abovementioned variables in an attempt to identify those that may be significant.
As depicted by all three models elaborated on the following pages, the S&P 500 stock index seems to be the most significant variable in explaining gold prices fluctuations.
We examine the relationship between the different variables using three different models in which the S&P 500 stock index seems to be significant at the 10% level.
DLNG DLNSP DINF DLNUSD I DGY
DLNG(-1) 0.324938 -0.446310 -0.193723 -0.263849 0.006886 0.061478
(0.34107) (0.42715) (0.13587) (0.07584) (0.02977) (0.03326)
[ 0.95270] [-1.04487] [-1.42578] [-3.47919] [ 0.23129] [ 1.84833]
DLNSP(-1) -0.036415 -0.187528 -0.058392 0.000398 0.017821 0.008434
(0.20827) (0.26083) (0.08297) (0.04631) (0.01818) (0.02031)
[-0.17485] [-0.71897] [-0.70380] [ 0.00860] [ 0.98024] [ 0.41527]
DINF(-1) 0.589174 -1.108806 -0.024637 0.131547 -0.020221 -0.019587
(0.59948) (0.75077) (0.23881) (0.13329) (0.05233) (0.05846)
[ 0.98281] [-1.47689] [-0.10316] [ 0.98689] [-0.38641] [-0.33505]
DLNUSD(-1) -0.647397 0.497269 -0.524280 0.125931 0.045576 0.207835
(0.83202) (1.04200) (0.33145) (0.18500) (0.07263) (0.08114)
[-0.77810] [ 0.47723] [-1.58177] [ 0.68072] [ 0.62752] [ 2.56147]
I(-1) 0.109888 -4.865387 -0.304175 0.067887 0.764820 -0.246674
(1.97315) (2.47112) (0.78604) (0.43873) (0.17224) (0.19242)
[ 0.05569] [-1.96890] [-0.38697] [ 0.15474] [ 4.44043] [-1.28194]
DGY(-1) -2.230081 -0.703633 -0.623531 -0.128899 0.288132 -0.203381
(1.94043) (2.43013) (0.77301) (0.43145) (0.16938) (0.18923)
[-1.14927] [-0.28954] [-0.80663] [-0.29876] [ 1.70107] [-1.07478]
C 0.044597 0.273830 0.026712 0.028005 0.002577 0.000628
(0.09591) (0.12011) (0.03821) (0.02132) (0.00837) (0.00935)
[ 0.46500] [ 2.27981] [ 0.69914] [ 1.31325] [ 0.30780] [ 0.06717]
R-squared 0.289484 0.246762 0.219019 0.654071 0.727591 0.475537
Adj. R-squared 0.023040 -0.035702 -0.073849 0.524348 0.625437 0.278863
Schwarz SC -0.353734 0.096342 -2.194489 -3.360751 -5.230733 -5.009126
Vector Autoregression Estimates
Sample (adjusted): 1991 - 2013
Standard errors in ( ) & t-statistics in [ ]
Source: Credit Libanais Economic Research Unit
D stands for the first differences of the different variables

The Gold Commodity: Economic Determinants & Future Prospects
Credit Libanais Economic Research Unit 12
Model 1
In the first model we include two variables, namely the natural logarithm of gold prices and the natural logarithm of the S&P 500 stock index. Based on the Schwarz Information Criterion (SIC) which is used to determine the optimal lag structure, two lags should be included in the model. The following table captures the main results of the concerned VAR model:
The relationship between both variables is described by the equation herein:
0.05 0.28 ln 0.02 ln 0.11 ln 0.28 lnSP
In the model above, the S&P 500 stock index seems to be negatively correlated with gold prices, with the coefficients of dlnsp(-1) and dlnsp(-2) being negative. Accordingly, a 1% rise in the two-period lagged S&P 500 stock index would yield a 0.28% drop in gold prices, which is consistent with the predictions made previously in this paper on the type of the relationship between both variables. However, none of the coefficients appearing in the equation above are statistically significant at the 10% level (even though the t-statistic of the coefficient of dlnsp(-2) is close to the 1.64 benchmark).
DLNG DLNSP
DLNG(-1) 0.281838 -0.089070
(0.20722) (0.25108)
[ 1.36009] [-0.35474]
DLNG(-2) -0.015117 0.099267
(0.18130) (0.21967)
[-0.08338] [ 0.45189]
DLNSP(-1) -0.105533 0.017351
(0.16848) (0.20414)
[-0.62639] [ 0.08499]
DLNSP(-2) -0.275976 -0.009526
(0.17184) (0.20822)
[-1.60598] [-0.04575]
C 0.049382 0.083918
(0.03665) (0.04441)
[ 1.34723] [ 1.88951]
R-squared 0.198789 0.012065
Adj. R-squared 0.075526 -0.139925
Schwarz SC -0.581581 -0.197595
Vector Autoregression Estimates
Standard errors in ( ) & t-statistics in [ ]
Sample (adjusted): 1983 - 2013
Source: Credit Libanais Economic Research Unit
The Gold Commodity: Economic Determinants & Future Prospects
Credit Libanais Economic Research Unit 13
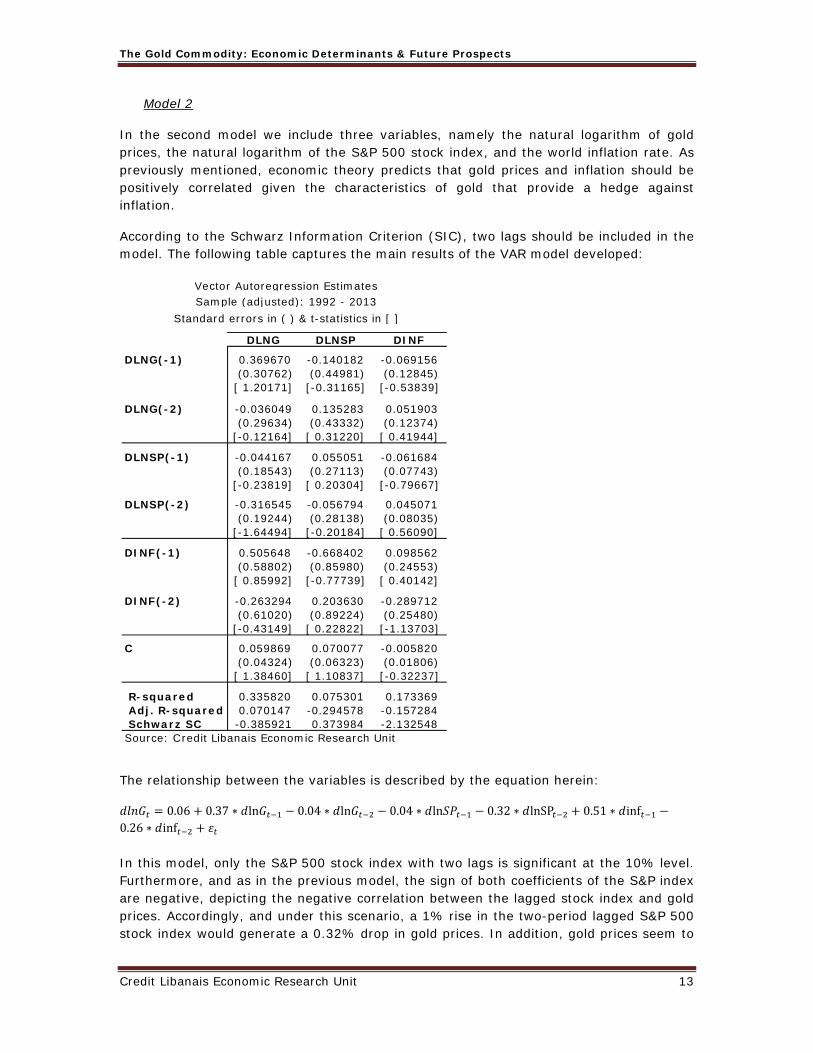
Model 2
In the second model we include three variables, namely the natural logarithm of gold prices, the natural logarithm of the S&P 500 stock index, and the world inflation rate. As previously mentioned, economic theory predicts that gold prices and inflation should be positively correlated given the characteristics of gold that provide a hedge against inflation.
According to the Schwarz Information Criterion (SIC), two lags should be included in the model. The following table captures the main results of the VAR model developed:
The relationship between the variables is described by the equation herein:
0.06 0.37 ln 0.04 ln 0.04 ln 0.32 lnSP 0.51 inf0.26 inf In this model, only the S&P 500 stock index with two lags is significant at the 10% level. Furthermore, and as in the previous model, the sign of both coefficients of the S&P index are negative, depicting the negative correlation between the lagged stock index and gold prices. Accordingly, and under this scenario, a 1% rise in the two-period lagged S&P 500 stock index would generate a 0.32% drop in gold prices. In addition, gold prices seem to
DLNG DLNSP DINF
DLNG(-1) 0.369670 -0.140182 -0.069156 (0.30762) (0.44981) (0.12845)[ 1.20171] [-0.31165] [-0.53839]
DLNG(-2) -0.036049 0.135283 0.051903 (0.29634) (0.43332) (0.12374)[-0.12164] [ 0.31220] [ 0.41944]
DLNSP(-1) -0.044167 0.055051 -0.061684 (0.18543) (0.27113) (0.07743)[-0.23819] [ 0.20304] [-0.79667]
DLNSP(-2) -0.316545 -0.056794 0.045071 (0.19244) (0.28138) (0.08035)[-1.64494] [-0.20184] [ 0.56090]
DINF(-1) 0.505648 -0.668402 0.098562 (0.58802) (0.85980) (0.24553)[ 0.85992] [-0.77739] [ 0.40142]
DINF(-2) -0.263294 0.203630 -0.289712 (0.61020) (0.89224) (0.25480)[-0.43149] [ 0.22822] [-1.13703]
C 0.059869 0.070077 -0.005820 (0.04324) (0.06323) (0.01806)[ 1.38460] [ 1.10837] [-0.32237]
R-squared 0.335820 0.075301 0.173369 Adj. R-squared 0.070147 -0.294578 -0.157284 Schwarz SC -0.385921 0.373984 -2.132548
Vector Autoregression Estimates Sample (adjusted): 1992 - 2013
Standard errors in ( ) & t-statistics in [ ]
Source: Credit Libanais Economic Research Unit

The Gold Commodity: Economic Determinants & Future Prospects
Credit Libanais Economic Research Unit 14
be positively correlated to the world inflation rate with one lag, yet this result is not statistically significant.
Model 3
The third model is based on the analysis of four variables, namely the natural logarithm of gold prices and the natural logarithm of the S&P 500 index, the natural logarithm of the US Dollar’s exchange rate against major international currencies, and the interest rate on Euro-Dollar deposits. Theoretically, the correlation between gold prices and interest rates is ambiguous, and depends on the nature of the variation in interest rates. An appreciation of the US Dollar, on the other hand, should theoretically have a negative impact on gold prices. In fact, given its relatively low volatility, gold can provide investors with a protection against losses stemming from the volatility of the US Dollar. Hence, in the event investors anticipate a depreciation of the USD, a shift between assets denominated in USD and gold will be initiated, generating as such a rise in the ounce of gold.
DLNG DLNSP DLNUSD I
DLNG(-1) 0.065676 -0.036789 -0.233575 0.005715 (0.25366) (0.32284) (0.06859) (0.02043)[ 0.25892] [-0.11396] [-3.40539] [ 0.27974]
DLNG(-2) -0.385047 0.315024 0.041622 0.047455 (0.28955) (0.36851) (0.07829) (0.02332)[-1.32983] [ 0.85486] [ 0.53161] [ 2.03482]
DLNSP(-1) -0.106579 -0.023529 0.002958 0.017653 (0.17405) (0.22151) (0.04706) (0.01402)[-0.61236] [-0.10622] [ 0.06286] [ 1.25927]
DLNSP(-2) -0.309585 0.022297 -0.016232 0.034911 (0.18094) (0.23029) (0.04893) (0.01457)[-1.71098] [ 0.09682] [-0.33177] [ 2.39548]
DLNUSD(-1) -1.060140 0.838789 0.243344 0.036372 (0.83937) (1.06828) (0.22697) (0.06761)[-1.26303] [ 0.78518] [ 1.07216] [ 0.53800]
DLNUSD(-2) 0.404584 0.124237 -0.221480 0.019301 (0.59737) (0.76028) (0.16153) (0.04811)[ 0.67728] [ 0.16341] [-1.37115] [ 0.40115]
I(-1) -0.811988 -2.137902 0.143500 1.082679 (2.20406) (2.80515) (0.59598) (0.17753)[-0.36841] [-0.76213] [ 0.24078] [ 6.09874]
I(-2) -0.719977 1.380217 0.441926 -0.196235 (2.01486) (2.56435) (0.54482) (0.16229)[-0.35733] [ 0.53823] [ 0.81114] [-1.20919]
C 0.172617 0.078169 0.003412 -0.004907 (0.08093) (0.10300) (0.02188) (0.00652)[ 2.13298] [ 0.75894] [ 0.15593] [-0.75285]
R-squared 0.319626 0.074383 0.642382 0.876464 Adj. R-squared 0.072217 -0.262205 0.512340 0.831542 Schwarz SC -0.301968 0.180344 -2.917661 -5.339856
Vector Autoregression Estimates Sample (adjusted): 1983 - 2013
Standard errors in ( ) & t-statistics in [ ]
Source: Credit Libanais Economic Research Unit
The Gold Commodity: Economic Determinants & Future Prospects
Credit Libanais Economic Research Unit 15
The relationship between the aforementioned variables and gold prices is described by the equation herein:
0.17 0.07 ln 0.39 ln 0.11 ln 0.31 lnSP 1.06 lnUSD
0.40 lnUSD 0.81 0.72 i
In this model, the S&P 500 index with two lags remains significant at the 10% level, with a 1% rise in the two-period lagged S&P 500 index generating a 0.31% drop in gold prices. In addition, gold prices seem to be negatively correlated with the US Dollar index and to the Euro-Dollar deposit rate, which confirms the predictions made in the previous section. However, unlike the coefficient of the two-period lagged S&P 500 stock index, all other coefficients are not statistically significant.
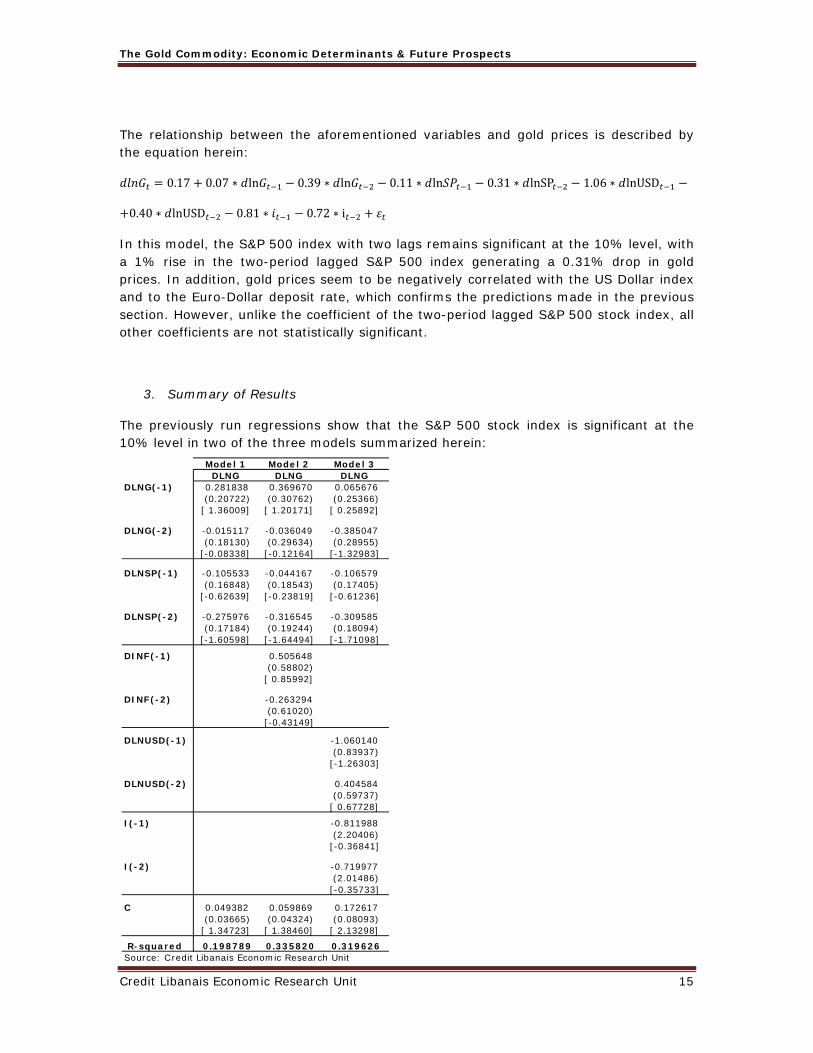
3. Summary of Results
The previously run regressions show that the S&P 500 stock index is significant at the 10% level in two of the three models summarized herein:
Model 1 Model 2 Model 3DLNG DLNG DLNG
DLNG(-1) 0.281838 0.369670 0.065676 (0.20722) (0.30762) (0.25366)[ 1.36009] [ 1.20171] [ 0.25892]
DLNG(-2) -0.015117 -0.036049 -0.385047 (0.18130) (0.29634) (0.28955)[-0.08338] [-0.12164] [-1.32983]
DLNSP(-1) -0.105533 -0.044167 -0.106579 (0.16848) (0.18543) (0.17405)[-0.62639] [-0.23819] [-0.61236]
DLNSP(-2) -0.275976 -0.316545 -0.309585 (0.17184) (0.19244) (0.18094)[-1.60598] [-1.64494] [-1.71098]
DINF(-1) 0.505648 (0.58802)[ 0.85992]
DINF(-2) -0.263294 (0.61020)[-0.43149]
DLNUSD(-1) -1.060140 (0.83937)[-1.26303]
DLNUSD(-2) 0.404584 (0.59737)[ 0.67728]
I(-1) -0.811988 (2.20406)[-0.36841]
I(-2) -0.719977 (2.01486)[-0.35733]
C 0.049382 0.059869 0.172617 (0.03665) (0.04324) (0.08093)[ 1.34723] [ 1.38460] [ 2.13298]
R-squared 0.198789 0.335820 0.319626Source: Credit Libanais Economic Research Unit

The Gold Commodity: Economic Determinants & Future Prospects
Credit Libanais Economic Research Unit 16
Based on the R-Squared of the previously discussed models, it is the second model that best explains the changes in gold prices, with an R-squared of 0.34. Under this specification, the natural logarithm of the S&P 500 stock index with two lags is significant at the 10% level, which leads us to conclude that a 1% increase in the two-period lagged S&P 500 stock index leads to a 0.32% drop in gold prices. All other variables are not significant at the 10% level.
III. FORECASTS
A. Technical Analysis
The following chart depicts the evolution of gold prices over the past 10 years, shedding light on the sharp rise in prices during the 2004-2011 period, followed by a steep decline afterwards in prices amid the gradual recovery of the United States’ economy.
After registering an exponential growth over the 2004-2012 period, the 200 days moving average of gold prices lost pace since the year 2013 and is currently growing at a logarithmic trend. Subsequently, gold prices’ 200 days moving average could reverse its upward trend in the near future and bring back gold prices just above their pre-crisis value of around $1,000 per ounce.

The Gold Commodity: Economic Determinants & Future Prospects
Credit Libanais Economic Research Unit 17
dlnG (2014) -0.19lnG (2014) 6.90G (2014) 996.65$
Gold Prices Forecasts
B. Forecasts based on the VAR Model
The VAR models developed in the previous section link the fluctuation of gold prices to past values of different variables, namely the S&P 500 stock index, the world inflation rate, interest rates, and the exchange rate index of the US Dollar against major currencies.
As already discussed, the econometric model that best explains the fluctuations in gold prices is the second model, with an R-squared of 0.34. Therefore, in order to forecast the value of gold prices we use the model 2 which determines the value of gold prices based on the past values of gold prices, the S&P 500 stock index, and the world inflation rate, as depicted by the following equation:
0.06 0.37 ln 0.04 ln 0.04 ln 0.32 lnSP
0.51 inf 0.26 inf
Based on this equation, we calculate dlnG (the natural logarithm of gold prices in first difference) for the year 2014.
It is worth noting that is determined by the following equation:
Hence we can write
and
Finally,
The results are detailed in the following table:
The model developed in this paper leads us to conclude that gold prices have a tendency to slip to around $997 per ounce by year-end 2014, and this amid the improvement witnessed in major stock markets in recent years, coupled with a receding world inflation rate on the back of the gradual tapering in the Fed’s quantitative easing. Our forecast of the price of gold may have to be revisited in the event of any major world economic shock.
It is worth noting, in this context, that the aforementioned reduction in the Fed’s expansionary monetary policy could backfire on the performance of US stock markets and lift gold prices to higher grounds. Nevertheless, this scenario is highly unlikely to happen, given that investors had already integrated the impact of the tapering of the Fed’s quantitative easing in their anticipations, and stock markets have already reacted to the news.

The Gold Commodity: Economic Determinants & Future Prospects
Credit Libanais Economic Research Unit 18
Economic Research Unit Sofil Center – Charles Malek Avenue Ashrafieh 1100 2811 P.O.Box 16-6729 Beirut, Lebanon Tel: +961-1-326 786 Fax: +961-1-326 786 E-mail: [email protected] www.creditlibanais.com.lb