The Global Volatile Signature of Veal via Solid-phase ...
9
700 Korean J. Food Sci. An. Vol. 34, No. 5, pp. 700~708(2014) DOI http://dx.doi.org/10.5851/kosfa.2014.34.5.700 The Global Volatile Signature of Veal via Solid-phase Microextraction and Gas Chromatography-mass Spectrometry Jinmei Wei, Kun Wan, Yuzhu Luo*, and Li Zhang Gansu Agricultural University, Gansu Key Laboratory of Herbivorous Animal Biotechnology, Lanzhou 730070, China Abstract The volatile composition of veal has yet to be reported and is one of the important factors determining meat character and quality. To identify the most important aroma compounds in veal from Holstein bull calves fed one of three diets, samples were subjected to solid-phase microextraction (SPME) combined with gas chromatography-quadrupole mass spectrometry (GC-MS). Most of the important odorants were aldehydes and alcohols. For group A (veal calves fed entirely on milk for 90 d before slaughter), the most abundant compound class was the aldehydes (52.231%), while that was alcohols (26.260%) in group C (veal calves fed starter diet for at least 60 d before slaughter). In both classes the absolute percentages of the volatile compounds in veal were different indicating that the veal diet significantly (p<0.05) affected headspace volatile composition in veal as determined by principal component analysis (PCA). Twenty three volatile compounds showed sig- nificance by using a partial least-squared discriminate analysis (PLS-DA) (VIP>1). The establishment of the global volatile signature of veal may be a useful tool to define the beef diet that improves the organoleptic characteristics of the meat and consequently impacts both its taste and economic value. Keywords: veal, volatile, SPME-GC-MS, PCA, PLS-DA Introduction Veal is more tender and juicy than fully aged beef, yet a detailed characterization of its volatile components is currently missing in the literature (Mao et al., 2011). The volatile composition of meat is one of the most important factors that determine its taste, character, and quality (Gorraiz et al., 2002; Tan et al., 2004). Consumers con- tinue to demand high-quality and consistent meats at a reasonable price (Stetzer et al., 2008). The sensory traits that mostly affect consumer acceptability of beef are ten- derness and flavor (Robbins et al., 2003a, b). To date, more than 1000 volatile compounds contributing to the odor of cooked meat have been identified (Lee et al., 2012; Rivas-Cañedo et al., 2009; Wang et al., 2006; Wat- kins et al., 2012). As with many food products the aroma of beef is influenced by hundreds of volatile organic com- pounds (VOCs) and semi-volatile organic compounds (SVOCs) belonging to different chemical families includ- ing ketones, esters, aldehydes, alcohols, acids, carbonyl compounds, sulphur compounds, and many others (Moon et al., 2006; Tan et al., 2004). The Maillard reaction, thiamin degradation, and lipid oxidation are the main reactions that generate flavor when meat is cooked (Calkins et al., 2007; Koutsidis et al., 2008a, b; Varavinit et al., 2000). It showed that ben- zene and furan compounds were stewed beef flavor com- ponents (Shi et al., 2011) and 4-hydroxy-2, 5-dimethyl-3 (2H)-furanone and 4-hydroxyl-5-methyl-3 (2H)-furanone were very important for high impact beef flavor (Guth et al., 1994). Then, many of the VOCs and SVOCs are gen- erally present in trace amounts (from several mg/L to a few ng/L, or even less), which means that an effective ex- traction technique to enrich or concentrate the analytes as well as a sensitive detection scheme are required for pro- per measurement. Previously, several methodologies in- volving static headspace analysis (Guth et al., 1994), purge and trap (Insausti et al., 2005), distillation/extraction tech- niques (Gasser et al., 1988), and concentration on solid- phase supports (solid-phase extraction-SPE) followed by analysis using gas chromatography-mass spectrometry (GC-MS) (Ruiz et al., 1998) have been widely proposed and used to establish the aroma profile of beef. An artifi- *Corresponding author: Yuzhu Luo, Gansu Agricultural Univer- sity, Gansu Key Laboratory of Herbivorous Animal Biotech- nology, Lanzhou 730070, China. Tel: +86-931-7632-483. Fax: +86-931-7632-483. E-mail: [email protected] ARTICLE
Transcript of The Global Volatile Signature of Veal via Solid-phase ...
700
Korean J. Food Sci. An.
Vol. 34, No. 5, pp. 700~708(2014)
DOI http://dx.doi.org/10.5851/kosfa.2014.34.5.700
The Global Volatile Signature of Veal via Solid-phase Microextraction
and Gas Chromatography-mass Spectrometry
Jinmei Wei, Kun Wan, Yuzhu Luo*, and Li Zhang
Gansu Agricultural University, Gansu Key Laboratory of Herbivorous Animal Biotechnology,
Lanzhou 730070, China
Abstract
The volatile composition of veal has yet to be reported and is one of the important factors determining meat character and
quality. To identify the most important aroma compounds in veal from Holstein bull calves fed one of three diets, samples
were subjected to solid-phase microextraction (SPME) combined with gas chromatography-quadrupole mass spectrometry
(GC-MS). Most of the important odorants were aldehydes and alcohols. For group A (veal calves fed entirely on milk for
90 d before slaughter), the most abundant compound class was the aldehydes (52.231%), while that was alcohols (26.260%)
in group C (veal calves fed starter diet for at least 60 d before slaughter). In both classes the absolute percentages of the
volatile compounds in veal were different indicating that the veal diet significantly (p<0.05) affected headspace volatile
composition in veal as determined by principal component analysis (PCA). Twenty three volatile compounds showed sig-
nificance by using a partial least-squared discriminate analysis (PLS-DA) (VIP>1). The establishment of the global volatile
signature of veal may be a useful tool to define the beef diet that improves the organoleptic characteristics of the meat and
consequently impacts both its taste and economic value.
Keywords: veal, volatile, SPME-GC-MS, PCA, PLS-DA
Introduction
Veal is more tender and juicy than fully aged beef, yet
a detailed characterization of its volatile components is
currently missing in the literature (Mao et al., 2011). The
volatile composition of meat is one of the most important
factors that determine its taste, character, and quality
(Gorraiz et al., 2002; Tan et al., 2004). Consumers con-
tinue to demand high-quality and consistent meats at a
reasonable price (Stetzer et al., 2008). The sensory traits
that mostly affect consumer acceptability of beef are ten-
derness and flavor (Robbins et al., 2003a, b). To date,
more than 1000 volatile compounds contributing to the
odor of cooked meat have been identified (Lee et al.,
2012; Rivas-Cañedo et al., 2009; Wang et al., 2006; Wat-
kins et al., 2012). As with many food products the aroma
of beef is influenced by hundreds of volatile organic com-
pounds (VOCs) and semi-volatile organic compounds
(SVOCs) belonging to different chemical families includ-
ing ketones, esters, aldehydes, alcohols, acids, carbonyl
compounds, sulphur compounds, and many others (Moon
et al., 2006; Tan et al., 2004).
The Maillard reaction, thiamin degradation, and lipid
oxidation are the main reactions that generate flavor
when meat is cooked (Calkins et al., 2007; Koutsidis et
al., 2008a, b; Varavinit et al., 2000). It showed that ben-
zene and furan compounds were stewed beef flavor com-
ponents (Shi et al., 2011) and 4-hydroxy-2, 5-dimethyl-3
(2H)-furanone and 4-hydroxyl-5-methyl-3 (2H)-furanone
were very important for high impact beef flavor (Guth et
al., 1994). Then, many of the VOCs and SVOCs are gen-
erally present in trace amounts (from several mg/L to a
few ng/L, or even less), which means that an effective ex-
traction technique to enrich or concentrate the analytes as
well as a sensitive detection scheme are required for pro-
per measurement. Previously, several methodologies in-
volving static headspace analysis (Guth et al., 1994), purge
and trap (Insausti et al., 2005), distillation/extraction tech-
niques (Gasser et al., 1988), and concentration on solid-
phase supports (solid-phase extraction-SPE) followed by
analysis using gas chromatography-mass spectrometry
(GC-MS) (Ruiz et al., 1998) have been widely proposed
and used to establish the aroma profile of beef. An artifi-
*Corresponding author: Yuzhu Luo, Gansu Agricultural Univer-
sity, Gansu Key Laboratory of Herbivorous Animal Biotech-
nology, Lanzhou 730070, China. Tel: +86-931-7632-483. Fax:
+86-931-7632-483. E-mail: [email protected]
ARTICLE
Global Volatile Signature of Veal 701
cial nose (an electronic nose) was used to give an objec-
tive basis for odor and flavor identification that correlates
with human sensory experience (Wilkes et al., 2000).
Nevertheless, these methodologies have important lim-
itations including their relatively low reproducibility, low
selectivity, and loss of analytes during concentration.
Additionally, they require the use of toxic and expensive
solvents, and are time consuming and labor-intensive.
More recently, solvent-free methodologies that overcome
these drawbacks have been widely used, such as solid-
phase microextraction (SPME) (Watkins et al., 2012). The
SPME methodology is very suitable for organic analytical
chemistry because it is a fast, simple, and sensitive proce-
dure that eliminates the use of organic solvents and com-
bines sampling, extraction, and concentration into a single
step, substantially shortening analysis time. For these rea-
sons, there are many applications of SPME in food anal-
ysis. While this approach has been used to analyze the
volatile composition of beef, to the best of our knowl-
edge, there were not the documents which determined the
volatile composition in veal, yet. This study reports the
development of a reliable and solvent-free SPME-GC-MS
methodology to establish the global volatile signature of
veal. “Unsupervised” principal component analysis (PCA)
and “Supervised” partial least-squared discriminate anal-
ysis (PLS-DA) were used to process the GC-MS data to
determine which volatile compounds show significance
in veal.
Materials and Methods
Materials
The divinylbenzene/Carboxen®/polydimethylsilicone (50/
30 µm DVB/CAR/PDMS) SPME fiber (Cat. no. 57329-
U) glass vials were purchased from Supelco, Inc. (Austra-
lia). The SPME fiber was pre-conditioned at 250°C for 1
h according to the manufacturer's recommendation.
Experimental animals and samples
Fifteen 2-3 d old Holstein bull calves with the birth
weight from 35.01 to 37.77 kg (mean live weight [LW] =
36.14 kg) were selected, pre-fed entirely on milk for 5-
8 d and randomly divided into three groups: (A) whole
milk feeding group; (B) quantitative feeding group of
whole milk and calf starter diet; (C) ad libitum feeding
group of whole milk and calf starter diet. Each group con-
tained 5 animals. The quantities of milk and starter were
offered at 8% LW of calves (the exact experimental quan-
tity for milk and starter diet was shown in Table 1). Whole
milk was purchased from the dairy farm of Gansu Agri-
cultural University for daily feeding of the calves. Calf no.
1 pellet diet was purchased from the Boya Feed Co., Ltd,
China. Calf no. 1 pellet diet contained (as fed basis): corn
grain (460 g/kg), wheat bran (150 g/kg), whey powder
(50 g/kg), soybean meal (250 g/kg), molasses (55 g/kg),
CaHPO4(10 g/kg) mineral/vitamin premix (20 g/kg), and
limestone (5 g/kg).
All animals were slaughtered after 90 d. A hundred
grams of fresh veal longissimus dorsi muscle where the
branched-chain fatty acids are present at subthreshold
odour levels (Brennand et al., 1992) were collected, ho-
mogenized, mixed together in each feeding group. Sam-
ples were stored at -18°C for later use.
This study was performed in the dairy division of the
animal science training center at Gansu Agricultural Uni-
versity, Lanzhou, China. Experimental procedures and ani-
mal holding facilities respected the relevant animal pro-
tection legislation of China (Regulations on the manage-
ment of laboratory animal 1988, State Scientific and Te-
chnological Commission of the People's Republic of China;
Measures for the management of animal quarantine 2010,
Ministry of Agriculture of the People's Republic of
China). Animals were slaughtered at the experimental aba-
ttoir of Gansu Agricultural University (Lanzhou, China)
by exsanguination after stunning with a cartridge-fired
captive bolt stunner.
SPME procedure
The samples were removed from the freezer and allowed
to reach room temperature prior to analysis. A 10 g sam-
ple was placed in a vial to which 10 g of sodium chloride
(NaCl) was added. NaCl had salting-out effect, in order to
increase the organic volatile (Shi et al., 2011; Wei et al.,
2011). The vials and their contents were pre-heated at 90
Table 1. Grouping of Holstein bull calves and daily average feeding per animal
Group No. of calves1st month 2nd month 3rd month
Milk/kg Starter/kg Milk/kg Starter/kg Milk/kg Starter/kg
A 5 4.35 - 6.35 - 9.68 -
B 5 4.25 - 5.14 0.32 6.11 1.85
C 5 4.30 - 5.36 0.48 ad libitum ad libitum
702 Korean J. Food Sci. An., Vol. 34, No. 5 (2014)
±1°C for 60 min in a thermostatted bath. Then the tem-
perature was adjusted to 60±1°C prior to the insertion of
the DVB/CAR/PDMS SPME fiber into the headspace
where it was held for 40 min (Vasta et al., 2007). The
fiber was then withdrawn and manually inserted into the
GC injector to allow the adsorbed compounds to be trans-
ferred to the analytical column. The fiber was held in the
injector for 15 min.
GC-MS analysis
The volatile compounds were separated using an OV-
1701 MS fused silica capillary column (60 m × 0.25 mm
i.d. × 0.25 µm film thickness, Chromatographic Technol-
ogy R&D, Lanzhou Institute of Chemical Physics, Chinese
Academy of Sciences) in an Agilent GC-MS system (Agi-
lent Technologies, USA) utilizing a model 6890N gas ch-
romatograph and a model 5973N mass selective detector.
The GC oven temperature was initially held at 50°C for 1
min, increased at a rate of 3.5°C/min to 220°C where it
was held for a further 20 min. For SPME, the injector,
heated at 260°C, was held in the splitless mode for the
first 2 min of the analysis and then in the split mode
(20:1) for the remainder of the analysis. The SPME fiber
remained in the injector for 15 min to clean the fiber with
a solvent delay time of 3.5 min. Helium was used as the
carrier gas with a constant flow rate of 1.0 mL/min. The
MS was operated in electron ionisation mode (70 eV) and
data was acquired in full scan mode for range of 30 to
550 m/z. The temperature of the source and the detector
were 150 and 230°C, respectively, while the MS transfer
line was 280°C.
Multivariate data analysis and data processing
Compounds were identified by comparing the mass
spectra to those found in the NIST 05 mass spectral lib-
rary (NIST, 2005 software, Mass Spectral Search Pro-
gram V.2.0 d; NIST 2005, USA) by the match and the rel-
ative match (R. match) 80% (Qi et al., 2010). The GC
peak areas for each compound were calculated using the
total ion chromatogram, assuming a relative response fac-
tor of one for each compound. The results of the volatile
analysis were reported as percentages, representing the
proportion of each identified peak to the total area of
identified peaks in each chromatogram.
The resulting datasets were then imported into SIMCA-
P 11.5 (Umetrics, Sweden) for multivariate statistical ana-
lyses. All imported data were Pareto-scaled for the multi-
variate analysis. First, principal components analysis (PCA)
was conducted on the spectra of veal samples to discern
the presence of inherent similarities in spectral profiles.
Next, a PLS-DA was used to maximize covariance bet-
ween the measured data (peak intensities in GC-MS spec-
tra, X matrix) and the response variable (predictive clas-
sifications, Y matrix) by searching for X variables that
correlated with class membership and thus indicated that
the response variable Y can be predicted from X.
PLS-DA was also applied to the relative concentration
data of assigned volatile compounds. The variable impor-
tance in the projection (VIP) plot was then used to iden-
tify which volatile compound contributed most to clus-
tering or trends observed in the data.
Statistical analyses
The statistical analysis was conducted using SPSS 19
for Windows (SPSS Inc., IBM Corporation, USA). One-
way Analysis of Variance (ANOVA) was applied to test
differences between groups (A, B and C) for all variables
studied by VIP>1. Differences with a p-value of 0.05 were
considered significant. Assays were performed in quintu-
plicate, and the results were expressed as mean±SD.
Results and Discussion
Comparison of samples
More than 125 compounds were detected from longis-
simus dorsi muscle of veal fed 3 different feeding treat-
ment using SPME with GC-MS. Through comparison to
the NIST spectral library, a total of 9 ketones, 16 aldehy-
des, 11 alcohols, 9 hydrocarbons and 9 other compounds
were identified. Fourty seven of the 125 peaks gave a de-
finitive match in group A. These peaks accounted for
92.71% of all the compounds. Similarly, 50 and 44 com-
pounds were identified in group B and C; their content
accounted for 96.05% and 76.91%, respectively (Table 2).
Aldehydes, ketones, alcohols, and hydrocarbons were
the four main classes of compounds identified in the veal
samples. For group A, the most abundant compound class
was the aldehydes (52.231%), followed by the alcohols
(20.890%), hydrocarbons (5.296%), and the ketones
(3.749%). A similar trend was observed with group B and
C, but the percentages of four classes were different. In
group B, the aldehydes, alcohols, hydrocarbons and the
ketones were 49.631%, 22.558%, 6.308% and 3.053%,
respectively. They were 31.247%, 22.260%, 8.105% and
2.497% in group C, respectively. That is, the total GC peak
area percentage content (%) of the aldehydes was the hi-
ghest in group A and lowest in group C. The ketones sho-
wed the same trend as the aldehydes. However, the alco-
Global Volatile Signature of Veal 703
hols and hydrocarbons showed the opposite trend. The
percentage content (%) of alcohols was in the highest in
group C and lowest in group A, and hydrocarbons’ was
as the same. It suggested that marked differences existed
between the proportions of the extracted compounds by
SPME that were common to three groups.
PCA and PLS-DA
Here, “Unsupervised” PCA and “Supervised” PLS-DA
were used to process the GC-MS data. PCA and PLS-DA
were used because they cope well with highly multivari-
ate, noisy, collinear, and possibly incomplete data. PCA is
an unsupervised pattern recognition method initially used
Table 2. Volatile compounds of muscle longissimus dorsi from veal fed different dietsa
Peak
n
RT b
(min)Compounds
Molecular
formula
GC peak area (%)c±RSDd
A B C
Ketones
1 6.97 2-Butanone C4H
8O - - 0.279±0.012
6 12.15 3-Hydroxy-2-Butanone C4H
8O
20.295±0.007 0.583±0.027 0.262±0.0280
10 17.84 2-Heptanone C7H
14O 0.878±0.069 0.577±0.012 0.539±0.031
18 22.41 2-Octanone C8H
16O 0.566±0.109 0.439±0.040 0.409±0.010
24 26.88 2-Nonanone C9H
18O 0.641±0.070 0.282±0.015 0.498±0.010
31 31.17 2-Decanone C10
H20
O 0.351±0.089 0.192±0.005 -
44 42.01 3-(3-Hydroxy-1-Propenyl)- Cyclopentanone C8H
12O
20.411±0.051 0.544±0.021 -
46 42.48 Dihydro-5-Propyl-2(3H)-Furanone C7H
12O
20.336±0.025 0.434±0.046 0.510±0.012
52 52.81 Butylidene-1(3H)-Isobenzofuranone C12
H12
O2
0.271±0.031 - -
Subtotal (GC peak area) 3.749±0.035 3.053±0.017 2.497±0.011
Subtotal compounds number 8 7 6
Aldehydes
3 9.58 Pentanal C5H
10O 0.940±0.049 0.623±0.062 0.326±0.022
8 13.56 Hexanal C6H
12O 17.665±0.393 21.424±0.261 10.158±0.145
11 18.07 Heptanal C7H
14O 4.632±0.252 3.601±0.154 2.647±0.088
12 18.28 (Z)-4-Heptenal C7H
12O 0.150±0.029 - -
15 21.83 (E)-2-Heptenal C7H
12O - 0.237±0.031 0.083±0.005
19 22.71 Octanal C8H
16O 9.314±0.211 6.789±0.308 5.525±0.241
25 27.2 Nonanal C9H
18O 16.562±0.484 12.268±0.240 9.359±0.261
30 30.79 (E)-2-Nonenal C9H
16O 0.136±0.011 0.936±0.092 0.361±0.015
32 31.32 cis-4-Decenal C10
H18
O 0.203±0.020 0.242±0.033 -
33 31.68 3-Ethyl-Benzaldehyde C9H
10O 0.144±0.010 0.279±0.017 0.164±0.015
37 34.92 (E)-2-Decenal C10
H18
O 0.239±0.040 0.480±0.035 0.178±0.013
39 37.43 4-(1-Methylethyl)-1-Cyclohexene-1-Carboxaldehyde C10
H16
O 0.319±0.028 0.319±0.027 0.479±0.029
41 38.82 2-Dodecenal C12
H22
O - 0.275±0.014 0.166±0.016
49 46.3 Undecanal C11
H22
O 0.291±0.015 0.439±0.039 0.284±0.009
51 49.53 Pentadecanal C15
H30
O 0.271±0.012 0.456±0.044 0.356±0.054
53 52.95 Tetradecanal C14
H28
O 1.364±0.041 1.266±0.047 1.163±0.068
Subtotal (GC peak area) 52.231±0.152 49.631±0.098 31.247±0.084
Subtotal compounds number 14 15 14
Alcohols
7 13.05 1-Pentanol C5H
12O 0.998±0.074 0.992±0.064 0.585±0.027
9 17.42 1-Hexanol C6H
14O 0.560±0.031 0.509±0.075 0.445±0.050
17 22.06 1-Octen-3-ol C8H
16O 8.447±0.318 8.448±0.400 6.360±0.309
21 25.2 2,4-Dimethyl-Cyclohexanol C8H
16O - 0.143±0.008 0.108±0.016
22 26.34 1-Octanol C8H
18O 1.464±0.072 2.373±0.182 1.191±0.119
23 26.67 (E)-2-Octen-1-ol C8H
16O 0.986±0.063 1.637±0.086 0.941±0.092
29 29.07 6-Undecanol C11
H24
O 0.205±0.028 0.263±0.034 0.134±0.017
36 33.75 6,10,13-Trimethyltetradecanol C17
H36
O 0.154±0.012 0.191±0.022 0.229±0.039
40 38.46 1-[2-Methyl-3-(methylthio)allyl]- Cyclohex-2-enol C11
H18
OS 1.190±0.101 1.210±0.087 2.478±0.163
42 39.02 2-Hexyl-1-Decanol C16
H34
O 0.467±0.040 0.500±0.033 0.440±0.026
43 39.16 1-(2-Nitropropyl)-Cyclohexanol C9H
17NO
36.418±0.144 6.292±0.175 13.349±0.239
Subtotal (GC peak area) 20.890±0.090 22.558±0.113 26.260±0.099
Subtotal compounds number 10 11 11
704 Korean J. Food Sci. An., Vol. 34, No. 5 (2014)
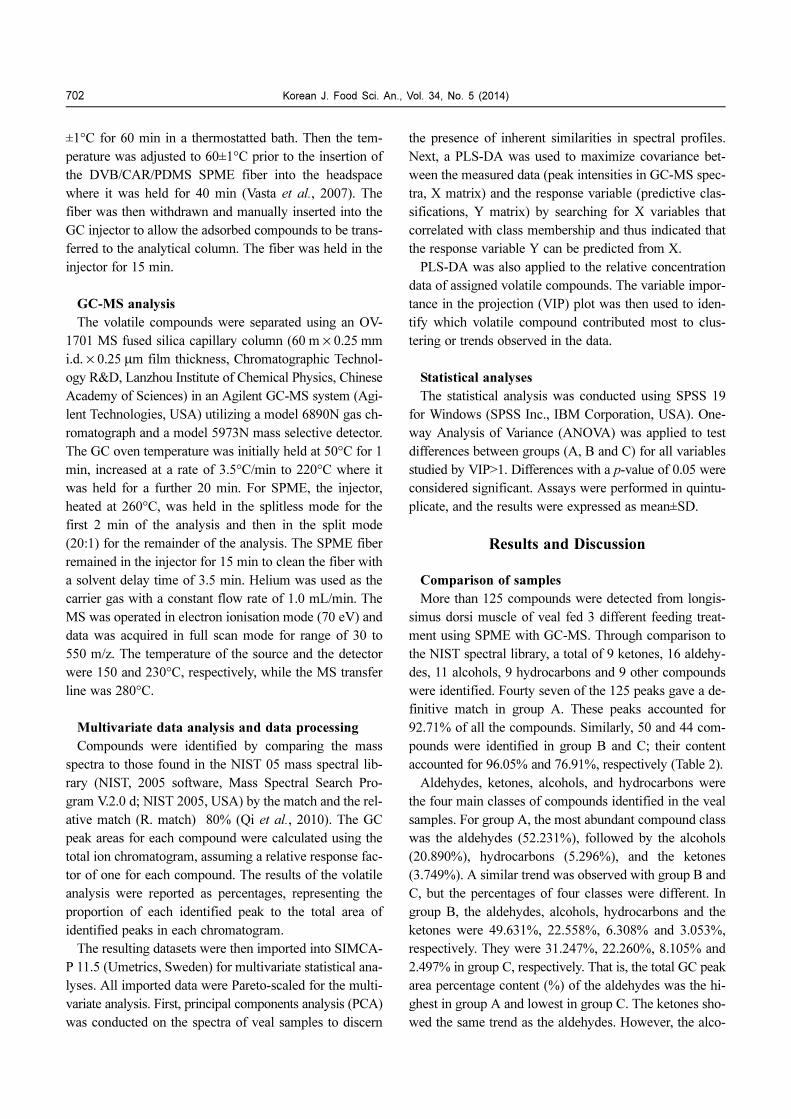
to discern the presence of inherent similarities in spectral
profiles (Rivas-Cañedo et al., 2009). The results are dis-
played as score plots indicating the scatter of the samples-
similar volatile compositions are clustered together and
different compositions are dispersed. In the PCA scores,
each point represents an individual sample, and further
composition differences are indicated by the PCA loading
plots. Therefore, PCA offers a clear visual representation
of the differences among the samples. It shows clear sep-
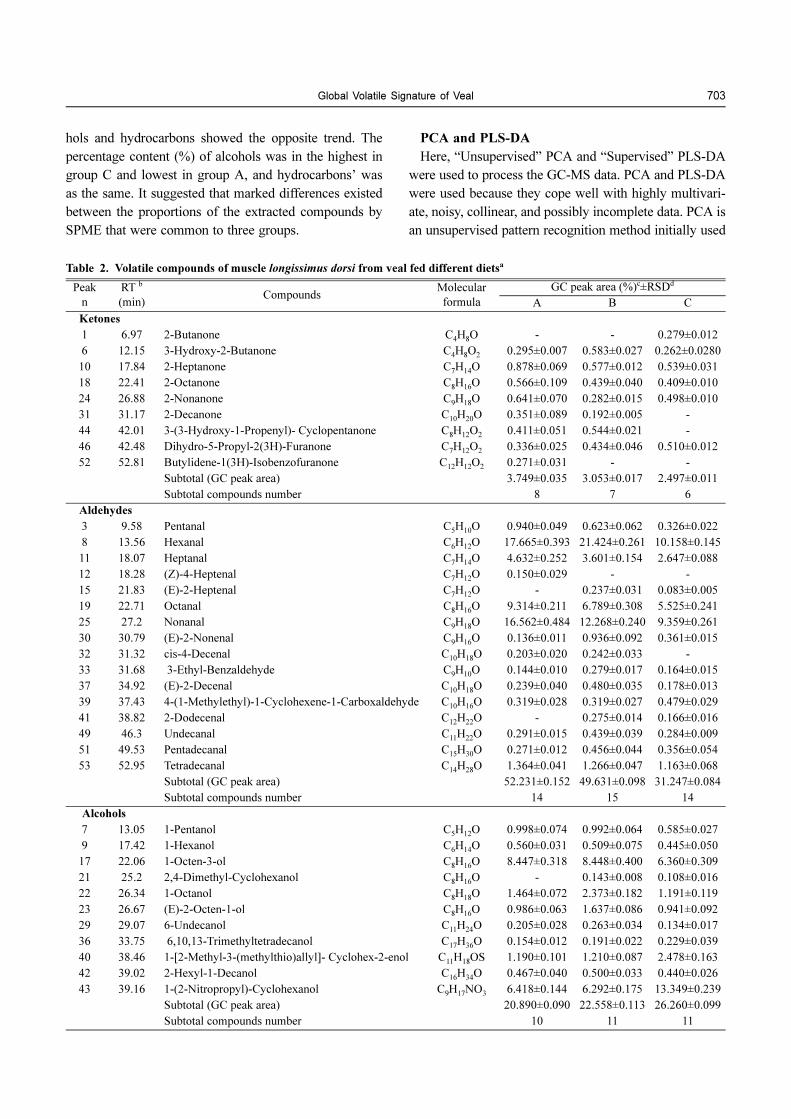
aration among the groups (R2X=0.909, Q2=0.871; Fig. 1).
R2X and Q2 expressed matrix of X explained and predic-
tive ability of matrix model established, respectively. Their
values were closer to 1 that showed the model was more
reliable. Here samples A1-A5 clustered together similar
to B1-B5 and C1-C5. There were some compounds that
did not definitely belong in groups A, B, or C while oth-
ers did. The scatter 3D plot shows a clear discrimination
between group A, group B, and group C (Fig. 2).
Next, PLS-DA was performed to reduce the possible
contribution of intergroup variability and to further imp-
rove the separation between the samples. The PLS-DA
analysis calculates models that differentiate groups or cla-
sses and among compounds. In the PLS-DA model, the
samples from the different groups were sorted into differ-
ent classes using score plots, and the compounds that
contribute to the classification were identified in loading
plots. These showed the importance of each variable to
the classification. Each score plot has a loading plot asso-
ciated with it, which makes it possible to identify the
spectral regions (compounds) that are responsible for the
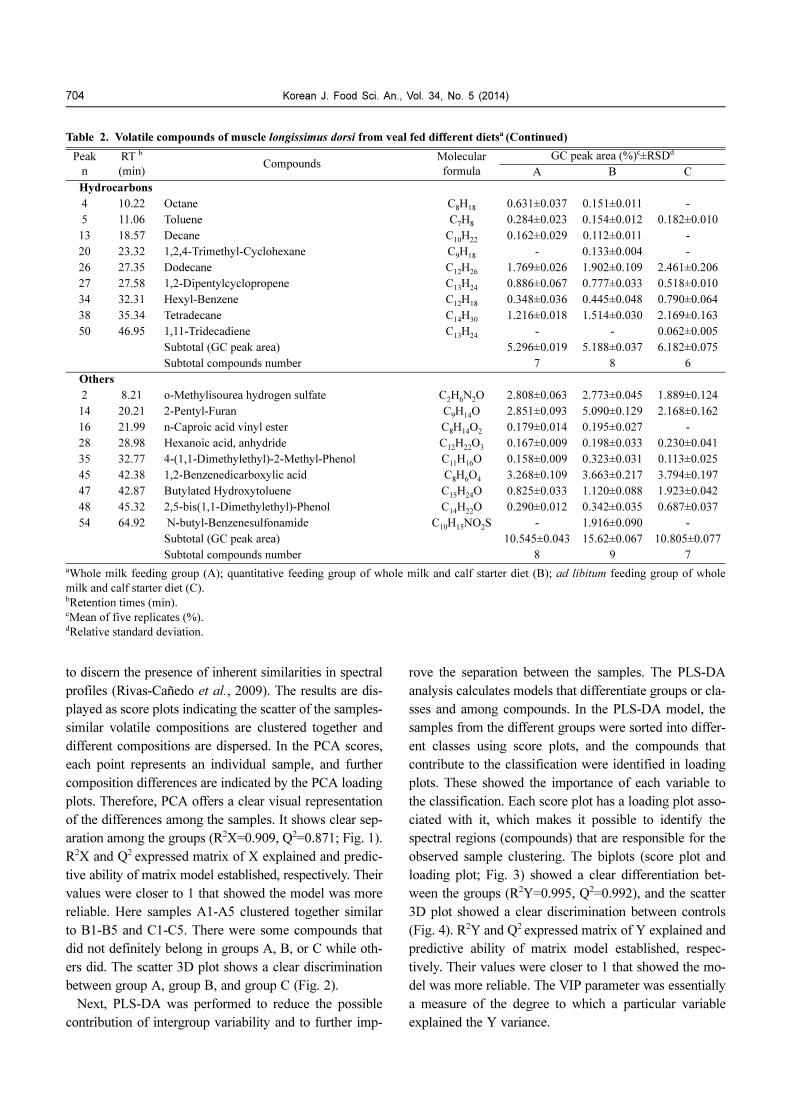
observed sample clustering. The biplots (score plot and
loading plot; Fig. 3) showed a clear differentiation bet-
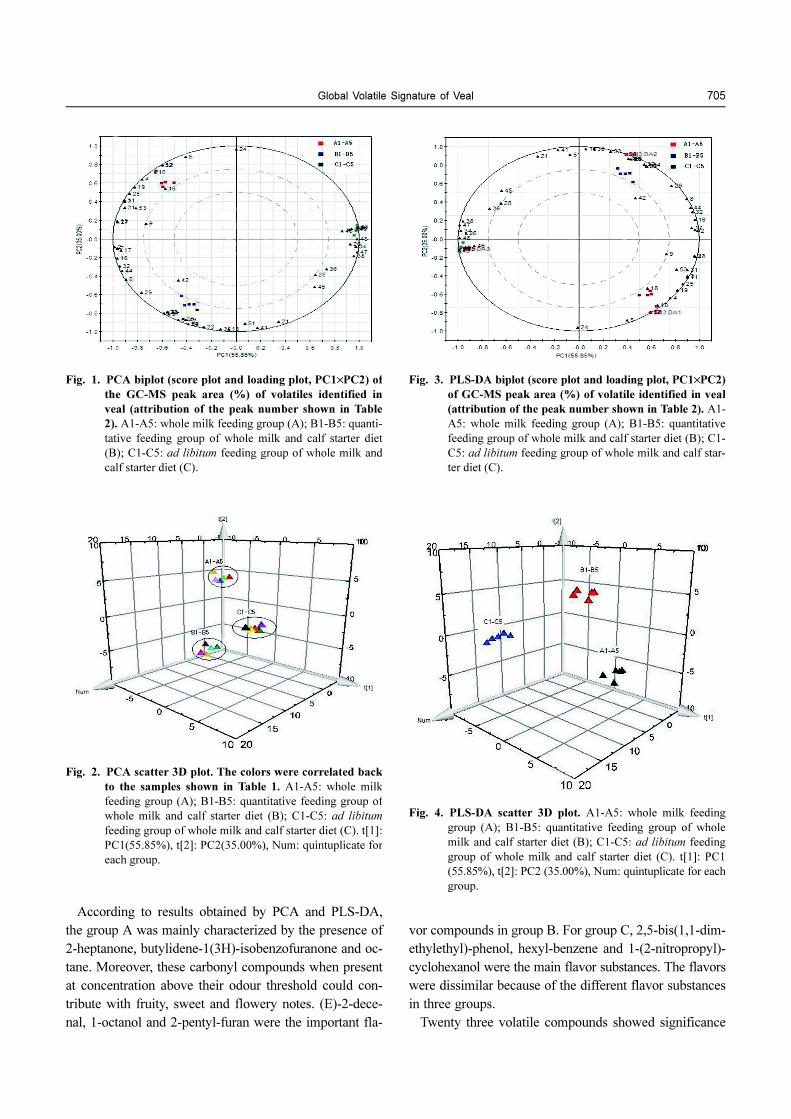
ween the groups (R2Y=0.995, Q2=0.992), and the scatter
3D plot showed a clear discrimination between controls
(Fig. 4). R2Y and Q2 expressed matrix of Y explained and
predictive ability of matrix model established, respec-
tively. Their values were closer to 1 that showed the mo-
del was more reliable. The VIP parameter was essentially
a measure of the degree to which a particular variable
explained the Y variance.
Table 2. Volatile compounds of muscle longissimus dorsi from veal fed different dietsa (Continued)
Peak
n
RT b
(min)Compounds
Molecular
formula
GC peak area (%)c±RSDd
A B C
Hydrocarbons
4 10.22 Octane C8H
180.631±0.037 0.151±0.011 -
5 11.06 Toluene C7H
80.284±0.023 0.154±0.012 0.182±0.010
13 18.57 Decane C10
H22
0.162±0.029 0.112±0.011 -
20 23.32 1,2,4-Trimethyl-Cyclohexane C9H
18- 0.133±0.004 -
26 27.35 Dodecane C12
H26
1.769±0.026 1.902±0.109 2.461±0.206
27 27.58 1,2-Dipentylcyclopropene C13
H24
0.886±0.067 0.777±0.033 0.518±0.010
34 32.31 Hexyl-Benzene C12
H18
0.348±0.036 0.445±0.048 0.790±0.064
38 35.34 Tetradecane C14
H30
1.216±0.018 1.514±0.030 2.169±0.163
50 46.95 1,11-Tridecadiene C13
H24
- - 0.062±0.005
Subtotal (GC peak area) 5.296±0.019 5.188±0.037 6.182±0.075
Subtotal compounds number 7 8 6
Others
2 8.21 o-Methylisourea hydrogen sulfate C2H
6N
2O 2.808±0.063 2.773±0.045 1.889±0.124
14 20.21 2-Pentyl-Furan C9H
14O 2.851±0.093 5.090±0.129 2.168±0.162
16 21.99 n-Caproic acid vinyl ester C8H
14O
20.179±0.014 0.195±0.027 -
28 28.98 Hexanoic acid, anhydride C12
H22
O3
0.167±0.009 0.198±0.033 0.230±0.041
35 32.77 4-(1,1-Dimethylethyl)-2-Methyl-Phenol C11
H16
O 0.158±0.009 0.323±0.031 0.113±0.025
45 42.38 1,2-Benzenedicarboxylic acid C
8H
6O
43.268±0.109 3.663±0.217 3.794±0.197
47 42.87 Butylated Hydroxytoluene C15
H24
O 0.825±0.033 1.120±0.088 1.923±0.042
48 45.32 2,5-bis(1,1-Dimethylethyl)-Phenol C14
H22
O 0.290±0.012 0.342±0.035 0.687±0.037
54 64.92 N-butyl-Benzenesulfonamide C10
H15
NO2S - 1.916±0.090 -
Subtotal (GC peak area) 10.545±0.043 15.62±0.067 10.805±0.077
Subtotal compounds number 8 9 7
aWhole milk feeding group (A); quantitative feeding group of whole milk and calf starter diet (B); ad libitum feeding group of whole
milk and calf starter diet (C).bRetention times (min).cMean of five replicates (%).dRelative standard deviation.
Global Volatile Signature of Veal 705
According to results obtained by PCA and PLS-DA,
the group A was mainly characterized by the presence of
2-heptanone, butylidene-1(3H)-isobenzofuranone and oc-
tane. Moreover, these carbonyl compounds when present
at concentration above their odour threshold could con-
tribute with fruity, sweet and flowery notes. (E)-2-dece-
nal, 1-octanol and 2-pentyl-furan were the important fla-
vor compounds in group B. For group C, 2,5-bis(1,1-dim-
ethylethyl)-phenol, hexyl-benzene and 1-(2-nitropropyl)-
cyclohexanol were the main flavor substances. The flavors
were dissimilar because of the different flavor substances
in three groups.
Twenty three volatile compounds showed significance
Fig. 1. PCA biplot (score plot and loading plot, PC1×PC2) of
the GC-MS peak area (%) of volatiles identified in
veal (attribution of the peak number shown in Table
2). A1-A5: whole milk feeding group (A); B1-B5: quanti-
tative feeding group of whole milk and calf starter diet
(B); C1-C5: ad libitum feeding group of whole milk and
calf starter diet (C).
Fig. 2. PCA scatter 3D plot. The colors were correlated back
to the samples shown in Table 1. A1-A5: whole milk
feeding group (A); B1-B5: quantitative feeding group of
whole milk and calf starter diet (B); C1-C5: ad libitum
feeding group of whole milk and calf starter diet (C). t[1]:
PC1(55.85%), t[2]: PC2(35.00%), Num: quintuplicate for
each group.
Fig. 3. PLS-DA biplot (score plot and loading plot, PC1×PC2)
of GC-MS peak area (%) of volatile identified in veal
(attribution of the peak number shown in Table 2). A1-
A5: whole milk feeding group (A); B1-B5: quantitative
feeding group of whole milk and calf starter diet (B); C1-
C5: ad libitum feeding group of whole milk and calf star-
ter diet (C).
Fig. 4. PLS-DA scatter 3D plot. A1-A5: whole milk feeding
group (A); B1-B5: quantitative feeding group of whole
milk and calf starter diet (B); C1-C5: ad libitum feeding
group of whole milk and calf starter diet (C). t[1]: PC1
(55.85%), t[2]: PC2 (35.00%), Num: quintuplicate for each
group.
706 Korean J. Food Sci. An., Vol. 34, No. 5 (2014)
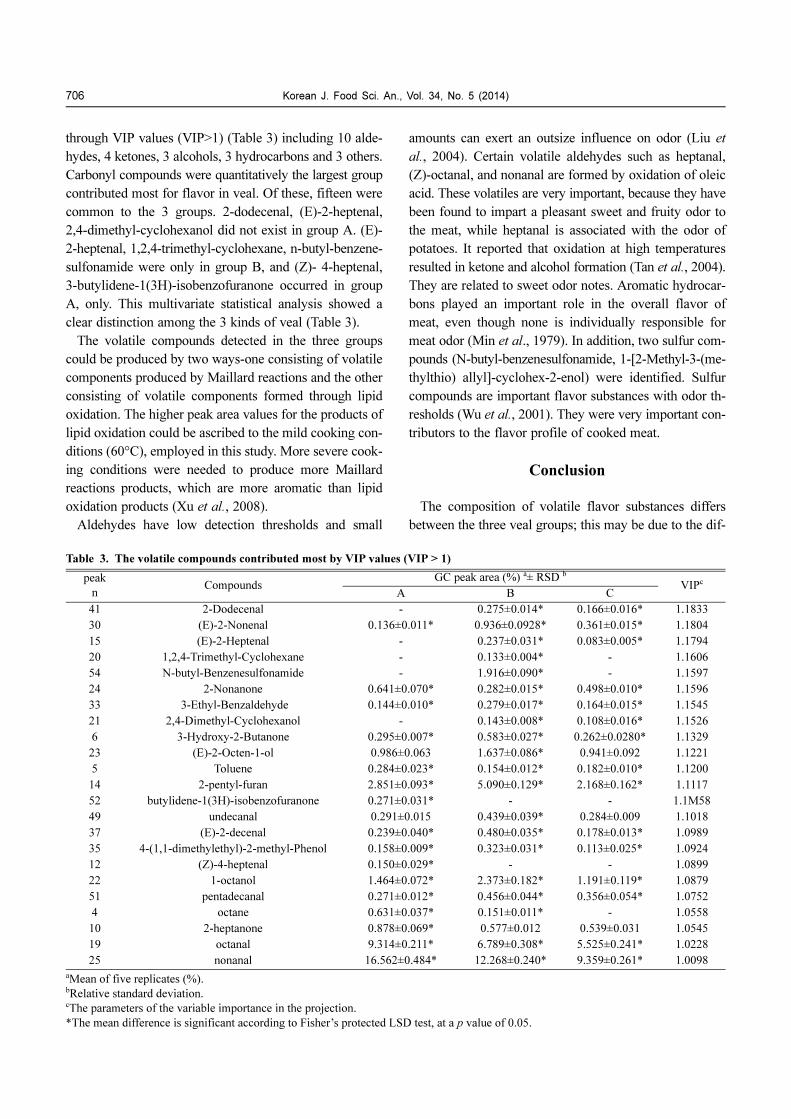
through VIP values (VIP>1) (Table 3) including 10 alde-
hydes, 4 ketones, 3 alcohols, 3 hydrocarbons and 3 others.
Carbonyl compounds were quantitatively the largest group
contributed most for flavor in veal. Of these, fifteen were
common to the 3 groups. 2-dodecenal, (E)-2-heptenal,
2,4-dimethyl-cyclohexanol did not exist in group A. (E)-
2-heptenal, 1,2,4-trimethyl-cyclohexane, n-butyl-benzene-
sulfonamide were only in group B, and (Z)- 4-heptenal,
3-butylidene-1(3H)-isobenzofuranone occurred in group
A, only. This multivariate statistical analysis showed a
clear distinction among the 3 kinds of veal (Table 3).
The volatile compounds detected in the three groups
could be produced by two ways-one consisting of volatile
components produced by Maillard reactions and the other
consisting of volatile components formed through lipid
oxidation. The higher peak area values for the products of
lipid oxidation could be ascribed to the mild cooking con-
ditions (60°C), employed in this study. More severe cook-
ing conditions were needed to produce more Maillard
reactions products, which are more aromatic than lipid
oxidation products (Xu et al., 2008).
Aldehydes have low detection thresholds and small
amounts can exert an outsize influence on odor (Liu et
al., 2004). Certain volatile aldehydes such as heptanal,
(Z)-octanal, and nonanal are formed by oxidation of oleic
acid. These volatiles are very important, because they have
been found to impart a pleasant sweet and fruity odor to
the meat, while heptanal is associated with the odor of
potatoes. It reported that oxidation at high temperatures
resulted in ketone and alcohol formation (Tan et al., 2004).
They are related to sweet odor notes. Aromatic hydrocar-
bons played an important role in the overall flavor of
meat, even though none is individually responsible for
meat odor (Min et al., 1979). In addition, two sulfur com-
pounds (N-butyl-benzenesulfonamide, 1-[2-Methyl-3-(me-
thylthio) allyl]-cyclohex-2-enol) were identified. Sulfur
compounds are important flavor substances with odor th-
resholds (Wu et al., 2001). They were very important con-
tributors to the flavor profile of cooked meat.
Conclusion
The composition of volatile flavor substances differs
between the three veal groups; this may be due to the dif-
Table 3. The volatile compounds contributed most by VIP values (VIP > 1)
peak
nCompounds
GC peak area (%) a± RSD bVIPc
A B C
41 2-Dodecenal - 0.275±0.014* 0.166±0.016* 1.1833
30 (E)-2-Nonenal 0.136±0.011* 0.936±0.0928* 0.361±0.015* 1.1804
15 (E)-2-Heptenal - 0.237±0.031* 0.083±0.005* 1.1794
20 1,2,4-Trimethyl-Cyclohexane - 0.133±0.004* - 1.1606
54 N-butyl-Benzenesulfonamide - 1.916±0.090* - 1.1597
24 2-Nonanone 0.641±0.070* 0.282±0.015* 0.498±0.010* 1.1596
33 3-Ethyl-Benzaldehyde 0.144±0.010* 0.279±0.017* 0.164±0.015* 1.1545
21 2,4-Dimethyl-Cyclohexanol - 0.143±0.008* 0.108±0.016* 1.1526
6 3-Hydroxy-2-Butanone 0.295±0.007* 0.583±0.027* 0.262±0.0280* 1.1329
23 (E)-2-Octen-1-ol 0.986±0.063 1.637±0.086* 0.941±0.092 1.1221
5 Toluene 0.284±0.023* 0.154±0.012* 0.182±0.010* 1.1200
14 2-pentyl-furan 2.851±0.093* 5.090±0.129* 2.168±0.162* 1.1117
52 butylidene-1(3H)-isobenzofuranone 0.271±0.031* - - 1.1M58
49 undecanal 0.291±0.015 0.439±0.039* 0.284±0.009 1.1018
37 (E)-2-decenal 0.239±0.040* 0.480±0.035* 0.178±0.013* 1.0989
35 4-(1,1-dimethylethyl)-2-methyl-Phenol 0.158±0.009* 0.323±0.031* 0.113±0.025* 1.0924
12 (Z)-4-heptenal 0.150±0.029* - - 1.0899
22 1-octanol 1.464±0.072* 2.373±0.182* 1.191±0.119* 1.0879
51 pentadecanal 0.271±0.012* 0.456±0.044* 0.356±0.054* 1.0752
4 octane 0.631±0.037* 0.151±0.011* - 1.0558
10 2-heptanone 0.878±0.069* 0.577±0.012 0.539±0.031 1.0545
19 octanal 9.314±0.211* 6.789±0.308* 5.525±0.241* 1.0228
25 nonanal 16.562±0.484* 12.268±0.240* 9.359±0.261* 1.0098
aMean of five replicates (%).bRelative standard deviation.cThe parameters of the variable importance in the projection.
*The mean difference is significant according to Fisher’s protected LSD test, at a p value of 0.05.
Global Volatile Signature of Veal 707
ferent diets. It showed similar result with Resconi et al.
(2010) and Vasta et al. (2011). Our preliminary data sug-
gested that the main flavor components of veal including
(E)-2-nonenal, (E)-2-heptenal, 1,2,4-trimethyl-cyclohex-
ane, N-butyl-benzenesulfonamide, 2-nonanone, 3-ethyl-
benzaldehyde, 2,4-dimethyl-cyclohexanol, 3-hydroxy-2-bu-
tanone, (E)-2-octen-1-ol,toluene, 2-pentyl-furan, 3-butyl-
idene-1(3H)-isobenzofuranone, undecanal, (E)-2-decenal,
4-(1,1-dimethylethyl)-2-methyl-Phenol, (Z)-4-heptenal, 1-
octanol, pentadecanal, octane, 2-heptanone, octanal, and
nonanal.
Our study has improved the understanding of the influ-
ence of the finishing diet on the volatile components con-
tained in veal and contributes to the development of diets
for veal that meet consumer expectations in different mar-
kets. It also provided a scientific reference for the future
production of high-quality veal. However, the study of
volatile substances of veal is still in its infancy. Further
research using gas chromatography-olfactometry (GC-O)
is needed for confirmation of our results.
Acknowledgements
This project was funded by the National Key Technol-
ogy R&D Program (2007BAD52B05), Gansu Key Lab
Construction Program (085RTSA004) and the Innovation
Fund Project of Gansu Agricultural University. The au-
thors also gratefully acknowledge the team of the Gansu
Key Laboratory of Herbivorous Animal Biotechnology for
sample manufacture.
References
1. Brennand, C. P. and Lindsay, R. C. (1992) Distribution of vo-
latile branched-chain fatty acids in various lamb tissues. Meat
Sci. 31, 411-421.
2. Calkins, C. R. and Hodgen, J. M. (2007) A fresh look at meat
flavor. Meat Sci. 77, 63-80.
3. Gasser, U. and Grosch, W. (1988) Identification of volatile fla-
vour compounds with high aroma values from cooked beef.
Z. Lebensm. Unters. Forsch. 186, 489-494.
4. Gorraiz, C., Beriain, M. J., Chasco, J., and Insausti, K. (2002)
Effect of aging time on volatile compounds, odor, and flavor
of cooked beef from pirenaica and friesian bulls and heifers.
J. Food Sci. 67, 916-922.
5. Guth, H. and Grosch, W. (1994) Identification of the charac-
ter impact odorants of stewed beef juice by instrumental
analyses and sensory studies. J. Agric. Food Chem. 42, 2862-
2866.
6. Insausti, K., Goñi, V., Petri, E., Gorraiz, C., and Beriain, M. J.
(2005) Effect of weight at slaughter on the volatile compo-
unds of cooked beef from Spanish cattle breeds. Meat Sci.
70, 3-90.
7. Koutsidis, G., Elmore, J. S., Oruna-Concha, M. J., Campo, M.
M., Wood, J. D., and Mottram, D. S. (2008a) Water-soluble
precursors of beef flavour. Meat Sci. 79, 270-277.
8. Koutsidis, G., Elmore, J. S., Oruna-Concha, M. J., Campo, M.
M., Wood, J. D., and Mottram, D. S. (2008b) Water-soluble
precursors of beef flavour. Part II: Effect of post-mortem
conditioning. Meat Sci. 79, 124-130.
9. Lee, K. H., Yun, H., Lee, J. W., Ahn, D. U., Lee, E. J., and Jo,
C. (2012) Volatile compounds and odor preferences of ground
beef added with garlic and red wine, and irradiated with char-
coal pack. Radiat. Phys. Chem. 81, 1103-1106.
10. Liu, Y., Xu, X. L., and Zhou, G. H. (2004) Report of flavor for
Nanjing soysauce beef. Jiangsu Agric. Sci. 5, 101-104.
11. Mao, J. W. and Xu, H. Z. (2011) Influence factors on young
white beef and industrial development. China Cattle Sci. 37,
56-58.
12. Min, D. B. S., Ina, K., Peterson, R. J., and Chang, S. S. (1979)
Preliminary identification of volatile flavor compounds in the
neutral fraction of roast beef. J. Food Sci. 44, 639-642.
13. Moon, S. Y., Margaret, A. C., Eunice, C. Y., and Li, C. (2006)
Odour-active components of simulated beef flavour analysed
by solid phase microextraction and gas chromatography-mass
spectrometry-olfactometry. Food Res. Int. 39, 294-308.
14. Qi, Y. M., Sun, B. G., Huang, M. Q., Liu, Y. P., and Chen, H.
T. (2010) Analysis of volatile compounds in Yueshengzhai
spiced beef by simultaneous distillation extraction and gas
chromatography-mass spectrometry. Food Sci. 31, 370-374.
15. Rivas-Cañedo, A., Fernández-García, E., and Nuñez, M.
(2009) Volatile compounds in fresh meats subjected to high
pressure processing: Effect of the packaging material. Meat
Sci. 81, 321-328.
16. Resconi, V. C., Campo, M. M., Montossi, F., Ferreira, V., Sa-
ñudo, C., and Escudero, A. (2010) Relationship between odo-
ur-active compounds and flavour perception in meat from
lambs fed different diets. Meat Sci. 85, 700-706.
17. Robbins, K., Jensen, J., Ryan, K. J., Homco-Ryan, C., McK-
eith, F. K., and Brewer, M. S. (2003a) Effects of dietary vita-
min E supplementation on textual and aroma attributes of en-
hanced beef clod roasts in a cook/hot-hold situation. Meat
Sci. 65, 317-322.
18. Robbins, K., Jensen, J., Ryan, K. J., Homco-Ryan, C., McK-
eith, F. K., and Brewer, M. S. (2003b) Consumer attitudes to-
wards beef and acceptability of enhanced beef. Meat Sci. 65,
721-729.
19. Ruiz, J., Cava, R., Ventanas, J., and Jensen, M. (1998) Head-
space solid phase microextraction for the analysis of volatiles
in a meat product dry cured Iberian ham. J. Agric. Food Chem.
46, 4688-4694.
20. Shi, X. X., Yu, Q. L., and Tian, J. C. (2011) Changes in main
volatile compounds during aging process of Yak meat. Trans-
actions of the Chinese Society for Agric. Machinery 42, 144-
147.
21. Stetzer, A. J., Cadwallader, K., Singh, T. K., Mckeith, F. K.,
and Brewer, M. S. (2008) Effect of enhancement and ageing
708 Korean J. Food Sci. An., Vol. 34, No. 5 (2014)
on flavor and volatile compounds in various beef muscles.
Meat Sci. 79, 13-19.
22. Tan, B. and Ding, X. X. (2004) Flavor compounds-A review.
China Food Addit. 6, 73-79.
23. Varavinit, S., Shobsngob, S., Bhidyachakorawat, M., and Su-
phantharik, M. (2000) Production of meat-like flavor. Sci.
Asia 26, 219-224.
24. Vasta, V., Luciano, G., Dimauro, C., Röhrle, F., Priolo, A., Mo-
nahan, F. J., and Moloney, A. P. (2011) The volatile profile of
longissimus dorsi muscle of heifers fed pasture, pasture silage
or cereal concentrate. Meat Sci. 87, 282-289.
25. Vasta, V., Ratel, J., and Engel, E. (2007) Mass spectrometry
analysis of volatile compounds in raw meat for the authenti-
cation of the feeding background of farm animals. J. Agric.
Food Chem. 55, 4630-4639.
26. Wang, C. T., Jiang, Y. M., Li, P., and Han, L. (2006) Determi-
nation of flavor substances in the meat of Tianzhu white yak
by SPME coupled to GC-MS. J. Gansu Agric. Univ. 41, 118-
121.
27. Watkins, P. J., Rose, G., Warner, R. D., Dunshea, F. R., and Pe-
thick, D. W. (2012) A comparison of solid-phase microextrac-
tion (SPME) with simultaneous distillation-extraction (SDE)
for the analysis of volatile compounds in heated beef and sheep
fats. Meat Sci. 91, 99-107.
28. Wei, J. M., Luo, Y. Z., Wang, J. Q., Shi, X. X., Liu, X., Hu, J.,
Chen, S. R., and Li, S. B. (2011) Analysis of odors from veal
by solid phase microextraction-gas chromatography. Sci. Tech.
Food Ind. 32, 73-75.
29. Wilkes, J. G., Conte, E. D., Kim, Y. K., Holcomb, M., Suth-
erland, J. B., and Miller, D. W. (2000) Sample preparation for
the analysis of flavors and off-flavors in foods. J. Chromatogr.
A 880, 3-33.
30. Wu, H. and Xu, S. Y. (2001) Volatile aroma components in
beef flavoring. J. Wuxi Univ. Light Ind. 20, 158-163.
31. Xu, H. G., Liu, X., Zhao, J., and Gao, Y. X. (2008) Effects of
ribose to cysteine ratios on the formation of volatile compo-
unds from the Maillard reaction in supercritical carbon diox-
ide. Food Res. Int. 41, 730-737.
(Received 2014.5.7/Revised 2014.9.22/Accepted 2014.9.23)