The Global Leadership Project: A Comprehensive Database …kmm229/GLP July 2015.pdf · The Global...
64
The Global Leadership Project: A Comprehensive Database of Political Elites John Gerring Professor Dept of Political Science Boston University 232 Bay State Road Boston MA 02215 [email protected] Erzen Oncel PhD Candidate Dept of Political Science Boston University 232 Bay State Road Boston MA 02215 [email protected] Kevin M. Morrison* Associate Professor Graduate School of Public and International Affairs University of Pittsburgh 4600 Wesley W. Posvar Hall Pittsburgh, PA 15260 [email protected] Philip Keefer Principal Advisor Institutions for Development Inter-American Development Bank 1300 New York Avenue, NW Washington, DC 20577 [email protected] *Corresponding Author. Acknowledgments: We are grateful for principal funding from the World Bank and the Clinton Global Initiative, as well as for additional funding from the Boston University, Cornell University, and the University of Pittsburgh. We also greatly appreciate helpful comments received at the 2014 Annual Meetings of the American Political Science Association, particularly from John Ahlquist.
Transcript of The Global Leadership Project: A Comprehensive Database …kmm229/GLP July 2015.pdf · The Global...
The Global Leadership Project: A Comprehensive Database of Political Elites
John Gerring Professor
Dept of Political Science Boston University 232 Bay State Road Boston MA 02215
Erzen Oncel PhD Candidate
Dept of Political Science Boston University 232 Bay State Road Boston MA 02215
Kevin M. Morrison* Associate Professor
Graduate School of Public and International Affairs
University of Pittsburgh 4600 Wesley W. Posvar Hall
Pittsburgh, PA 15260 [email protected]
Philip Keefer Principal Advisor
Institutions for Development Inter-American Development Bank
1300 New York Avenue, NW Washington, DC 20577
*Corresponding Author. Acknowledgments: We are grateful for principal funding from the World Bank and the Clinton Global Initiative, as well as for additional funding from the Boston University, Cornell University, and the University of Pittsburgh. We also greatly appreciate helpful comments received at the 2014 Annual Meetings of the American Political Science Association, particularly from John Ahlquist.
Abstract
This paper introduces the Global Leadership Project (GLP), which promises to expand the horizons
of research on political leaders by providing the first dataset offering biographical information on a
wide array of leaders of most countries in the world. Currently, GLP encompasses 145 sovereign
and semisovereign nation-states and 38,085 leaders, each of whom is coded along 31 parameters,
producing approximately 1.1 million data points in a cross-sectional format centered on 2010-13.
The leaders include members of the executive, the legislature, the judiciary, and other elites whose
power is of an informal nature. With this data, one can compare the characteristics of leaders within
countries, across countries, and across regions. The GLP thus serves as a fundamental resource for
researchers, policymakers, and citizens. In this paper, we discuss the intellectual background of the
project, its core elements, and its current status. Most importantly, we also illustrate several ways in
which it improves our knowledge of politics across the world, providing a new, data-informed
perspective on the demographic features of the global elite, including details about gender balance,
age, ethnicity, education, languages spoken, education, salary, and length in current office, among
other characteristics.

The Global Leadership Project:
A Comprehensive Database of Political Elites
The study of political leaders (also known as the study of political elites or political recruitment) is
one of the most venerable topics in political science, stretching back to seminal work by Mosca and
Pareto in the early nineteenth century. Yet, it is also one of the least developed empirically. While the
study of mass publics and institutions has flourished, the study of leaders has languished. A small
revival in this moribund field may be noted in recent years, thanks to the appearance of several
systematic datasets. However, these datasets are limited in several respects, as reviewed below.
The Global Leadership Project (GLP) promises to expand the horizons of research on
political leaders by providing the first dataset offering biographical information on a wide array of
leaders of most countries in the world, including members of the executive, the legislature, the
judiciary, and other elites whose power is of an informal nature. Currently, GLP encompasses 145
sovereign and semisovereign nation-states and 38,085 leaders, each of whom is coded along 31
parameters, producing approximately 1.1 million data points in a cross-sectional format centered on
2010-13.1 With this data, one can compare the characteristics of leaders within countries, across
countries, and across regions. The GLP thus serves as a fundamental resource for researchers,
policymakers, and citizens.
In introducing this new project, we discuss the intellectual background of the project, its
core elements, and its current status. We also illustrate several ways in which it informs our
knowledge of politics across the world. Further information – as well as the data itself – is available
on the GLP web site [website withheld].
1 It is our hope to replicate coding in future years, allowing comparisons through time.

2
I. Background
The idea that leaders matter – more specifically, the idea that the identity of leaders makes some
difference for the course of politics and policy – has a history stretching back to Machiavelli.2
Recently, a number of influential studies have employed systematic research designs to demonstrate
this basic point. For example, Jones and Olken (2005) use deaths from natural or accidental causes
to examine the effect of leadership change, finding that leaders impact the growth trajectory of
autocratic countries but not of democratic countries (presumably because their actions in the latter
are more institutionally constrained). Humphreys et al. (2006) use a field experiment to randomly
assign discussion leaders in a deliberative democratic setting, finding that the identity of the leader
affects whether consensus is reached as well as how participants view a number of political issues.
If leaders matter, it seems likely that their personal characteristics matter. Research indicates
that the individual characteristics of leaders often influence their behavior in elective office, apart
from what might be predicted by constituency pressures (Burden 2007). This insight informs a long
tradition of work on leadership recruitment, turnover (elite circulation), and descriptive
representation.3
What sorts of personal characteristics might matter? One strand of work emphasizes the
impact of class background on leadership perceptions and behavior (Bottomore 1993; Carnes 2013).
2 Ahlquist, Levi (2011), Blondel (1987), Burns (1978), Elgie (1995), Hargrove (2004), Mouritzen,
Svara (2002), Nohria, Khurana (2010), Rotberg (2012), Samuels (2003), Selznick (1957).
3 Barber (1963); Berlinski, Dewan, Dowding (2012); Best, Cotta (2000); Bienen, van de Walle (1991);
Borchert, Zeiss (2004); Bunce (1981); Camp (1995, 2010); Cotta, Best (2007); Dogan (2003);
Dowding, Dumont (2009); Jones, Olken (2005); Nagle (1977); Norris (1997); Pareto (1935), Prewitt
(1970); Putnam (1976, 1977), Roeder (1985), Schlesinger (1966), Siavelis, Morgenstern (2008).
3
A related tradition of work examines networks formed among political, business, and military elites
(Acemoglu et al. 2013; Burnham 1960; Domhoff 1967; Fisman 2001; Hunter 1953; Lasswell &
Lerner 1952; Mills 1956; Schwartz 1987) and the circulation of elites over time (Best & Cotta 2000;
Bienen & van de Walle 1991; Bunce 1981; Camp 1995; Casstevens 1989; Cotta & Best 2007;
Dowding & Dumont 2009; Figueroa 2008; Mosca 1939; Pareto 1935; Norris 1997; Prewitt 1970;
Putnam 1977; Roeder 1985). The character of elite networks may be viewed as foundational for
democracy (Higley & Pakulski 2007; Spilimbergo 2009; Stone 1990), for autocracy (Burns 1989), or
for development (Amsden, DiCaprio, Robinson 2012; Brezis & Temin 1999; Waldner 1999).
Additionally, the gender of leaders may matter: Chattopadhyay & Duflo (2004) find that leaders
invest more in infrastructure directly relevant to the needs of their own gender. Finally, the “quality”
of leaders, measured in various ways, might matter (Besley 2005). For example, Besley & Reynal-
Querol (2011) find that democracies choose more educated leaders, a feature that may have
important consequences for the quality of governance and for growth.4
To evaluate these hypotheses systematically, one needs individual-level data for leaders, and
indeed several of the studies cited above have employed such data. However, where individual-
level data has been exploited, it has usually been limited to one or several countries. Frequently, it is
limited to a single organization (Barnard 1938; Blau 1955; Enticott, et al. 2008; Selznick 1957), local
communities (Chattopadhyay, Duflo 2004), or small-group settings (Humphreys et al. 2006) within a
single country. Until quite recently, comparable cross-national data on leaders has been extremely
sparse. Though individual-level data is taken for granted in studying behavior at mass levels (e.g., 4 Alexiadou (2011), Besley, Larcinese (2011); Braun, Raddatz (2010); Bunce (1981); Chattopadhyay,
Duflo (2004); Faccio (2006, 2010); Hellman (1998); Horowitz & Stam (2010); Humphreys, Masters,
Sandbu (2006); Jones, Olken (2005); Lipset, Solari (1967); Mouritzen, Svara (2002); Remmer (1984);
Reynolds (2011); Roeder (1985); Wallis (1998); Wangnerud (2009).
4
markets, elections, public opinion), and cross-national polls such as the World Values Survey and
various “Barometer” surveys collect this information systematically on a global scale, the behavior of
governments is still approached primarily at a system-level (the state) or at the level of component
organizations (the executive, the legislature, the judiciary, an agency, political parties, and so forth).
This longstanding data deficit has been addressed by several recent cross-national projects.
Information about heads of state around the world over the past several centuries has been
compiled by Goemans et al. (2009), Horowitz, Stam, and Ellis (2014), Rulers.org, and
Worldstatesmen.org. Chiefs of State and Cabinet Members of Foreign Governments, a CIA publication (on-
line at www.cia.gov/library/publications/world-leaders-1/index.html), includes heads of state and
cabinet members for the past several years. Alexiadou (2011) constructs a database of cabinet
ministers across 18 OECD democracies, observed from 1945-2010. The Heads of Government
dataset codes ideological orientation for each leader from 1870-2012 for thirty-three countries.
Faccio (2006, 2010) compiles a list of legislator names in forty-six (mostly OECD) countries. Braun
& Raddatz (2010) collect data on the political background of cabinet members and central bank
directors (but not MPs) for 150 countries. Nelson (2014) collects educational and limited
professional background data for key economic policymakers in 90 developing countries between
1980 and 2000.
While important contributions to this area, these crossnational projects are generally limited
to heads-of-state – or, at best, heads of state and cabinet ministers – and thus offer thin gruel for
generalizing about the effects or determinants of leaders more generally. Even in highly authoritarian
countries, major decisions are almost certainly the product of interaction between at least several
persons. There is only so much one can say about the nature of a country’s leadership elite on the
basis of a few individuals’ characteristics. Generalizations based upon such a small sample are prone
to stochastic error.

5
A much broader leadership class is represented in legislatures, and with that notion in mind,
background information on legislators has been collected in a systematic fashion for a handful of
western democracies as part of the EurElite (Best & Edinger 2005) and SEDEPE (Dowding &
Dumont 2009) projects.5 This has fostered an impressive research agenda focused on ministers,
parliamentarians, and questions related to recruitment, usually with a historical angle (e.g., Berlinski,
et al. 2010; Best & Cotta 2000; Borchert & Zeiss 2004; Cotta & Best 2007; Dowding & Dumont
2009; Norris 1997). Unfortunately, data on legislators is limited to several dimensions (in accordance
with the theoretical scope of these studies) and its format is not always standardized across surveys,
limiting possibilities for cross-country comparison. In addition, none of these projects extends to the
developing world.6
Systematic information about legislators for a much larger universe is collected in the Inter-
Parliamentary Union (IPU) database, PARLINE (www.ipu.org/parline-
e/parlinesearch.asp). However, this data is only at the aggregate, not individual level. It includes the
number of members in a parliament, the distribution of seats among political parties, and the
distribution of seats according to sex. Reynolds (2011) and Ruedin (2009), building on PARLINE,
gather additional data on ethnic and gay/lesbian representation. However, like PARLINE, these
databases include only aggregate data.
5 EurElite projects, including Datacube, are described at: www.eurelite.uni-jena.de/index.html. The
Selection and Deselection of Political Elites (SEDEPE) project is described at: www.mzes.uni-
mannheim.de/projekte/sedepe/homepage.php
6 Several features of SEDEPE are integrated into GLP so as to maintain commensurability across
coding categories. However, the range of data collected by GLP is much greater than SEDEPE, so
there is relatively little overlap between the two projects.

6
This brief review of data on the characteristics of leaders, summarized in Table 1, yields one
important conclusion. In many areas where scholars suspect that leadership qualities matter, the data
to support such a hypothesis is extremely thin. Existing datasets are partial with respect to country
coverage and/or the fraction of country leaders for which data is available. This is obviously
problematic. Neither theory nor intuition tells us, for example, that the education of the executive is
a good proxy for the education of all of the relevant leaders of a country. Likewise, neither theory
nor intuition suggests that the causal effects of leader education in richer countries are generalizable
to poorer countries. The GLP is an attempt to fill this important gap in comparable data on leader
characteristics around the world.
[Table 1 here]
II. Database and Sample
Constructing a global database with comparable information on leaders obviously presented
substantial challenges. In this section, we discuss the coverage we were able to attain at several
levels: time, countries, leaders, and responses.
Coding began in June 2010 and finished in June 2013 (the details of the coding are discussed
below). We therefore have a snapshot of a country’s elite at the time the survey was completed
(noted on each country page on GLP’s website). (In the event that elections took place during the
period of coding, coders were advised to consider only the pre-election government.) Naturally,
there are worries about making comparisons across countries at somewhat different points in time.
However, the time-window is relatively brief, and fundamental changes in a country’s political elite
are unlikely to materialize over such a short stretch of time. Consequently, it is reasonable to regard
cross-country comparisons in this first round of the GLP as cross-sectional in nature.

7
The GLP aims to include all sovereign nations with over one-half million inhabitants.7
Unfortunately, it is impossible to include some countries because information on the characteristics
of their leaders below the very top level is not obtainable. Countries are included in the present
study if at least half of all members of parliament (MPs) are identifiable by name and at least some
background information is available for them. Applying this criterion, we arrive at a sample of 145
countries, as listed in Table 2. This is a substantial sample, though somewhat biased since the
excluded countries are disproportionately poor and small. (A larger sample of 162 countries, with
less complete data, is available on the GLP web site.) Within this sample of 145 countries,
seventeen countries are afflicted by especially high missing-ness (where 20-50% of the potential data
is missing), as indicated in Table 2. These countries are also disproportionately small and
impoverished, as one might expect.
[Table 2 here]
Within the sample of 145 countries we are able to identify the existence of 40,022 leaders,
which we refer to as our sampling frame. Of these, we are able to identify (by name) 38,085 leaders,
an average of 262 per country. This is our full individual-level sample.
However, we do not have a complete set of characteristics for all leaders, as shown in Table
3. That is to say, some of our questions to coders (discussed below) went unanswered. It should be
noted that in addition to the usual problem of obtaining factual data on political leaders, patterns of
missing-ness may arise when a characteristic touches upon subjects that are deemed sensitive in a
country (e.g., marital status, religion, or ethnicity).
[Table 3 here]
7 Cape Verde and Malta are also included, though they fall slightly under the threshold.

8
If all questions for all leaders in the chosen 145 countries were completed, the dataset would
possess roughly 1.2 million data points. Because of missing data, the current dataset includes roughly
1.1 million data points. This means that, overall, about 32% of the data is missing.
Even within the 145 sampled countries the pattern of missing-ness is evidently non-random.
In particular, the GLP is more likely to contain information about leaders who are prominent and
those who have more impressive credentials. Appendix B uses this imputed dataset to replicate all
applicable data tables presented below (see Tables 5-9). Reassuringly, results are very similar (see
Tables B1-5).
III. Questionnaire
Data contained in the GLP is gathered primarily from a lengthy questionnaire answered by country
experts (who are discussed in more detail below). The topics of many questions are reflected in
Table 3, while the full set of questions and possible responses is contained in Appendix A.
Responses are in English, though fields for alternate names in local languages are included for some
items.
Questions were chosen for inclusion based on their potential relevance to problems of
governance and data availability. Important leadership characteristics we code are age, sex, marital
status, ethnicity, religion, native language, additional languages spoken, place of birth, previous job
experience, previous political experience, highest level of education attainment, universities attended,
principal course of study, party affiliation, current position, and tenure of service. Several other
questions (not reflected in Table 3) inquire about general country-level characteristics, such as
population, the names of political parties, the names of salient ethnocultural groups, the kind of
electoral system, salaries of MPs, and so forth. These country-level characteristics were coded either
by experts or by consultation of secondary sources.

9
Most of the leader-level questions are coded on the basis of publicly available information,
often contained on government web sites or CVs. A few questions (such as who are the most
powerful individuals in a country, discussed below) require coders to exercise judgment. For these
questions, we can anticipate some degree of disagreement among scholars. However, most of the
questions on the questionnaire are factual in nature. Where there is uncertainty about the nature of a
leader’s characteristics, it is more likely to be a matter of uncertain knowledge (where was X’s
birthplace?) rather than judgments about larger conceptual issues.
To indicate uncertainty (of whatever sort), coders may check a box labeled “uncertain” or
another box labeled “assumed” (indicating that the answer to this question is inferred rather than
based directly on source material). They are also offered an open-ended Notes field in which they can
comment on any aspect of a question, such as problems pertaining to coding, special sources
(published or unpublished) used to code that question, or any additional persons consulted.
IV. Coding
Recruiting country experts is a challenge, particularly for small countries in the developing world. To
identify potential coders, we began by contacting senior political scientists – area specialists with
extensive networks among scholars of that region. We asked these scholars to recommend persons
with country-specific knowledge who might be interested in the project. We then contacted them,
informed them of the project, and – if they seemed appropriate for the job and willing to commit
the requisite time – secured their appointment.
Country experts chosen for this project are generally serving as academics, graduate students,
or professionals involved in some aspect of politics (such as the civil service or an NGO). Since the
questions of interest to this project are mostly factual – and the non-factual questions do not have a
pronounced partisan or ideological slant – it was deemed sufficient to recruit only one coder per

10
country.8 Coders were remunerated according to the number of leaders and the ease of data access
in that country. Average remuneration was about $500.
The time required to complete a GLP questionnaire depends on the number of leaders in a
country – in turn, largely a product of the size of the legislature. China’s legislature, with more than
3000 members, tops the list, while Qatar’s, with 35 members, is the smallest in our sample. On
average, coders reported spending about 50 hours on their work, which may have spread across
several weeks or months. Most of the coding was conducted on the GLP interactive web site.9
However, a few coders preferred to work on hard copies of the questionnaire, which were then
transcribed to the on-line database.
All coders have the option of retaining anonymity. However, most of those recruited to
work on GLP preferred to be publically identified with their work, and thus appear (along with
contact information) on the GLP web site. This enhances the transparency and credibility of the
GLP database and also allows end-users the option of contacting those involved in the coding, to
resolve ambiguities or pursue new angles.
8 We plan to construct limited tests of inter-coder reliability in the future by enlisting multiple
experts to code several speculative questions of this nature for the same country.
9 All coding is contained in a consolidated database constructed with Drupal, a popular open-source
Content Management Software (CMS), with MySQL as its database engine. This system provides the
user-interface for coders to enter data and for end-users to view them on the website and download
data if preferred. Data queries may be structured in various ways and may be restricted to particular
countries.

11
V. Classifying Leaders
The notion of a “leader” or “elite” (terms used interchangeably in this project) can be defined in
many ways (Blondel 1987; Dogan 2003; Higley & Pakulski 2007; Putnam 1976). GLP recognizes ten
categories: (1) the apex, (2) the next ten, (3) the executive, (4) cabinet members, (5) executive staff,
(6) party leaders, (7) assembly leaders, (8) supreme court justices, (9) members of parliament (MPs)10,
and (10) unelected persons. Most of these categories are defined in formal terms (statutory or
constitutional). A few are informal, resting on the judgment of coders.
The apex of a polity consists of the one or two persons who are judged to possess the
greatest overall political influence in a country. Their power may be formal or informal. They may be
the executive(s), holders of the most powerful offices, or unelected persons (e.g., a media patron,
religious leader, military leader). Coders are asked to decide whether a single person occupies the
apex or whether two people of virtually equal power share this position of influence (as in China and
in many semipresidential systems).
The next ten elites (“+10” in the tables) in a polity consist of the most powerful persons, after
those at the apex. Similar considerations apply (for example, their power may be formal or informal).
The GLP then recognizes a series of more or less formal positions that are often correlated
with real political influence (though, obviously, to varying degrees in different countries), and which
may overlap with the apex and the top ten. These include: the executive, cabinet members, executive staff,
party leaders, assembly leaders, supreme court justices (understood as the top court, often a constitutional
court), and members of parliament, (MPs, with or without leadership positions).
A residual category of other unelected persons encompasses figures such as monarchs, religious
leaders, military leaders, junta leaders, CEOs of important companies, and NGO leaders. They are
unelected leaders who exert influence over a range of policy issues (not just a specialized issue-area)
10 MPs signify lower house MPs in all countries except for Chile, where the upper house MPs are coded.

12
and are not easily categorized in one of the other categories. The breadth of influence is important
here. For example, a central bank may be influential and perhaps even dominant in setting monetary
policy, but it does not typically influence the formation of policy in other areas (except by spillover).
By contrast, a monarch, religious leader, or military leader may reach into diverse areas of policy. It
is the latter that concerns us.
The distribution of leaders across these offices within the GLP dataset is portrayed in Table
4. Note that there can be overlap between the various categories because of one leader holding
multiple positions—an MP can also be a cabinet minister, a part of the apex, and/or a party leader,
for example. The first three columns of Table 4 indicate, respectively, the number of officeholders
of each type in the database, the percent of officeholders in the database that those officeholders
make up, and the number of countries for which there is data on that kind of officeholder. The rest
of the columns display important summary values across these countries: the mean, median,
standard deviation, minimum, and maximum.
[Table 4 here]
Data for the executive extends across 145 countries (the full sample). Most countries have
one or two persons carrying out executive functions, though one country (Switzerland) has a
collegial executive. Cabinets vary in size from 2 (Ecuador) to 86 (India), with an average of 25. Data
for executive staff is relatively scarce, extending to only 105 countries. Across those countries, the
GLP contains background information on anywhere from 1 to 54 staffers, with an average of 7.
Party leaders in the legislature are tracked for 130 countries. Among these countries, coders
were able to identify a range of 1 (8 countries) to 74 (India) leaders, with a mean of 10. Assembly
leaders show a similarly wide spread – from 1 (20 countries) to 103 (Mexico), with a mean of 13.
Information about rank-and-file MPs is available for the entire sample. The number of MPs coded
per country ranges from 23 (Trinidad and Tobago) to 2989 (China), with a mean of 216.

13
Data for members of the supreme court (or constitutional court) is available for most of the
sample, but not for all justices. Here, we find a range extending from 1 (for 34 countries) to 37
(Austria), with a mean of 8.
Note that informal categories such as executive staff and “other unelected” are subject to the
judgments of country experts. Likewise, the designation of a party leader or assembly leader may be
open to interpretation and may be defined differently in different contexts. If in the judgment of the
country expert an individual is sufficiently influential, his/her name is included in one of these
categories, and relevant background information added to the database. One should bear in mind
that these categories are not strictly defined (nor could they be, in our opinion).
Overall, the GLP sample chosen for analysis in this paper contains information for 38,085
leaders and 41,595 offices (because of leaders holding multiple offices) in 145 countries, with a mean
of 262 leaders and 286 offices per country. The smallest group of leaders in the dataset (N=41) is
registered by Trinidad, the largest (N=3118) by China. Cuba follows in second place with 686. Since
many of these leaders reside in the legislature (75.2%), the size of a country’s legislature largely
determines the size of that country’s elite delegation as represented in the GLP.11
11 Extant work (e.g., Stigler 1976) suggests that population size explains much of the variance in the
size of legislatures. When the membership of the legislature (logged) is regressed against population
(logged), approximately 40% of the variance is explained. Larger countries tend to have larger
legislatures, and hence a larger class of leaders as calculated by the GLP, though this is by no means
the only factor at work.

14
VI. General Attributes
We hope the dataset described above will be used to address many of the hypotheses discussed at
the beginning of the paper, as it presents comparable leader-level data for most countries in the
world. In the meantime, however, since this is the first comprehensive leader database, we thought it
would be useful and interesting to present the information the dataset yields regarding aggregate
patterns at the national and global levels. As such, in this and subsequent sections, we present
various details about the characteristics of political leaders around the world.
We begin with Table 5, which presents aggregate information regarding The (1) Age, (2) Sex,
(3) Marital status, (4) Languages spoken, (5) Educational attainment, (6) Educated abroad, (7)
Educated in West, and (8) Tenure in current position.. A lot of information is packed into this table,
so we shall review the findings carefully, row by row, column by column.
[Table 5 here]
The full sample available for each analysis –that is, the number of countries and leaders for
which we have data on each leadership class – are listed in the final rows of the table. The available
sample of leaders for each characteristic – generally somewhat reduced because of missing data on a
particular question – is listed in column 1.
Subsequent columns in Table 5 aggregate data by country prior to calculating statistics. For
example, the mean (M) of the sample (column 2) is derived by calculating the mean for each country
and then a global mean across all countries. Likewise, the standard deviation and the range
(minimum to maximum values) are derived from country-level statistics, averaged across all
countries (note that when the minimum or maximum country has poor coverage for that particular
question, our discussion of extreme cases below may not correspond with extreme values in the
table, as we instead focus on countries with better coverage). In the “Office” section, we generate
(country-level) statistics pertaining to each office type, which are then averaged across all countries.

15
In the “Wealth” columns, we compare country averages in rich (and economically developed) and
poor (and/or economically less developed) countries. The former are identified by membership in
the Organization of Economic Cooperation and Development (OECD); all other countries are
categorized as poor (and/or undeveloped). In the “Region” columns, we look at variation between
Africa, the Americas, Asia, Europe, and MENA (Middle East and North Africa), all based on
country averages. Finally, we compare regime types. Countries are defined as democratic if they are
categorized as Free or Partly Free by Freedom House in 2012, and as autocratic of they are
categorized as Not Free.
The rationale for aggregating by country prior to calculating a global statistic is that we do
not want our statistics to over-weight countries with large leadership classes such as China. (Even so,
a simple pooled analyses reveals very similar aggregate results, suggesting that countries with large
elites are not so different from countries with small elites.)
We now discuss the results, beginning with Age and proceeding down the table. Among
global leaders the average age is 55, with a fairly tight spread around the mean (standard
deviation=4.4), signaling that most political leaders are middle-aged. We find considerable variations
between extremes – from a minimum average age of 42 (Ethiopia) to a maximum of 64 (Cambodia).
Not surprisingly, leaders at the apex tend to be at the high end of the age distribution. There is
relatively little variation across regions, though Africa and MENA have slightly higher average ages,
whereas Americas, Asia and Europe have slightly lower average ages. Likewise, there is little
variation across regime types, though autocracies have a slightly older leadership class.
The global political elite is strongly gendered. Over four-fifths of leaders around the world
are male. This bias is most marked at the top -- that is, the apex and the next ten. Across countries,
we find extreme divergence between the lowest (53% of the leadership class in Rwanda and Sweden
are male) and highest (99% in Yemen). Across regions, we find that the Middle East and North
16
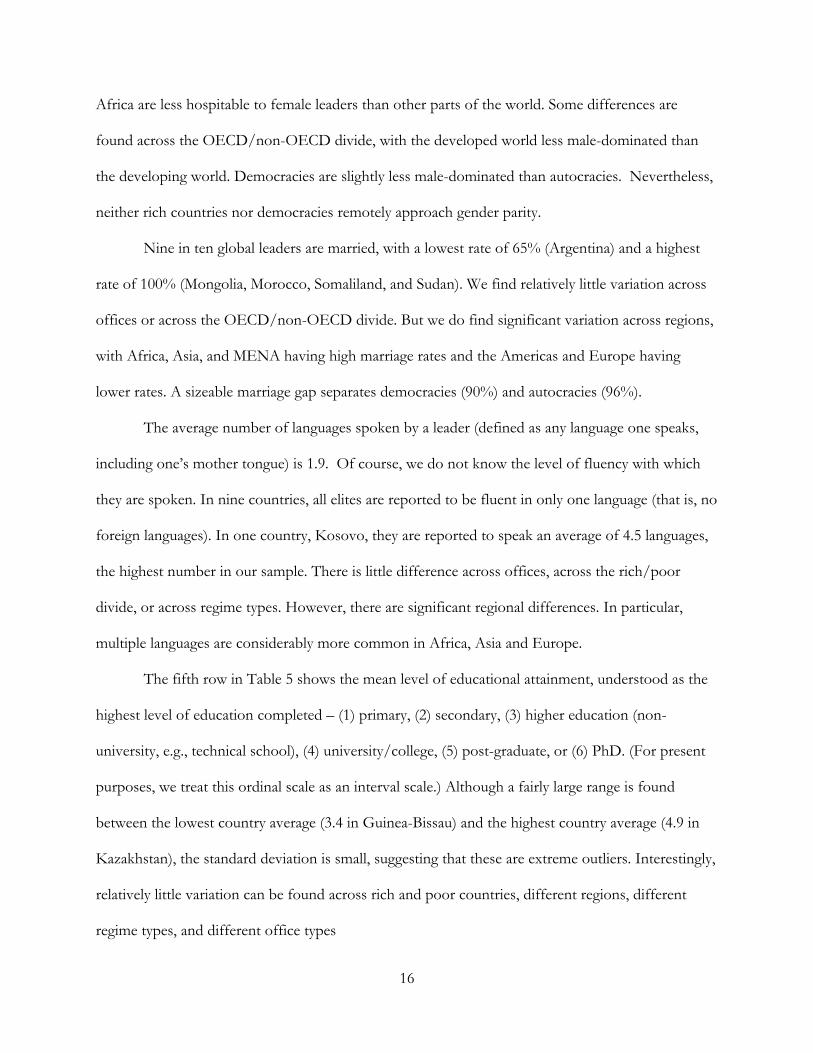
Africa are less hospitable to female leaders than other parts of the world. Some differences are
found across the OECD/non-OECD divide, with the developed world less male-dominated than
the developing world. Democracies are slightly less male-dominated than autocracies. Nevertheless,
neither rich countries nor democracies remotely approach gender parity.
Nine in ten global leaders are married, with a lowest rate of 65% (Argentina) and a highest
rate of 100% (Mongolia, Morocco, Somaliland, and Sudan). We find relatively little variation across
offices or across the OECD/non-OECD divide. But we do find significant variation across regions,
with Africa, Asia, and MENA having high marriage rates and the Americas and Europe having
lower rates. A sizeable marriage gap separates democracies (90%) and autocracies (96%).
The average number of languages spoken by a leader (defined as any language one speaks,
including one’s mother tongue) is 1.9. Of course, we do not know the level of fluency with which
they are spoken. In nine countries, all elites are reported to be fluent in only one language (that is, no
foreign languages). In one country, Kosovo, they are reported to speak an average of 4.5 languages,
the highest number in our sample. There is little difference across offices, across the rich/poor
divide, or across regime types. However, there are significant regional differences. In particular,
multiple languages are considerably more common in Africa, Asia and Europe.
The fifth row in Table 5 shows the mean level of educational attainment, understood as the
highest level of education completed – (1) primary, (2) secondary, (3) higher education (non-
university, e.g., technical school), (4) university/college, (5) post-graduate, or (6) PhD. (For present
purposes, we treat this ordinal scale as an interval scale.) Although a fairly large range is found
between the lowest country average (3.4 in Guinea-Bissau) and the highest country average (4.9 in
Kazakhstan), the standard deviation is small, suggesting that these are extreme outliers. Interestingly,
relatively little variation can be found across rich and poor countries, different regions, different
regime types, and different office types
17
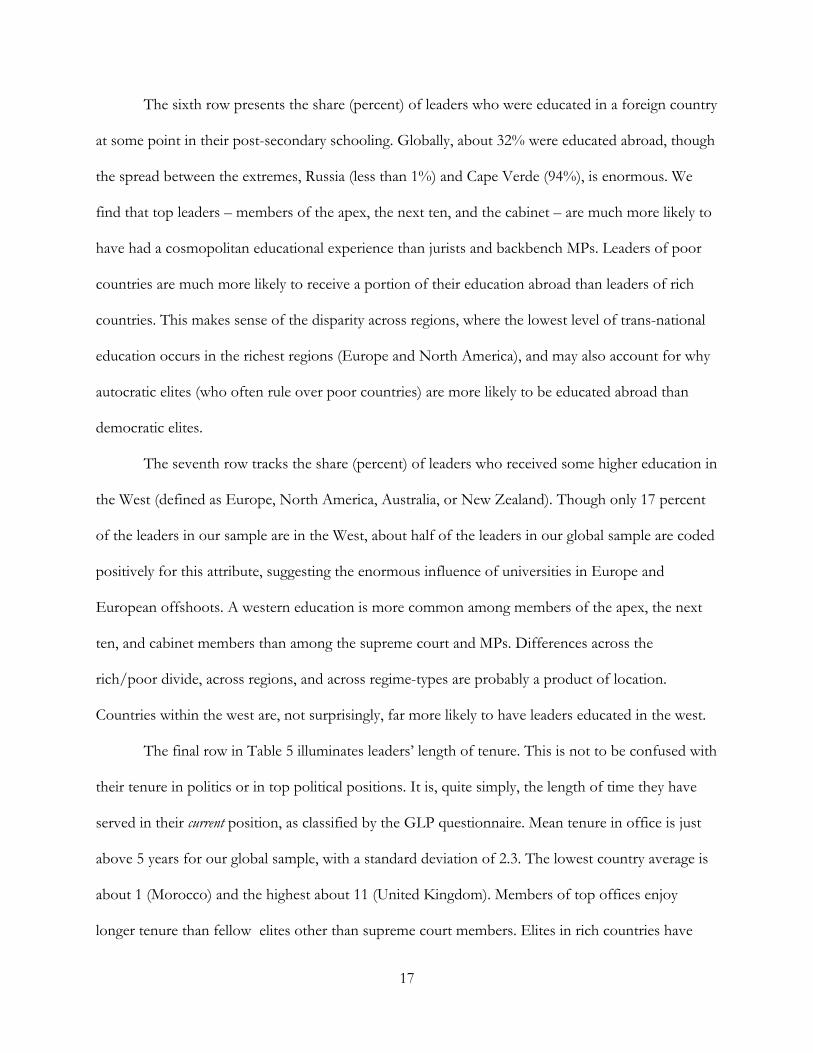
The sixth row presents the share (percent) of leaders who were educated in a foreign country
at some point in their post-secondary schooling. Globally, about 32% were educated abroad, though
the spread between the extremes, Russia (less than 1%) and Cape Verde (94%), is enormous. We
find that top leaders – members of the apex, the next ten, and the cabinet – are much more likely to
have had a cosmopolitan educational experience than jurists and backbench MPs. Leaders of poor
countries are much more likely to receive a portion of their education abroad than leaders of rich
countries. This makes sense of the disparity across regions, where the lowest level of trans-national
education occurs in the richest regions (Europe and North America), and may also account for why
autocratic elites (who often rule over poor countries) are more likely to be educated abroad than
democratic elites.
The seventh row tracks the share (percent) of leaders who received some higher education in
the West (defined as Europe, North America, Australia, or New Zealand). Though only 17 percent
of the leaders in our sample are in the West, about half of the leaders in our global sample are coded
positively for this attribute, suggesting the enormous influence of universities in Europe and
European offshoots. A western education is more common among members of the apex, the next
ten, and cabinet members than among the supreme court and MPs. Differences across the
rich/poor divide, across regions, and across regime-types are probably a product of location.
Countries within the west are, not surprisingly, far more likely to have leaders educated in the west.
The final row in Table 5 illuminates leaders’ length of tenure. This is not to be confused with
their tenure in politics or in top political positions. It is, quite simply, the length of time they have
served in their current position, as classified by the GLP questionnaire. Mean tenure in office is just
above 5 years for our global sample, with a standard deviation of 2.3. The lowest country average is
about 1 (Morocco) and the highest about 11 (United Kingdom). Members of top offices enjoy
longer tenure than fellow elites other than supreme court members. Elites in rich countries have

18
slightly longer tenure than elites in poor countries. Elites in autocracies enjoy slightly longer tenure
than elites in democracies. Across regions, elites in Middle East and North Africa enjoy the longest
tenure, while elites in Africa suffer the shortest periods in office, a fact that may be related to
instability and/or a lack of professionalization among political elites.
VII. Languages
In Table 6, we explore in more detail the languages spoken by political leaders around the world. We
list only “world” languages, understood as those spoken widely beyond several countries. For
present purposes, the country-level aggregates are perhaps more revealing than the pooled sample
(where Mandarin Chinese occupies a somewhat higher position due to the size of the Chinese elite).
So measured, the following languages are spoken most commonly among political elites, in order of
prevalence: English, French, Spanish, Arabic, Russian, German, Portuguese, Chinese, and Other, the
latter of which includes all local and other languages. English, the global leader, is spoken by over a
third of political leaders in a country, on average. Of course, the prominence of English and certain
other global languages results partially from the fact that we are using country averages, and
therefore the numbers are affected by former colonial possessions that retain the colonial language
as a primary (or in some cases secondary) language. If the Chinese empire had collapsed (or
collapses at some point in the future) into constituent parts that retained the Chinese language, it
would move quickly up these rankings. In simple numeric terms – that is, using simply the number
of elites in our database that speak the language (column 1) – Chinese ranks fifth.
[Table 6 here]

19
VIII. Disciplinary Background
In Table 7, we explore the disciplinary background of political leaders, defined as the principal
course of study in their undergraduate degree. This information is available for 25,190 elites (66% of
the total sample), spread across 145 countries. Disciplines are grouped as follows: (1) Agronomy; (2)
Engineering; (3) Math, Computer Science; (4) Biology, Chemistry, Physics; (5) Medicine; (6)
Economics, Business, Management; (7) Social Sciences; (8) Law; (9) Humanities; (10) Military; and
(11) Other.
The categories with the largest membership, by far, are law (21% of global leaders) and
economics (which, along with related fields, encompasses 22% of global leaders). The remaining
social sciences run a distant third place (12%). Given the closeness of these three disciplinary areas,
one might argue that a majority of the global political elite share a common disciplinary orientation.
This dominance is even greater among top offices. On average in a given country, 67% of those
occupying the apex of political power, 62% of those occupying the next ten most important
positions, 55% of cabinet members, and 96% of supreme court justices are trained in these
associated disciplines. (Not surprisingly, the latter have a predominantly legal background.)
Nevertheless, cross-country variation is fairly large, as suggested by standard deviations and
the spread between minimum and maximum values. Clearly, there is a quite a bit of country-level
variation in what elites choose to study (or what they are expected to study) prior to taking up a
career in politics. For example, South Korea and Rwanda have the largest percentage of leaders with
a social science background and Mongolia (a very poor country) has the highest percentage of
leaders with an engineering background. Elites in poor countries (non-OECD) are somewhat less
likely to have focused on the triumvirate of law, economics/business/management, and the social
sciences than elites in rich countries, and democracies seem to prize the triumvirate more than non-
democracies. Poor country elites tend more to engineering, medicine, and the military. The military,
20
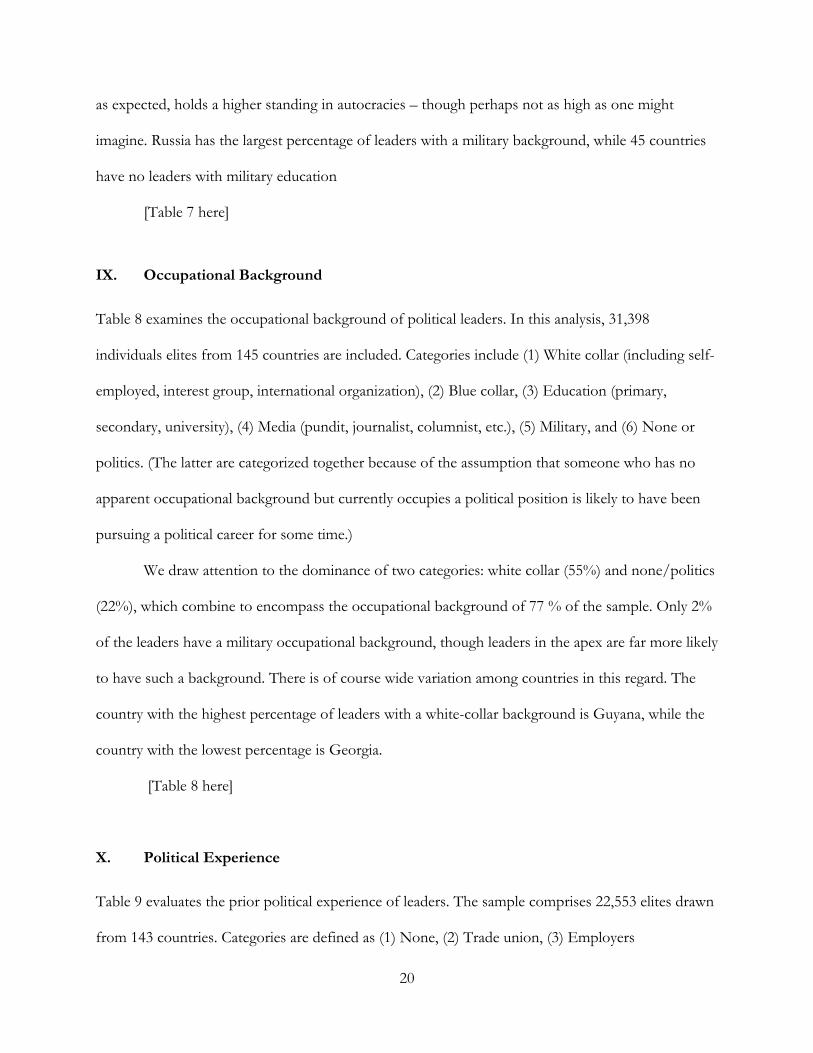
as expected, holds a higher standing in autocracies – though perhaps not as high as one might
imagine. Russia has the largest percentage of leaders with a military background, while 45 countries
have no leaders with military education
[Table 7 here]
IX. Occupational Background
Table 8 examines the occupational background of political leaders. In this analysis, 31,398
individuals elites from 145 countries are included. Categories include (1) White collar (including self-
employed, interest group, international organization), (2) Blue collar, (3) Education (primary,
secondary, university), (4) Media (pundit, journalist, columnist, etc.), (5) Military, and (6) None or
politics. (The latter are categorized together because of the assumption that someone who has no
apparent occupational background but currently occupies a political position is likely to have been
pursuing a political career for some time.)
We draw attention to the dominance of two categories: white collar (55%) and none/politics
(22%), which combine to encompass the occupational background of 77 % of the sample. Only 2%
of the leaders have a military occupational background, though leaders in the apex are far more likely
to have such a background. There is of course wide variation among countries in this regard. The
country with the highest percentage of leaders with a white-collar background is Guyana, while the
country with the lowest percentage is Georgia.
[Table 8 here]
X. Political Experience
Table 9 evaluates the prior political experience of leaders. The sample comprises 22,553 elites drawn
from 143 countries. Categories are defined as (1) None, (2) Trade union, (3) Employers

21
organization, (4) Interest group, (5) Non-governmental organization (NGO), international non-
governmental organization (INGO), or social movement, (6) Local government or municipal office,
(7) Previous Member of parliament (MP) or minister, and (8) Partisan (political advisor or person
active in party youth branch or party organization/administration).
The largest category by far is partisan (38% of the pooled sample), suggesting that many
political leaders work their way up the ranks from party service to national office. A good number
also gain entry by way of prior service to local government (16%) or as an MP or minister (22%).
Among top offices other than the supreme court (for fairly obvious reasons), the dominant pattern
of recruitment includes MP/minister or other partisan activities. A fair number of top officials have
a background in NGO, INGO, or political movement work.
Cross-country variation is quite extreme, as judged by standard deviations and the range
between minimum and maximum values across most of these categories. This suggests that political
recruitment operates quite differently across countries. For example, Cambodia is the country with
the highest percentage of leaders with prior political experience at the local or municipal government
level (67%) while four countries (Namibia, Niger, Singapore, Uzbekistan) have no leaders with such
experience. Australia has the highest percentage of leaders with prior experience with trade unions
(5%), while thirty-four countries have the lowest (0%). Senegal has the highest percentage of leaders
with prior experience with NGOs or INGOs (72%), while nine countries have no leaders with
NGO or INGO experience.
Differences across the developed and developing world are noticeable. For example, local
government serves as a platform for higher office to a greater extent in OECD countries (23%, on
average) than in the non-OECD (14%), perhaps reflecting the greater prominence of local
government in the advanced industrial world.
[Table 9 here]

22
XI. MP Salaries
Table 10 presents the salaries of parliamentarians (MPs), expressed in current US dollars (row 1) and
as a share of per capita GDP (row 2). These are official salaries for the lower (or only) house of
parliament, and do not reflect extra payments for which members of the leadership may be eligible.
They also do not reflect non-salary perquisites (e.g., tax benefits) or other irregular forms of
compensation.
The data were collected by research assistants (with assistance from country experts) from
online sources, including newspaper articles and websites of governments and NGOs. The analysis
includes 79 countries located in various regions around the world. Because there is no intra-country
variation, we adopt countries as the sole unit of analysis.
The mean salary of MPs in our sample is just over $70,000, with a substantial spread around
the mean, anchored by Guyana at the low end ($1,774) and Chile at the high end ($369,984).
Differences across the developed and less developed world are marked, as one might expect, with
MPs in the rich countries earning well over twice the salary of their brethren in the developing
world.
However, when these numbers are considered in light of the domestic economies, the
situation is reversed. For example, parliamentarians earn less than the average per capita income in
Hungary (a relatively rich country, but one with a socialist past), while they earn 116 times the
average income in the Democratic Republic of Congo (a very poor country). More generally,
parliamentarians earn about fourteen times the per capita income in poor countries and only three
times the per capita income in rich countries. Cross-regional differences follow this pattern, with
Africa having the lowest salaries but the highest proportional salaries (29 times the per capita income

23
in their countries). We also find a dramatic difference in MP salaries manifested across democracies
and non-democracies, though much of this may be largely due to per capita income differences.
[Table 10 here]
XII. Descriptive Representation
The GLP identifies the ethnocultural identities of political leaders, defining the latter according to
cultural, ethnic, religious, and/or linguistic features that set one group apart from others. Such
judgments are never hard-and-fast and always open to interpretation; likewise, realities on the
ground are often in flux. Nonetheless, we anticipate that the codings assigned by GLP country
experts reflect common understandings in the country at the time the survey was administered.
We also ask country experts to rank-order all (previously identified) ethnocultural groups in a
country by their socioeconomic status, allowing for ties in instances where several groups are not
easily distinguished. This rank-ordering rests on survey or census data wherever possible, and
otherwise is based on the judgments of country experts. We expect that it is fairly accurate in
identifying the most privileged and least privileged groups, whose status is generally widely known
and commented upon. This data is gathered for 1,204 groups across 121 countries. Within each
country, the group(s) accorded the highest socioeconomic status is classified as privileged, a status
bestowed upon 291 groups (24.1%). Likewise, the group(s) with the lowest socioeconomic status is
classified as underprivileged, a status accorded to 287 groups (23.8%). Finally, we estimate the share of
each ethnocultural group in the general population based on survey and census data drawn from
extant sources.
Using this information, we calculate a measure of descriptive representation for privileged
and underprivileged groups by subtracting that group’s share (percent) of the population from their
share (percent) of leadership positions. A positive number signifies over-representation; a negative
24
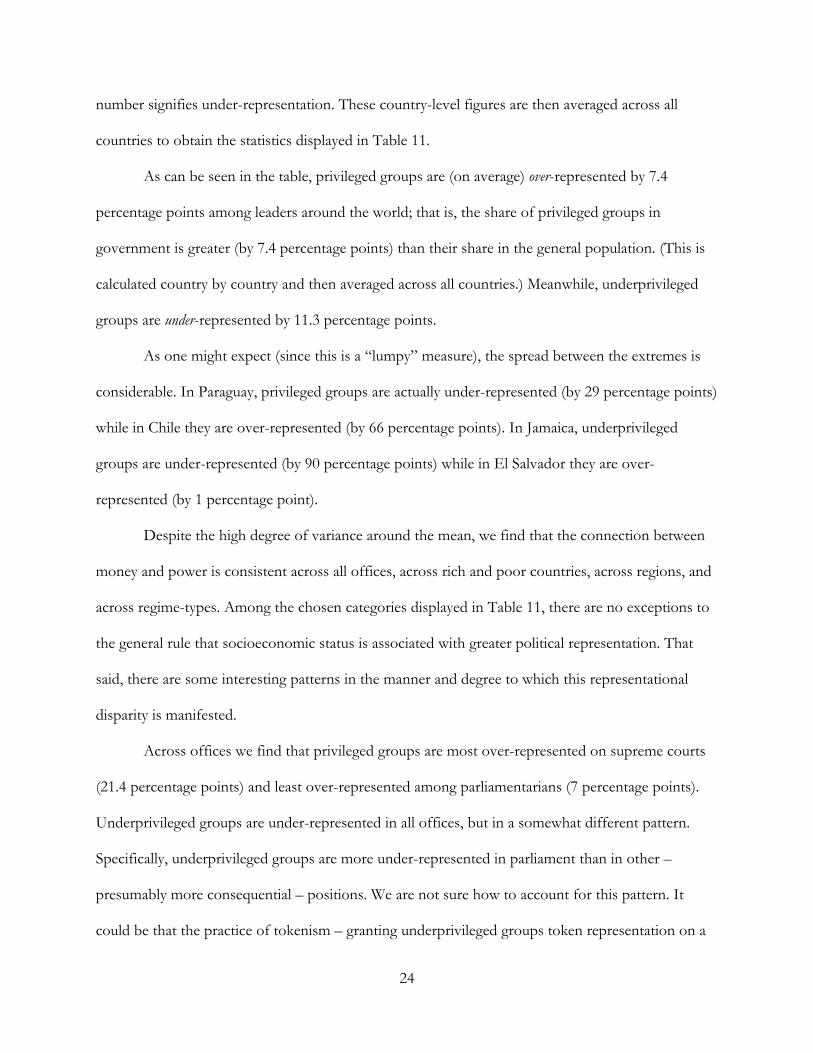
number signifies under-representation. These country-level figures are then averaged across all
countries to obtain the statistics displayed in Table 11.
As can be seen in the table, privileged groups are (on average) over-represented by 7.4
percentage points among leaders around the world; that is, the share of privileged groups in
government is greater (by 7.4 percentage points) than their share in the general population. (This is
calculated country by country and then averaged across all countries.) Meanwhile, underprivileged
groups are under-represented by 11.3 percentage points.
As one might expect (since this is a “lumpy” measure), the spread between the extremes is
considerable. In Paraguay, privileged groups are actually under-represented (by 29 percentage points)
while in Chile they are over-represented (by 66 percentage points). In Jamaica, underprivileged
groups are under-represented (by 90 percentage points) while in El Salvador they are over-
represented (by 1 percentage point).
Despite the high degree of variance around the mean, we find that the connection between
money and power is consistent across all offices, across rich and poor countries, across regions, and
across regime-types. Among the chosen categories displayed in Table 11, there are no exceptions to
the general rule that socioeconomic status is associated with greater political representation. That
said, there are some interesting patterns in the manner and degree to which this representational
disparity is manifested.
Across offices we find that privileged groups are most over-represented on supreme courts
(21.4 percentage points) and least over-represented among parliamentarians (7 percentage points).
Underprivileged groups are under-represented in all offices, but in a somewhat different pattern.
Specifically, underprivileged groups are more under-represented in parliament than in other –
presumably more consequential – positions. We are not sure how to account for this pattern. It
could be that the practice of tokenism – granting underprivileged groups token representation on a
25
body – translates into a higher share of the total when the resulting body is small. For example,
token representation on a supreme court might involve one seat among 8 (the average size of this
body across our sample, as shown in Table 4), while token representation in a legislature might
involve a few seats among 226 (the average size of legislatures in our sample).
Patterns across rich and poor countries also run in contrary directions. Privileged groups are
more over-represented in rich countries than in poor countries, while underprivileged groups are
more under-represented in poor countries than in rich countries. It is easy to understand why poor
social groups might even be less likely to achieve political representation in poorer countries;
presumably, they are much poorer and suffer from corresponding disadvantages of education,
health, infrastructure, and organization. It is not apparent why well-off groups achieve higher
representation in rich countries than in poor countries.
Regional variations are evident. Disparities in representation – both among privileged and
underprivileged – are greatest in the Middle East and least in Europe. Africa, the Americas, and Asia
generally follow a pattern of modest over-representation for privileged groups and immodest under-
representation for underprivileged groups.
Variation across regime types is not as great as one might expect. Privileged and
underprivileged groups achieve a level of representation that is closer to their population size in
democracies relative to autocracies, but only by a few percentage points. It would be rash to
conclude that regime type has much effect on the political representation of “in” and “out” groups.
[Table 11 here]
XIII. Conclusion
In reviewing previously available information about leadership cadres worldwide, we noted that
extant datasets suffer from one or both of two limitations. First, they generally have limited scope,

26
in the sense that information may be provided for top leaders such as executives or cabinet
members but not for others, or information may be provided only as country aggregates rather than
at the individual level. Second, the existing datasets often have limited country coverage.
To what extent have these limitations affected common understandings of the topic? To
what extent, that is, do extant datasets render a biased or curtailed vision of political leadership
around the world? We can shed light on this question by examining various features of the GLP
database.
With respect to the problem of scope, we may contrast the characteristics of top leaders – at
the apex, the next ten, or in the cabinet – with backbenchers (MPs). Here, we find fairly marked
contrasts on some dimensions. For example, top echelons are older, more male-dominated, longer-
serving, more likely to be educated abroad and in the West, more likely to have training in business
or economics or in the military, and more likely to have held prior offices in party organizations and
MP positions (see Tables 5 and 9). Along other dimensions, there is little or no difference between
top and intermediate echelons.
Other contrasts are more fine-grained, focused on specific offices. For example, leaders at
the apex are more likely to have a professional background in the military than occupants of other
leadership (top or intermediate) positions (see Table 8). Jurists (that is, members of the supreme
court) have higher educational attainment than other leaders (see Table 5). Leaders in the apex,
cabinet, and supreme court are more conversant in world languages than other leaders (see Table 6).
With respect to country coverage, we may contrast the picture of global leadership derived
from rich (OECD) countries with the picture of global leadership derived from countries in the
developing world. We find that political leaders in rich countries are somewhat less likely to be male,
less likely to be married, and less likely to be educated abroad than their brethren in the developing
world (see Table 5). The educational background of rich country leaders is more likely to be in law,

27
economy/business/management, or the social sciences, while their brethren in the developing world
favor engineering, medicine, and the military (see Table 7). Leaders in rich countries are more likely
to have prior political experience in a local government or party positions than their counterparts in
the developing world (see Table 9).
Regional differences, and differences across regime type, are also marked, though we shall
not burden the reader with a recitation of contrasts contained in the foregoing tables. The general
point is clear: leadership characteristics vary across offices and across contexts. Without an
encompassing view of our subject, this variation is lost. Writers over-generalize, or under-generalize
(failing to see general patterns where they exist).
In these respects, we expect that the GLP can contribute to the development of a more
global – and at same time, more nuanced – field of study focused on political leadership. Several
areas of research seem especially fruitful. While the present study employs a set of nominal
categories – rich/poor, Africa/Americas/Asia/Europe/MENA, democratic/autocratic – to explore
variation across the world of elites, these categories are obviously somewhat arbitrary. When the full
range of variation is introduced, one can provide a more sensitive analysis of descriptive and causal
relationships. Why are some countries more male-dominated than others? Why are some leadership
classes more cosmopolitan than others? Do democracies enlist more educated leaders than
autocracies? Are certain offices more prone to have educated leaders fill them?
Arguably, within-country variation provides the most satisfactory approach to measurement
and to causal identification. To this end, the individual-level data provided by the GLP – including
38,085 leaders across 145 countries – provides ample opportunities for analysis.
Because data about leaders is associated with each leader’s name, the GLP database may be
used in conjunction with other databases that have a similar structure. For example, one might
merge the GLP with databases containing names of elites in business or the military, using common

28
surnames to indicate family ties across these spheres. One might merge the GLP with constituency-
level data on election results (e.g., from the Constituency-Level Election Archive) to gauge how
electoral dynamics condition the types of MPs who reach office.
Note that because GLP collects individual data across a wide range of social and political
dimensions, it offers the possibility of aggregating the data at a variety of different levels: social groups
(defined by ethnicity, language, and/or religion), political parties, institutions (executive, legislative,
judicial), position (apex, top ten, executive, cabinet, executive staff, party leaders, assembly leaders,
supreme court justices, back-benchers, and unelected persons), and country. As an example, consider
the possibility of comparing attributes across parties. Here, one might wish to compare the
characteristics of small parties and large parties, parties on the left and the right, parties in
government and opposition parties, and so forth.
Individual level data may also be mustered to provide measurement instruments for hard-to-
measure latent concepts. By way of example, suppose one is willing to assume that education is a
marker for aptitude. Building on this postulate, it follows that one ought to see an association
between education and leadership position in countries where meritocratic rules apply. Where a
strong association exists – that is, where top leaders are more educated than intermediate or low-
level leaders – we may assume that meritocratic procedures are being applied. This, in turn, may
pave the way for an analysis of fundamental causes.
While we have given a taste of some of the interesting variation in personal characteristics of
leaders around the world, we are sure that scholars will be able to enlist GLP data in ways we cannot
imagine. Ahlquist and Levi (2011) noted recently that the subject of leadership, after decades of
neglect, is back in fashion. Our hope is that the Global Leadership Project will be a fundamental
empirical resource in this new resurgence of research on leadership and that it will enable
29
policymakers, researchers, and citizens to make more accurate and precise comparisons within
countries, across countries, and across regions of the world.

30
XIV. References
Acemoglu, Daron; James A. Robinson. 2012. Why Nations Fail: The Origins of Power, Prosperity, and
Poverty. Crown.
Acemoglu, Daron; Simon Johnson; Amir Kermani; James Kwak; Todd Mitton. 2013. “The Value of
Connections in Turbulent Times: Evidence from the United States.” NBER Working Paper
19701. Cambridge, MA: NBER.
Ahlquist, John S.; Margaret Levi. 2011. “Leadership: What It Means, What It Does, and What We
Want to Know About It.” Annual Review of Political Science 14.
Alesina, Alberto; Eliana La Ferrara. 2005. “Ethnic Diversity and Economic Performance.” Journal of
Economic Literature 43: September, 762-800.
Alexiadou, Despina. 2011. When Ministers Matter. Book manuscript: University of Pittsburgh.
Amsden, Alice H.; Alisa DiCaprio; James A. Robinson (eds). 2012. The Role of Elites in Economic
Development. Oxford: Oxford University Press.
Arel-Bundocky, Vincent; Walter R. Mebane, Jr. 2011. “Measurement Error, Missing Values and
Latent Structure in Governance Indicators.” Presented at the annual meetings of the American
Political Science Association, Seattle WA.
Barber, James David. 1963. The Lawmakers: Recruitment and Adaptation to Legislative Life. New Haven:
Yale University Press.
Barnard, Charles I. 1938. The Functions of the Executive. Cambridge, MA: Harvard University Press.
Berlinski, Samuel; Torun Dewan; Keith Dowding. 2012. Accounting for Ministers: Scandal and Survival in
British Government 1945-2007. Cambridge: Cambridge University Press.
Besley, Timothy. 2005. “Political Selection.” Journal of Economic Perspectives 19:3 (Summer) 43-60.
Besley, Timothy; Jose Montalvo; Marta Reynal-Querol. 2011. “Do Educated Leaders Matter for
Growth?” Economic Journal (Features) 121:5, F205-227.
31
Besley, Timothy; Marta Reynal-Querol. 2011. “Do Democracies Select More Educated Leaders?”
American Political Science Review 105:3, 552-566.
Besley, Timothy; Valentino Larcinese. 2011. “Working or Shirking: A Closer Look at MPs’ Expenses
and Parliamentary Attendance.” Public Choice 145:3-4, 291-317.
Best, Heinrich; Maurizio Cotta (eds). 2000. Parliamentary Representatives in Europe 1848-2000: Legislative
Recruitment and Careers in Eleven European Countries. Oxford: Oxford University Press.
Best, Heinrich; Michael Edinger. 2005. “Converging Representative Elites in Europe? An
Introduction to the EurElite Project.” Czech Sociological Review, 41:3, 499-508.
Bienen, Henry; Nicolas van de Walle. 1991. Of Time and Power: Leadership Duration in the Modern World.
Stanford: Stanford University Press.
Blau, Peter M. 1955. The Dynamics of Bureaucracy. Chicago: Univ. Chicago Press. Revised ed.
Blondel, Jean. 1987. Political Leadership: Towards a General Analysis. London: Sage Publications.
Borchert, Jens; Jurgen Zeiss (eds). 2004. The Political Class in Advanced Democracies: A Comparative
Handbook. Oxford: Oxford University Press.
Bottomore, Tom. 1993. Elites and Society (2nd Edition). London: Routledge.
Brambor, Thomas, Johannes Lindvall and Annika Stjernquist. 2013. “The Ideology of Heads of
Government, 1870-2012: Codebook v. 1.2.” Department of Political Science, Lund University.
Braun, Matías and Claudio Raddatz. 2010. “Banking on Politics: When Former High-ranking
Politicians become Bank Directors.” World Bank Economic Review 24:2, 234-79.
Brezis, Elise S; Peter Temin (eds). 1999. Elites, Minorities and Economic Growth. Amsterdam: Elsevier.
Bunce, Valerie. 1981. Do New Leaders Make a Difference? Executive Succession and Public Policy under
Capitalism and Socialism. Princeton: Princeton University Press.
Burden, Barry C. 2007. The Personal Roots of Representation. Princeton: Princeton University Press.
Burnham, James. 1960. The Managerial Revolution. Bloomington: Indiana University Press.
32
Burns, James MacGregor. 1978. Leadership. New York: Harper & Row.
Burns, John P. 1989. The Chinese Communist Party’s Nomenklatura System: A Documentary Study of Party
Control of Leadership Selection, 1979-1984. Armonk, NY: M.E. Sharpe.
Camp, Roderic A. 1995. Political Recruitment across Two Centuries: Mexico, 1884-1991. Austin, TX:
University of Texas Press.
Camp, Roderic A. 2010. The Metamorphosis of Leadership in a Democratic Mexico. New York: Oxford
University Press.
Carlyle, Thomas. 2009. Sartor Resartus, and On Heroes, Hero-Worship and the Heroic in History. Bibliolife.
Carnes, Nicholas. 2013. White-Collar Government: The Hidden Role of Class in Economic Policy Making.
Chicago: University of Chicago Press.
Casstevens, T. 1989. “The Circulation of Elites: A Review and Critique of a Class of Models.”
American Journal of Political Science 33:1, 294-317.
Central Intelligence Agency (CIA). Various years. Chiefs of State and Cabinet Members of Foreign
Governments. Washington, DC: Central Intelligence Agency. On-line
at www.cia.gov/library/publications/world-leaders-1/index.html
Chattopadhyay R; Esther Duflo. 2004. “Women as Policymakers: Evidence from a Randomized
Policy Experiment in India.” Econometrica 72:5, 1409–43.
Cotta, Maurizio; Heinrich Best (eds). 2007. Democratic Representation in Europe: Diversity, Change, and
Convergence. Oxford: Oxford University.
Dogan, Mattei (ed). 2003. Elite Configurations At The Apex of Power. Leiden: Brill.
Domhoff, G. William. 1967. Who Rules America? New York: McGraw-Hill.
Dowding, Keith; Patrick Dumont (eds). 2009. The Selection of Ministers in Europe: Hiring and Firing.
London: Routledge. Dataset available at www.mzes.uni-
mannheim.de/projekte/sedepe/homepage.php

33
Easterly, William; Ross Levine. 1997. “Africa’s Growth Tragedy: Policies and Ethnic Divisions.”
Quarterly Journal of Economics 112:4, 1203-50.
Elgie, Robert. 1995. Political Leadership in Liberal Democracies. New York: St. Martin's Press.
Enticott, Gareth; George A. Boyne; Richard M. Walker. 2008. “The Use of Multiple Informants in
Public Administration Research: Data Aggregation Using Organizational Echelons.” Journal of
Public Administration Research and Theory 19, 229-53.
Faccio, Mara. 2006. “Politically Connected Firms.” American Economic Review 96:1 (March) 369-86.
Faccio, Mara. 2010. “Differences between Politically Connected and Non-Connected Firms: A
Cross Country Analysis.” Financial Management 39:3 (Autumn) 905-27.
Figueroa, A. 2008. “Competition and Circulation of Economic Elites: Theory and Application to the
Case of Peru.” Quarterly Review of Economics and Finance 48:2, 263-73.
Fisman, Raymond. 2001. “Estimating the Value of Political Connections.” American Economic Review
91:4 (September) 1095-1102.
Goemans, Hein E.; Kristian Skrede Gleditsch; Giacomo Chiozza. 2009. “Introducing Archigos: A
Dataset of Political Leaders.” Journal of Peace Research 46:2, 269-83.
Grindle, Merilee. 2007. “Good Enough Governance Revisited.” Development Policy Review 25:553-74.
Habyarimana, James; Macartan Humphreys; Daniel N. Posner; Jeremy M. Weinstein. 2007. “Why
Does Ethnic Diversity Undermine Public Goods Provision?” American Political Science Review 101:
709-25.
Hargrove, Erwin C. 2004. “History, Political Science, and the Study of Leadership.” Polity 36:4 (July)
579-93.
Hellman, Joel S. 1998. “Winners Take All: The Politics of Partial Reform in Postcommunist
Transitions.” World Politics 50:2, 203-34.

34
Higley, John; Jan Pakulski. 2007. “Elite and Leadership Change in Liberal Democracies.” Comparative
Sociology, Vol. 6. Nos. 1-2. 6-26.
Honaker, James, Gary King, Matthew Blackwell. 2011. “Amelia II: A Program for Missing Data.”
Journal of Statistical Software 45:7, 1-47.
Horowitz, Michael C.; Allan C. Stam. 2010. “Does Where You Stand Depend On If You Served:
Military Service and International Conflict.” Paper presented at the annual meeting of the
Midwest Political Science Association, Chicago, IL (April).
Horowitz, Michael C.; Allan C. Stam; Cali M. Ellis. 2014. “Introducing the Leader Experience,
Attribute, and Decision (LEAD) Dataset.” Presented at the annual meetings of the American
Political Science Association, Washington DC.
Humphreys, Macartan; William A. Masters; Martin E. Sandbu. 2006. “The Role of Leaders in
Democratic Deliberations: Results from a Field Experiment in Sao Tome and Principe.” World
Politics 58 (July) 583-622.
Hunter, Floyd. 1953. Community Power Structure: A Study of Decision Makers. Chapel Hill, NC:
University of North Carolina Press.
Huntington, Samuel. 1968. Political Order in Changing Societies. New Haven: Yale University Press.
Inter-Parliamentary Union. Various years. PARLINE database. Geneva, Switzerland: Inter-
Parliamentary Union. Online at www.ipu.org/parline-e/parlinesearch.asp
Jones, Benjamin F.; Benjamin A. Olken. 2005. “Do Leaders Matter? National Leadership and
Growth since World War II.” Quarterly Journal of Economics 120:3 (August) 835-64.
Jones, Bryan D, ed. 1989. Leadership and Politics: New Perspectives in Political Science. Lawrence:
University Press of Kansas.
Kaufmann, Daniel, Aart Kraay; Massimo Mastruzzi. 2007. “Governance Matters IV: Governance
Indicators for 1996-2006.” Washington: World Bank.

35
Knoke, David. 1990. Political Networks: The Structural Perspective. Cambridge: Cambridge University
Press.
Lasswell, Harold Dwight; Daniel Lerner. 1952. The Comparative Study Of Elites: An Introduction And
Bibliography. Hoover Institute Studies.
Lipset, Seymour Martin; Aldo Solari (eds). 1967. Elites in Latin America. London: Oxford University
Press.
Mills, C. Wright. 1956. The Power Elite. London: Oxford University Press.
Morrison, Kevin M. 2011. “When Public Goods Go Bad: The Implications of the End of the
Washington Consensus for the Study of Economic Reform.” Comparative Politics 44:1, 105-22.
Mosca, Gaetano. 1939. The Ruling Class. McGraw-Hill.
Mouritzen, Poul Erik, James H. Svara. 2002. Leadership at the Apex: Politicians and Administrators in
Western Local Governments. Pittsburgh: University of Pittsburgh Press.
Nagle, John D. 1977. System and Succession: The Social Bases of Political Elite Recruitment. Austin:
University of Texas Press.
Nelson, Stephen C. 2014. “Playing Favorites: How Shared Beliefs Shape the IMF’s Lending
Decisions.” International Organization 68(2): 297-328.
Nohria, Nitin; Rakesh Khurana (eds). 2010. Handbook of Leadership Theory and Practice. Cambridge:
Harvard Business Review Press.
Norris, Pippa (ed). 1997. Passages to Power: Legislative Recruitment in Advanced Democracies. Cambridge:
Cambridge University Press.
Pareto, Vilfredo. 1935. The Mind and Society [Trattato Di Sociologia Generale]. Harcourt, Brace.
Prewitt, Kenneth. 1970. The Recruitment of Political Leaders: A Study of Citizen-Politicians. Indianapolis:
Bobbs-Merrill.
Putnam, Robert D. 1976. The Comparative Study of Political Elites. New Jersey: Prentice Hall.
36
Putnam, Robert D. 1977. “Elite Transformation in Advance Industrial Societies: An Empirical
Assessment of the Theory of Technocracy.” Comparative Political Studies 10:3, 383–411.
Remmer, Karen. 1984. Party Competition in Argentina and Chile: Political Recruitment and Public Policy,
1890-1930. Lincoln: University of Nebraska Press.
Reynolds, Andrew. 2011. Designing Democracy in a Dangerous World. Oxford: Oxford University Press.
Riker, William. 1986. The Art of Political Manipulation. New Haven, CT: Yale University Press
Roeder, Philip G. 1985. “Do New Soviet Leaders Really Make a Difference? Rethinking the
‘Succession Connection.’” American Political Science Review 79:4 (December) 958-76.
Rotberg, Robert I. 2012. Transformative Political Leadership: Making a Difference in the Developing World.
Chicago: University of Chicago Press.
Ruedin, Didier. 2009. “Ethnic Group Representation in a Cross-National Comparison.” Journal of
Legislative Studies, 15: 4, 335 -354.
Samatar, Abdi Ismail. 1997. “Leadership and Ethnicity in the Making of African State Models:
Botswana and Somalia.” Third World Quarterly 18:4, 687-707.
Samuels, Richard J. 2003. Machiavelli's Children: Leaders and Their Legacies in Italy and Japan. Ithaca:
Cornell University Press.
Schattschneider, E. E. 1960. The Semi-Sovereign People. New York: Holt, Rinehart, and Winston.
Schlesinger, Joseph A. 1966. Ambition and Politics: Political Careers in the United States. New York: Rand
McNally.
Schwartz, M. (ed.) 1987. The Structure of Power in America: The Corporate Elite as a Ruling Class. New
York: Holmes & Meier.
Selznick, Philip. 1957. Leadership in Administration: A Sociological Interpretation. New York: Harper &
Row.

37
Siavelis, Peter M.; Scott Morgenstern (eds). 2008. Pathways to Power: Political Recruitment and Candidate
Selection in Latin America. University Park, PA: Pennsylvania State University Press.
Spilimbergo, Antonio. 2009. “Democracy and Foreign Education.” American Economic Review 99:1,
528-43.
Stigler, George J. 1976. “The Sizes of Legislatures.” Journal of Legal Studies 5:1 (January) 17-34.
Stone, Samuel Z. 1990. The Heritage of the Conquistadors: Ruling Classes in Central America from the
Conquest to the Sandinistas. Lincoln: University of Nebraska Press.
Thomas, M.A. 2010. “What Do the Worldwide Governance Indicators Measure?” European Journal of
Development Research 22, 31-54.
Waldner, David. 1999. Statebuilding and Late Development. Ithaca, NY: Cornell University Press.
Wallis, Joe. 1998. “Understanding the Role of Leadership in Economic Policy Reform” World
Development 27:1 (January) 39-53.
Wängnerud, Lena. 2009. “Women in Parliaments: Descriptive and Substantive Representation.”
Annual Review of Political Science, 12:51-69.
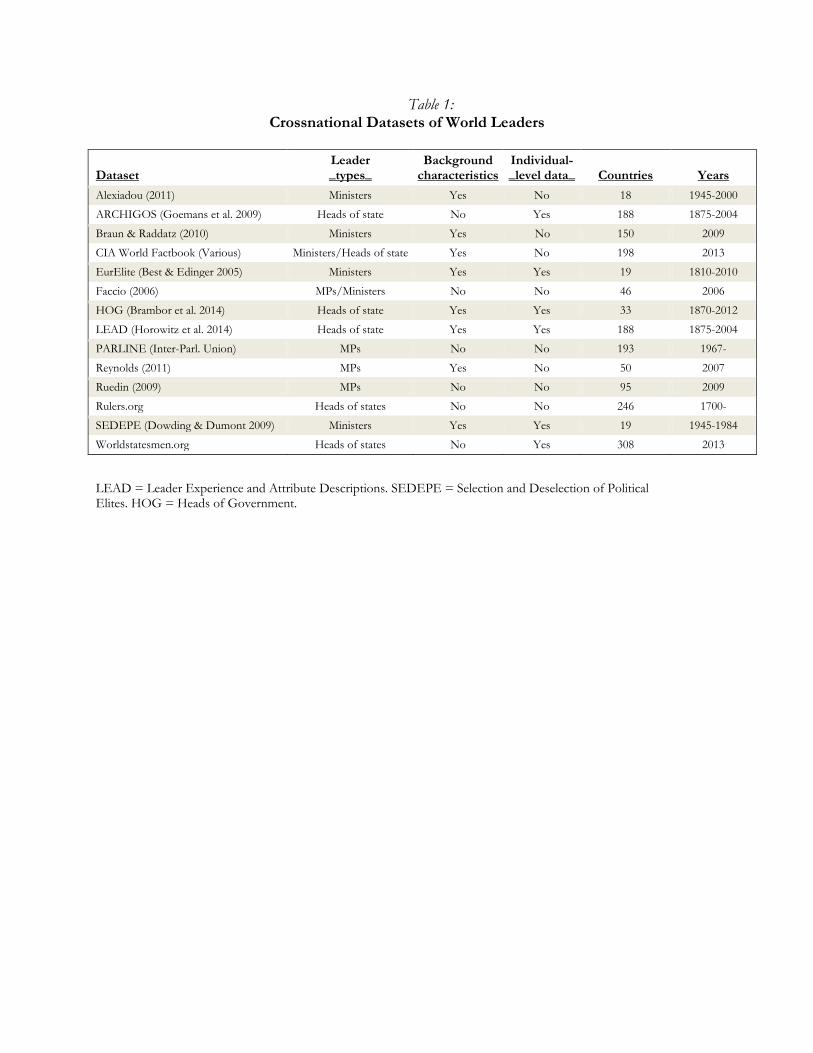
Table 1: Crossnational Datasets of World Leaders
Dataset Leader _types_
Background characteristics
Individual- _level data_ Countries Years
Alexiadou (2011) Ministers Yes No 18 1945-2000
ARCHIGOS (Goemans et al. 2009) Heads of state No Yes 188 1875-2004
Braun & Raddatz (2010) Ministers Yes No 150 2009
CIA World Factbook (Various) Ministers/Heads of state Yes No 198 2013
EurElite (Best & Edinger 2005) Ministers Yes Yes 19 1810-2010
Faccio (2006) MPs/Ministers No No 46 2006
HOG (Brambor et al. 2014) Heads of state Yes Yes 33 1870-2012
LEAD (Horowitz et al. 2014) Heads of state Yes Yes 188 1875-2004
PARLINE (Inter-Parl. Union) MPs No No 193 1967-
Reynolds (2011) MPs Yes No 50 2007
Ruedin (2009) MPs No No 95 2009
Rulers.org Heads of states No No 246 1700-
SEDEPE (Dowding & Dumont 2009) Ministers Yes Yes 19 1945-1984
Worldstatesmen.org Heads of states No Yes 308 2013
LEAD = Leader Experience and Attribute Descriptions. SEDEPE = Selection and Deselection of Political Elites. HOG = Heads of Government.

2
Table 2: Countries in the GLP Sample
Africa
1. Benin 2. Burkina Faso 3. Burundi 4. Cameroon 5. Cape Verde 6. CAR 7. Congo (DRC) 8. Congo (Republic) 9. Cote d’Ivoire 10. Djibouti 11. Ethiopia 12. Gabon 13. Gambia 14. Ghana 15. Guinea 16. Guinea-Bissau 17. Kenya 18. Lesotho 19. Liberia* 20. Madagascar 21. Malawi 22. Mali 23. Mauritius 24. Mozambique* 25. Namibia 26. Niger 27. Rwanda 28. Senegal 29. Sierra Leone 30. Somaliland 31. South Africa 32. South Sudan 33. Sudan* 34. Tanzania 35. Togo 36. Uganda* 37. Zambia
Americas 38. Argentina 39. Bolivia 40. Brazil 41. Canada 42. Chile 43. Colombia 44. Costa Rica 45. Cuba 46. Dominican Rep 47. Ecuador 48. El Salvador 49. Guatemala 50. Guyana 51. Haiti* 52. Honduras 53. Jamaica 54. Mexico 55. Nicaragua 56. Panama 57. Paraguay 58. Peru 59. United States 60. Uruguay 61. Trinidad/Tobago 62. Venezuela
Asia 63. Afghanistan* 64. Armenia 65. Australia 66. Azerbaijan* 67. Cambodia 68. China 69. Georgia 70. India 71. Indonesia 72. Japan 73. Kazakhstan
74. Kyrgyzstan 75. Korea, South 76. Malaysia 77. Mongolia 78. New Zealand 79. Pakistan 80. Philippines 81. Russian Fed 82. Singapore 83. Solomon Islands 84. Tajikistan 85. Thailand 86. Turkmenistan 87. Timor-Leste 88. Uzbekistan 89. Vietnam Europe 90. Albania 91. Austria 92. Belarus* 93. Belgium 94. Bosnia 95. Bulgaria 96. Croatia 97. Czech Republic 98. Denmark 99. Estonia 100. Finland 101. France 102. Germany 103. Greece 104. Hungary 105. Iceland 106. Ireland 107. Italy 108. Kosovo 109. Latvia 110. Lithuania
111. Luxembourg 112. Macedonia 113. Malta 114. Moldova 115. Montenegro 116. Netherlands 117. Norway 118. Poland 119. Portugal 120. Romania 121. Serbia 122. Slovakia 123. Slovenia 124. Spain 125. Sweden 126. Switzerland 127. Ukraine 128. United Kingdom MENA 129. Algeria 130. Bahrain 131. Cyprus (Turkey) 132. Egypt 133. Iran 134. Israel 135. Jordan 136. Lebanon 137. Morocco 138. Oman 139. Palestinian Terr. 140. Qatar 141. Saudi Arabia* 142. Tunisia 143. Turkey 144. UAE 145. Yemen
*20-50% of the data is missing. Sixteen additional countries are included the GLP database but not in the sample employed for the present study (by reason of missing data): Angola, Bangladesh, Botswana, Cyprus, Iraq, Libya, Mauritania, Myanmar, Nepal, Nigeria, North Korea, Papua New Guinea, Puerto Rico, Sri Lanka, Syria, Taiwan, Zimbabwe.

3
Table 3: Completeness
Sample Sampling
Frame
Countries 145 145
Pooled observations Leaders (N) 38085 40,022 Potential responses (N) 1,180,635 1,240,682 Actual responses (N) 838,501 Actual/Potential responses (%) 71% 68%
By question 1. Name [text] * 100% 95% 2. Year of birth * 77 73 3. Place of birth [text] 78 74 4. Born abroad (Y/N) * 77 74 5. Sex * 97 93 6. Marital status * 60 57 7. Number of children 34 32 8. Native language [text] * 87 83 9. Additional languages spoken [text] * 20 19 10. Current religion and sect [text] 56 53 11. Religion of family [text] 58 56 12. Ethnocultural group [text] 91 86 13. Criteria used to determine ethnocultural identity 71 68 14. Office type * 100 95 15. Year service in current position began * 91 87 16. Apex of power * 96 91 17. Next 10 most powerful * 96 91 18. Linked to a prominent family/clan name [text] 100 95 19. Prior occupation * 82 78 20. Political background (area of experience) * 59 56 21. Location of political base [text] 40 38 22. Party affiliation [text] 88 83 23. Position in party [text] 41 39 24. Member or ally of ruling party/coalition 35 33 25. Partisan/nonpartisan (Y/N) 95 90 26. Education (highest level completed) * 78 74 27. Colleges/universities attended [text] 57 54 28. Location (city/country) of colleges/universities 57 54 29. Undergraduate degree (discipline) * 66 63 30. Educated in west (Y/N) * 57 54 31. Educated abroad (Y/N) * 57 54 Mean (%) 71 68
Sample = leaders whose names are entered in the GLP database. Sampling frame = all leaders whose existence we are aware of among the studied countries. * Missing values imputed.

4
Table 4: Leaders Classified by Office
_LEADERS_ ________COUNTRIES________
OFFICES N % N M Med SD Range
Most powerful Apex (1-2) 210 0.5 145 1.45 1 0.5 Next 10 (“+10”) 1220 3 143 9 9 2
Executive branch Executive 224 0.5 145 1.5 1 0.8 1/8
Cabinet 3664 8.8 145 25 22 14 2/86
Staff 759 1.8 105 7 4 9 1/54
Legislature
Party leaders 1249 3 130 10 7 10 1/74
Assembly leaders 1915 4.6 143 13 6 18 1/103
All MPs 31269 75.2 145 216 139 276 23/2989
Court 1032 2.5 136 8 7 7 1/37
Other unelected 1483 3.6 122 12 5 21 1/150
TOTAL 41595 100 145
N=number. M=mean. Med=median. SD=standard deviation. Range=minimum/maximum. Total=includes all previous categories except Most powerful (which is redundant). Numbers are usually rounded to nearest integer.
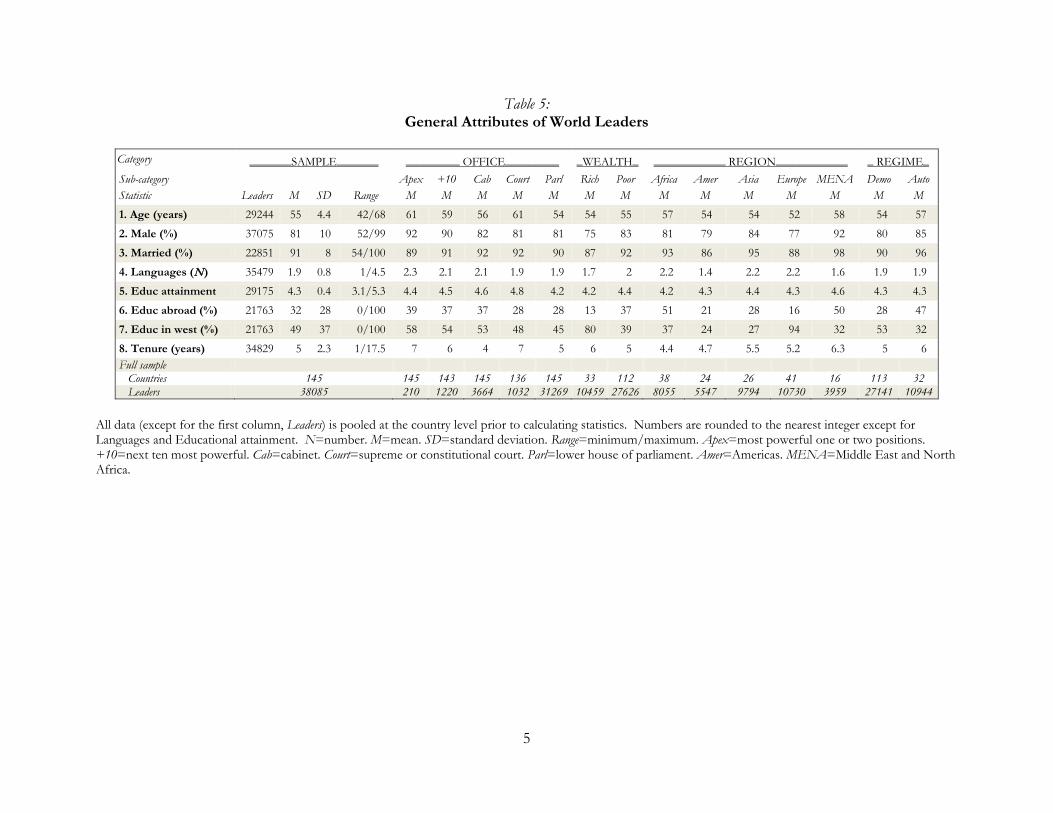
5
Table 5: General Attributes of World Leaders
Category _______SAMPLE_______ _________ OFFICE_________ _WEALTH_ ____________ REGION____________ _ REGIME_ Sub-category Apex +10 Cab Court Parl Rich Poor Africa Amer Asia Europe MENA Demo Auto Statistic Leaders M SD Range M M M M M M M M M M M M M M
1. Age (years) 29244 55 4.4 42/68 61 59 56 61 54 54 55 57 54 54 52 58 54 57
2. Male (%) 37075 81 10 52/99 92 90 82 81 81 75 83 81 79 84 77 92 80 85
3. Married (%) 22851 91 8 54/100 89 91 92 92 90 87 92 93 86 95 88 98 90 96
4. Languages (N) 35479 1.9 0.8 1/4.5 2.3 2.1 2.1 1.9 1.9 1.7 2 2.2 1.4 2.2 2.2 1.6 1.9 1.9
5. Educ attainment 29175 4.3 0.4 3.1/5.3 4.4 4.5 4.6 4.8 4.2 4.2 4.4 4.2 4.3 4.4 4.3 4.6 4.3 4.3
6. Educ abroad (%) 21763 32 28 0/100 39 37 37 28 28 13 37 51 21 28 16 50 28 47
7. Educ in west (%) 21763 49 37 0/100 58 54 53 48 45 80 39 37 24 27 94 32 53 32
8. Tenure (years) 34829 5 2.3 1/17.5 7 6 4 7 5 6 5 4.4 4.7 5.5 5.2 6.3 5 6 Full sample Countries 145 145 143 145 136 145 33 112 38 24 26 41 16 113 32 Leaders 38085 210 1220 3664 1032 31269 10459 27626 8055 5547 9794 10730 3959 27141 10944
All data (except for the first column, Leaders) is pooled at the country level prior to calculating statistics. Numbers are rounded to the nearest integer except for Languages and Educational attainment. N=number. M=mean. SD=standard deviation. Range=minimum/maximum. Apex=most powerful one or two positions. +10=next ten most powerful. Cab=cabinet. Court=supreme or constitutional court. Parl=lower house of parliament. Amer=Americas. MENA=Middle East and North Africa.
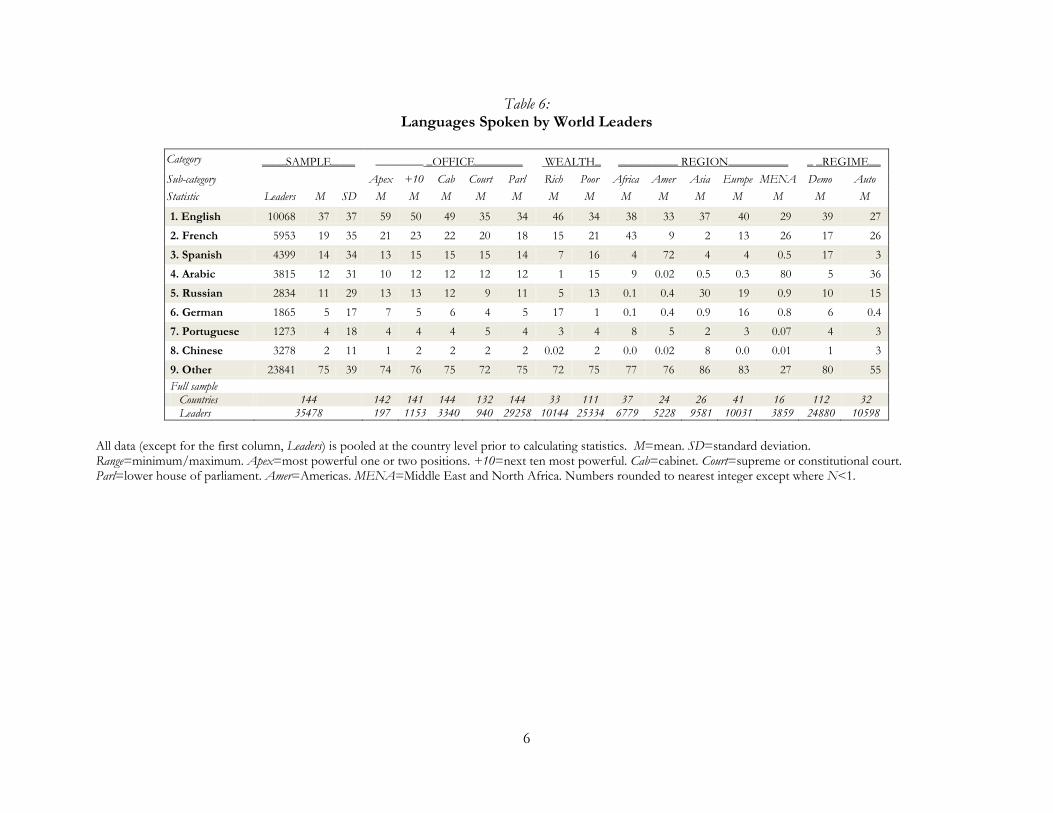
6
Table 6: Languages Spoken by World Leaders
Category ____SAMPLE____ ________ _OFFICE________ WEALTH_ __________ REGION__________ _ _REGIME__ Sub-category Apex +10 Cab Court Parl Rich Poor Africa Amer Asia Europe MENA Demo Auto Statistic Leaders M SD M M M M M M M M M M M M M M
1. English 10068 37 37 59 50 49 35 34 46 34 38 33 37 40 29 39 27
2. French 5953 19 35 21 23 22 20 18 15 21 43 9 2 13 26 17 26
3. Spanish 4399 14 34 13 15 15 15 14 7 16 4 72 4 4 0.5 17 3
4. Arabic 3815 12 31 10 12 12 12 12 1 15 9 0.02 0.5 0.3 80 5 36
5. Russian 2834 11 29 13 13 12 9 11 5 13 0.1 0.4 30 19 0.9 10 15
6. German 1865 5 17 7 5 6 4 5 17 1 0.1 0.4 0.9 16 0.8 6 0.4
7. Portuguese 1273 4 18 4 4 4 5 4 3 4 8 5 2 3 0.07 4 3
8. Chinese 3278 2 11 1 2 2 2 2 0.02 2 0.0 0.02 8 0.0 0.01 1 3
9. Other 23841 75 39 74 76 75 72 75 72 75 77 76 86 83 27 80 55 Full sample Countries 144 142 141 144 132 144 33 111 37 24 26 41 16 112 32 Leaders 35478 197 1153 3340 940 29258 10144 25334 6779 5228 9581 10031 3859 24880 10598
All data (except for the first column, Leaders) is pooled at the country level prior to calculating statistics. M=mean. SD=standard deviation. Range=minimum/maximum. Apex=most powerful one or two positions. +10=next ten most powerful. Cab=cabinet. Court=supreme or constitutional court. Parl=lower house of parliament. Amer=Americas. MENA=Middle East and North Africa. Numbers rounded to nearest integer except where N<1.

7
Table 7: Disciplinary Background of World Leaders
Category ________SAMPLE________ ___________ OFFICE___________ WEALTH_ ___________ REGION___________ __ REGIME__ Sub-category Apex +10 Cab Court Parl Rich Poor Africa Amer Asia Europe MENA Demo Auto Statistic Leaders M SD Range M M M M M M M M M M M M M M
1. Agronomy 766 3 3 0/12 2 0.7 3 0 4 3 3 3 3 4 3 1 3 3
2. Engineering 2347 9 6 0/33 5 9 10 0.9 9 7 10 6 8 11 10 12 9 10
3. Math/CS 364 2 2 0/9 3 1 1 0.2 1 1 2 2 0.8 2 2 3 1 2
4. Bio/Chem/Physics 731 3 2 0/17 3 3 3 0.1 3 3 3 3 2 3 3 3 3 3
5. Medicine 1525 6 4 0/25 4 4 6 0 7 5 7 7 6 5 7 6 6 6
6. Econ/Bus/Manag 5196 22 8 4/59 35 24 26 2 23 19 23 25 22 23 19 22 22 24
7. Social Sciences 2908 12 8 0/33 15 15 12 4 13 15 11 12 12 12 12 11 12 11
8. Law 5216 21 10 2/54 17 23 17 90 16 24 21 20 29 17 22 19 23 18
9. Humanities 2332 9 7 0/46 4 7 9 3 10 10 9 8 6 12 9 8 9 8
10. Military 516 3 3 0/16 9 5 2 0.08 1 0.7 2 3 1 2 1 4 1 4
11. Other 3289 11 10 0/52 5 9 10 0.3 13 12 11 12 9 8 12 13 11 10 Full sample Countries 145 132 142 144 127 144 33 112 38 24 26 41 16 113 32 Leaders 25190 183 1016 2932 928 19879 8569 16621 3461 4089 6860 8801 1979 19310 5880
All data (except for the first column, Leaders) is pooled at the country level prior to calculating statistics. M=mean. SD=standard deviation. Range=minimum/maximum. Apex=most powerful one or two positions. +10=next ten most powerful. Cab=cabinet. Court=supreme or constitutional court. Parl=lower house of parliament. Amer=Americas. MENA=Middle East and North Africa. Numbers rounded to nearest integer except when N<1.

8
Table 8:
Occupational Background of World Leaders
Category ______SAMPLE______ ________ OFFICE________ _WEALTH_ ________ _REGION_________ _ REGIME_ Sub-category Apex +10 Cab Court Parl Rich Poor Africa Amer Asia Europe MENA Demo Auto Statistic Leaders M SD Range M M M M M M M M M M M M M M
1. White collar 15504 55 22 0/98 36 45 50 69 57 58 54 48 65 54 58 53 57 49
2. Blue collar 676 2 4 0/30 0.4 2 1 0.3 2 4 2 2 1 1 4 1 2 1
3. Education 3252 12 8 0/33 10 11 14 10 12 10 12 14 10 9 11 15 11 14
4. Media 779 1 2 0/8 2 0.8 0.8 0 1 1 1 0.7 2 0.9 1 1 1 0.9
5. Military 298 2 4 0/39 9 6 2 0 2 0.5 3 3 0.8 3 0.7 5 1 6
6. None or politics 8737 22 23 0/98 35 29 29 16 21 23 22 26 16 26 21 17 21 25
7. Other 2152 6 11 0/100 9 5 4 6 5 3 6 7 5 6 4 9 6 6 Full sample Countries 145 138 141 144 120 141 33 112 38 24 26 41 16 113 32 Leaders 31398 195 1102 3079 824 25725 10170 21228 4852 4983 9013 10129 2421 23552 7846
All data (except for the first column, Leaders) is pooled at the country level prior to calculating statistics. M=mean. SD=standard deviation. Range=minimum/maximum. Apex=most powerful one or two positions. +10=next ten most powerful. Cab=cabinet. Court=supreme or constitutional court. Parl=lower house of parliament. Amer=Americas. MENA=Middle East and North Africa. Numbers rounded to nearest integer except when N<1.

9
Table 9: Political Experience of World Leaders
Category ______SAMPLE______ __________OFFICE__________ _WEALTH_ ____________REGION____________ _REGIME_ Sub-category Apex +10 Cab Court Parl Rich Poor Africa Amer Asia Europe MENA Demo Auto Statistic Leaders M SD Range M M M M M M M M M M M M M M
1. None 1651 7 12 0/70 6 6 7 32 6 9 6 6 10 8 4 11 7 7
2. Trade union 242 2 9 0/100 0.8 0.9 2 0 2 1 2 2 2 5 0.8 0.8 1 4
3. Employers org 195 2 7 0/73 0 1 2 6 2 0.3 2 3 2 2 0.2 1 1 2
4. Interest group 463 3 6 0/40 3 1 3 12 2 3 2 3 4 2 3 0.8 2 3
5. NGO/INGO 1796 9 15 0/72 7 9 9 8 10 5 11 15 13 7 4 8 10 8
6. Local govt 4301 16 18 0/98 5 6 10 4 18 23 14 9 24 14 22 10 17 13
7. MP/minister 4935 22 20 0/80 29 25 27 20 22 20 23 29 13 22 22 19 22 22
8. Partisan 8970 38 27 0/99 50 50 40 19 38 40 38 34 33 40 45 36 39 35 Full sample Countries 143 122 137 138 61 137 33 110 38 24 26 41 14 113 30 Leaders 22553 178 948 2442 239 18633 8743 13810 3698 3830 4389 9066 1570 19107 3446
All data (except for the first column, Leaders) is pooled at the country level prior to calculating statistics. M=mean. SD=standard deviation. Range=minimum/maximum. Apex=most powerful one or two positions. +10=next ten most powerful. Cab=cabinet. Court=supreme or constitutional court. Parl=lower house of parliament. Amer=Americas. MENA=Middle East and North Africa. Numbers rounded to nearest integer.

10
Table 10: Salaries of Parliamentarians around the World
Category _________SAMPLE_________ ___WEALTH___ __________________REGION__________________ __REGIME__ Sub-category Rich Poor Africa Amer Asia Europe MENA Demo Auto Statistic M SD Range M M M M M M M M M
1. Salary (USD) 72,081 64,721 1,774/369,984 113,362 45,420 44,411 75,849 81,797 80,039 78,186 75,658 35,281
2. Salary/GDPpc 9.6 18 0.3/116 3 14 29 8 6 3 6 8 25 Full sample Countries 79 31 48 17 10 15 31 6 72 7 Lower House MPs 18587 8298 10289 3719 2181 3452 7768 1467 17352 1235
All data is pooled at the country level prior to calculating statistics (numbers of lower house MPs is provided for reference only and does not mean that salaries are collected at the leader level). M=mean. SD=standard deviation. Range=minimum/maximum. Amer=Americas. MENA=Middle East and North Africa. Official salaries of members of parliament (MPs) expressed (1) in USD, rounded to the nearest integer, and (2) as a share of per capita GDP.

11
Table 11: Descriptive Representation
Category ____SAMPLE____ ________OFFICE________ _WEALTH_ ___________REGION___________ _REGIME_
Sub-category Apex +10 Cab Court Parl Rich Poor Africa Amer Asia Europe MENA Demo Auto
Statistic M SD Range M M M M M M M M M M M M M M
1. Privileged (%) 7.4 13.8 -29/66 9.6 11.6 14 21.4 7.0 10.5 6.5 3.9 7.7 8.2 6.2 17.6 7.0 9.5
2. Underprivileged (%) -11.3 19.8 -90/1 -4.4 -2.3 -8.7 -7.7 -10.0 -6.7 -13.5 -13.7 -18.2 -10.6 -4.9 -18.4 -11.1 -14.3 Full sample Countries 121 112 120 117 95 117 31 90 26 21 24 37 13 98 23
All data is pooled at the country level prior to calculating statistics. M=mean. SD=standard deviation. Range=minimum/maximum. Apex=most powerful one or two positions. +10=next ten most powerful. Cab=cabinet. Court=supreme or constitutional court. Parl=lower house of parliament. Amer=Americas. MENA=Middle East and North Africa. Descriptive representation is calculated by subtracting an ethnocultural group’s share of the population (%) from the share (%) of leaders who belong to that group. A positive (negative) number signifies over- (under-) representation.

12

Appendix A: GLP Questionnaire
For most of the following questions (except the most obvious), three additional fields are available:
a) Uncertain. If checked, this means that the coder is uncertain about the answer to this question. Default: unchecked. Evidently, certainty will be greater for some questions (e.g., sex) than for others (e.g., political power). However, in checking the Uncertainty box we are asking for an estimate relative to other answers to that particular question. Thus, if a coder is more uncertain about one person’s level of power, relative to other persons’ political power, the coder should register this uncertainty by checking the appropriate box.
b) Assumed. If checked, the answer to the question is inferred, rather than based on source material. Default: unchecked.
c) Notes. An open-ended field that offers space (lots of space) for coders to comment on any aspect of a question. This includes problems pertaining to the coding. Here, the coder can explain why s/he checked the Uncertain box. S/he can also describe special sources (published or unpublished) used to code that question and any additional persons consulted. If someone other than the principal coder enters data for an entry, or changes that entry, this should be noted here.
A few coding categories are adopted from the SEDEPE codebook (http://sedepe.net/?page_id=169), as designated below. A number of the questions require the coder to define a category, e.g., family/clan, a region, religion, or ethnic/racial/cultural group. In these instances, the coder is instructed to use whatever categories are common in the country, making sure that the terminology is consistent through the questionnaire. Likewise, where party groupings are indistinct, the coder must make a judgment about which party groupings are real and which are artificial. For example, it is traditional to code the German CDU and CSU as the same party. Likewise, some independents in the US Senate are perhaps better coded as members of one of the major parties. This is left to the coder’s discretion.
Country-Level Questions I. Election Dates
1. Date of most recent presidential election (if any): (day/month/year) 2. Date of most recent national legislative election (if any): (day/month/year)
II. Ethnocultural Identity
1. List all salient ethnocultural (cultural, ethnic, religious, linguistic) groups. Salient means politically, socially, or culturally significant – regardless of size. For each group:
2. What is the total population (raw number)? 3. What is the size of that group as a share of total population in the country (%)? 4. Is the group defined by ethnicity? Y/N

5. Is the group defined by language? Y/N 6. Is the group defined by religion? Y/N 7. Which description best characterizes the location of this ethnic group within the country?
Are most members of this group… (a) Living in one area? (b) If yes, where? (c) Living together but in different places? (d) Living diffusely across country?
8. Rank the foregoing ethnocultural (cultural, ethnic, religious, linguistic) groups according to their relative economic status (the mean economic status of all members of each group).
III. Legislature All questions pertaining to assemblies or legislatures in the following survey are assumed to refer to the body listed below.
1. If unicameral, list the name of the legislature. 2. If bicameral, list the name of the more powerful house or (if equal in power) the lower
house. 3. If no legislature (in the usual sense), list the preeminent unelected consultative body.
IV. Parties
1. List all political parties with seats in the national legislature (most powerful house, if bicameral; both houses if symmetrical in power)
2. For each party, list the ethnocultural group or groups that it is identified with (i.e., its social base), if any.
V. Other
1. Does the country have a mixed electoral system? Y/N 2. What is the annual salary of an MP?
Individual-Level Questions I. Types of Leaders
1. Executive – the person or persons who administers the executive branch agencies (the person to whom agency chiefs report). Typically, this is a president or prime minister. Note that in some polities this person takes orders or pays obeisance to an unelected official, e.g., a monarch, military ruler, or religious figure. In designating the executive you are not making any claims about the executive’s de facto authority but merely his/her de jure authority. Occasionally, the executive is truly collegial, as in Switzerland. However, in most parliamentary systems there is a single “prime” minister or chancellor who is primus inter pares, and who should therefore be designated as the executive.
2. Cabinet/Ministers – ministers, including ministers without portfolio. For each, answer the following question… What is his/her policy area? (If the minister is in charge of more than one policy area please list each of these policy areas.)
a) First

b) Second (if more than one) c) Third (if more than two) OPTIONS [SEDEPE]:
1 PM or equivalent 2 Vice or deputy PM 3 Without portfolio 4 Finance/Treasury/Budget 5 Economy 6 Justice 7 Foreign affairs 8 Defence 9 Interior 10 Agriculture 11 Fisheries, sea 12 Industry 13 Commerce 14 Social affairs 15 Health 16 Labour, employment 17 Family, youth 18 Transport 19 Construction, housing, urbanization 20 Environment 21 Research, technology 22 Culture 23 Foreign trade 24 Posts, telecommunications 25 Sports 26 Foreign aid 27 Civil service 28 Public works 29 Energy 30 Planning, land management 31 Regional affairs 32 War veterans, refugees and repatriation 33 Relations with parliament 34 Education 35 Information 36 Leisure, tourism 37 Consumer affairs 38 Food 39 Women (gender–equal opportunities?) 40 European affairs 41 Other 99 Not known
3. Executive staff – important members of the executive who serve in an advisory capacity but are not presidents, cabinet members, ministers, or MPs. For each, designate their principal policy area:

a) General (non-specific) b) Economy/finance/budget c) Other domestic d) Foreign/defense
4. Party leaders – leaders of parties seated in the assembly (they may or may not hold a seat in the assembly or some official position in government).
5. Assembly leaders – includes all those with official party and legislative positions (e.g., the speaker, caucus leaders, whips, committee chairs, but not subcommittee chairs).
6. Assembly backbenchers – all those in the assembly not designated as leaders (above). 7. Supreme court – members of the top court or constitutional court (that which has jurisdiction
over constitutional issues). 8. Other unelected bodies – unelected persons (e.g., a monarch, religious leader, military leader or
junta) who exert influence over a range of policy issues (not just a specialized issue-area). The breadth of influence is important here. For example, a central bank may be influential (perhaps even dominant) in setting monetary policy, but it does not typically influence the formation of policy in other areas (except by spillover). By contrast, a monarch, religious leader, or military leader may reach into diverse areas of policy. In this respect, and to the extent that they are able to influence these other policy areas, they are rightly considered as key political leaders within a polity.
II. Questions applied to each leader listed above
1. Official position (English)? 2. Official position (local language)? 3. Year in which service in current position began (the date on which the person assumed
office, not the date of election or appointment)? 4. For countries with a mixed electoral system, which system was s/he elected under? (a) PR
or (b) FPP 5. Is the person at the apex of power in the country? This refers to the 1 or 2 most powerful
people in a country. Note that sometimes there is a single most powerful person (e.g., president). At other times, there are two people of roughly equal power (e.g., a president and prime minister). Y/N
6. Is the person among the next 10 most powerful people in the country? (Does not include those at the apex.) Y/N
7. Non-political occupation (prior or concurrent with current political post)? [SEDEPE] a) No previous occupation (including unemployed) b) Self-employed: professional (accountant, architect, lawyer, medical doctor etc.) c) Self-employed: small businessman d) Self-employed: farmer, fisherman e) Employed: professional (accountant, architect, lawyer, medical doctor etc.) f) Employed: middle management (department head, technician etc.) g) Employed: top management / director / CEO h) Employed: other white-collar worker i) Employed: blue-collar worker j) Education: school teacher k) Education: university professor l) Full-time politician (paid by party organisation, parliament, government; think tanks;
living of politics)

m) Full-time interest group official (trade union) n) Full-time interest group official (employers’ association) o) International organization top management p) International organization other q) Unemployed r) Military Officer s) Media (Pundit, journalist, columnist, etc…) t) Landlord u) Other
8. Political experience? a) National trade union b) National employers organization c) National other interest group d) Supra-national trade union e) Supra-national employers organization f) Supra-national other interest group g) Governmental international organization h) NGO i) Local government j) Municipal position k) Party organization/administration l) Party youth branch m) Political movement n) Political Advisor o) Previous MP p) Previous Minister q) None
9. Highest level of education completed? a) Primary b) Secondary c) Higher education non university d) University / college e) Post-graduate (anything except Ph.D. degree) f) Ph.D.
10. List all post-secondary colleges/universities attended? 11. Locations (city/country) of college/university? 12. Principal course of study for undergraduate degree? [SEDEPE]
a) Agronomy b) Economics/Business/Management c) Engineering d) Mathematics/Computer science e) Biology/Chemistry/Physics f) Humanities g) Social sciences h) Law i) Medicine j) Military k) Other

13. Course of study for highest degree (if different than undergraduate degree)? [as above]
14. Year of birth? (day/month/year) 15. Sex? (M/F) 16. Party affiliation? (English) 17. Party affiliation? (local language) 18. Position in party, if significant? (English) 19. Position in party, if significant? (local language) 20. Coalition affiliation (if different from the previous)? 21. Member of, or closely allied to, the current ruling party or coalition? (Y/N) 22. Nonpartisan? (Y/N). This may be inferred if partisanship is very difficult to obtain. What we
are Interested in is a person’s official partisanship; if s/he chooses to keep this secret, s/he should be classified as nonpartisan.
23. Linked by birth or marriage to a prominent family or clan? (Y/N). 24. If yes, what is the family or clan name? 25. Place of birth (i.e., location in which family was residing when person was born)? 26. Born abroad? (Y/N) 27. Marital status? (Married/Single/Divorced) 28. Place of long-term affiliation or current political base? 29. Native language? 30. Additional languages spoken? 31. Religion of family (at birth)? (Options include “none” and “none apparent.”) 32. Current religion and sect? (Options include “none”, “atheist” and “agnostic.”) 33. Ethnocultural affiliation? 34. Criteria used to determine ethnocultural identity?
(a) Birth place (b) Skin color (c) Language (d) Name (e) Family background (f) Religion (g) Education (h) Self-proclamation/Official Statement (i) Interaction with "in-group" members (j) Participation in group- related activity (k) Secondary Sources (l) Political discourse (m) Political Base (n) Political Party membership (o) Other

Appendix B: Imputed Data
As a check against possible bias induced by this pattern of missing-ness, we have imputed missing
values for all of the individual-level variables reported in the following tables except ethnocultural
group, which involves myriad categories and is therefore difficult to impute. The imputation
involves all leaders in the sampling frame in Table 3 (N=40022). Note that the variables of concern
are mostly nominal. To approximate what a ‘complete’ data set would look like, we impute missing
data using the Amelia II program developed by Honaker et al. (2011). This program converts each
nominal variable into a series of binary variables, imputes missing data, and then uses the imputed
values to calculate a probability for each category. Data in the final imputed dataset represents draws
from a discrete distribution based on those probabilities. This appendix replicates Tables 5-9 using
an imputed dataset, as described in the text.

Table B1 (replicating Table 5): General Attributes of World Leaders (imputed dataset)
Category _________ __SAMPLE__________ _________ OFFICE_________ _WEALTH_ ____________ REGION____________ _ REGIME_ Sub-category Apex +10 Cab Court Parl Rich Poor Africa Amer Asia Europe MENA Demo Auto Statistic Leaders Countries M SD Range M M M M M M M M M M M M M M
1. Age (years) 40022 145 54 3 44/63 59 58 55 61 54 54 54 54 54 54 53 56 54 55
2. Male (%) 40022 145 81 9 53/99 89 89 82 81 80 75 82 80 79 83 76 90 80 84
3. Married (%) 40022 145 86 7 65/100 89 89 90 88 85 85 87 87 80 90 85 91 86 89
4. Languages (N) 40022 145 1.8 0.8 1/4.4 2.1 2 2 1.8 1.8 1.6 1.9 2 1.3 2.1 2.1 1.5 1.8 1.8
5. Educ attainment 40022 145 4.3 0.3 3.4/4.9 4.4 4.5 4.6 4.8 4.1 4.2 4.3 4.1 4.3 4.3 4.3 4.3 4.3 4.2
6. Educ abroad (%) 40022 145 25 16 .8/77 38 34 34 29 21 14 28 32 19 24 16 38 23 31
7. Educ in west (%) 40022 145 47 28 4/99 57 54 53 50 46 70 41 42 27 32 80 33 50 36
8. Tenure (years) 40022 145 5.5 2 2/11 7 6.5 4.3 7 5.4 6 5.4 5 5.5 6 5.6 6 5.4 6 Full sample Countries 145 145 145 145 136 145 33 112 38 24 26 41 16 113 32 Leaders 40022 306 1517 3358 1028 31406 10787 29235 8616 5713 10360 11029 4304 28534 11488 All data (except for the first column, Leaders) is pooled at the country level prior to calculating statistics. N=number. M=mean. SD=standard deviation. Range=minimum/maximum. Apex=most powerful one or two positions. +10=next ten most powerful. Cab=cabinet. Court=supreme or constitutional court. Parl=lower house of parliament. Amer=Americas. MENA=Middle East and North Africa. Numbers are rounded to the nearest integer except for Languages and Educational attainment. This table replicates Table 5 using an imputed dataset, as described in the text.

Table B2 (replicating Table 6): Languages Spoken by World Leaders (imputed dataset)
Category ____SAMPLE____ ________ _OFFICE________ WEALTH_ __________ REGION__________ _ _REGIME__ Sub-category Apex +10 Cab Court Parl Rich Poor Africa Amer Asia Europe MENA Demo Auto Statistic Leaders M SD M M M M M M M M M M M M M M
1. English 10782 35 36 55 47 47 33 31 45 32 34 28 38 39 29 37 26
2. French 6951 20 33 20 23 22 20 19 15 21 46 5 4 14 21 18 27
3. Spanish 5676 16 33 16 18 16 17 17 9 18 7 73 3 5 2 19 5
4. Arabic 4595 13 30 11 14 13 13 13 2 16 10 1 2 1 84 6 35
5. Russian 3816 12 28 14 14 13 10 12 6 14 2 2 30 20 2 11 15
6. German 2401 6 16 8 7 6 5 6 18 3 2 1 2 17 2 7 1
7. Portuguese 1852 5 18 6 6 5 5 5 4 5 9 6 2 4 1 5 3
8. Chinese 3840 3 11 3 3 3 2 3 0.7 3 2 1 9 0.9 1 2 4
9. Other 27333 75 38 75 75 74 74 75 72 75 78 77 85 82 24 80 55 Full sample Countries 145 145 145 145 136 145 33 112 38 24 26 41 16 113 32 Leaders 40022 306 1517 3358 1028 31406 10787 29235 8616 5713 10360 11029 4304 28534 11488
All data (except for the first column, Leaders) is pooled at the country level prior to calculating statistics. M=mean. SD=standard deviation. Range=minimum/maximum. Apex=most powerful one or two positions. +10=next ten most powerful. Cab=cabinet. Court=supreme or constitutional court. Parl=lower house of parliament. Amer=Americas. MENA=Middle East and North Africa. Numbers rounded to nearest integer except where N<1. This table replicates Table 6 using an imputed dataset, as described in the text.

Table B3 (replicating Table 7): Disciplinary Background of World Leaders (imputed dataset)
Category ________SAMPLE________ ___________ OFFICE___________ WEALTH_ ___________ REGION___________ __ REGIME__ Sub-category Apex +10 Cab Court Parl Rich Poor Africa Amer Asia Europe MENA Demo Auto Statistic Leaders M SD Range M M M M M M M M M M M M M M
1. Agronomy 1641 4 3 0/12 2 3 3 0.2 5 4 4 5 4 5 4 3 4 5
2. Engineering 4053 10 5 1/33 6 10 10 2 11 8 11 9 10 12 10 12 10 11
3. Math/CS 885 2 1 0/7 3 2 2 0.6 2 2 2 3 2 2 2 3 2 3
4. Bio/Chem/Physics 1591 4 2 0/10 3 3 3 0.6 4 3 4 5 4 4 3 4 4 4
5. Medicine 2859 7 3 1/20 5 5 7 0.6 8 6 8 7 7 7 7 8 7 7
6. Econ/Bus/Manag 5439 14 7 8.0/46 28 19 22 2 13 16 14 12 15 17 16 10 15 13
7. Social Sciences 4680 12 6 0/26 13 14 13 5 12 14 11 13 11 12 12 11 12 11
8. Law 7493 20 8 5/48 19 23 18 85 17 22 19 17 28 17 20 17 21 16
9. Humanities 3988 10 5 0.8/24 4 7 8 3 10 11 9 10 7 11 10 10 10 10
10. Military 1291 3 2 0/9 9 5 3 0.8 3 2 3 4 2 3 2 5 3 5
11. Other 6102 14 7 2/45 7 9 11 1 12 13 14 16 12 11 13 16 13 15 Full sample Countries 145 145 145 145 136 145 33 112 38 24 26 41 16 113 32 Leaders 40022 306 1517 3358 1028 31406 10787 29235 8616 5713 10360 11029 4304 28534 11488
All data (except for the first column, Leaders) is pooled at the country level prior to calculating statistics. M=mean. SD=standard deviation. Range=minimum/maximum. Apex=most powerful one or two positions. +10=next ten most powerful. Cab=cabinet. Court=supreme or constitutional court. Parl=lower house of parliament. Amer=Americas. MENA=Middle East and North Africa. Numbers rounded to nearest integer except when N<1. This table replicates Table 7 using an imputed dataset, as described in the text.
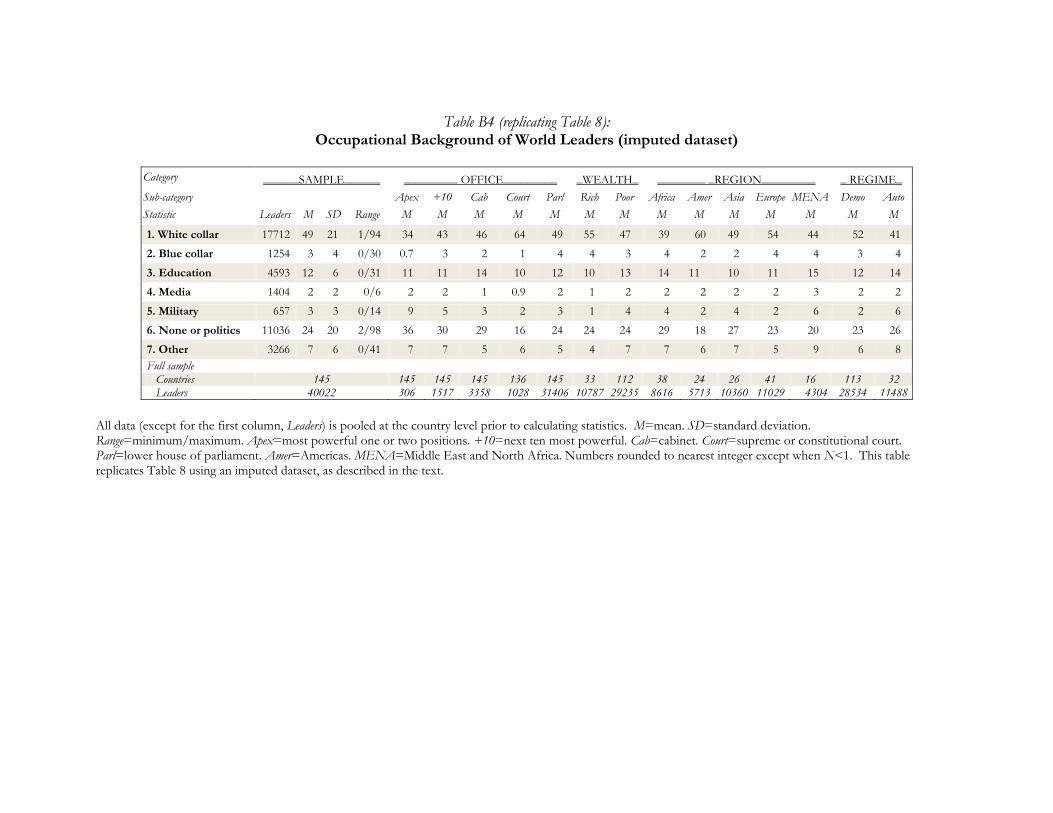
Table B4 (replicating Table 8):
Occupational Background of World Leaders (imputed dataset)
Category ______SAMPLE______ _________ OFFICE_________ _WEALTH_ ________ _REGION_________ _ REGIME_ Sub-category Apex +10 Cab Court Parl Rich Poor Africa Amer Asia Europe MENA Demo Auto Statistic Leaders M SD Range M M M M M M M M M M M M M M
1. White collar 17712 49 21 1/94 34 43 46 64 49 55 47 39 60 49 54 44 52 41
2. Blue collar 1254 3 4 0/30 0.7 3 2 1 4 4 3 4 2 2 4 4 3 4
3. Education 4593 12 6 0/31 11 11 14 10 12 10 13 14 11 10 11 15 12 14
4. Media 1404 2 2 0/6 2 2 1 0.9 2 1 2 2 2 2 2 3 2 2
5. Military 657 3 3 0/14 9 5 3 2 3 1 4 4 2 4 2 6 2 6
6. None or politics 11036 24 20 2/98 36 30 29 16 24 24 24 29 18 27 23 20 23 26
7. Other 3266 7 6 0/41 7 7 5 6 5 4 7 7 6 7 5 9 6 8 Full sample Countries 145 145 145 145 136 145 33 112 38 24 26 41 16 113 32 Leaders 40022 306 1517 3358 1028 31406 10787 29235 8616 5713 10360 11029 4304 28534 11488
All data (except for the first column, Leaders) is pooled at the country level prior to calculating statistics. M=mean. SD=standard deviation. Range=minimum/maximum. Apex=most powerful one or two positions. +10=next ten most powerful. Cab=cabinet. Court=supreme or constitutional court. Parl=lower house of parliament. Amer=Americas. MENA=Middle East and North Africa. Numbers rounded to nearest integer except when N<1. This table replicates Table 8 using an imputed dataset, as described in the text.

Table B5 (replicating Table 9): Political Experience of World Leaders (imputed dataset)
Category ______SAMPLE______ ____________OFFICE____________ _WEALTH_ ____________REGION____________ _REGIME_ Sub-category Apex +10 Cab Court Parl Rich Poor Africa Amer Asia Europe MENA Demo Auto Statistic Leaders M SD Range M M M M M M M M M M M M M M
1. None 4039 10 8 0/51 7 9 9 36 9 10 10 9 11 13 7 15 10 12
2. Trade union 1049 3 2 0/12 1 2 2 4 3 2 3 3 3 2 2 3 2 3
3. Employers org 745 2 2 0/22 1 2 2 3 2 1 2 3 2 2 1 3 2 3
4. Interest group 1534 4 4 0/26 4 3 4 12 4 3 4 5 4 4 4 4 4 5
5. NGO/INGO 3969 11 11 0/69 8 9 11 9 11 6 12 14 15 10 5 12 11 10
6. Local govt 8151 19 11 0.6/61 7 10 12 9 21 22 18 17 23 19 21 14 19 18
7. MP/minister 8867 22 13 0/67 29 25 27 18 21 20 22 23 16 23 21 26 21 24
8. Partisan 11668 30 21 3/97 43 40 34 10 30 36 28 27 28 27 40 23 32 24 Full sample Countries 145 145 145 145 136 145 33 112 38 24 26 41 16 113 32 Leaders 40022 306 1517 3358 1028 31406 10787 29235 8616 5713 10360 11029 4304 28534 11488
All data (except for the first column, Leaders) is pooled at the country level prior to calculating statistics. M=mean. SD=standard deviation. Range=minimum/maximum. Apex=most powerful one or two positions. +10=next ten most powerful. Cab=cabinet. Court=supreme or constitutional court. Parl=lower house of parliament. Amer=Americas. MENA=Middle East and North Africa. Numbers rounded to nearest integer. This table replicates Table 9 using an imputed dataset, as described in the text.