The Global Call Centre Report: International Perspectives ...ie.technion.ac.il/serveng/Lectures/GCC...
63
David Holman, Rosemary Batt, and Ursula Holtgrewe The Global Call Centre Report: International Perspectives on Management and Employment Report of the Global Call Centre Network (UK format) P a y C ar e e r s T e a m s T e c h n o l o g y S k i l l T r a i n i n g S t r a t e g y a n d P e r f o r m a n c e M a n a g e r s G o ve r n a n c e
Transcript of The Global Call Centre Report: International Perspectives ...ie.technion.ac.il/serveng/Lectures/GCC...

David Holman, Rosemary Batt, and Ursula Holtgrewe
The Global Call Centre Report:International Perspectives
on Management and Employment
Report of the Global Call Centre Network
(UK format)
Pay Careers
T
ea
ms
Technology Skill T
rain
ing
Strategy and Performance Ma
na
ge
rs
G
ov
ern
an
ce
i
The Global Call Centre Report:
International Perspectives on Management and Employment
A Report of the Global Call Centre Research Network (UK format)
David Holman Rosemary Batt Ursula Holtgrewe Institute of Work Psychology ILR School Working Life Research Centre U. of Sheffield Cornell University FORBA Sheffield, UK Ithaca, NY Vienna, Austria
Acknowledgements The Global Call Centre (GCC) Project is a collaborative network of over 40 scholars from twenty countries. Participating researchers are listed below, by country. Each country research team has deep expertise in the call centre sector and has conducted extensive field and survey research for this report. The report is based on the results of an identical survey administered to a national sample of call centres in each country.
Funding for this project came from generous grants and contributions from universities, governments, and nonprofit foundations in each country. Particular thanks go to The Russell Sage Foundation, the Alfred P. Sloan Foundation, the Hans Böckler Foundation, and the Economic and Social Research Council of the UK for the support of international research coordination and conferences. A list of all sponsors is found in Appendix A. Call centre employers’ associations also actively supported the study in many countries by encouraging members to participate. The report is not based on funding from private corporations or companies operating in the call centre sector.
For more information on the GCC network, visit the website at www.globalcallcenter.org. To obtain national reports or contact country research teams, see Appendix C.
ISBN 9780979503610 Copyright © Holman, Batt, and Holtgrewe 2007
ii
Global Call Centre Research Network
Austria Dr. Jörg Flecker Annika Schönauer Forschungs und Beratungsstelle Arbeitswelt (FORBA) (Working Life Research Centre)
Australia Prof. Frenkel, Professor Dr. Markus Groth University of New South Wales
Brazil Dr. Moacir de Miranda Oliveira Prof. Leonardo Nelmi Trevisan Prof. Arnoldo de Hoyos Guevara Pontificia Universidade Catolica de Sao Paulo
Canada Prof. Ann Frost The University of Western Ontario
Dr. Danielle van Jaarsveld U. of British Columbia
David Walker U. of British Columbia
China Dr. Fang Xu Renmin University of China
Xiangmin Liu Cornell University
Denmark Dr. Niels Moeller Technical University of Denmark
Dr. Ole Henning Sorensen Danish National Inst. of Occupational Health
France Prof. Hiroatsu Nohara Dr. Robert Tchobanian Dr. Caroline MorandatLanciano University of the Mediterranean
Germany Dr. Ursula Holtgrewe (FORBA) (Working Life Research Centre)
Prof. Karen Shire University of Duisburg
Jessica Longen University of Technology Darmstadt
India Prof. Rosemary Batt Cornell University
Ireland Dr. Maeve Houlihan Quinn School of Business
Prof. Stephen Deery King's College London
Dr. Nicholas Kinnie University of Bath
Israel Prof Anat Rafaeli Technion Israel Institute of Technology
Dr. Iris VilnaiYavetz Ruppin Academic Centre
Japan Prof. Michio Nitta University of Tokyo
Dr. Hodaka Maeura Rikkyo University
Netherlands Prof. Andries de Grip Inge Sieben Maastricht University
Philippines Dr. Maragtas S.V. Amante University of the Philippines

iii
Global Call Centre Research Network
South Africa Dr. Chris Benner Pennsylvania State University, USA
Dr. Charley Lewis University of the Witwatersrand
South Korea Dr. Hyunji Kwon Korean Labor Institute
Dr. HyeYoung Kang POSRI, Seoul
Prof. Byoung Hoon Lee ChungAng U., Seoul
Spain Dr. Mireia Valverde Dr. Gerard Ryan Prof. Ferran Mañe María Tatiana Gorjup Neus Martí Matilde Villarroya Universitat Rovira i Virgili
Sweden Dr. Ake Sandberg MITIOR Programme Arbetslivsinstitutet / NIWL
Dr. Christer Strandberg Mid Sweden University
United Kingdom Dr. David Holman Prof. Stephen Wood University of Sheffield
United States Prof. Rosemary Batt, Cornell University
Dr. Virginia Doellgast King's College London
Dr. Hyunji Kwon Korean Labor Institute
iv
Table of Contents
Page
Executive Summary v
Introduction 1
Part I The Global Picture: Convergent National Trends 4
Part II The Global Picture: Divergent National Trends 11
Part III The BusinessLevel Picture: Subcontracting & Customer Segmentation 24
Part IV Call Centre Outcomes 36
Part V Conclusion 44
Appendices
A Acknowledgement of Sponsors (by country) 46
B Technical Notes on Research Methods 47
C References for National Country Reports 50
v
Executive Summary
This report is the first large scale international study of call centre management and employment practices across all regions of the globe – including Asia, Africa, South America, North America, and Europe. Covering almost 2,500 centres in 17 countries, this survey provides a detailed account of the similarities and differences in operations across widely diverse national contexts and cultures. The centers in the survey include a total of 475,000 call centre employees.
Participating countries include: Austria, Brazil, Canada, Denmark, France, Germany, India, Ireland, Israel, Netherlands, Poland, South Africa, South Korea, Spain, Sweden, UK, and the US.
We examine such questions as: Ø How ‘global’ is this sector? Is there a universal best practice model of management emerging
across countries or have managers developed alternative approaches and innovative strategies? Ø How similar or different are management practices across countries, and what explains differences
within countries? Ø How do inhouse centres compare to subcontractors? And how do businessfocused centres
compare to mass market centres?
Ø What strategies contribute to better operations, job quality, turnover, and absenteeism?
We cover a wide range of topics: Ø Adoption of new technologies Ø Workforce characteristics Ø Selection, staffing, and training Ø Work design, workforce discretion, and teamwork Ø Compensation strategies and levels for employees and managers Ø The extent of collective bargaining and works council representation
Our findings suggest that the call centre sector has emerged at about the same time in many countries around the globe – roughly in the last 5 to 10 years. It serves a broad range of customers in all industry sectors and offers a wide range of services from very simple to quite complex. It is an important source of employment and new job creation everywhere.
The mobility of call centre operations has led many to view this sector as a paradigmatic case of the globalisation of service work. And we find that the call centre sector looks quite similar across countries in terms of its markets, service offerings, and organisational features. But beyond these similarities, we find that call centre workplaces take on the character of their own countries and regions, based on distinct laws, customs, institutions, and norms. The ‘globalisation’ of call centre activities has a remarkably national face.
Our summary highlights the similarities among countries, as well as the differences between them. It also identifies important differences within countries between inhouse centres and subcontractors, and between centres serving distinct customer segments.

vi
Similarities among Countries
In each country, the nature of the call centre sector is very similar in terms of markets, service offerings, organisational structure, and workforce characteristics.
§ Age. The call centre sector is relatively young, with the typical call centre being 8 years old.
§ Markets. Call centres typically serve national rather than international markets. Eightysix percent serve their local, regional, or national market.
§ Subcontractors. Twothirds of all call centres are inhouse operations, serving a firm’s own customers. Subcontractors operate the remaining onethird of centres.
§ Customer segmentation. Seventyfive percent of call centres predominantly serve mass market customers, while 25% serve business customers.
§ Service versus sales. The largest proportion of call centres provide customer service only (49%), while 21% provide sales only, and 30% provide sales and service.
§ Inbound versus outbound calls. Most centres primarily handle inbound calls (78%), rather than outbound calls.
§ Call centres or ‘contact centres’: The overwhelming majority of centres operate as voice only centres, rather than multichannel ‘contact’ centres. The technologies employed are quite similar and calls typically last from 34 minutes.
§ Organizational and workforce characteristics The typical call centre employs 49 workers. However, the majority of call centre agents (75%) work in call centres that have 230 total employees or more. Call centres are flat organizations, with managers comprising only 12% of employees. Seventyone percent of the call centre workforce is female.
Differences between Countries
Despite these commonalities, there are substantial differences in the organization of work and human resource practices in call centres across countries.
To aid comparison of the many countries in the report, we group them into three categories: § Coordinated or ‘social market’ economies, with relatively strong labour market regulations and
relatively influential labour market institutions. § Austria, Denmark, France, Germany, Israel, Netherlands, Spain and Sweden.
§ Liberal market economies, with more relaxed labour market regulations and less influential labour market institutions. § Canada, Ireland, UK and USA.
§ Recently industrialised or transitional economies. § Brazil, India, Poland, South Africa and South Korea.
In general we find that national labour market institutions influence management strategies. Call centres in coordinated economies tend have better quality jobs, lower turnover, and lower wage dispersion than call centres in liberal market economies and in recently industrialised ones, where labour market regulations and unions are weaker. Call centres in coordinated countries also make
vii
greater use of subcontracting and parttime contracts as strategies to increase organisational flexibility. However, there are also important differences among countries in each of these groups.
Selection, Training, and Staffing § Selection. Twentytwo percent of call centres predominantly recruit people with college degrees, a
relatively high proportion for what is considered to be a lowskill job – but country variation is high. Over 60% of centres in France and India primarily use college educated employees, compared to less than 10% in most European countries.
§ Training. Newly hired workers typically receive 15 days of initial training, with somewhat less in coordinated countries (14 days) than in liberal countries (17 days). A much larger and significant difference exists in the amount of time it takes for call centre agents to become proficient on their job – from 8 weeks in coordinated countries to 12 in industrialising economies and 16 in liberal economies.
§ Staffing. Twentynine percent of the workforce in call centres is parttime or temporary, with coordinated economies making the greatest use of nonstandard work arrangement. But there are also important differences across countries. Over 60% of the South Korean workforce and 50% of the Spanish workforce is temporary, while 100% of the Indian workforce is fulltime.
Work Organisation § Job discretion. Job discretion is generally low, but substantial differences exist across coordinated,
liberal market, and recently industrialised economies. In liberal market economies, the proportion of call centres with low job discretion is 49%, as opposed to 29% in coordinated economies, and 34% in recently industrialised ones. In India, 75% of call centres have low job discretion.
§ Performance monitoring. The frequency of performance monitoring (feedback on performance and call quality, call listening) varies crossnationally. These monitoring activities typically occur on a monthly basis in coordinated countries, on a fortnightly basis in liberal market countries, and on a weekly basis or more in industrialising countries. Monitoring activities in Indian call centres are the most intense of any country.
§ Teams. The use of selfdirected teams is low, with 60% of centres making virtually no use of these work groups. Sweden is the exception, with at least 60% of the workforce in the average centre involved in selfdirected teams. While the reported use of problemsolving teams is high (80%), only a small proportion of employees in each call centre is involved in them.
Collective Representation § Fifty percent of call centres are covered by some form of collective representation, i.e., collective
bargaining, works councils, or both. However, collective representation is highest in coordinated countries (71% of call centres), lowest in liberal market countries (22%), and intermediate in industrialising countries (36%).
§ Coordinated countries, with higher levels of collective bargaining coverage, have significantly lower wage differences across call centres, compared to those in either liberal market economies or recently industrialised ones.
§ The union wage premium varies considerably by country and type of economy: A union wage premium exists for workers in Germany, Canada, the US, and South Korea.
viii
Subcontractors and InHouse Call Centres
In virtually all countries in the study, subcontractors differ significantly from inhouse centres in the types of services offered, the organization of work, the choice of human resource practices, and turnover rates.
Compared to inhouse centres, subcontractors are more likely to focus exclusively on sales and outbound calls. They make greater use of parttime and temporary workers, offer lower discretion jobs, have higher levels of performance monitoring, pay lower wages, and are less likely to be covered by union contracts. Thirtythree percent of all call centres are subcontractors, but they employ 56% of employees in this survey.
§ Training. Subcontractors provide less training than inhouse call centres (14 days vs. 20 days).
§ Wages. On average, subcontractors have 18% lower wages than inhouse call centres.
§ Job discretion. Job discretion is lower in subcontractors, with 48% of subcontractors providing low discretion jobs, as opposed to 35% of inhouse call centres.
§ Performance monitoring. Performance monitoring activities are more intense in subcontractors, occurring weekly, as opposed to monthly in inhouse centres.
§ Staffing. Compared to inhouse centres, subcontractors typically use more parttime workers (20% vs. 15%) and more temporary workers (15% vs. 10%).
§ Collective representation. Twentynine percent of subcontractors have some form of collective representation, compared to 41% of inhouse call centres.
§ Target times. Subcontractors typically answer 90% of calls within the set target time (20 seconds), while inhouse call centres answer 85% of calls within the set target time (20 seconds).
BusinesstoBusiness Centres & Mass Market Centres
Customer segmentation strategies are growing and these influence human resource strategies and the quality of jobs.
Businesstobusiness centres differ in important respects from centres that target the mass market or the general public. With higher valueadded products and services, centres that target large business customers are more likely than others to engage in customer relationship management and to focus on service quality. As a result, they are likely to hire more skilled employees and adopt a more professional or ‘high involvement’ approach to human resource management.
Compared to call centres serving the mass market, call centres that serve business customers make greater use of sophisticated customer relationship technologies (e.g., electronic customer management systems), offer better quality jobs, pay higher wages, use team work more extensively, employ a greater proportion of fulltime permanent staff, and are less likely to be covered by union representation.
Customer Relationship Management § Relationship building. Call centres serving business customers are more likely to try to build
relationships with customers.
ix
§ Technology. Customer interaction enhancing technologies (CRM, webenablement) are more prevalent in business market call centres (38%) than mass market call centres (22%). Mass market centres are more likely to use technology that substitutes for human interaction. Forty percent of mass market centres use IVR or VRU, as opposed to 25% of business market call centres.
Selection, Staffing, and Wages § Selection. Business market centres are more selective in who they hire.
§ Staffing. Business market centres are less likely to use nonstandard forms of employment.
§ Wages. Wages in business market centres are typically 10% higher than those in mass market centres.
Work Organisation § Job discretion. Job discretion is higher in business market centres 28% have jobs with high
discretion, as opposed to 18% in mass market centres.
§ Performance monitoring. Performance monitoring activities typically occur once a month in business market centres, and several times a month in mass market centres.
§ Teams. Onethird of business market centres have at least 50% of agents in problemsolving teams, while only 23% of mass market centres do.
Collective Representation § Collective representation is lower in business market centres (37% coverage) than in mass market
centres (44% coverage).
Call Centre Outcomes
§ Total turnover. The typical call centre reports a total turnover rate of 20% per year. This includes promotions, voluntary quits, retirements and dismissals. However, there is great variation in turnover, ranging from a low of 4% in Austria to 40% in India. Median turnover is 15% in coordinated countries, 25% in liberal countries, and 23% in industrialising countries.
§ Workforce tenure. Across all the countries in the study, approximately onethird of the call centre workforce has less than one year of tenure at work. This varies markedly from less than 10% in countries like Austria or Sweden to almost 60% in India; and also between the different types of country – from 16% in coordinated countries, to 21% in liberal, and 38% in industrialising countries.
§ Costs of turnover. The costs of turnover are high. On average, replacing one agent equals 16% of the gross annual earnings of a call centre worker – that is, the simple replacement costs of one worker equals about two months of a typical worker’s pay. If lost productivity is taken into account, replacing one worker equals between three and four months of a typical worker’s pay.
§ Labour costs. The costs of turnover are high, particularly given that labour represents a high portion of total costs in call centres – typically 70% of costs in liberal market and coordinated economies and 57% in industrialising countries.
§ Turnover and unions. Across all countries in this study, call centres with union coverage have 40% lower turnover rates than those without coverage: 14% annual turnover in union workplaces compared to 24% in nonunion sites.

x
§ Turnover in subcontractors. On average, turnover rates are 25% per year in subcontractors, compared to 19% among inhouse centres. This pattern holds across most countries in this study
§ Sales growth: Across all call centres, managers reported sales growth that averaged 10% per year, with a range of 5% to 18% per year, in all but 3 countries. The three exceptions were India, (89%), Brazil (38%), and Poland (23%). The typical or median call centre had a 5% growth rate in annual sales.
§ Job quality. If the extent to which a job promotes employee wellbeing is used as the primary indicator of job quality, then a high quality job will combine high job discretion with low performance monitoring. Using this definition:
§ 32% of call centres have high to very high quality jobs but only 12% of agents work in such jobs.
§ 38% of call centres have low to very low quality jobs and 67% of agents work in such jobs.
§ Job quality across economies. Job quality is highest in coordinated economies and lowest in industrialising economies. In coordinated economies, more call centres have high to very high quality jobs (41%) than low to very low quality jobs (24%). In contrast, in liberal and industrialising economies, more call centres have low to very low quality jobs (48% and 50%) than high to very high quality jobs (25% and 21%),
§ Job quality and subcontractors. Fiftythree percent of subcontractors have jobs of low to very low quality and 22% have jobs of high to very high quality. In contrast, 32% of inhouse call centres have jobs of low to very low quality and 37% have jobs of high to very high quality
§ Job quality and turnover. The typical level of turnover in call centres with very high quality jobs (high discretion/low monitoring) is 9%, whereas it is 36% for low quality jobs (low discretion/high monitoring).
1
Introduction
Over the past decade, call centres have experienced phenomenal growth in virtually every country around the world. Fuelled by advances in information technology and the plummeting costs of data transmission, firms have found it cost effective to provide service and sales to customers through remote technologymediated centres.
Promise and controversy. But the growth of call centres has been controversial. On the one hand, consumers may gain from new or lower cost services, while governments in advanced and industrialising countries view call centres as a source of jobs and economic development. On the other hand, consumers often object to poor service quality, and managers complain of the difficulties and dilemmas of providing high quality service at low cost, while dealing with excessive turnover. Critics, including trade unions, also have complained that call centres are large service factories that only provide poor quality jobs with high levels of routinisation, and low wages and job security. Thus, many different constituencies share an interest in the development of call centres and how they can be managed successfully in the global economy.
Convergence and similarity. Common to all call centres is the use of advanced information technologies to handle customer inquires remotely in operations that encompass high levels of engineering efficiency. There is also a perception that call centres operate in a uniform way across countries a call centre in the UK looks like one in South Africa, the Netherlands, or Brazil – which suggests that call centres in different countries are converging on a standard set of management and employment practices.
Divergence and difference. An alternative view is that despite the rapid diffusion of new technologies, the emergence of the call centre sector in each country is occurring in the context of diverse national institutions and cultural norms, distinct labour market conditions and consumer demands. These differences lead to divergent practices – suggesting that the management strategies and human resource practices in this sector will differ markedly within and across countries around the world.
This report tackles the questions just raised. How ‘global’ is this sector? Are call centres simply standardized operations in large factories with few opportunities for managerial innovation? Do they largely offer poor quality jobs? Or have managers developed a range of alternative approaches? If so, do these reflect national differences, market differences, or business strategies? And how do these differences matter?
With these questions in mind, we undertook this international project. The aims of the study are:
• To map the range of management practices in call centres around the globe. • To examine whether differences in national institutions, markets, and management
strategies influence the organisation of work and human resource practices. • To explore the relationships between management strategies, human resource practices,
and call centre outcomes.
This is the first study to provide a detailed comparison of management and employment practices in call centres within and across national boundaries. It covers almost 2,500 centres in 17 countries, with total employment of 475,000. The countries participating in the study are presented in Figure A. The survey itself was completed by senior call centre managers.

2
Figure A. Call Centres & Employment Covered in this Report Number of Call
Centres Total Employment Coordinated Economies Austria 96 8,049 Denmark 118 7,162 France 210 15,440 Germany 153 21,600 Israel 80 3,792 Netherlands 118 8,437 Spain 68 13,712 Sweden 139 7,060 Subtotal 982 85,251
Liberal Market Economies Canada 387 71,041 Ireland 43 3,453 UK 167 26,187 US 464 94,938 Subtotal 1,061 195,619
Recently Industrialised Economies Brazil 114 122,590 India 60 34,146 Poland 75 9,375 S. Africa 64 5,599 S. Korea 121 22,361 Subtotal 434 194,071
Total 2,477 474,942
We draw on an identical workplace survey administered to a national sample of call centres in each participating country. Research teams encompassing a total of 45 scholars conducted the survey as well as extensive field interviews with call centre managers, industry experts, economic development specialists, and employees and union representatives. (Our appendices provide the details of country research teams and sponsors, as well as technical notes on how the survey research was conducted.) We hope this report will provide an insightful understanding for the range of stakeholders involved in this sector.
3
Structure of the Report
Part I. The Global Picture: Convergent National Trends
This section maps the global call centre sector, focusing on its growth and diffusion. We examine the extent of similarity in features such as the age of the sector in each country, the markets it covers, the types of services offered, and basic organisational characteristics.
To aid comparison of the many countries in the report, we draw on prior conventions for grouping them into three categories:
• Coordinated or ‘social market’ economies, with relatively strong labour market regulations and relatively influential labour market institutions. Countries with coordinated economies include Austria, Denmark, France, Germany, Israel, Netherlands, Spain, and Sweden.
• Liberal Market economies, with more relaxed labour market regulations and less influential labour market institutions. Countries include Canada, Ireland, UK, and USA.
• Recently industrialised or transitional economies. These countries include Brazil, India, Poland, South Africa, and South Korea.
Prior research in manufacturing industries, for example, has shown that coordinated economies with more centralized systems of collective bargaining typically have higher levels of skills and training, and lower wage inequality than do liberal market economies. However, call centres can often exist outside the boundaries of these traditional labour market institutions, raising the question of whether these institutions matter in the context of this emergent sector. In reporting our findings we therefore group countries according to these three categories. Readers can assess through the charts whether countries look more similar within these three clusters than between them.
Part II. The Global Picture: Divergent National Trends This section examines whether there are substantial national differences in management and employment practices in call centres. Here we examine differences in selection, staffing, and training; the organisation of work; industrial relations systems and pay levels.
Part III. The Businesslevel Picture – Subcontractors and Customer Segmentation This section examines the key factors at the businesslevel within each country that account for differences in employment and work practices. We explore inhouse centres compared to subcontractors, and businesstobusiness centres versus mass market centres.
Part IV. Call Centre Outcomes This section examines key call centre outcomes such as turnover, sick rates, labour costs, operational measures and job quality, and discusses how management practices and labour market institutions might influence them.
4
PART I
The Global Picture: Convergent National Trends?
Is there support for the idea that this sector is converging towards one model of management and organisation? In this section we focus on the extent to which call centres are similar across the countries in our study. We find that there are many similarities across countries, suggesting that the call centre sector has developed in broadly similar ways across advanced and recently industrialised countries with regard to markets, services, and some organisational characteristics. But in Part II we show that, beyond these broad similarities, call centres across countries are quite different in the types of work and employment practices they use.
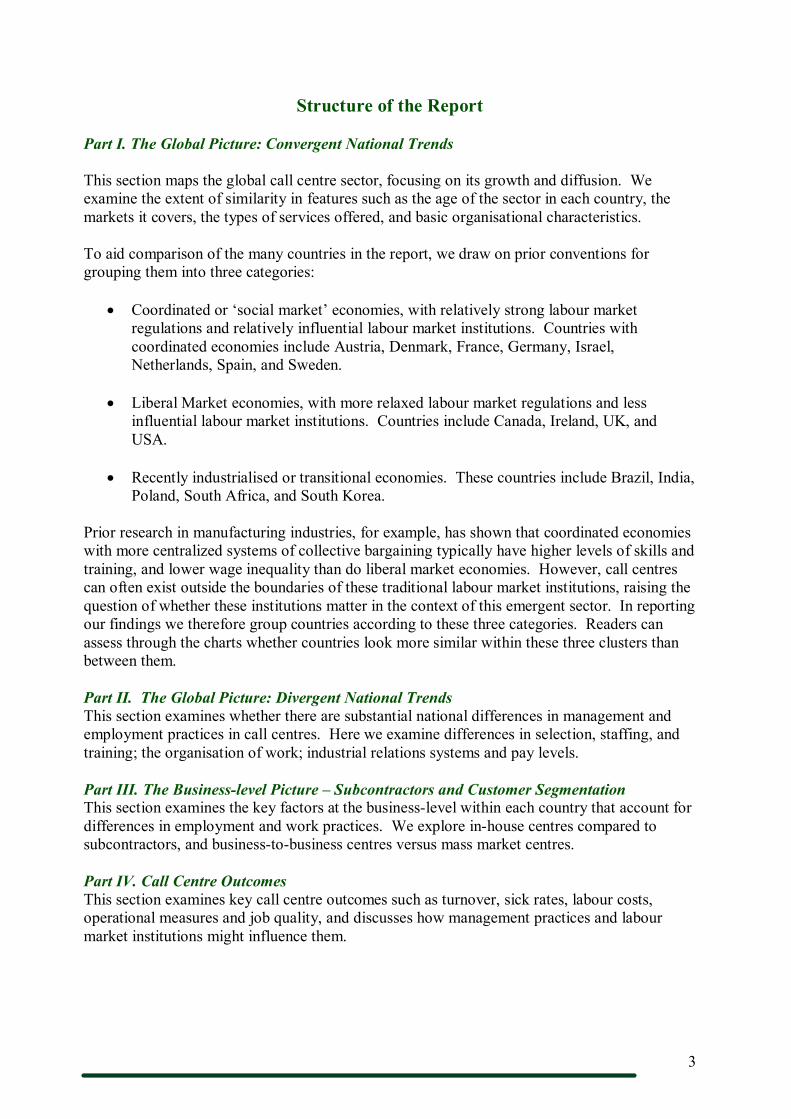
Development, Markets, and Services One indicator of the development of this sector in countries around the world is the typical age of call centres. A call centre in this study is typically 8 years old (in 2007), ranging from a high of 14 years in the US to a low of 6 years in India and 7 years in Poland and South Korea (Figure 1.1).
0
5
10
15
Coordinated Liberal Industrializing
Type of Economy
Figure 1.1. Age of Typical Call Centre (Years) Aust ria
Denmark France
Germany Israel
Spain Sweden
Canada Ireland
UK US
Brazil Ind ia
Poland S. Af rica
S.Korea
This pattern suggests that the sector is a relatively new phenomenon everywhere not only in India although it does appear to have emerged slightly later in recently industrialising countries. What explains this pattern of development? Making service transactions reliable and efficient of turning ‘high contact’ services in to ‘low contact’ ones is a longstanding goal of operations management. However, this has only become possible on a large scale through the decline in telecommunications transmission costs, brought on by industry deregulation, and the global dissemination of call centre technologies and advanced information systems. Countries around the world are now taking advantage of these regulatory and technological changes.
Markets: national versus international. An important feature of call centres is the relative ease with which work flows can be routed to different geographic locations, organisations, or employees within the same organisation. This has allowed companies to shift service delivery
5
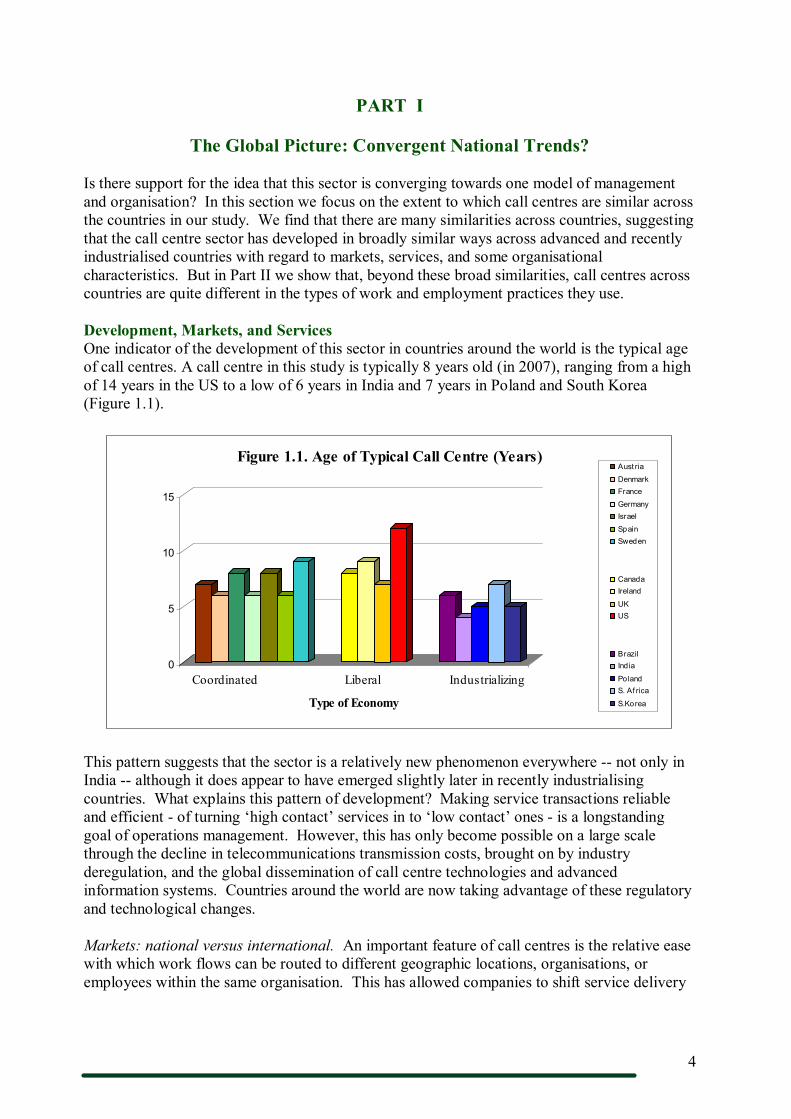
from local interactions to more remote ones. Our survey shows that 30% of centres primarily serve local or regional markets, while 56% serve their own national market.
Thus, despite the mobility of call flows and the scale economies of serving large geographic markets, most call centre markets are not international: while 86% of centres serve the local, regional, or national market in their own country, only 14% serve the international market (Figure 1.2). The exceptions to this pattern are those countries that have specialized as global subcontractors India, and to a lesser extent, Ireland and Canada. In this survey, the proportion of call centres serving international customers is 73% in India, 37% in Ireland, and 35% in Canada. Canada is rarely noticed as a major provider of subcontracting services, but its proximity to the US and shared language, time zone, culture, governmentprovided health care, and low exchange rate to the US dollar has made it an increasingly important locus of subcontractors for US corporations.
The spread of call centre services is also occurring in a way that is different from that found in manufacturing. Thus, while call centres are geographically mobile, their spread is quite uneven, shaped particularly by language and culture. Most centres providing international services follow historic patterns of linguistic ties: between France and Morocco; between Spain and Latin America; between the UK and US and other Englishspeaking countries (Ireland, India, Canada, and South Africa).
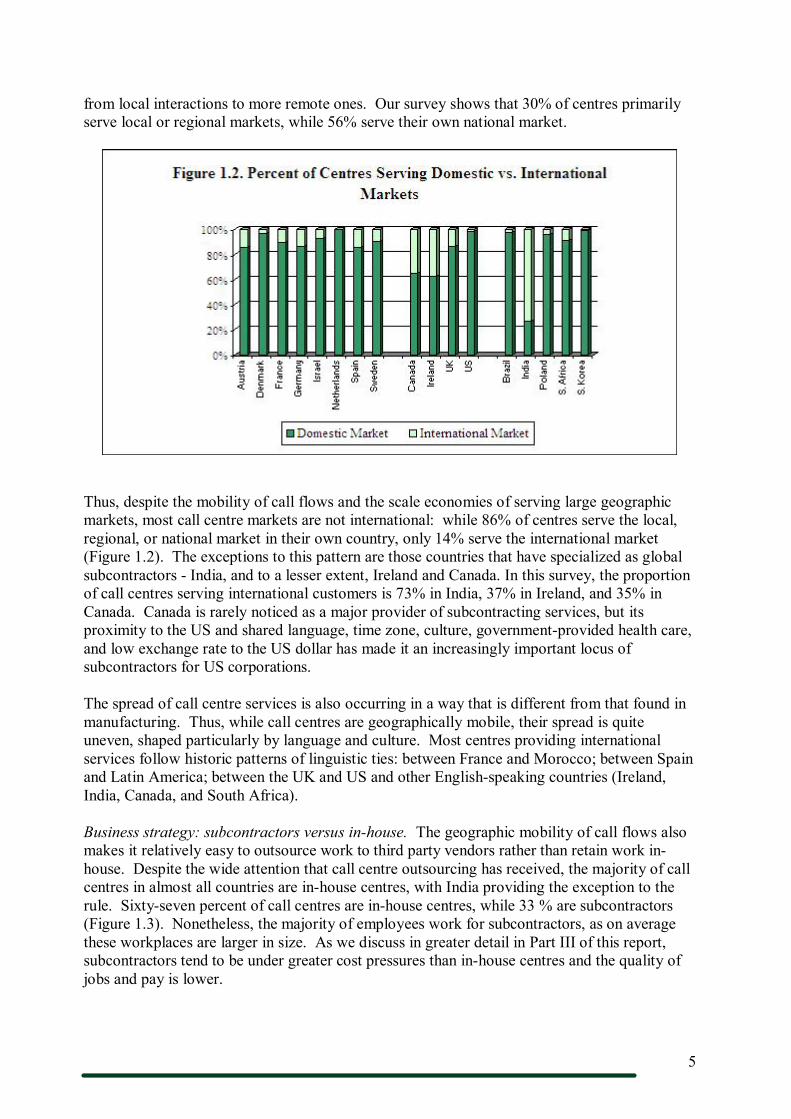
Business strategy: subcontractors versus inhouse. The geographic mobility of call flows also makes it relatively easy to outsource work to third party vendors rather than retain work in house. Despite the wide attention that call centre outsourcing has received, the majority of call centres in almost all countries are inhouse centres, with India providing the exception to the rule. Sixtyseven percent of call centres are inhouse centres, while 33 % are subcontractors (Figure 1.3). Nonetheless, the majority of employees work for subcontractors, as on average these workplaces are larger in size. As we discuss in greater detail in Part III of this report, subcontractors tend to be under greater cost pressures than inhouse centres and the quality of jobs and pay is lower.
6
0%
15%
30%
45%
60%
75%
90%
Coordinated Liberal Industrializing
Type of Economy
Figure 1.3. Percent of Centres that are Inhouse Austria Denmark France Germany* Israel Netherlands Spain Sweden
Canada Ireland UK US
Brazil India Poland South A frica South Korea
*Germany: Estimated
Countries with a significantly higher proportion of subcontractors include India (80%), Brazil (53%), and Spain (50%). By contrast, the US and Israel have a higher proportion of call centres who have retained delivery inhouse (83% and 88% respectively).
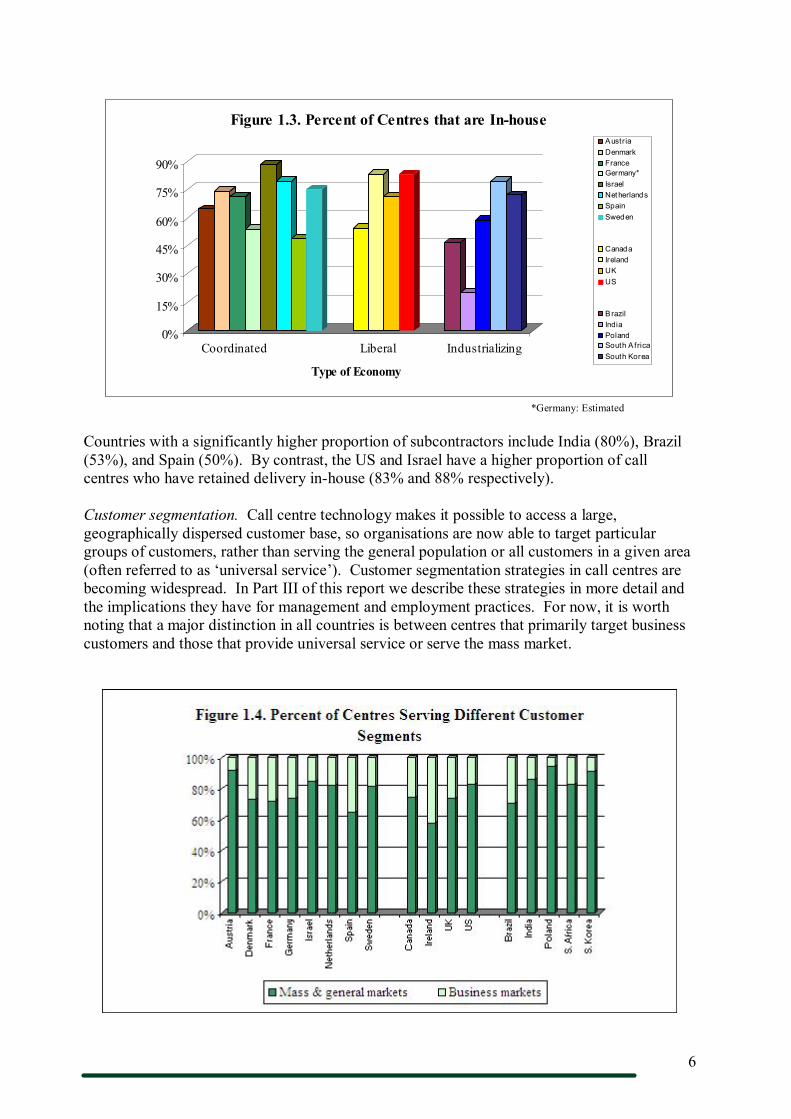
Customer segmentation. Call centre technology makes it possible to access a large, geographically dispersed customer base, so organisations are now able to target particular groups of customers, rather than serving the general population or all customers in a given area (often referred to as ‘universal service’). Customer segmentation strategies in call centres are becoming widespread. In Part III of this report we describe these strategies in more detail and the implications they have for management and employment practices. For now, it is worth noting that a major distinction in all countries is between centres that primarily target business customers and those that provide universal service or serve the mass market.
7
On average, 75% of centres serve the general or mass market (Figure 1.4). These are the markets where the volume of service and sales transactions is the highest. By contrast, about 25% of centres serve business customers, i.e., are businesstobusiness centres. Over 80 % of the workforce is located in centres serving the mass market or general market, and levels of standardization and the quality of jobs are typically much lower in mass market centres than in businesstobusiness centres.
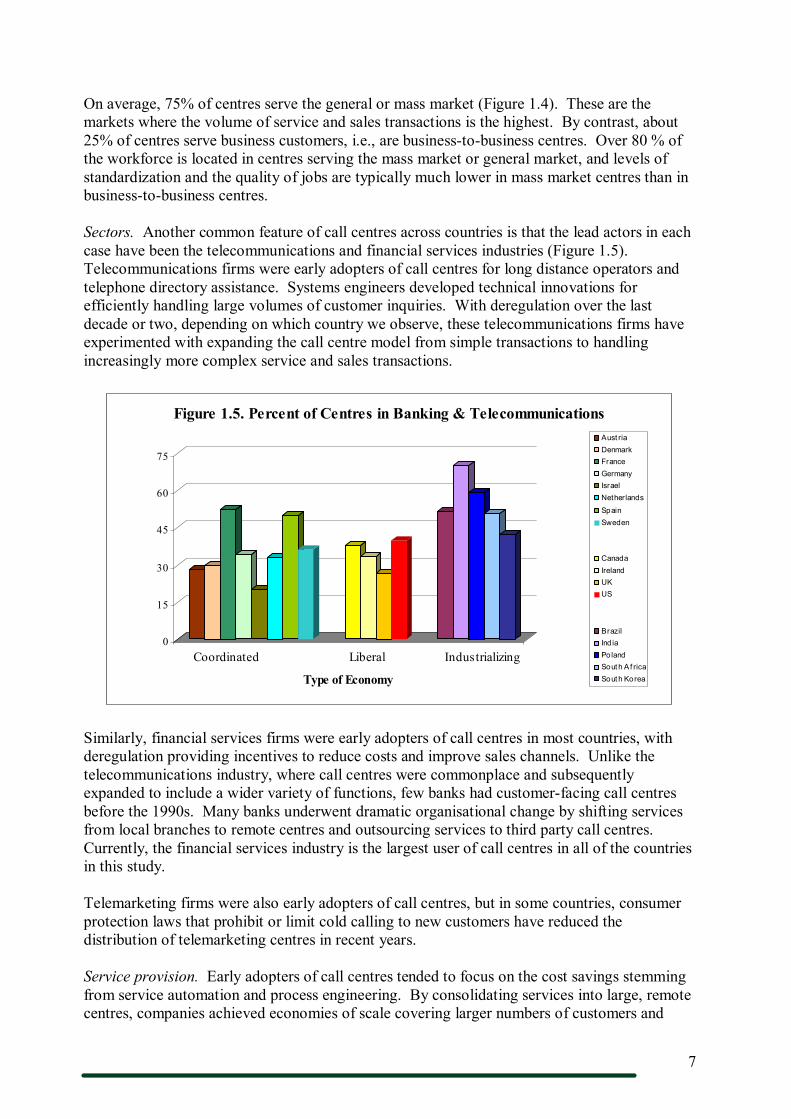
Sectors. Another common feature of call centres across countries is that the lead actors in each case have been the telecommunications and financial services industries (Figure 1.5). Telecommunications firms were early adopters of call centres for long distance operators and telephone directory assistance. Systems engineers developed technical innovations for efficiently handling large volumes of customer inquiries. With deregulation over the last decade or two, depending on which country we observe, these telecommunications firms have experimented with expanding the call centre model from simple transactions to handling increasingly more complex service and sales transactions.
0
15
30
45
60
75
Coordinated Liberal Industrializing
Type of Economy
Figure 1.5. Percent of Centres in Banking & Telecommunications Aust ria Denmark France Germany Israel Netherlands
Spain Sweden
Canada Ireland UK US
Brazil Ind ia Poland South A f rica South Korea
Similarly, financial services firms were early adopters of call centres in most countries, with deregulation providing incentives to reduce costs and improve sales channels. Unlike the telecommunications industry, where call centres were commonplace and subsequently expanded to include a wider variety of functions, few banks had customerfacing call centres before the 1990s. Many banks underwent dramatic organisational change by shifting services from local branches to remote centres and outsourcing services to third party call centres. Currently, the financial services industry is the largest user of call centres in all of the countries in this study.
Telemarketing firms were also early adopters of call centres, but in some countries, consumer protection laws that prohibit or limit cold calling to new customers have reduced the distribution of telemarketing centres in recent years.
Service provision. Early adopters of call centres tended to focus on the cost savings stemming from service automation and process engineering. By consolidating services into large, remote centres, companies achieved economies of scale covering larger numbers of customers and
8
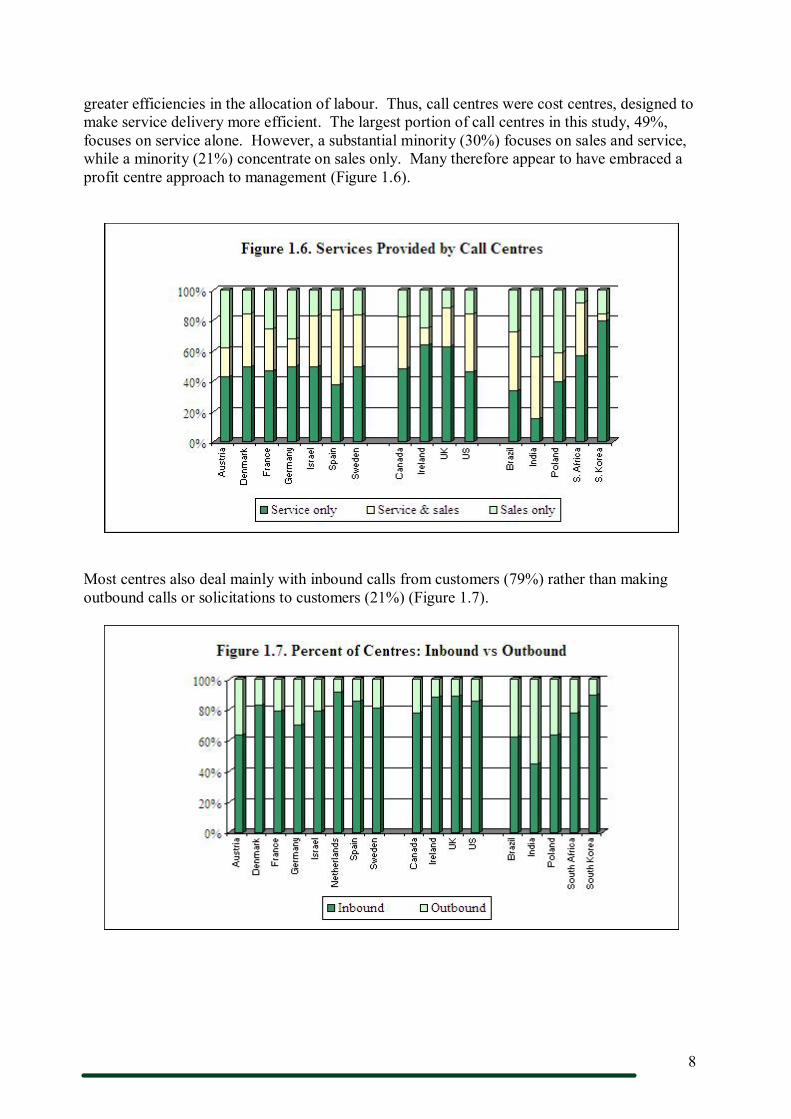
greater efficiencies in the allocation of labour. Thus, call centres were cost centres, designed to make service delivery more efficient. The largest portion of call centres in this study, 49%, focuses on service alone. However, a substantial minority (30%) focuses on sales and service, while a minority (21%) concentrate on sales only. Many therefore appear to have embraced a profit centre approach to management (Figure 1.6).
Most centres also deal mainly with inbound calls from customers (79%) rather than making outbound calls or solicitations to customers (21%) (Figure 1.7).

9
Common Organisational Features In addition to similarities in markets and services, call centres have certain organisational features in common. They are flat organisations, with relatively few layers of management. Managers constitute only 12% of employees in the typical call centre in this study – and there is little variation in this number across countries – ranging from a low of 9% to a high of 15%. Most call centres also are part of larger corporations, rather than small independentlyowned firms. Eightyone percent of the centres in this study are part of a larger organisation, with a range of 66% to 98% among countries.
Workforce composition. Another common feature across all of the countries in the study is that the frontline workforce is predominantly female (69%).
0
15
30
45
60
75
90
Coordinated Liberal Industrializing
Type of Economy
Figure 1.8. Percent of the Workforce that is Female Aust ria Denmark France Germany Israel Netherlands Spain Sweden
Canada Ireland UK US
Brazil Ind ia Poland South Af rica South Korea
`
Managers have often reported similar reasons for hiring women: they have a nonthreatening customer service demeanour and voice; there are cultural assumptions that women can be trusted; and they have good keyboarding skills.
Hours of operation: As call centres compete to provide greater convenience to customers, there is pressure to increase hours of operation to 24 hour coverage, 7 days per week. However, our survey finds that 20% have adopted this scheduling pattern with relatively little variation across countries. The rates of use are somewhat higher in the US, Poland, and Israel, where about onethird of centres are always open, and India, where a majority of centres report 24/7 hours of operation.
Call centres or ‘contact centres?’ Call centre technologies are a major source of standardization in work practices. As call centre technologies continue to advance, there has been considerable discussion in the sector about the shift away from ‘call centres’ – which only use telephony – to multichannel ‘contact centres’ – which allow firms to serve customers through a variety of media: voice, email, fax, voice over internet protocol (VoIP). We asked managers in this study to identify the types of technology used in their call centres. Included were: email, fax, web enablement, VoIP, media blending, and electronic customer relationship management. Surprisingly, however, despite much discussion of these technologies in industry magazines, only a small minority of centres take advantage of these technologies. The typical

10
centre in most countries continues to be low tech – using telephony, supplemented by fax and email; and we find little variation in this pattern across countries.
Call metrics. Call centre technology also has the standardizing effect of making quite similar performance metrics available to call centre managers. Electronic monitoring systems, for example, record the call handling time and number of customers per employee per day for every call centre employee. Call centres keep track of the percent of calls handled in a specified target time – typically 2030 seconds. The availability of these metrics allows managers to develop quite standardized requirements for employee work performance and behaviour.
0
50
100
150
200
250
300
Coordinated Liberal Industrializing
Type of Economy
Figure 1.9. Call Handling Time (Seconds) of Typical Call Centre Austria Denmark France Germany Israel Netherlands Spain Sweden
Canada Ireland UK US
Brazil India Poland South Af rica South Korea
The call handling time of the typical centre provides one indicator of the relative standardization of work across call centres in different countries. The typical worksite in this report has an average call handling time of 190 seconds, or 3 minutes and 10 seconds. There is surprisingly little variation in this number across the wide range of countries in this study.
In sum, when we examine the markets, services, and broad organisational features of call centres, we see an emerging sector that looks quite similar across very different countries and national institutional environments.
In turning to the next section of the report, however, we will show how country differences and institutional norms do, in fact, matter, for particular dimensions of the employment system – especially the nature of work and employment relations, pay systems, and industrial relations systems.

11
PART II
The Global Picture: Divergent National Trends
Part I showed that many aspects of the call centre sector have developed in similar ways across the countries in this study: that call centres have emerged in a similar time period, are mainly oriented towards their domestic markets, operate primarily as inhouse, inbound operations, and employ a primarily female workforce. Indeed, whether a country’s economy is classified as coordinated, liberal or recently industrialised does not seem to make much difference for these factors.
There are reasons to believe, however, that national differences will play a more important role in the organisation of work, human resource, and industrial relations practices. Here, differences between coordinated and liberal market countries are likely to matter more. National labour market institutions and cultural norms are likely to shape or constrain alternative management approaches and outcomes for employees. Staffing strategies are influenced by the quality of the educational systems and local labour market conditions. Labour laws and regulations set rules governing the use of nonstandard work arrangements and pay. Trade unions may also influence the quality of work design by resisting work practices thought deleterious to employee welfare.
We begin by examining selection, staffing, and training strategies; then move to work design, performance management, and pay systems; and collective representation.
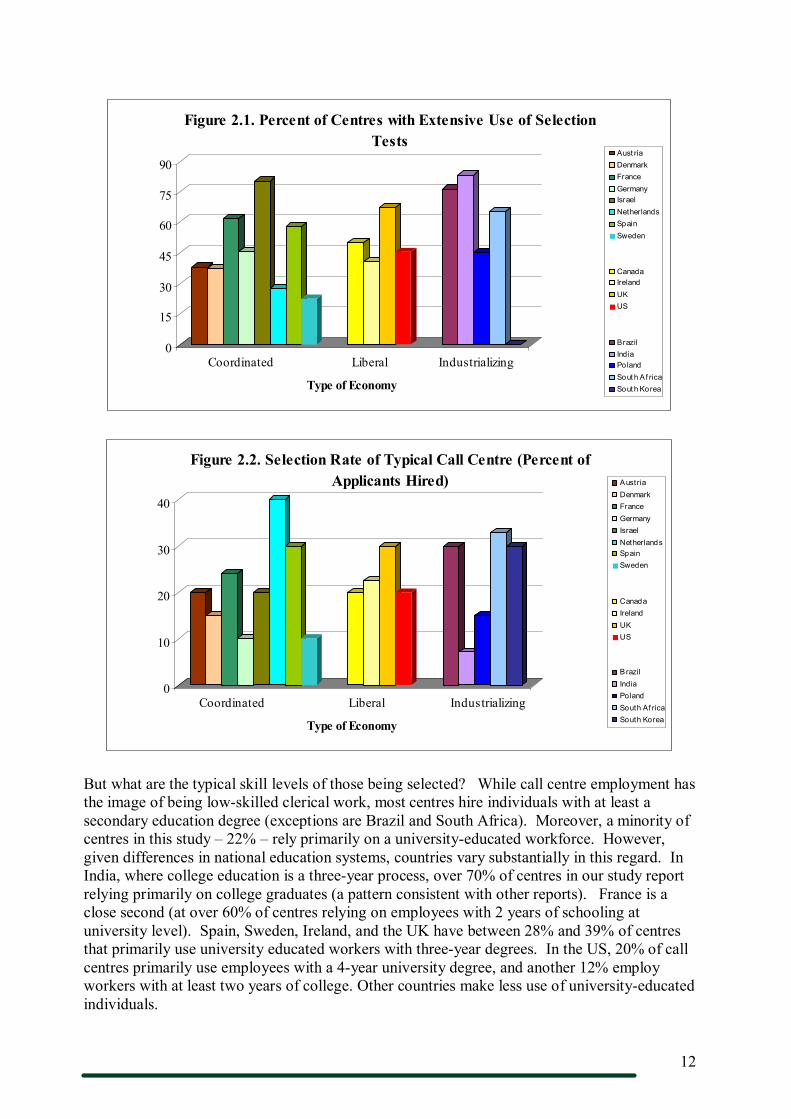
Selection Employers have at their disposal a number of criteria for making selection decisions. Psychologists have developed an array of systematic tests (psychometric tests, aptitude tests, realistic job previews) designed to select the most talented applicants or those that best fit the demands of the job. Use of these selection tests is one indicator that management takes recruitment and hiring seriously and is attempting to be selective in the choice of entry level workers. Centres use them either for all employees or none at all. Overall, about 50% of call centres are high users of selection tests. Call centres in liberal and industrialising countries use selection tests more extensively that those in coordinated countries (see Figure 2.1). For example some of the highest users are users are Brazil, India, the UK, and South Africa, although exceptions are France and Israel.
The selection rate is the proportion of people actually hired relative to the overall pool of applicants. A relatively low selection rate means that a company is more selective – or said differently – that the employer is able to hire the best applicants from a large pool. The typical (or median) centre in this study has a selection rate of 20 percent, meaning that every one in five applicants is hired. From Figure 2.2, it is evident that the countries with the lowest selection rates that is the most selective include India (7%) and Germany and Sweden (10%), whereas Netherlands (40%), and Korea, Brazil and Spain (all 30%), are the least selective. Differences between countries do not seem to depend on whether they are classified as coordinated, liberal, or recently industrialised.
12
0
15
30
45
60
75
90
Coordinated Liberal Industrializing
Type of Economy
Figure 2.1. Percent of Centres with Extensive Use of Selection Tests
Aust ria Denmark France Germany Israel Netherlands Spain Sweden
Canada Ireland UK US
Brazil Ind ia Poland South A f rica South Korea
0
10
20
30
40
Coordinated Liberal Industrializing
Type of Economy
Figure 2.2. Selection Rate of Typical Call Centre (Percent of Applicants Hired) Austria
Denmark France Germany Israel Netherlands Spain Sweden
Canada Ireland UK US
Brazil India Poland South Af rica South Korea
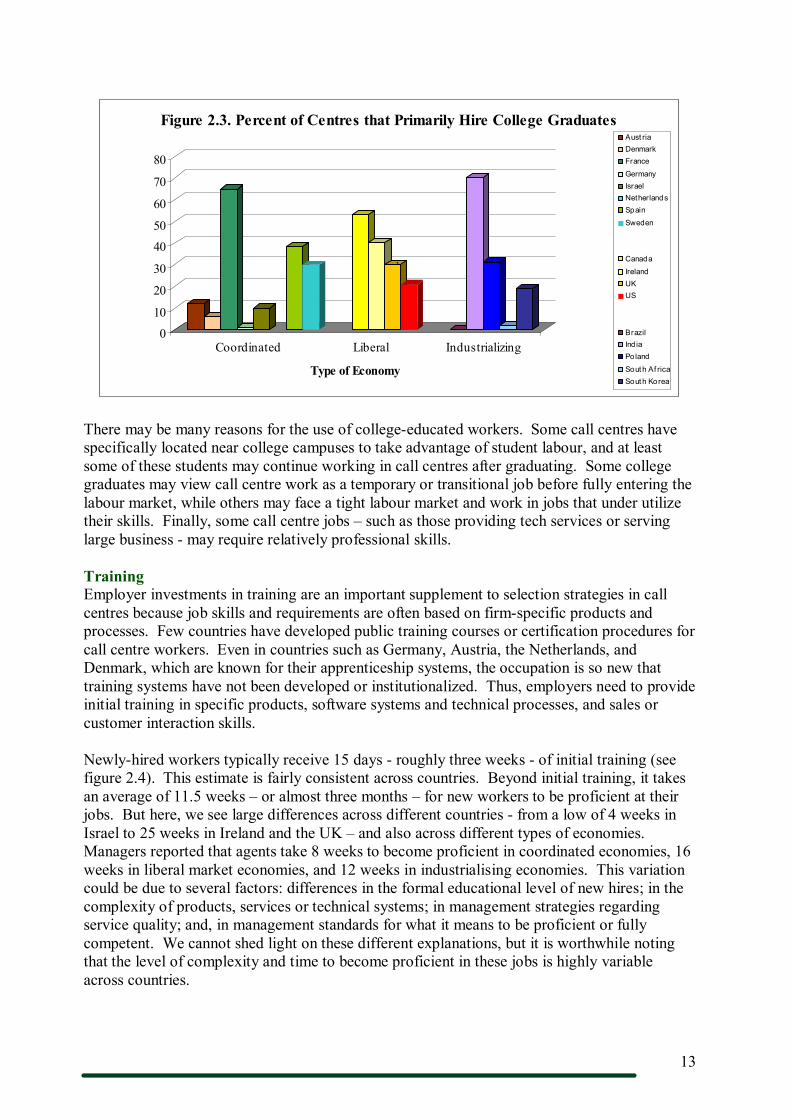
But what are the typical skill levels of those being selected? While call centre employment has the image of being lowskilled clerical work, most centres hire individuals with at least a secondary education degree (exceptions are Brazil and South Africa). Moreover, a minority of centres in this study – 22% – rely primarily on a universityeducated workforce. However, given differences in national education systems, countries vary substantially in this regard. In India, where college education is a threeyear process, over 70% of centres in our study report relying primarily on college graduates (a pattern consistent with other reports). France is a close second (at over 60% of centres relying on employees with 2 years of schooling at university level). Spain, Sweden, Ireland, and the UK have between 28% and 39% of centres that primarily use university educated workers with threeyear degrees. In the US, 20% of call centres primarily use employees with a 4year university degree, and another 12% employ workers with at least two years of college. Other countries make less use of universityeducated individuals.
13
0
10
20
30
40
50
60
70
80
Coordinated Liberal Industrializing
Type of Economy
Figure 2.3. Percent of Centres that Primarily Hire College Graduates Aust ria Denmark France
Germany Israel Netherlands Spain
Sweden
Canada
Ireland UK US
Brazil Ind ia Poland
South Af rica South Korea
`
There may be many reasons for the use of collegeeducated workers. Some call centres have specifically located near college campuses to take advantage of student labour, and at least some of these students may continue working in call centres after graduating. Some college graduates may view call centre work as a temporary or transitional job before fully entering the labour market, while others may face a tight labour market and work in jobs that under utilize their skills. Finally, some call centre jobs – such as those providing tech services or serving large business may require relatively professional skills.
Training Employer investments in training are an important supplement to selection strategies in call centres because job skills and requirements are often based on firmspecific products and processes. Few countries have developed public training courses or certification procedures for call centre workers. Even in countries such as Germany, Austria, the Netherlands, and Denmark, which are known for their apprenticeship systems, the occupation is so new that training systems have not been developed or institutionalized. Thus, employers need to provide initial training in specific products, software systems and technical processes, and sales or customer interaction skills.
Newlyhired workers typically receive 15 days roughly three weeks of initial training (see figure 2.4). This estimate is fairly consistent across countries. Beyond initial training, it takes an average of 11.5 weeks – or almost three months – for new workers to be proficient at their jobs. But here, we see large differences across different countries from a low of 4 weeks in Israel to 25 weeks in Ireland and the UK – and also across different types of economies. Managers reported that agents take 8 weeks to become proficient in coordinated economies, 16 weeks in liberal market economies, and 12 weeks in industrialising economies. This variation could be due to several factors: differences in the formal educational level of new hires; in the complexity of products, services or technical systems; in management strategies regarding service quality; and, in management standards for what it means to be proficient or fully competent. We cannot shed light on these different explanations, but it is worthwhile noting that the level of complexity and time to become proficient in these jobs is highly variable across countries.

14
Beyond initial training, employees need ongoing training to remain proficient and fully productive at work. Ongoing training may also be needed for updates in products and processes. In the typical call centre, experienced agents receive an average of 6 days of training per year. There is, however, a cluster of countries in which experienced agents receive 10 days training a year. They include Germany, India, Korea, Poland, South Africa and Spain, while in Brazil experienced agents receive 15 days per year.
Staffing, Nonstandard Work Arrangements, and Flexibility Apart from decisions over selection and training, staffing decisions also entail what type of employment contracts employers choose to use: whether fulltime, parttime, or some type of temporary contract. Demand forecasting is difficult for call centre managers because of large fluctuations in call volumes. These fluctuations may occur on a daily, weekly, or seasonal basis; and they are often experienced more by subcontactors than by inhouse centres because the former often juggle several contracts at once and do not know when a client may decide to terminate a contract. As a result, call centres are known for their extensive use of parttime and temporary labour contracts to handle demand fluctuations, as well as to keep labour costs low.
In the average call centre, 71% of employees are fulltime, 17% are parttime, and 12% are temporary workers. However, the differences in staffing patterns across countries are substantial and merit closer examination. The average Indian call centre has the highest proportion of permanent fulltime agents (with 97%), followed by South Africa (with 88%), and this is probably related to employer investments in training and language neutralisation.
Coordinated economies make the greatest use of nonstandard work arrangements, with the average centre employing temporary or parttime workers in 33% of the jobs. Particularly large users of parttime workers include call centres in Israel (48%) and the Netherlands (46%), while the average Spanish call centre has 44% of its workforce under temporary contracts (see Figure 2.5). Some have explained this high usage as a reaction to restrictive employment protection laws that make it difficult to fire permanent employees, and our field research suggests that this is the case in these countries. More importantly, in most of these countries, labour laws require that parttime employees receive the same hourly pay as fulltime
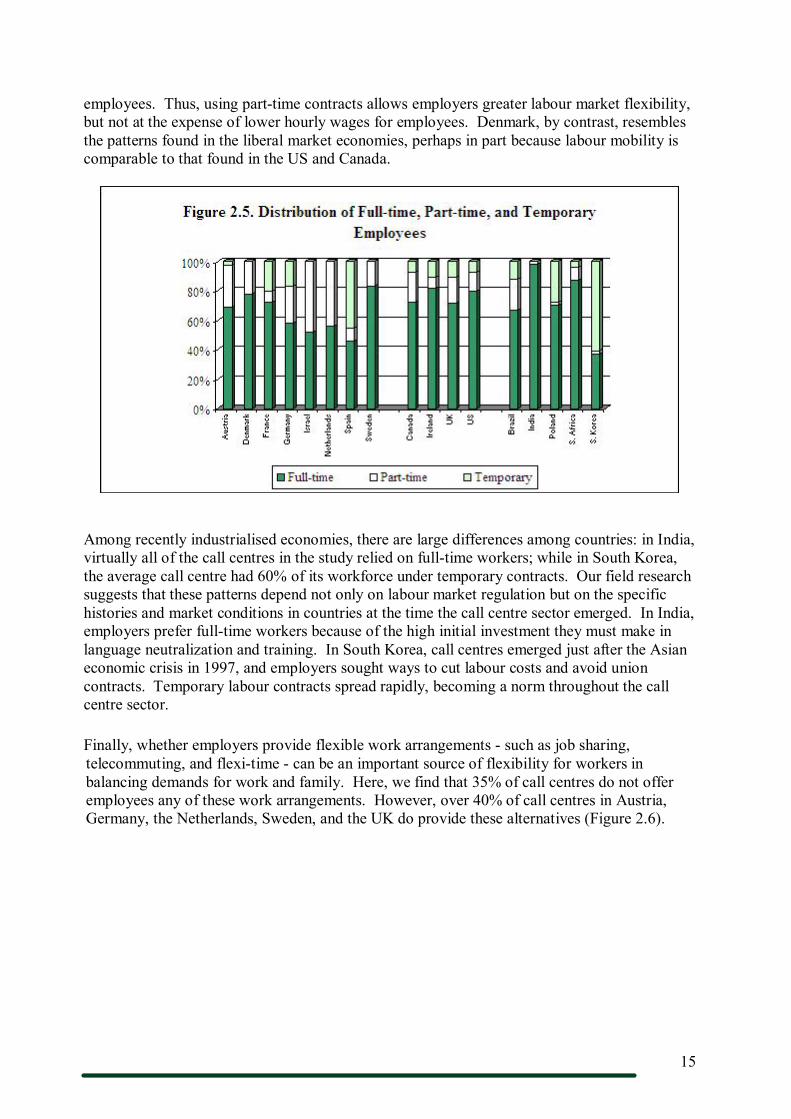
15
employees. Thus, using parttime contracts allows employers greater labour market flexibility, but not at the expense of lower hourly wages for employees. Denmark, by contrast, resembles the patterns found in the liberal market economies, perhaps in part because labour mobility is comparable to that found in the US and Canada.
Among recently industrialised economies, there are large differences among countries: in India, virtually all of the call centres in the study relied on fulltime workers; while in South Korea, the average call centre had 60% of its workforce under temporary contracts. Our field research suggests that these patterns depend not only on labour market regulation but on the specific histories and market conditions in countries at the time the call centre sector emerged. In India, employers prefer fulltime workers because of the high initial investment they must make in language neutralization and training. In South Korea, call centres emerged just after the Asian economic crisis in 1997, and employers sought ways to cut labour costs and avoid union contracts. Temporary labour contracts spread rapidly, becoming a norm throughout the call centre sector.
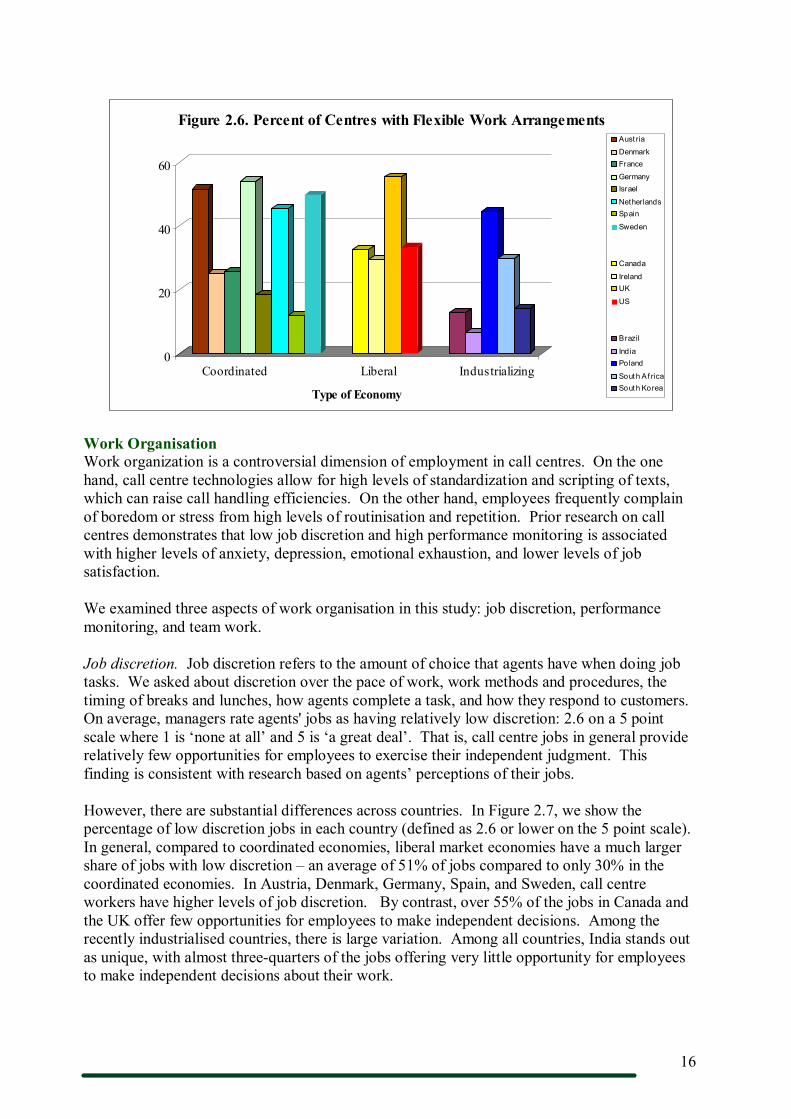
Finally, whether employers provide flexible work arrangements such as job sharing, telecommuting, and flexitime can be an important source of flexibility for workers in balancing demands for work and family. Here, we find that 35% of call centres do not offer employees any of these work arrangements. However, over 40% of call centres in Austria, Germany, the Netherlands, Sweden, and the UK do provide these alternatives (Figure 2.6).
16
0
20
40
60
Coordinated Liberal Industrializing
Type of Economy
Figure 2.6. Percent of Centres with Flexible Work Arrangements Aust ria
Denmark France
Germany Israel
Netherlands Spain
Sweden
Canada
Ireland UK
US
Brazil
Ind ia Poland
South A f rica South Korea
Work Organisation Work organization is a controversial dimension of employment in call centres. On the one hand, call centre technologies allow for high levels of standardization and scripting of texts, which can raise call handling efficiencies. On the other hand, employees frequently complain of boredom or stress from high levels of routinisation and repetition. Prior research on call centres demonstrates that low job discretion and high performance monitoring is associated with higher levels of anxiety, depression, emotional exhaustion, and lower levels of job satisfaction.
We examined three aspects of work organisation in this study: job discretion, performance monitoring, and team work.
Job discretion. Job discretion refers to the amount of choice that agents have when doing job tasks. We asked about discretion over the pace of work, work methods and procedures, the timing of breaks and lunches, how agents complete a task, and how they respond to customers. On average, managers rate agents' jobs as having relatively low discretion: 2.6 on a 5 point scale where 1 is ‘none at all’ and 5 is ‘a great deal’. That is, call centre jobs in general provide relatively few opportunities for employees to exercise their independent judgment. This finding is consistent with research based on agents’ perceptions of their jobs.
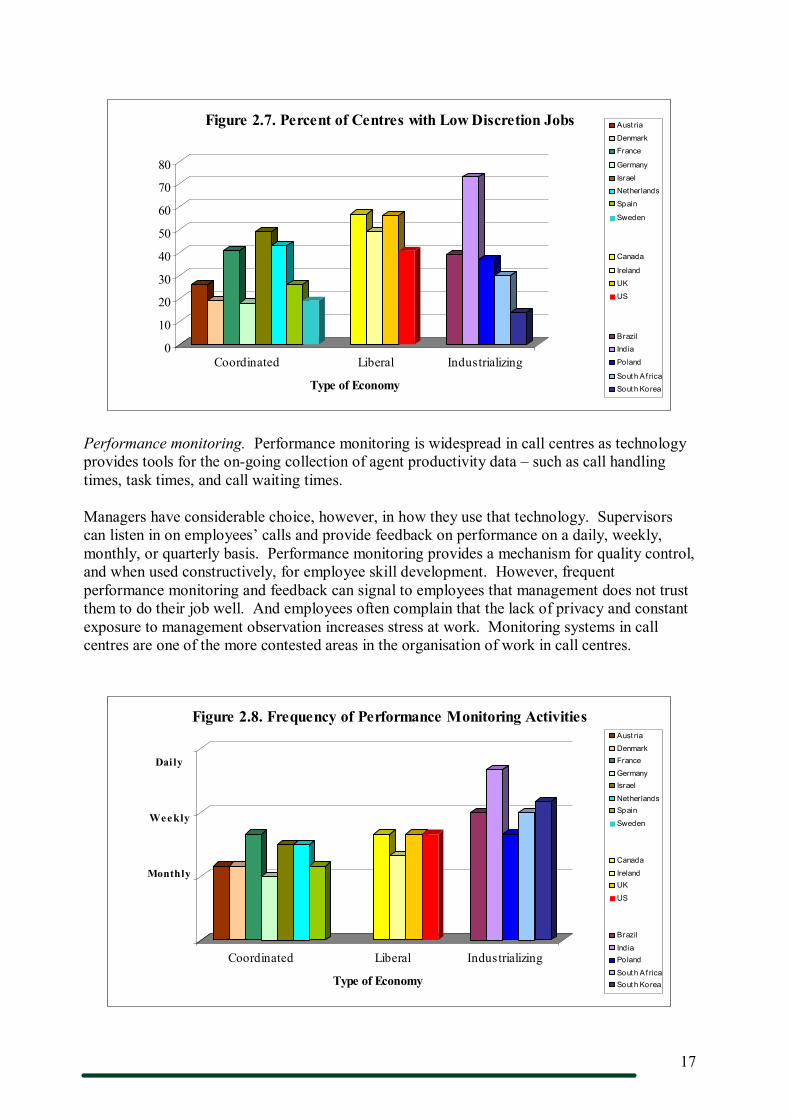
However, there are substantial differences across countries. In Figure 2.7, we show the percentage of low discretion jobs in each country (defined as 2.6 or lower on the 5 point scale). In general, compared to coordinated economies, liberal market economies have a much larger share of jobs with low discretion – an average of 51% of jobs compared to only 30% in the coordinated economies. In Austria, Denmark, Germany, Spain, and Sweden, call centre workers have higher levels of job discretion. By contrast, over 55% of the jobs in Canada and the UK offer few opportunities for employees to make independent decisions. Among the recently industrialised countries, there is large variation. Among all countries, India stands out as unique, with almost threequarters of the jobs offering very little opportunity for employees to make independent decisions about their work.
17
0
10
20
30
40
50
60
70
80
Coordinated Liberal Industrializing
Type of Economy
Figure 2.7. Percent of Centres with Low Discretion Jobs Aust ria
Denmark
France
Germany
Israel
Netherlands
Spain
Sweden
Canada
Ireland
UK
US
Brazil
Ind ia
Poland
South A f rica
South Korea
Performance monitoring. Performance monitoring is widespread in call centres as technology provides tools for the ongoing collection of agent productivity data – such as call handling times, task times, and call waiting times.
Managers have considerable choice, however, in how they use that technology. Supervisors can listen in on employees’ calls and provide feedback on performance on a daily, weekly, monthly, or quarterly basis. Performance monitoring provides a mechanism for quality control, and when used constructively, for employee skill development. However, frequent performance monitoring and feedback can signal to employees that management does not trust them to do their job well. And employees often complain that the lack of privacy and constant exposure to management observation increases stress at work. Monitoring systems in call centres are one of the more contested areas in the organisation of work in call centres.
2
4
6
8 Daily
Weekly
Monthly
Coordinated Liberal Industrializing
Type of Economy
Figure 2.8. Frequency of Performance Monitoring Activities Aust ria
Denmark France
Germany Israel
Netherlands Spain
Sweden
Canada
Ireland UK
US
Brazil
Ind ia Poland
South A f rica South Korea
18
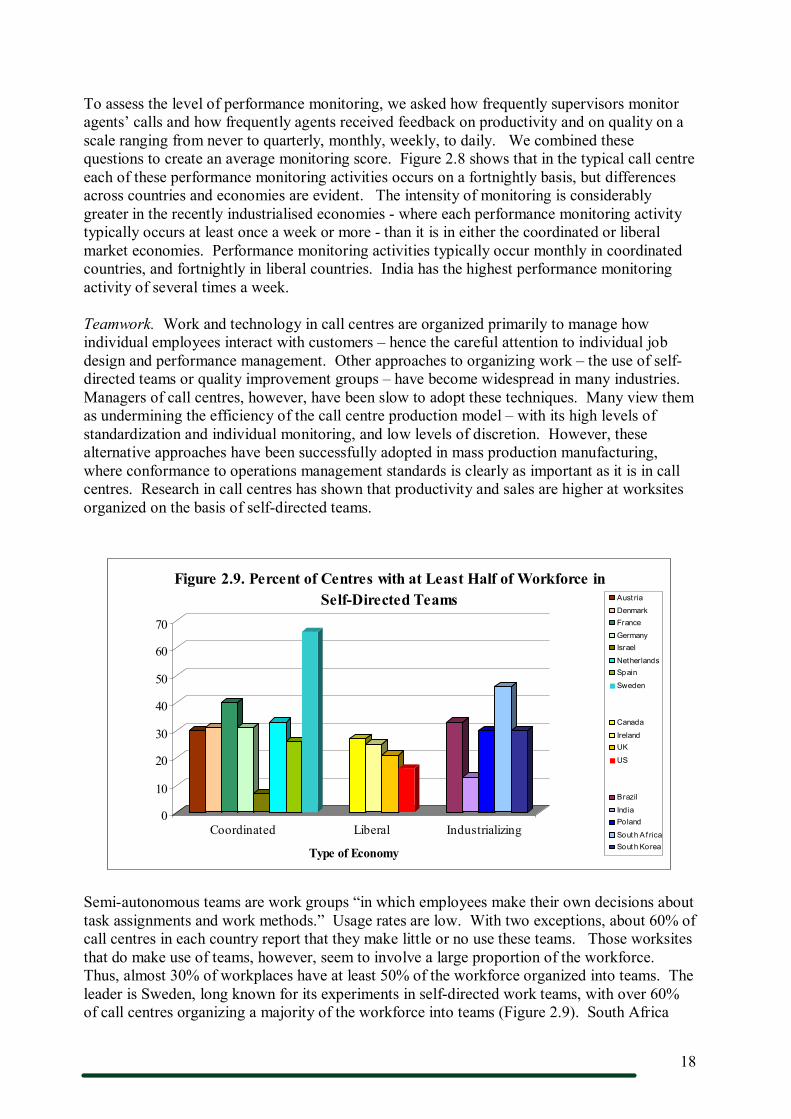
To assess the level of performance monitoring, we asked how frequently supervisors monitor agents’ calls and how frequently agents received feedback on productivity and on quality on a scale ranging from never to quarterly, monthly, weekly, to daily. We combined these questions to create an average monitoring score. Figure 2.8 shows that in the typical call centre each of these performance monitoring activities occurs on a fortnightly basis, but differences across countries and economies are evident. The intensity of monitoring is considerably greater in the recently industrialised economies where each performance monitoring activity typically occurs at least once a week or more than it is in either the coordinated or liberal market economies. Performance monitoring activities typically occur monthly in coordinated countries, and fortnightly in liberal countries. India has the highest performance monitoring activity of several times a week.
Teamwork. Work and technology in call centres are organized primarily to manage how individual employees interact with customers – hence the careful attention to individual job design and performance management. Other approaches to organizing work – the use of self directed teams or quality improvement groups – have become widespread in many industries. Managers of call centres, however, have been slow to adopt these techniques. Many view them as undermining the efficiency of the call centre production model – with its high levels of standardization and individual monitoring, and low levels of discretion. However, these alternative approaches have been successfully adopted in mass production manufacturing, where conformance to operations management standards is clearly as important as it is in call centres. Research in call centres has shown that productivity and sales are higher at worksites organized on the basis of selfdirected teams.
0
10
20
30
40
50
60
70
Coordinated Liberal Industrializing
Type of Economy
Figure 2.9. Percent of Centres with at Least Half of Workforce in SelfDirected Teams Aust ria
Denmark France
Germany Israel
Netherlands Spain
Sweden
Canada
Ireland UK
US
Brazil
Ind ia Poland
South A f rica South Korea
Semiautonomous teams are work groups “in which employees make their own decisions about task assignments and work methods.” Usage rates are low. With two exceptions, about 60% of call centres in each country report that they make little or no use these teams. Those worksites that do make use of teams, however, seem to involve a large proportion of the workforce. Thus, almost 30% of workplaces have at least 50% of the workforce organized into teams. The leader is Sweden, long known for its experiments in selfdirected work teams, with over 60% of call centres organizing a majority of the workforce into teams (Figure 2.9). South Africa
19
also has a high rate of use, with 46% of managers reporting the use of teams for a majority of employees.
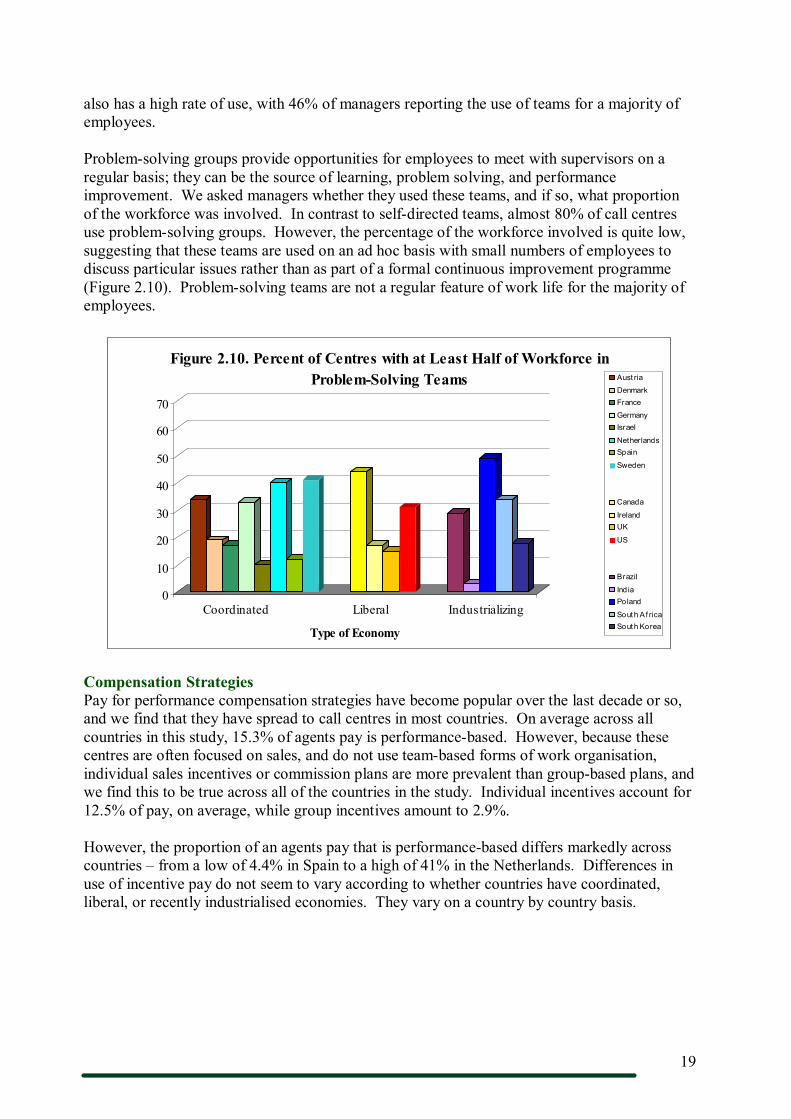
Problemsolving groups provide opportunities for employees to meet with supervisors on a regular basis; they can be the source of learning, problem solving, and performance improvement. We asked managers whether they used these teams, and if so, what proportion of the workforce was involved. In contrast to selfdirected teams, almost 80% of call centres use problemsolving groups. However, the percentage of the workforce involved is quite low, suggesting that these teams are used on an ad hoc basis with small numbers of employees to discuss particular issues rather than as part of a formal continuous improvement programme (Figure 2.10). Problemsolving teams are not a regular feature of work life for the majority of employees.
0
10
20
30
40
50
60
70
Coordinated Liberal Industrializing
Type of Economy
Figure 2.10. Percent of Centres with at Least Half of Workforce in ProblemSolving Teams Aust ria
Denmark France
Germany Israel
Netherlands Spain
Sweden
Canada
Ireland UK
US
Brazil
Ind ia Poland
South A f rica South Korea
Compensation Strategies Pay for performance compensation strategies have become popular over the last decade or so, and we find that they have spread to call centres in most countries. On average across all countries in this study, 15.3% of agents pay is performancebased. However, because these centres are often focused on sales, and do not use teambased forms of work organisation, individual sales incentives or commission plans are more prevalent than groupbased plans, and we find this to be true across all of the countries in the study. Individual incentives account for 12.5% of pay, on average, while group incentives amount to 2.9%.
However, the proportion of an agents pay that is performancebased differs markedly across countries – from a low of 4.4% in Spain to a high of 41% in the Netherlands. Differences in use of incentive pay do not seem to vary according to whether countries have coordinated, liberal, or recently industrialised economies. They vary on a country by country basis.

20
A similar pattern exists for managerial pay, but surprisingly, managers have lower levels of performancebased pay than do agents in most of the countries in the study. Incentive pay averages 12.8% of managerial pay, divided between individual incentives (8.5%) and group incentives (4.3%). Again, the variability in strategies across countries is notable (see Figure 2.12).

21
Collective Representation Industrial relations systems differ substantially from one country to another in terms of the extent of union coverage and the rules governing collective bargaining. These differences have important implications for the level of wages and wage inequality across countries.
One of the most important differences is the level of centralization or coordination in collective bargaining. In the coordinated economies, collective bargaining historically has occurred between unions and employers associations at the industry or sectoral level. The negotiated wage often is extended to other employers, regardless of whether they are parties to negotiations or whether their employees are union members. This tends to reduce overall wage inequality. In the liberal market economies, by contrast, industrial relations systems are quite decentralized, and collective bargaining typically occurs at the firmlevel or lower, resulting in large differences in wages across industries, across firms in the same industry, and even across worksites in the same firm. The recently industrialised economies in our study also tend to have relatively decentralized systems, with large differences in wages and working conditions across firms.
Whether these historic differences apply to the call centre sector, however, has been a subject of debate. On the one hand, where firms are already covered by collective bargaining, then the ‘inhouse’ centres set up by those firms should also be covered by collective agreements. Union coverage in call centres would reflect the level of union organisation in the sector as a whole. If aggregated across sectors, we would expect collective bargaining coverage in call centres to reflect national patterns. Thus, call centres in coordinated economies should have higher levels of union representation and lower wage inequality than those in liberal and recently industrialised markets. On the other hand, if call centres are set up as subsidiaries or as outsourced centres, then they are unlikely to be covered by unions or collective agreements even in the coordinated economies (except the Netherlands and France where a national bargaining structures for outsourced centres have emerged).
Works councils provide another form of collective representation. While the regulations governing works councils differ from one country to another, these councils generally provide a forum for elected employee representatives to consult with management over working conditions and workplace restructuring. Union representatives may serve as works council representatives, but the two forms of representation are distinct. Some workplaces have active unions and active works councils, while others have only unions, only works councils, or no representation at all. Canada, the US, India, and South Korea have no works council legislation.
In general, we find a relatively high level of collective bargaining and works council activity in call centres. Forty percent of call centres are covered by collective bargaining agreements or bargaining agreements plus works councils. Just over 50% have some form of collective representation. And as expected, the coordinated economies have considerably higher levels of representation than either the liberal market or recently industrialised economies. Among the continental EU countries (except Poland), 62% of centres have collective bargaining agreements or collective bargaining agreements plus works councils, and 77% have some form of collective representation (see Figure 2.13).

22
Liberal and recently industrialised economies, by contrast, look quite different: while Ireland and the UK have considerable collective bargaining coverage (35% and 46% respectively), Canada and the US have quite low coverage (16% and less than 10% respectively). Similarly, while Brazil has considerable collective bargaining coverage (70%), and South Korea and Poland have less than 10% each.
Earnings levels and collective bargaining. Annual earnings were defined as basic pay plus all performancerelated pay, (including individual and group commission, and profit sharing) but excluding overtime pay. We converted these pay levels to US dollars using the exchange rate current at the time of the country’s survey. It is not meaningful to compare earnings across countries because they fail to take into account tax levels, benefit levels, and the cost of living, among other differences. However, it is meaningful to compare the earnings of different groups of employees within each country, and in Figure 2.14 we present the annual earnings of employees in centres covered by collective bargaining versus those that are not. We report the typical annual earnings of fulltime agents and managers. By typical (median), we mean that about half of the sample is paid more and half is paid less.
Figure 2.14 shows that, in call centres covered by collective bargaining, wages are higher than in call centres not covered. The differences for agent wages are statistically significant in all countries except Austria, Sweden, Israel, Poland, South Africa, and the UK (there is no union data for India and Spain). These differences in earnings may be due to various factors, such as sector location, customer markets served, whether a centre is inhouse or outsourced, the complexity of tasks, or human capital – factors that are not taken into account in Figure 2.14. In Brazil, union call centres show significantly lower wages, although this may be due to sectoral or other factors that we were unable to account for.
The earnings differential for managers is smaller in magnitude, and the differences are statistically significant in Austria, Ireland, Canada, and the US.

23
Figure 2.14. Earnings of Agents & Managers, by Collective Bargaining Coverage
Agents Median Pay (US$) Managers Median Pay (US$)
Covered by Collective Bargaining
Not Covered by Collective Bargaining
% Difference
Covered by Collective Bargaining
Not Covered by Collective Bargaining
% Difference
Col. A Col. B Col. A/B Col. D Col. E Col. D/E Coordinated Austria 16,075 15,181 6% 60,241 48,193 20% Denmark 44,516 40,323 9% 66,567 62,581 6% France 22,386 19,188 14% 40,590 39,360 3% Germany 34,776 26,208 25% 79,380 69,300 13% Israel 10,000 8,800 12% 18,667 16,000 14% Netherlands 16,022 12,526 22% 61,920 56,889 8% Spain (NA) 14,640 14,640 0% 63,440 63,440 0% Sweden 30,375 30,375 0% 42,606 42,606 0% Average 23,599 20,905 11% 54,176 49,796 8% Liberal Canada 40,000 29,000 28% 70,000 51,000 27% Ireland 29,400 26,730 9% 67,500 48,000 29% UK 27,300 25,480 7% 49,140 49,140 0% US 35,000 27,250 22% 64,000 60,000 6% Average 32,925 27,115 18% 62,660 52,035 17% Industrialising Brazil 3,415 4,484 31% 23,630 21,525 9% India (NA) 2,489 2,489 0% 8,222 8,222 0% Poland 7,613 6,344 17% 18,300 17,538 4% South Africa 11,029 10,588 4% 24,044 32,059 33% S. Korea 19,105 13,026 32% 34,736 30,394 13%
24
PART III.
The Businesslevel Picture: Drivers of Differences between Firms
In this part we consider businesslevel factors that explain why call centres differ. We focus on two business strategies that influence work organization and human resource practices: outsourcing and customer segmentation strategies. As we have shown, all of the countries in this study have some proportion of call centres operated by subcontractors – averaging about onethird of all centres, and ranging from a low of 13% in the US to 80% in India. Customer segmentation strategies allow companies to differentiate service activities according to the demand characteristics of customer groups – typically by product, task, or valueadded. This differentiation, in turn, allows the call centre to take advantage of specialization in workforce skills and labour allocation.
Subcontractors and Inhouse Call Centres Prior research shows that companies frequently use subcontractors to reduce costs or to carry out tasks that are transactional in nature or that the firm considers not to be core competencies. Pressures to keep costs low may reduce wage rates and the use of ‘highcost’ sophisticated human resource practices, while increasing the need for higher efficiencies (e.g., more calls per person, shorter call lengths).
Outsourcing also involves risks for companies, as they have little direct control over the quality of operations. As a result, client firms often insist on vendor agreements that spell out in great detail the procedures to be used by subcontractors to ensure quality control. This may result in clients closely monitoring the operations of subcontractors – and to an overall reduction in the discretion of both the managers and the agents in subcontractors. Subcontractors also juggle multiple contracts and face considerable uncertainty in demand as they do not know when they may get new contracts or lose existing ones. Hence, they are likely to use more flexible staffing strategies compared to inhouse operations.
The findings in this section show that subcontractors are different from inhouse centres in virtually all of the countries in the study: they are newer market entrants and more likely to serve the international market; they are larger in size and more likely to focus exclusively on sales and outbound calls. They make greater use of parttime and temporary workers, offer lower discretion jobs, have higher levels of performance monitoring, pay lower wages, and are less likely to be covered by union contracts. We describe these patterns in detail below.
Markets and organisation. Subcontractors differ from inhouse centres in the markets they serve. Twentythree percent of subcontractors serve international customers compared to 9% of inhouse call centres. However, among the countries in this study, international subcontractors are disproportionately located in three countries: Canada, India, and South Africa. When these three countries are excluded, the differences between subcontractors and inhouse centres in the rest of the countries are smaller: 11% of subcontractors versus 6% of in house centres serve international markets. Subcontractors, on average, are also newer entrants to the market: the typical subcontractor is about two years younger than the typical inhouse centre.
Subcontractors are typically larger than inhouse centres. The typical size of a subcontractor is 77, compared to 41 employees for inhouse centres. This pattern holds across all the countries

25
in the study (except South Africa). Subcontractors also employ 56% of all call centre employees, even though they only make up 33% of all call centres.
Types of customer services. In addition to differences in market orientation and size, subcontractors differ from inhouse centres in the types of services they offer: they are significantly more likely to focus exclusively on sales. On average, 36% of subcontractors focus exclusively on sales to existing and new customers, compared to 14% of inhouse centres. The difference between inhouse and subcontractors is more marked in certain countries. For example, 53% of French subcontractors focused exclusively on sales, while only 14% of French inhouse call centres do so; while subcontractors in Spain (15%) and South Korea (12%) are much less likely to focus exclusively on sales. Figure 3.1 shows that, a higher proportion inhouse call centres have a customer service orientation that primarily involves customer service only or a combination of sales and service.
Figure 3.1. Percentage of Centres Providing Different Types of Services
Subcontractor InHouse Service Type (%) Sales only to existing or new customers 36 14 Service & Sales 22 35 Service Only 43 51
Inbound and Outbound Calls Inbound 59 88 Outbound 41 12
The majority of subcontractors and inhouse call centres deal primarily with inbound calls, but subcontractors are significantly less likely to deal with inbounds calls, and more likely to deal with outbound calls. In this study, 88% of inhouse centres deal with inbound calls, while only 59% of subcontractors do so. Overall, the findings suggest that subcontractors are more likely to specialize in outbound sales and telemarketing compared to inhouse centres.
There are no significant differences in the median call times between subcontractors (3mins, 17 seconds) and inhouse call centres (3mins, 20 seconds) but agents in subcontractors typically handle 80 calls per day, which is significantly higher than the 65 calls per day that agents in in house call centres typically handle.
Human resource and industrial relations practices. Subcontractors and inhouse centres do not differ significantly in their adoption of call centre technologies or in their use of sophisticated selection tests, or performancebased pay. But a number of differences in human resource practices and work organization are salient. As the tables and charts below indicate, subcontractors are significantly less likely to use permanent, fulltime staff or to invest in new hire training. The jobs in subcontractor centres tend to be of lower complexity and to offer lower earnings to both workers and managers. These attributes are consistent with a cost focused business strategy.
Fulltime vs. contingent staffing. Compared to inhouse centres, subcontractors hire a significantly lower proportion of fulltime permanent employees. In the average subcontractor, 63% of agents have fulltime contracts, compared to 74% in inhouse centres. Subcontractors rely more heavily on parttime and temporary staff. The average subcontractor employs 20%
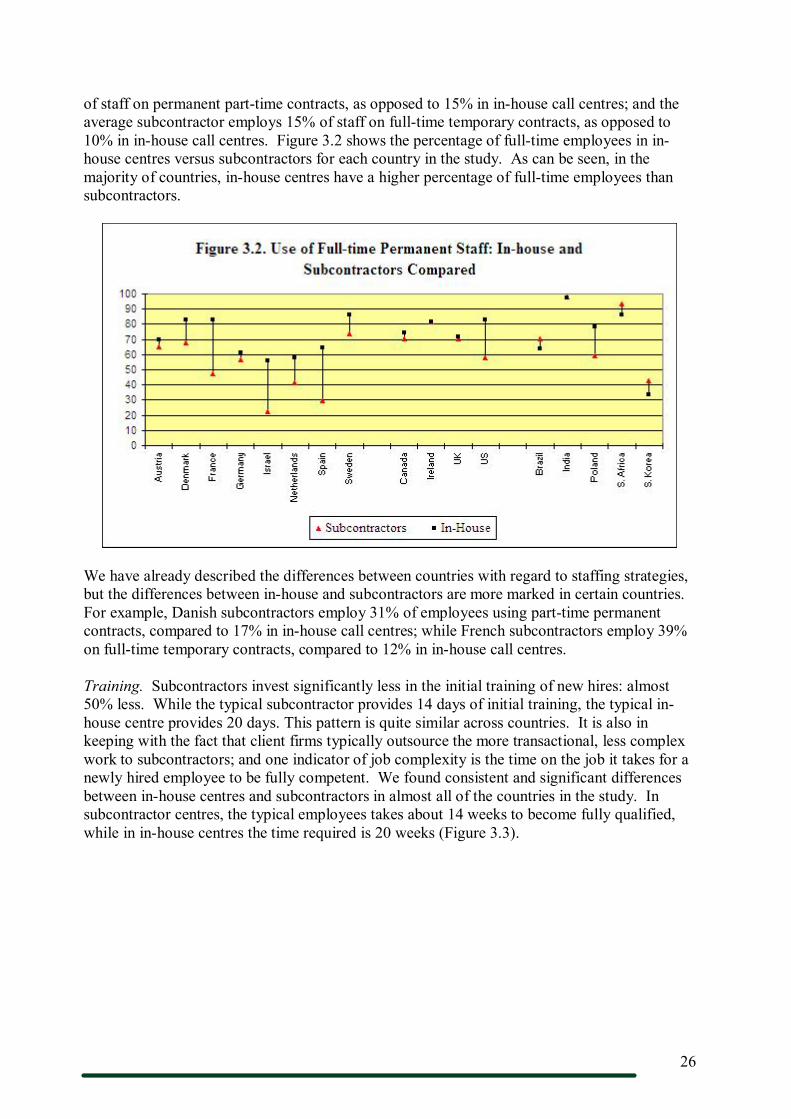
26
of staff on permanent parttime contracts, as opposed to 15% in inhouse call centres; and the average subcontractor employs 15% of staff on fulltime temporary contracts, as opposed to 10% in inhouse call centres. Figure 3.2 shows the percentage of fulltime employees in in house centres versus subcontractors for each country in the study. As can be seen, in the majority of countries, inhouse centres have a higher percentage of fulltime employees than subcontractors.
We have already described the differences between countries with regard to staffing strategies, but the differences between inhouse and subcontractors are more marked in certain countries. For example, Danish subcontractors employ 31% of employees using parttime permanent contracts, compared to 17% in inhouse call centres; while French subcontractors employ 39% on fulltime temporary contracts, compared to 12% in inhouse call centres.
Training. Subcontractors invest significantly less in the initial training of new hires: almost 50% less. While the typical subcontractor provides 14 days of initial training, the typical in house centre provides 20 days. This pattern is quite similar across countries. It is also in keeping with the fact that client firms typically outsource the more transactional, less complex work to subcontractors; and one indicator of job complexity is the time on the job it takes for a newly hired employee to be fully competent. We found consistent and significant differences between inhouse centres and subcontractors in almost all of the countries in the study. In subcontractor centres, the typical employees takes about 14 weeks to become fully qualified, while in inhouse centres the time required is 20 weeks (Figure 3.3).

27
Work design. Subcontractors are also more likely to have jobs that offer lower discretion and higher performance monitoring. They do not differ markedly in their use of teams.
Figure 3.4 shows the percentage of jobs with low discretion. Fortyeight percent of subcontractors reported jobs with little or no discretion, compared to 35% of inhouse centre managers.
Broken down further, it is evident that agents have very low levels of job discretion in 15% of subcontractors, whereas very low levels of job discretion are found in only 6% of inhouse call centres.

28
Performance monitoring is typically higher in subcontractors. It typically occurs on a weekly basis in subcontractors centres, compared to a monthly basis in inhouse centres. These patterns are consistent with the fact that client firms are likely to insist on high levels of standardization and monitoring as a mechanism for ensuring quality control. There is little difference with regard to team working. For example, 28% of subcontractors and 30% of in house call centres have more than half of employees engaged in problemsolving groups.
Annual earnings Another indicator of the differences between inhouse and subcontractors centres is the annual pay that employees receive. Figure 3.5 shows the percent difference in the annual earnings of agents and managers in inhouse centres versus subcontractors for each country. We report the typical annual earnings of fulltime employees in the typical call centre. By typical (median), we mean that about half of the sample is paid more and half is paid less.
Figure 3.5. Typical Annual Earnings of Call Centre Agents & Managers (US$): Inhouse Centres & Subcontractors Compared Call Centre Agents Managers
Inhouse Centres
Sub contractors
% difference
Inhouse Centres
Sub contractors % difference
Col. A Col. B Col. A/B Col. D Col. E Col. D/E Austria $16,867 $14,506 16.28 $50,602 $56,626 10.64 Denmark $44,516 $36,774 21.05 $66,129 $56,452 17.14 France $22,755 $18,450 23.33 $41,820 $36,900 13.33 Germany $33,264 $26,208 26.92 $75,600 $66,150 14.29 Israel $9,333 $8,507 9.72 $16,267 $18,667 12.86 Netherlands $16,770 $11,610 44.44 $61,920 $54,180 14.29 Spain $17,690 $12,216 44.81 $62,220 $63,440 1.92 Sweden $30,618 $25,718 19.06 $43,200 $40,500 6.67
Canada $34,165 $25,500 33.98 $60,000 $50,000 20.00 Ireland $28,800 $22,500 28.00 $58,560 $36,000 62.67 UK $27,300 $24,570 11.11 $50,106 $47,320 5.89 US $29,000 $25,000 16.00 $60,000 $49,500 21.21
Brazil $4,484 $3,139 42.86 $26,906 $21,525 25.00 India $2,667 $2,311 15.38 $8,889 $8,111 9.59 Poland $6,954 $5,710 21.79 $18,300 $17,538 4.35 S. Africa $10,588 $10,551 0.35 $31,324 $21,176 47.92 S. Korea $13,816 $12,765 8.23 $34,736 $22,578 53.85
Average annual earnings are lower for call centre agents in subcontractors compared to in house centres in all but one of the countries in the study (in South Africa, where they are equal). These differences are statistically significantly different in all countries but Austria, India, Poland, and the UK. The wages of agents in subcontractors are, on average, 12% lower than the country median, whereas the wages for agents in inhouse call centres are 6% above the country median. This means that agents in inhouse call centres get a wage that is, on average, 18% higher than agents in subcontractors. These differences in wages may be due to various factors. Subcontractors typically have lower union coverage, lower task complexity, and hire employees with lower skills and formal education.
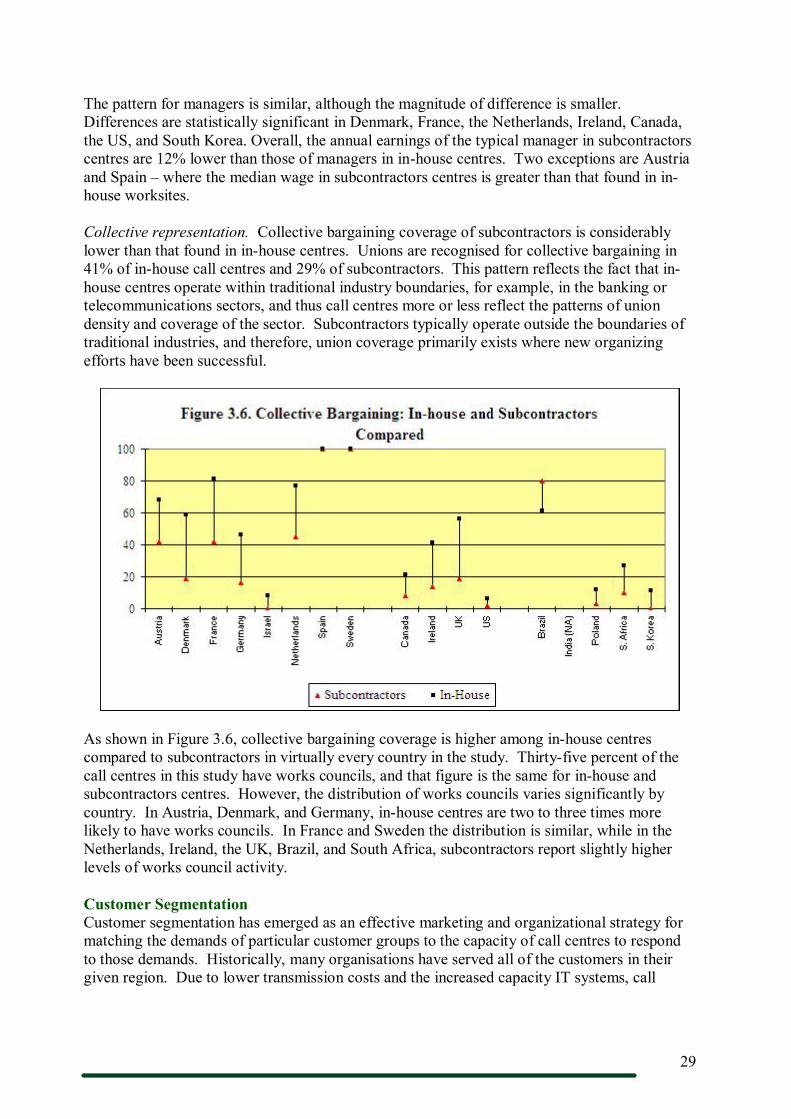
29
The pattern for managers is similar, although the magnitude of difference is smaller. Differences are statistically significant in Denmark, France, the Netherlands, Ireland, Canada, the US, and South Korea. Overall, the annual earnings of the typical manager in subcontractors centres are 12% lower than those of managers in inhouse centres. Two exceptions are Austria and Spain – where the median wage in subcontractors centres is greater than that found in in house worksites.
Collective representation. Collective bargaining coverage of subcontractors is considerably lower than that found in inhouse centres. Unions are recognised for collective bargaining in 41% of inhouse call centres and 29% of subcontractors. This pattern reflects the fact that in house centres operate within traditional industry boundaries, for example, in the banking or telecommunications sectors, and thus call centres more or less reflect the patterns of union density and coverage of the sector. Subcontractors typically operate outside the boundaries of traditional industries, and therefore, union coverage primarily exists where new organizing efforts have been successful.
As shown in Figure 3.6, collective bargaining coverage is higher among inhouse centres compared to subcontractors in virtually every country in the study. Thirtyfive percent of the call centres in this study have works councils, and that figure is the same for inhouse and subcontractors centres. However, the distribution of works councils varies significantly by country. In Austria, Denmark, and Germany, inhouse centres are two to three times more likely to have works councils. In France and Sweden the distribution is similar, while in the Netherlands, Ireland, the UK, Brazil, and South Africa, subcontractors report slightly higher levels of works council activity.
Customer Segmentation Customer segmentation has emerged as an effective marketing and organizational strategy for matching the demands of particular customer groups to the capacity of call centres to respond to those demands. Historically, many organisations have served all of the customers in their given region. Due to lower transmission costs and the increased capacity IT systems, call
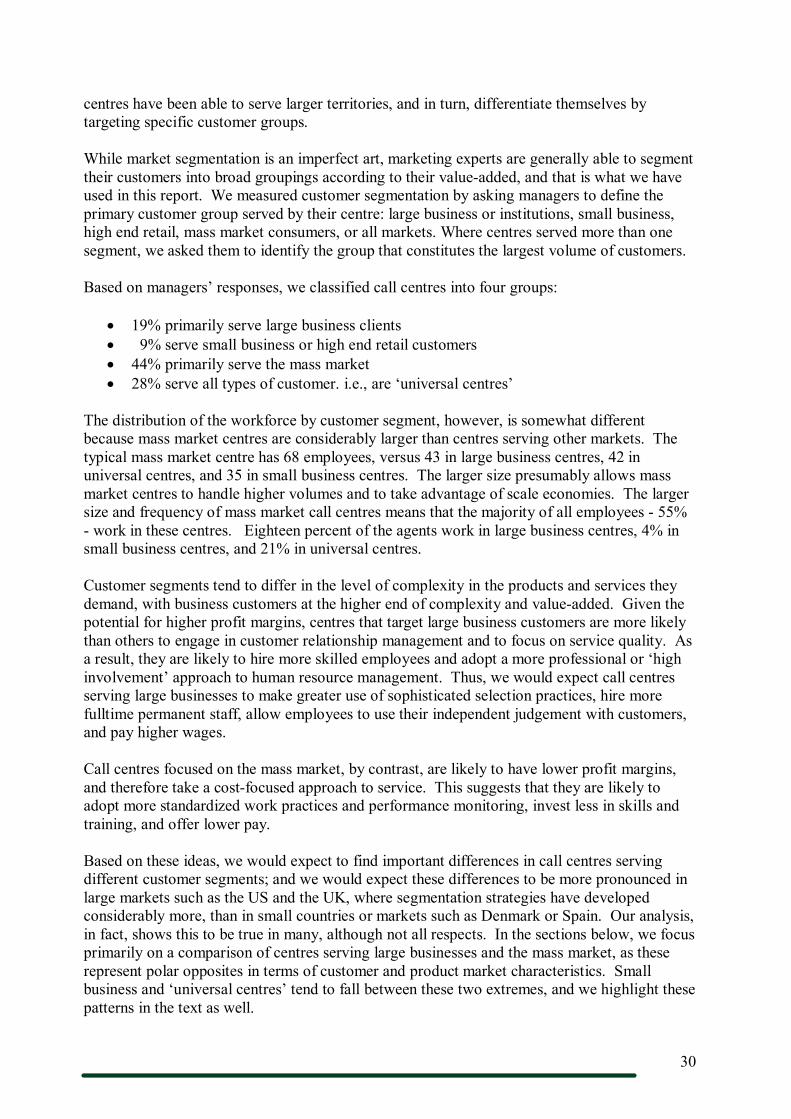
30
centres have been able to serve larger territories, and in turn, differentiate themselves by targeting specific customer groups.
While market segmentation is an imperfect art, marketing experts are generally able to segment their customers into broad groupings according to their valueadded, and that is what we have used in this report. We measured customer segmentation by asking managers to define the primary customer group served by their centre: large business or institutions, small business, high end retail, mass market consumers, or all markets. Where centres served more than one segment, we asked them to identify the group that constitutes the largest volume of customers.
Based on managers’ responses, we classified call centres into four groups:
• 19% primarily serve large business clients • 9% serve small business or high end retail customers • 44% primarily serve the mass market • 28% serve all types of customer. i.e., are ‘universal centres’
The distribution of the workforce by customer segment, however, is somewhat different because mass market centres are considerably larger than centres serving other markets. The typical mass market centre has 68 employees, versus 43 in large business centres, 42 in universal centres, and 35 in small business centres. The larger size presumably allows mass market centres to handle higher volumes and to take advantage of scale economies. The larger size and frequency of mass market call centres means that the majority of all employees 55% work in these centres. Eighteen percent of the agents work in large business centres, 4% in small business centres, and 21% in universal centres.
Customer segments tend to differ in the level of complexity in the products and services they demand, with business customers at the higher end of complexity and valueadded. Given the potential for higher profit margins, centres that target large business customers are more likely than others to engage in customer relationship management and to focus on service quality. As a result, they are likely to hire more skilled employees and adopt a more professional or ‘high involvement’ approach to human resource management. Thus, we would expect call centres serving large businesses to make greater use of sophisticated selection practices, hire more fulltime permanent staff, allow employees to use their independent judgement with customers, and pay higher wages.
Call centres focused on the mass market, by contrast, are likely to have lower profit margins, and therefore take a costfocused approach to service. This suggests that they are likely to adopt more standardized work practices and performance monitoring, invest less in skills and training, and offer lower pay.
Based on these ideas, we would expect to find important differences in call centres serving different customer segments; and we would expect these differences to be more pronounced in large markets such as the US and the UK, where segmentation strategies have developed considerably more, than in small countries or markets such as Denmark or Spain. Our analysis, in fact, shows this to be true in many, although not all respects. In the sections below, we focus primarily on a comparison of centres serving large businesses and the mass market, as these represent polar opposites in terms of customer and product market characteristics. Small business and ‘universal centres’ tend to fall between these two extremes, and we highlight these patterns in the text as well.
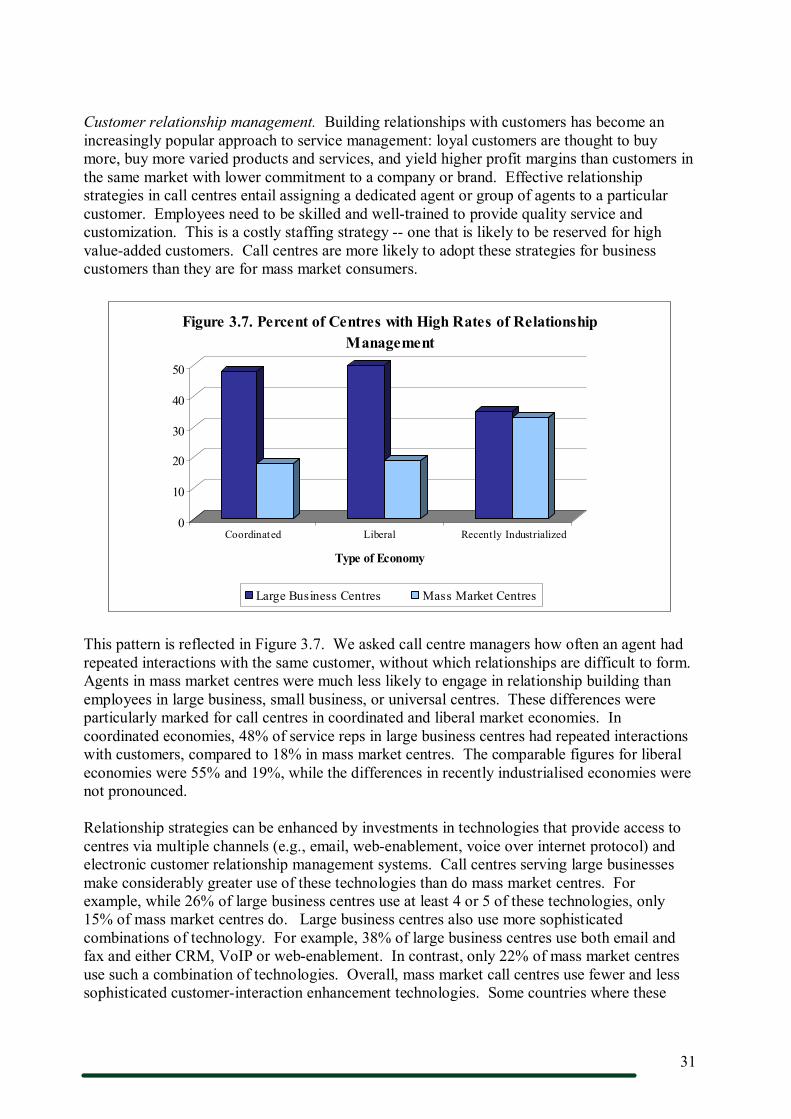
31
Customer relationship management. Building relationships with customers has become an increasingly popular approach to service management: loyal customers are thought to buy more, buy more varied products and services, and yield higher profit margins than customers in the same market with lower commitment to a company or brand. Effective relationship strategies in call centres entail assigning a dedicated agent or group of agents to a particular customer. Employees need to be skilled and welltrained to provide quality service and customization. This is a costly staffing strategy one that is likely to be reserved for high valueadded customers. Call centres are more likely to adopt these strategies for business customers than they are for mass market consumers.
0
10
20
30
40
50
Coordinated Liberal Recently Industrialized
Type of Economy
Figure 3.7. Percent of Centres with High Rates of Relationship Management
Large Business Centres Mass Market Centres
This pattern is reflected in Figure 3.7. We asked call centre managers how often an agent had repeated interactions with the same customer, without which relationships are difficult to form. Agents in mass market centres were much less likely to engage in relationship building than employees in large business, small business, or universal centres. These differences were particularly marked for call centres in coordinated and liberal market economies. In coordinated economies, 48% of service reps in large business centres had repeated interactions with customers, compared to 18% in mass market centres. The comparable figures for liberal economies were 55% and 19%, while the differences in recently industrialised economies were not pronounced.
Relationship strategies can be enhanced by investments in technologies that provide access to centres via multiple channels (e.g., email, webenablement, voice over internet protocol) and electronic customer relationship management systems. Call centres serving large businesses make considerably greater use of these technologies than do mass market centres. For example, while 26% of large business centres use at least 4 or 5 of these technologies, only 15% of mass market centres do. Large business centres also use more sophisticated combinations of technology. For example, 38% of large business centres use both email and fax and either CRM, VoIP or webenablement. In contrast, only 22% of mass market centres use such a combination of technologies. Overall, mass market call centres use fewer and less sophisticated customerinteraction enhancement technologies. Some countries where these
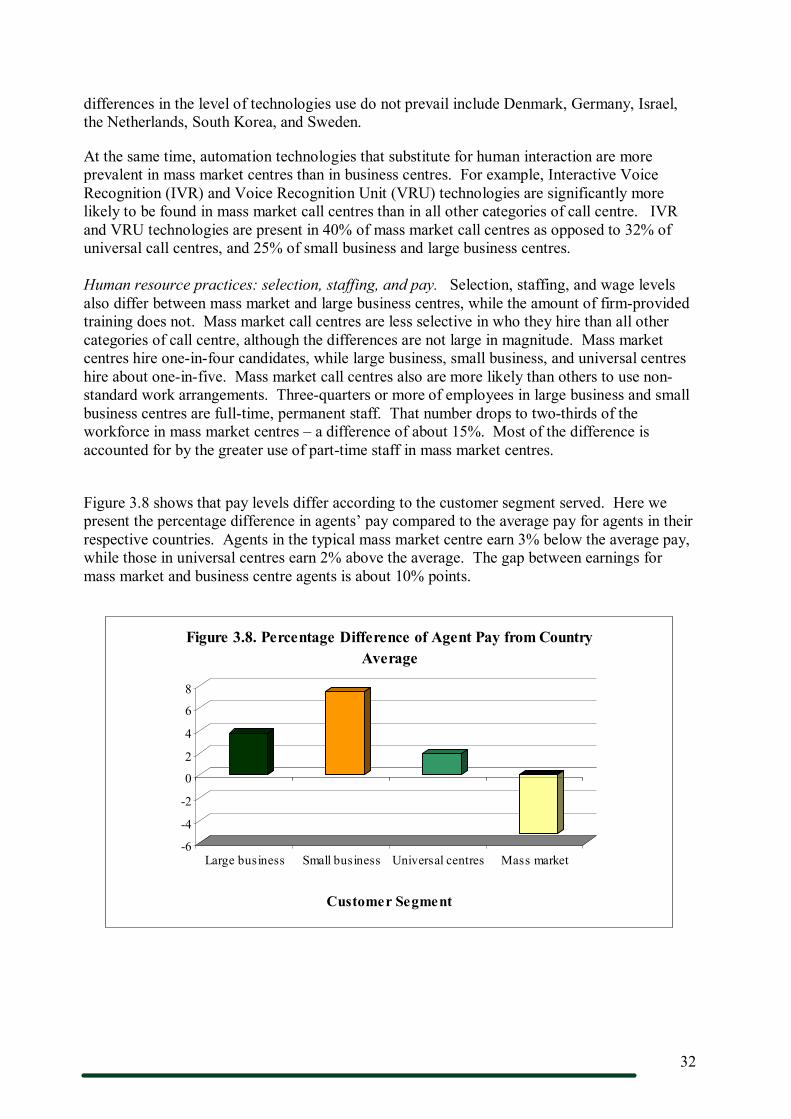
32
differences in the level of technologies use do not prevail include Denmark, Germany, Israel, the Netherlands, South Korea, and Sweden.
At the same time, automation technologies that substitute for human interaction are more prevalent in mass market centres than in business centres. For example, Interactive Voice Recognition (IVR) and Voice Recognition Unit (VRU) technologies are significantly more likely to be found in mass market call centres than in all other categories of call centre. IVR and VRU technologies are present in 40% of mass market call centres as opposed to 32% of universal call centres, and 25% of small business and large business centres.
Human resource practices: selection, staffing, and pay. Selection, staffing, and wage levels also differ between mass market and large business centres, while the amount of firmprovided training does not. Mass market call centres are less selective in who they hire than all other categories of call centre, although the differences are not large in magnitude. Mass market centres hire oneinfour candidates, while large business, small business, and universal centres hire about oneinfive. Mass market call centres also are more likely than others to use non standard work arrangements. Threequarters or more of employees in large business and small business centres are fulltime, permanent staff. That number drops to twothirds of the workforce in mass market centres – a difference of about 15%. Most of the difference is accounted for by the greater use of parttime staff in mass market centres.
Figure 3.8 shows that pay levels differ according to the customer segment served. Here we present the percentage difference in agents’ pay compared to the average pay for agents in their respective countries. Agents in the typical mass market centre earn 3% below the average pay, while those in universal centres earn 2% above the average. The gap between earnings for mass market and business centre agents is about 10% points.
6
4
2
0
2
4
6
8
Large business Small business Universal centres Mass market
Customer Segment
Figure 3.8. Percentage Difference of Agent Pay from Country Average

33
A similar picture is evident with regard to managerial pay but the differences are not so pronounced; and only managers in large business call centres receive a wage that is significantly higher than managers in mass market and universal call centres (Figure 3.9).
6
4
2
0
2
4
6
8
Large business Small business Universal centres Mass market
Customer Segment
Figure 3.9. Percentage Difference of Manager pay from Country Average
Work organization. The organization of work also differs across centres serving distinct customer segments. The level of discretion is significantly higher in large business centres, compared to mass market centres, but the size of the overall differences is not large. For example, 28% of jobs in large business centres have high levels of employee discretion at work, compared to 18% in mass market centres. Performance monitoring activity is also higher in mass market centres, although again the differences are not large. Performance monitoring activities typically occur several times a month in mass market centres, as opposed to once a month in large business centres.
0
10
20
30
40
50
Coordinated Liberal Recently Industrialized
Type of Economy
Figure 3.10. Percent of Centres with 50% of Agents in Self Directed Teams
Large Business Centres Mass Market Centres
Overall, large business centres are also more likely to make use of selfdirected work groups. While 35% of large business centres have at least 50% of agents in selfdirected work groups,

34
only 24% of mass market centres do. These differences, however, are primarily accounted for by the coordinated and liberal market countries, as shown in Figure 3.10. In coordinated economies, the percent of large business centres with at least 50% of agents in teams is 44%, compared to 28% of mass market centres. In liberal market countries, the differences are 28% to 21%, but in recently industrialised countries, large business centres are somewhat less likely to use these teams.
Large business centres are also more likely to use problemsolving groups, and this pattern is consistent across all three types of economies in the study. Averaging across countries, 33% of large business centres have at least 50% of the workforce involved in these groups, while 23% of the mass market centres do.
0 10 20 30
40 50
Coordinated Liberal Recently Industrialized
Type of Economy
Figure 3.11. Percent of Centres with 50% of Agents in Problem Solving Groups
Large Business Centres Mass Market Centres
Collective representation. Large business and mass market centres also differ in the extent to which they are covered by collective bargaining, with a larger proportion of mass market centres with union representation. While this is pattern occurs in most countries, the level of union coverage for the two types of centres differs greatly across countries, as is evident in Figure 3.12. In this chart, the percent of union coverage in large business centres is everywhere lower than mass market centres except in South Africa, where 20% of mass market centres are covered by unions versus 40% of large business centres. The coverage in the Netherlands and in Sweden is virtually identical, as they have highly coordinated industrial relations systems. There are very large differences, however, in Denmark, Germany, Ireland, and the UK. It is also noteworthy that these differences are not based on whether countries have coordinated, liberal market, or recently industrialised economies.
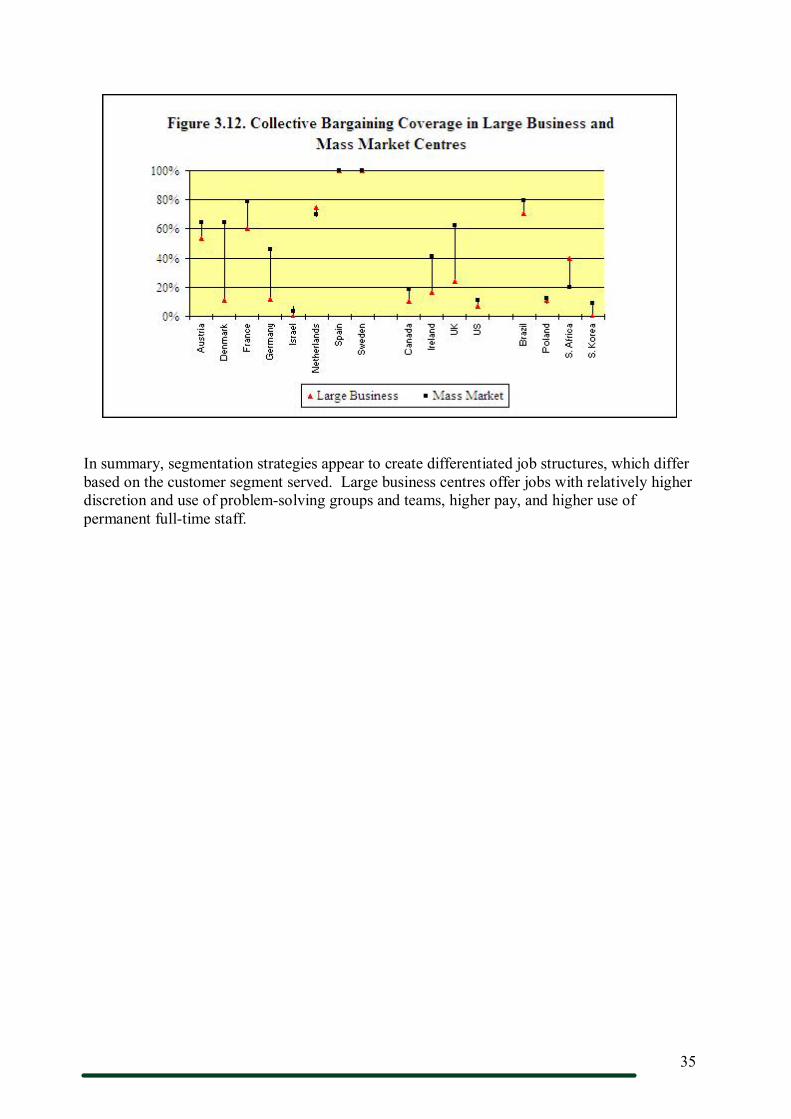
35
In summary, segmentation strategies appear to create differentiated job structures, which differ based on the customer segment served. Large business centres offer jobs with relatively higher discretion and use of problemsolving groups and teams, higher pay, and higher use of permanent fulltime staff.
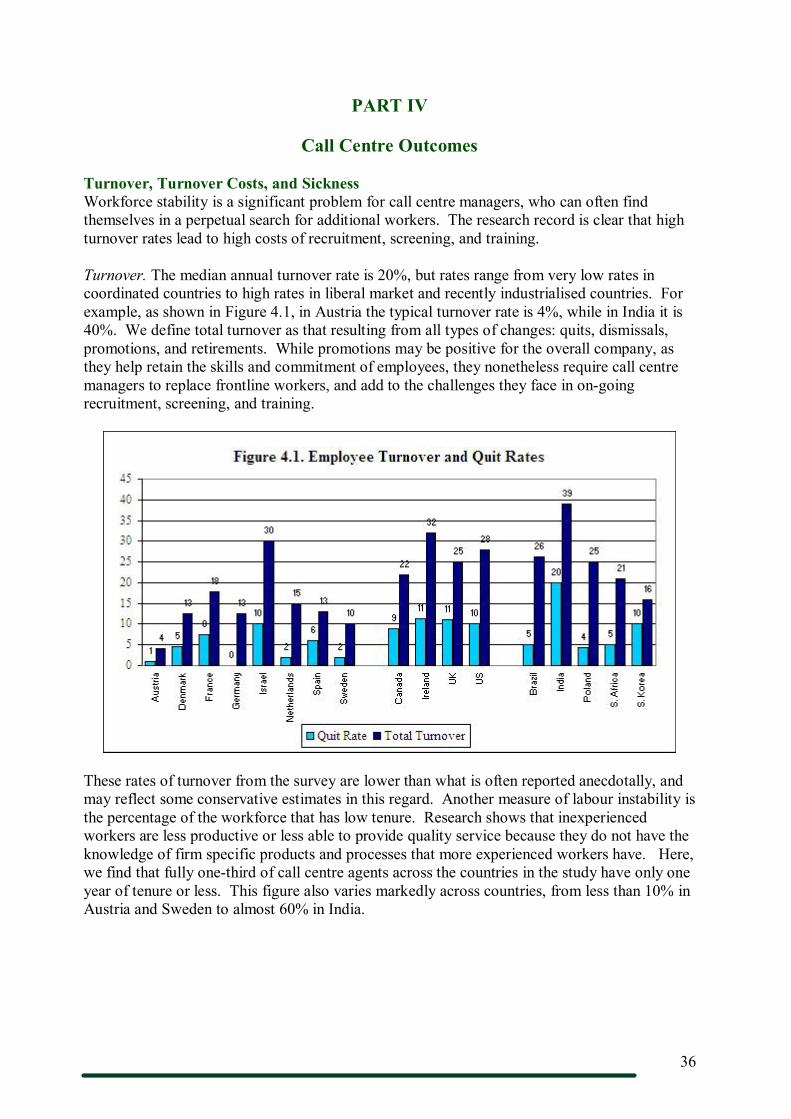
36
PART IV
Call Centre Outcomes
Turnover, Turnover Costs, and Sickness Workforce stability is a significant problem for call centre managers, who can often find themselves in a perpetual search for additional workers. The research record is clear that high turnover rates lead to high costs of recruitment, screening, and training.
Turnover. The median annual turnover rate is 20%, but rates range from very low rates in coordinated countries to high rates in liberal market and recently industrialised countries. For example, as shown in Figure 4.1, in Austria the typical turnover rate is 4%, while in India it is 40%. We define total turnover as that resulting from all types of changes: quits, dismissals, promotions, and retirements. While promotions may be positive for the overall company, as they help retain the skills and commitment of employees, they nonetheless require call centre managers to replace frontline workers, and add to the challenges they face in ongoing recruitment, screening, and training.
These rates of turnover from the survey are lower than what is often reported anecdotally, and may reflect some conservative estimates in this regard. Another measure of labour instability is the percentage of the workforce that has low tenure. Research shows that inexperienced workers are less productive or less able to provide quality service because they do not have the knowledge of firm specific products and processes that more experienced workers have. Here, we find that fully onethird of call centre agents across the countries in the study have only one year of tenure or less. This figure also varies markedly across countries, from less than 10% in Austria and Sweden to almost 60% in India.

37
0
15
30
45
60
Coordinated Liberal Industrializing
Type of Economy
Figure 4.2. Percent of Workforce with Less than 1 Year Tenure Aus tria
Denmark
France
Germany
Is rael
Netherland s (NA)
Sp ain
Sweden
Canad a
Ireland
UK
US
Brazil
Ind ia
Po land
So uth Africa
S. Korea
Turnover costs. To estimate the effects of turnover on operational costs, we asked managers to report how much it cost them to recruit, screen, and train a typical new employee. To make this cost comparable across different countries, we calculated them as a percentage of the gross annual pay of the typical call centre agent at each site. On average, replacing one agent equals 16% of the gross annual earnings of a call centre worker – that is, the simple replacement costs of one worker equal about two months of a typical worker’s pay, as shown in Figure 4.3.
0%
10%
20%
30%
40%
Coordinated Liberal Industrializing Type of Economy
Figure 4.3. Recruitment Costs as % of Annual Agent Pay Aust ria
Denmark
France
Germany
Is rael
Netherlands
Sp ain
Swed en
Canada
Ireland
UK
US
Brazil
Ind ia
Po land
So ut h Africa
S. Ko rea
These percentages also vary markedly across countries, with no particular pattern based on whether an economy is classified as coordinated, liberal, or industrialising.
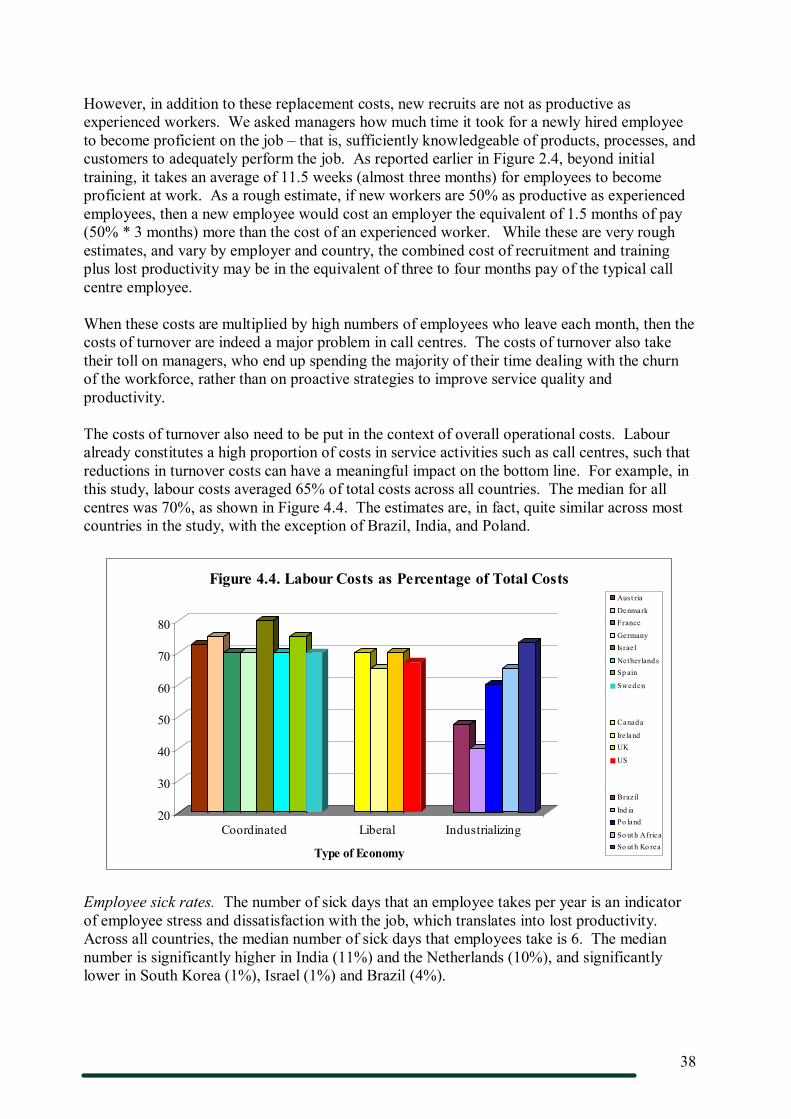
38
However, in addition to these replacement costs, new recruits are not as productive as experienced workers. We asked managers how much time it took for a newly hired employee to become proficient on the job – that is, sufficiently knowledgeable of products, processes, and customers to adequately perform the job. As reported earlier in Figure 2.4, beyond initial training, it takes an average of 11.5 weeks (almost three months) for employees to become proficient at work. As a rough estimate, if new workers are 50% as productive as experienced employees, then a new employee would cost an employer the equivalent of 1.5 months of pay (50% * 3 months) more than the cost of an experienced worker. While these are very rough estimates, and vary by employer and country, the combined cost of recruitment and training plus lost productivity may be in the equivalent of three to four months pay of the typical call centre employee.
When these costs are multiplied by high numbers of employees who leave each month, then the costs of turnover are indeed a major problem in call centres. The costs of turnover also take their toll on managers, who end up spending the majority of their time dealing with the churn of the workforce, rather than on proactive strategies to improve service quality and productivity.
The costs of turnover also need to be put in the context of overall operational costs. Labour already constitutes a high proportion of costs in service activities such as call centres, such that reductions in turnover costs can have a meaningful impact on the bottom line. For example, in this study, labour costs averaged 65% of total costs across all countries. The median for all centres was 70%, as shown in Figure 4.4. The estimates are, in fact, quite similar across most countries in the study, with the exception of Brazil, India, and Poland.
20
30
40
50
60
70
80
Coordinated Liberal Industrializing
Type of Economy
Figure 4.4. Labour Costs as Percentage of Total Costs Aust ria
Denmark France
Germany Is rael
Netherlands Sp ain
Sweden
Canada
Ireland UK
US
Brazil
Ind ia Po land
So ut h Africa So ut h Ko rea
Employee sick rates. The number of sick days that an employee takes per year is an indicator of employee stress and dissatisfaction with the job, which translates into lost productivity. Across all countries, the median number of sick days that employees take is 6. The median number is significantly higher in India (11%) and the Netherlands (10%), and significantly lower in South Korea (1%), Israel (1%) and Brazil (4%).
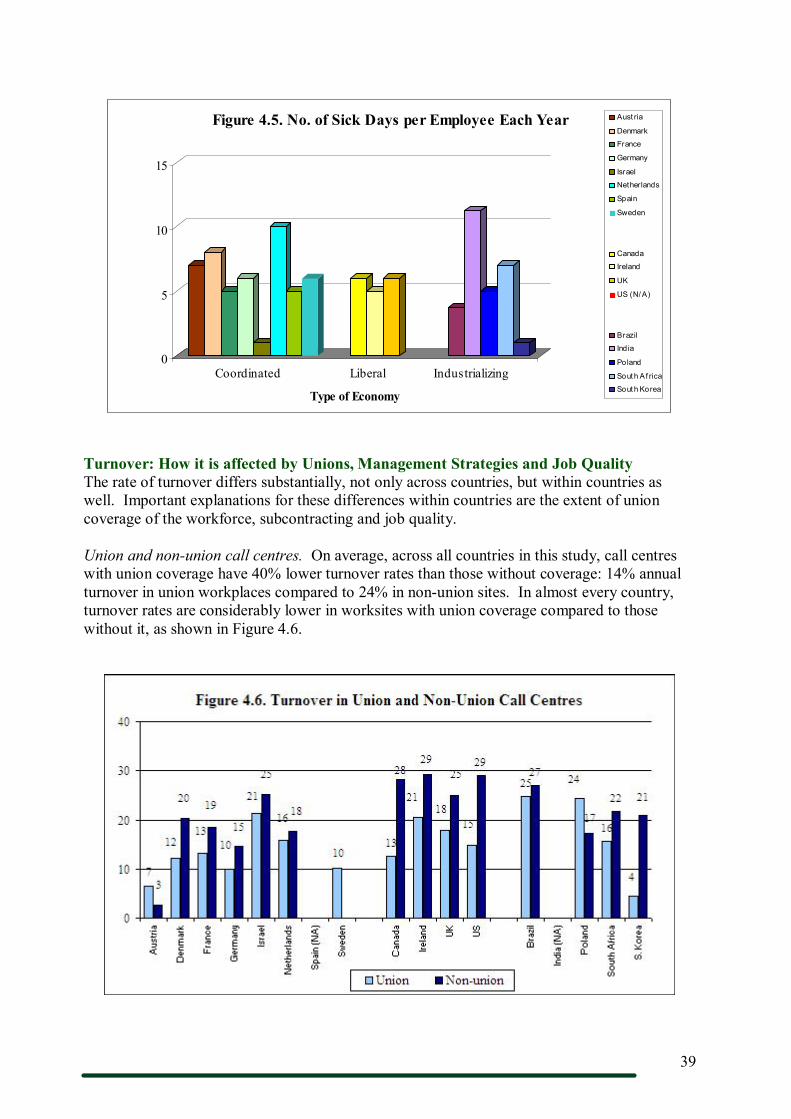
39
0
5
10
15
Coordinated Liberal Industrializing
Type of Economy
Figure 4.5. No. of Sick Days per Employee Each Year Aust ria
Denmark
France
Germany
Israel
Netherlands
Spain
Sweden
Canada
Ireland
UK
US (N/A)
Brazil
Ind ia
Poland
South A f rica
South Korea
Turnover: How it is affected by Unions, Management Strategies and Job Quality The rate of turnover differs substantially, not only across countries, but within countries as well. Important explanations for these differences within countries are the extent of union coverage of the workforce, subcontracting and job quality.
Union and nonunion call centres. On average, across all countries in this study, call centres with union coverage have 40% lower turnover rates than those without coverage: 14% annual turnover in union workplaces compared to 24% in nonunion sites. In almost every country, turnover rates are considerably lower in worksites with union coverage compared to those without it, as shown in Figure 4.6.

40
Subcontractor and inhouse. Similarly, there are substantial differences in turnover rates between inhouse and outsourced centres (See Figure 4.7). On average, turnover rates are 19% per year in inhouse centres, compared to 25% among subcontractors. Again, these patterns hold across most countries in this study.
Job quality. Part of the explanation for differences in turnover rates resides in differences in the quality of jobs in these centres. There is a large and growing research literature on turnover, which demonstrates that managerial choices have a substantial effect on the level of churn in the workforce. In call centres, a major factor shaping turnover and absenteeism is the quality of job design.
Here, we measure the quality of jobs along two dimensions: the extent of discretion at work and the intensity of performance monitoring. Employees who have reasonable levels of discretion at work not only feel a sense of control, but have the ability to respond directly to customer demands and have a sense of responsibility to do so as well. They are able to deliver quality service and take responsibility for quality control. They are held responsible for their output, and so, do not need to be monitored in the process. By contrast, call centres that rely on standardized scripts and low levels of discretion, are likely to also rely on high levels of performance monitoring. In doing so, they send a signal to employees that management does not trust them to perform well or be responsible. In addition, studies have consistently linked high job discretion and low performance monitoring to higher levels of employee wellbeing.
As such, both job discretion and performance monitoring are indicators of job quality; and assessing the extent of job quality in call centres entails examining the proportion of jobs with different combinations of job discretion and performance monitoring. To do this, we analyzed the international survey data and divided job discretion in to three levels: ‘low to very low’, ‘moderate’ and ‘high to very high’. We also split performance monitoring into three levels: ‘low’, i.e., less than monthly, ‘moderate’, i.e., monthly to once a week, and ‘high’, i.e., few times a week to daily. The lefthand side of Figure 4.6 shows the proportion of call centres that have jobs with different combinations of job discretion and performance monitoring.
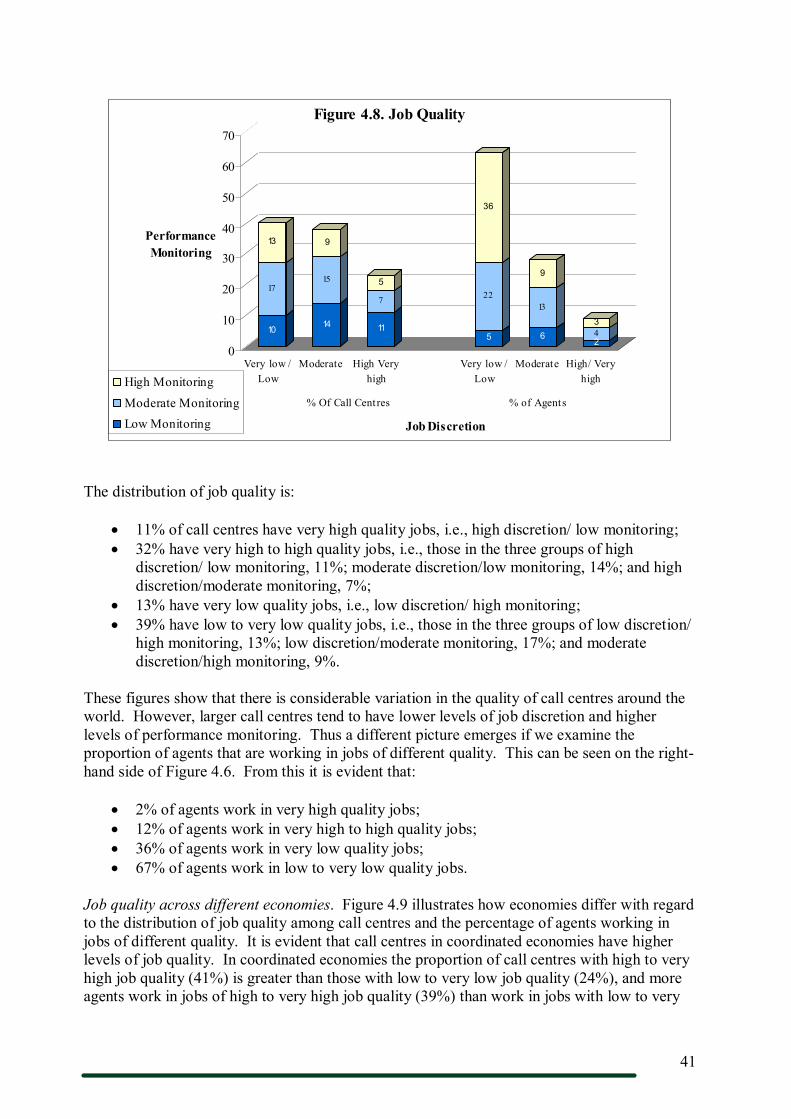
41
10
17
13
14
15
9
11
7
5
5
22
36
6
13
9
2 4 3
0
10
20
30
40
50
60
70
Performance Monitoring
Very low / Low
Moderate High Very high
Very low / Low
Moderate High/ Very high
% Of Call Centres % of Agents
Job Discretion
Figure 4.8. Job Quality
High Monitoring
Moderate Monitoring Low Monitoring
The distribution of job quality is:
• 11% of call centres have very high quality jobs, i.e., high discretion/ low monitoring; • 32% have very high to high quality jobs, i.e., those in the three groups of high
discretion/ low monitoring, 11%; moderate discretion/low monitoring, 14%; and high discretion/moderate monitoring, 7%;
• 13% have very low quality jobs, i.e., low discretion/ high monitoring; • 39% have low to very low quality jobs, i.e., those in the three groups of low discretion/
high monitoring, 13%; low discretion/moderate monitoring, 17%; and moderate discretion/high monitoring, 9%.
These figures show that there is considerable variation in the quality of call centres around the world. However, larger call centres tend to have lower levels of job discretion and higher levels of performance monitoring. Thus a different picture emerges if we examine the proportion of agents that are working in jobs of different quality. This can be seen on the right hand side of Figure 4.6. From this it is evident that:
• 2% of agents work in very high quality jobs; • 12% of agents work in very high to high quality jobs; • 36% of agents work in very low quality jobs; • 67% of agents work in low to very low quality jobs.
Job quality across different economies. Figure 4.9 illustrates how economies differ with regard to the distribution of job quality among call centres and the percentage of agents working in jobs of different quality. It is evident that call centres in coordinated economies have higher levels of job quality. In coordinated economies the proportion of call centres with high to very high job quality (41%) is greater than those with low to very low job quality (24%), and more agents work in jobs of high to very high job quality (39%) than work in jobs with low to very

42
low job quality (33%). The situation for liberal and industrialising economies is the reverse. For example, in liberal economies the proportion of call centres with high to very high job quality (25%) is lower than those with low to very low job quality (48%), and fewer agents work in jobs of high to very high job quality (10%) than work in jobs with low to very low job quality (67%). Moreover, in industrialising economies 82% of agents work in jobs of a low to very low quality.
Figure 4.9. Job Quality across Economies
% Of Call Centres % Of Agents
V. low Low to V. low
V. High High to V. High
V. low Low to V. low
V. High High to V. High
Coordinated 6 24 16 41 5 33 4 39
Liberal 15 48 8 25 24 67 1 10
Industrialising 21 50 7 21 60 82 1 2
Job quality and subcontractors. Subcontractors have lower job quality than inhouse call centres. Fiftythree percent of subcontractors have jobs of low to very low quality and 22% have jobs of high to very high quality. In contrast, 32% of inhouse call centres have jobs of low to very low quality and 37% have jobs of high to very high quality
Job quality and turnover. Our research shows that low quality jobs are associated with higher turnover and, in particular, with higher quit rates. This can be seen in Figure 4.10, which shows that turnover and quit rates are higher as job discretion becomes lower and performance monitoring becomes higher. Indeed, the typical level of turnover in call centres with very high quality jobs (high discretion/low monitoring) is 9%, whereas it is 36% in call centres with low quality jobs (low discretion/high monitoring). The typical quit rate is 0% in very high quality jobs and 15% in very low quality jobs. This is because low job discretion and high performance monitoring have been shown to increase employee stress, and as a result an employee is more likely to quit his or her job.
Figure 4.10. Job Quality, Turnover, and Quit Rates
Turnover Quit Rate
Performance Monitoring Performance Monitoring
Low Moderate High Low Moderate High
Job Discretion
Low to Very Low 17 29 36 7 10 15
Moderate 15 20 20 3 8 10
High to Very High 9 20 18 0 5 7
Our findings indicate that performance monitoring in call centres works by ensuring that employees sustain a high level of task effort. While this may promote employee performance, high levels of monitoring hasten the depletion of physical and mental resources, which leads to

43
lower levels of wellbeing. Job discretion enables call centre employees to manage and cope better with task demands, thereby improving wellbeing and effectiveness. These findings are consistent with previous studies.
Sales growth. Just over onehalf of call centres in our sample were engaged in selling products and services. Sales growth for the typical call centre in this study was 5% per year. The average annual growth rate was 17%; however, managers in India and Poland reported considerably higher rates of 89% and 38%, respectively. When these two countries are excluded, the average annual sales growth was 12 percent, with a low of 5% in the US, Israel, and South Korea, and a high of 18% in Denmark and 23% in Brazil. The rates do not reflect the overall growth rates of call centre sales in each country, however, because they do not indicate the extent to which call centre consolidation may be occurring at different rates in each country.
Target time. Eightyseven percent of calls are answered within the set target time, with a small range of variation among countries. India, for example, is significantly higher than the average, at 95 percent, while Holland is significantly lower, at 80%.
The extent to which a call centres meets the specified target time is likely to be influenced by a number of factors. These include the sophistication of the call forecasting technologies in use and the ability of the organisation to match supply with demand. However, call centres vary in the emphasis that is placed on achieving this performance metric. For example, in subcontractors meeting the target time may be more important than in inhouse call centres, as it is an important means with which to reduce costs and show contract compliance. Likewise, industrialising economies may place greater emphasis on meeting the target time metric.
75
80
85
90
95
Coordinated Liberal Industrializing
Type of Economy
Figure 4.11. Percent of Calls Answered Within Set Target Time Aust ria
Denmark
France
Germany
Israel
Netherlands
Spain
Sweden
Canada
Ireland
UK
US
Brazil
Ind ia
Poland
South A f rica
South Korea

44
PART V
Conclusion
This is the first report to provide a detailed comparison of management and employment practices in call centres within and across national boundaries. Covering almost twenty countries in all regions of the world, it dispels certain myths about this important emerging sector.
For example, media accounts typically portray call centres as large warehouses providing low skill, high turnover jobs. Outsourcing and offshoring are viewed as the dominant trends in what are considered low valueadded activities.
While we find that a substantial proportion of centres do follow a costminimisation approach, with high levels of standardisation, this portrait is not universally true. Rather, this study provides a more complex and differentiated view of call centre operations. The variation in management practices is noteworthy. Differences include alternative approaches to the design of work and the quality of jobs (e.g., the level of discretion, monitoring, and use of teamwork), adoption of human resource practices (e.g., systematic selection tests, performance appraisals, training), and collective bargaining structures. Managers adopt a range of alternative approaches to customer service, from transactional to quite professional. But why do these differences occur? Our results suggest that institutional factors, business strategies, and operational choices play important roles in shaping call centre management and employment outcomes.
Differences in labor market institutions are one major source of differentiation. In the coordinated economies of continental Europe, a high proportion of call centres is covered by union and works council representation. In these countries, employers and employee representatives often consult or negotiate over work design and human resource practices. Compared to centres in liberal market or recently industrialised countries, those in coordinated economies have better quality jobs, lower turnover, and lower wage dispersion. Call centres in coordinated countries also make greater use of subcontracting and parttime contracts as strategies to increase organisational flexibility, and this is likely to be a means of circumventing labour market regulations.
While institutions shape variation across countries, alternative business strategies help to explain differences within countries. Of particular importance in this sector is the use of customer segmentation strategies. Centres that target a unique customer group are able to design their management and employment systems to match the demand characteristics of that group. Thus we found, for example, that compared to mass market call centres, call centres serving business make greater use of sophisticated customer relationship technologies, offer better quality jobs, pay higher wages, use team work more extensively, and employ a greater proportion of fulltime permanent staff. They do this as it enables them to provide better quality service and to meet the more complex needs of business customers.
The different strategic and operational contexts of inhouse centres and subcontractors also explain our finding that, in virtually all countries in the study, subcontractors differ significantly from inhouse centres in their management and employment systems. Compared to inhouse centres, subcontractor operations have more standardised jobs with lower skills and pay, higher performance monitoring, higher turnover, greater use of parttime and contingent

45
staff, and lower union representation. These attributes may be explained by their higher strategic emphasis on cost reduction and greater fluctuation in demand as they handle multiple client contracts.
In sum, our findings highlight important differences in the strategic positioning of call centres within and across countries around the world. As this sector continues to grow in size and importance, employers and public policy makers will need to consider what changes are needed to ensure its sustainability and its role in economic development. There is ample evidence to show that heavy reliance on a costfocused model not only creates low quality jobs but also breeds customer dissatisfaction and employee turnover. In an age of mass customization, where customer demands for higher service quality are on the rise, costfocused strategies are likely to satisfy an ever smaller portion of transactions. Employer strategies to compete on quality, however, depend importantly on the institutional contexts in which they are operating. For example, qualitybased firmlevel strategies are possible only if countries develop the education and training infrastructure needed to supply an educated service workforce – although the education and training infrastructure in most countries has not kept pace with the demand for customer service professionals. Encouragingly, there are many examples across the call centre sector of managers successfully experimenting with new practices and strategies, and also of institutional innovation, such as changes to the education system.
In sum, the emerging international call centre sector is a complex and rapidly changing landscape, far from the stylized facts portrayed in the mainstream media. While ongoing cost pressures shape management practices, alternative strategies and institutional innovations are emerging that hold some promise for quality jobs and service and offer opportunities for constructive economic development.

46
Appendix A: Acknowledgement of Sponsors
Austria: Jubiläumsfonds der Österreichischen Nationalbank
Brazil: Associacao Brasileira de Telesservicos
Canada: Social Sciences and Humanities Council of Canada
Denmark: Russell Sage Foundation
France: Russell Sage Foundation; French National Research Centre; AFRC (Association Francoise des Centres de Relation Client French Employers Association of Call Centres).
Germany: HansBöcklerStiftung, Russell Sage Foundation
India: Center for Advanced Human Resource Studies, Cornell University
Ireland: UCD Business Schools, University College Dublin
Israel: Israel Ministry of Trade and Employment
Netherlands: Dutch Ministry of Social Affairs, NCCBP; Russell Sage Foundation
Poland: HansBöcklerStiftung
South Africa: U. of Witwatersrand, U. of the Western Cape to the South Africa, Pennsylvania State University, Rod Jones Strategic Solutions
South Korea: Korea Labor Institute; Center for Advanced Human Resource Studies, Cornell University
Spain: AIRE program (University Rovira & Virgili); CIDEM (Catalan Government)
Sweden: Scandinavian Centre for Call and Contact Services; Swedish Savings Banks Foundation ; ISA Invest in Sweden Agency; 4BR consultants; Bright verksamhetsutveckling; The Swedish Call Centre Association; MidSweden University; National Institute for Working Life; KTH Royal Institute of Technology, Stockholm
U.K: Economic and Social Research Council, Russell Sage Foundation; UK Customer Contact Association
US: Alfred P. Sloan Foundation, Russell Sage Foundation, Center for Advanced Human Resource Studies, Cornell University.
47
Appendix B: Technical Note on Methods
The survey used in this study is an establishment level survey, administered to the senior manager of each call centre. It is a relatively long and detailed survey that covers the following topics: market conditions, customers served, business strategies, organizational structure, work organization, human resource practices, nonstandard employment practices, wages, tenure, turnover, absenteeism, sick rates, use of government programs, and collective bargaining coverage. The survey asked the general manager to answer questions as they applied to the ‘core’ occupational group – that is, the largest group of employees serving as call centre agents.
While every effort was made to take a consistent approach to sampling and survey administration, there was some variation across countries. See the attached table for information on research methods for each country in the study. Identifying the population of call centres from which to draw the sample was the most difficult step because most countries have no government statistics on call centres. In each country, the sample was chosen from the largest available list of call centres. In most countries, that meant the membership list of the national call centre employers’ association supplemented by other sources.
We compared our data to other available surveys of call centres, and found them to be consistent with estimates of the number of call centres by sector and by inhouse/outsourced status. However, in Germany, the use of association lists led to over sampling of outsourced centres. The sampling strategy in the US led to an over representation of the telecommunications industry in the sample.
For the recently industrialised countries of Brazil, India, South Africa, and South Korea, the surveys were conducted primarily via interviews on site because survey research is relatively undeveloped and mail and telephone surveys yield particularly low response rates. As a result, researchers focused on one or several geographic areas (Sao Paulo in Brazil, Seoul in South Korea, six primary ‘call centre cities’ in India, two primary ‘call centre cities’ in South Africa). They identified the largest list of call centres they could find (based on a combination of employer association lists and telephone books), and administered the surveys wherever they could get access to establishments. Thus, they are large, non random samples.
In general, using employers’ association lists to identify the population of call centres biases the sample towards the better operated centres because the association members tend to be more established operators, often part of large national or multinational corporations. Similarly, in the onsite interviews in recently industrialised countries, it is probable that it was the better run centres that were willing to have academic researchers come on site and conduct interviews. This leads us to expect that the sample, in general, is biased towards larger, more established centres, with more formalized human resource practices and higher wage levels than would be expected if the samples were drawn from the entire population of centres.

48
Survey Methodology
Country Estimated No. Call Centres (2005)
Estimated No. CC Agents (2005)
Source of CC database
No. of CCs in database
Sample size
Sampling Strategy
Survey Administration
Start & End Date
No. of Completed Surveys
Response Rate
Austria
500 40,000 Austrian Call Centre Forum, FORBA database, Internet
165 165 All CCs in database
Telephone 0507, 2005
96 58%
Brazil 1,000 615,000
Employers Association 250 250 All CCs in
database Telephone, email, onsite,
0509, 2005
144 45%
Canada 13,424 512,867 Employers Association 500 500
All CCs in database
Telephone
02/2005 –
05/2006 387 77%
Denmark 350 23,000 Employers Association, phone book, Internet 226 226
All CCs in database
Personal contact w/email response
0609, 2004 118 65%
France 3,100 200,000 Employers Association, France telecom survey 900 340
Stratified random by sector, outsourced Telephone
0508, 2004 210 60%
Germany 3,000 330,000
Previous databases, Regional Development Agency lists 2,800 300
Random, plus added sites Telephone
0910, 2004 155 54%
India N/A 316,000 NAASCOM, Internet, field research 100 75
Nonrandom in call centre cities Onsite
07, 2003 — 08, 2004 63 N/A
Ireland 400 19,500
Previous list, telephone directory, Internet, recruitment agencies 287 188
All with confirmed contact info. Mail
1012, 2004 43 23%
Israel 500 11,000
Telemarketing Association, phone books, Internet, CC mgr forums 80 80
All CCs in database
Onsite 0810, 2004 80 100%
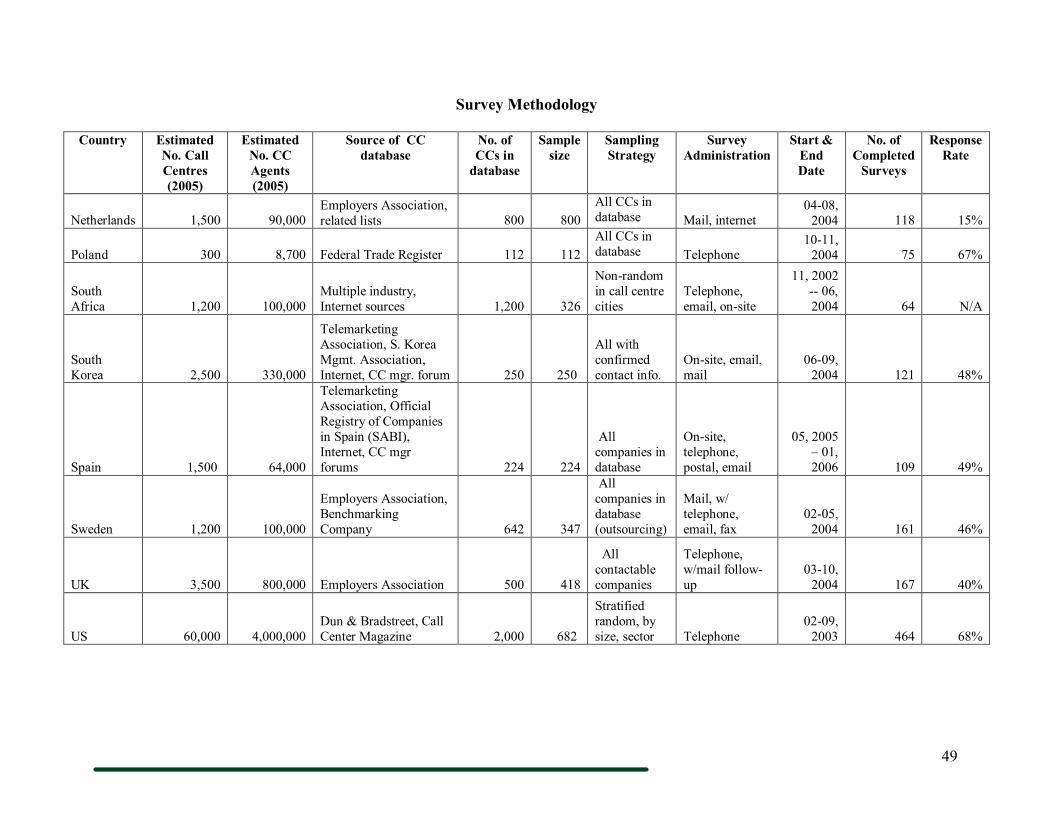
49
Survey Methodology
Country Estimated No. Call Centres (2005)
Estimated No. CC Agents (2005)
Source of CC database
No. of CCs in database
Sample size
Sampling Strategy
Survey Administration
Start & End Date
No. of Completed Surveys
Response Rate
Netherlands 1,500 90,000 Employers Association, related lists 800 800
All CCs in database Mail, internet
0408, 2004 118 15%
Poland 300 8,700 Federal Trade Register 112 112 All CCs in database Telephone
1011, 2004 75 67%
South Africa 1,200 100,000
Multiple industry, Internet sources 1,200 326
Nonrandom in call centre cities
Telephone, email, onsite
11, 2002 06, 2004 64 N/A
South Korea 2,500 330,000
Telemarketing Association, S. Korea Mgmt. Association, Internet, CC mgr. forum 250 250
All with confirmed contact info.
Onsite, email, mail
0609, 2004 121 48%
Spain 1,500 64,000
Telemarketing Association, Official Registry of Companies in Spain (SABI), Internet, CC mgr forums 224 224
All companies in database
Onsite, telephone, postal, email
05, 2005 – 01, 2006 109 49%
Sweden 1,200 100,000
Employers Association, Benchmarking Company 642 347
All companies in database (outsourcing)
Mail, w/ telephone, email, fax
0205, 2004 161 46%
UK 3,500 800,000 Employers Association 500 418
All contactable companies
Telephone, w/mail follow up
0310, 2004 167 40%
US 60,000 4,000,000 Dun & Bradstreet, Call Center Magazine 2,000 682
Stratified random, by size, sector Telephone
0209, 2003 464 68%
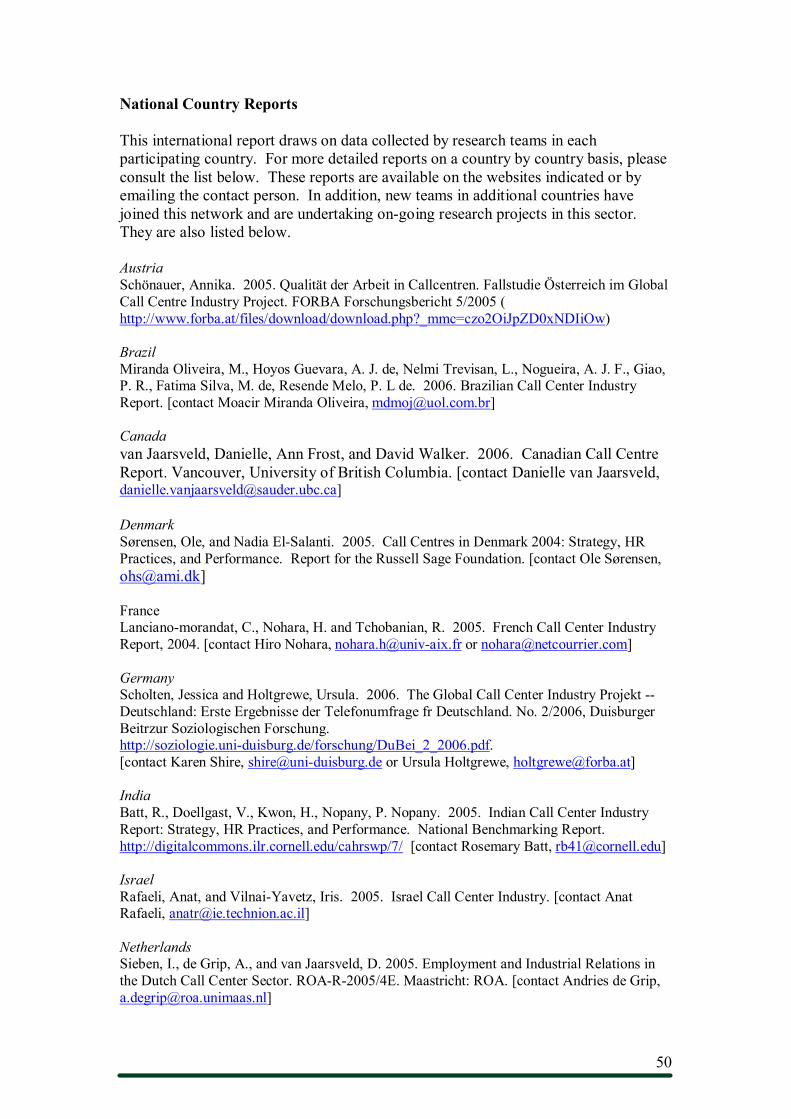
50
National Country Reports
This international report draws on data collected by research teams in each participating country. For more detailed reports on a country by country basis, please consult the list below. These reports are available on the websites indicated or by emailing the contact person. In addition, new teams in additional countries have joined this network and are undertaking ongoing research projects in this sector. They are also listed below.
Austria Schönauer, Annika. 2005. Qualität der Arbeit in Callcentren. Fallstudie Österreich im Global Call Centre Industry Project. FORBA Forschungsbericht 5/2005 ( http://www.forba.at/files/download/download.php?_mmc=czo2OiJpZD0xNDIiOw)
Brazil Miranda Oliveira, M., Hoyos Guevara, A. J. de, Nelmi Trevisan, L., Nogueira, A. J. F., Giao, P. R., Fatima Silva, M. de, Resende Melo, P. L de. 2006. Brazilian Call Center Industry Report. [contact Moacir Miranda Oliveira, [email protected]]
Canada van Jaarsveld, Danielle, Ann Frost, and David Walker. 2006. Canadian Call Centre Report. Vancouver, University of British Columbia. [contact Danielle van Jaarsveld, [email protected]]
Denmark Sørensen, Ole, and Nadia ElSalanti. 2005. Call Centres in Denmark 2004: Strategy, HR Practices, and Performance. Report for the Russell Sage Foundation. [contact Ole Sørensen, [email protected]]
France Lancianomorandat, C., Nohara, H. and Tchobanian, R. 2005. French Call Center Industry Report, 2004. [contact Hiro Nohara, nohara.h@univaix.fr or [email protected]]
Germany Scholten, Jessica and Holtgrewe, Ursula. 2006. The Global Call Center Industry Projekt Deutschland: Erste Ergebnisse der Telefonumfrage fr Deutschland. No. 2/2006, Duisburger Beitrzur Soziologischen Forschung. http://soziologie.uniduisburg.de/forschung/DuBei_2_2006.pdf. [contact Karen Shire, shire@uniduisburg.de or Ursula Holtgrewe, [email protected]]
India Batt, R., Doellgast, V., Kwon, H., Nopany, P. Nopany. 2005. Indian Call Center Industry Report: Strategy, HR Practices, and Performance. National Benchmarking Report. http://digitalcommons.ilr.cornell.edu/cahrswp/7/ [contact Rosemary Batt, [email protected]]
Israel Rafaeli, Anat, and VilnaiYavetz, Iris. 2005. Israel Call Center Industry. [contact Anat Rafaeli, [email protected]]
Netherlands Sieben, I., de Grip, A., and van Jaarsveld, D. 2005. Employment and Industrial Relations in the Dutch Call Center Sector. ROAR2005/4E. Maastricht: ROA. [contact Andries de Grip, [email protected]]

51
Poland Piskurek, E., and Shire, K. 2005. Callcenter in Polen. The Global Call Center Industry Project Ergebnisse der Telefonumfrage für Polen, (Polish call center industry report). Duisburg. http://soziologie.uniduisburg.de/forschung/DuBei_0406.pdf [contact Karen Shire, shire@uniduisburg.de]
South Africa Benner, C., Rahmat, O. and Lewis, C. (2007) The South African Call Centre Industry: National Benchmarking Report, Strategy, HR Practices & Performance. Johannesburg: Sociology of Work Unit and LINK Centre, University of Witwatersrand. [contact Chris Benner [email protected], or Charley Lewis, [email protected]]
South Korea Kwon, H., Lee, B., and Kang, H. 2006. Korean Call Center Report, 2004: Employment, Management, and Working Conditions. [contact Hyunji Kwon or ByoungHoon Lee, [email protected]]
Spain Valverde, M., Gorjup, M. T., Martí, N., Ryan, G., & Villarroya, M. 2006. The Call Centre Sector in Spain: Performance, Strategies and Human Resource Management Practices (El sector de call centres en España: Funcionamiento, estrategias y prácticas de recursos humanos). Grup de Recerca Factor Humà, Organitzacions i Mercats (FHOM), Departament de Gestió d’Empreses, Universitat Rovira i Virgili, Reus, Spain. [contact Mireia Valverde, [email protected]]
Sweden Christer Strandberg and ūe Sandberg. 2007. Call Centers in Sweden. A Description of Orientation, Human Resource Practices and Performance in Internal and External Call Centers. Arbetslivsinstitutet/National Institute for Working Life, MidSweden University and KTH Royal Institute of Technology, Stockholm. To download publications go to www.ali.se, and check for links to other sites. [contact Ake Sandberg, [email protected]]
Strandberg, C, Sandberg, Ŭ Norman, K. 2006. Callcenters i Sverige. En beskrivning av verksamhetsinriktning, human resourcemetoder och prestationer Arbetslivsrapport 2006:20 To download publications go to www.ali.se, and check for links to other sites. [contact Ake Sandberg, [email protected]]
U.K. Holman, D., Wood, S., & Stride, C. 2005. Human Resource Management in U.K. Call Centres. Institute of Work Psychology in association with the Call Centre Association, University of Sheffield, Sheffield. [contact David Holman, [email protected]]
US Batt, Rosemary, Virginia Doellgast, and Hyunji Kwon. 2005. The US Call Center Industry: Strategy, HR Practices, and Performance. National Benchmarking Report. http://digitalcommons.ilr.cornell.edu/cahrswp/6/. [contact Rosemary Batt, [email protected]]

52
ISBN 9780979503610 Copyright © Holman, Batt, and Holtgrewe 2007