The GHG Indicator: UNEP Guidelines for Calculating Greenhouse Gas … · 2005-07-19 · Last...
61
Last printed 10/25/00 14:24 Creating a standard for a corporate CO2 indicator T h h e e G H HG I n n d di c c a a t to r r : : UN E E P P G G u ui d d e e l li n nes f f o o r r C C a a l l c c u u l l a a t t i i n n g g G G r r e e e e n n h h o o u u s s e e G G a a s s E Emi s s s s i ion s s f o or B B u usi n n e e s s s s e e s s an d d No n n - - C C o o m m m m e e r r c c i i a a l l O O r r g g a a n n i i s s a a t t i i o o n n s s by Charles Thomas, Tessa Tennant and Jon Rolls For further information please contact: UNEP Economics and Trade Unit UNEP Energy and Ozon Action Unit International Environment House Tour Mirabeau 15 Chemin des Anémones 39-43 Quai André Citroën 1219 Châtelaine, Genève 75739 Paris Cedex 15 Switzerland France Fax: +41 22 796 9240 Fax: +33 1 44 37 14 74 E-mail: [email protected] E-mail: [email protected]
Transcript of The GHG Indicator: UNEP Guidelines for Calculating Greenhouse Gas … · 2005-07-19 · Last...

Last printed 10/25/00 14:24 Creating a standard for a corporate CO2 indicator
TThhee GGHHGG IInnddiiccaattoorr:: UUNNEEPP GGuuiiddeelliinneess ffoorr CCaallccuullaattiinngg GGrreeeennhhoouussee GGaass
EEmmiissssiioonnss ffoorr BBuussiinneesssseess aanndd NNoonn--CCoommmmeerrcciiaall OOrrggaanniissaattiioonnss
by Charles Thomas, Tessa Tennant
and Jon Rolls
For further information please contact: UNEP Economics and Trade Unit UNEP Energy and Ozon Action Unit International Environment House Tour Mirabeau 15 Chemin des Anémones 39-43 Quai André Citroën 1219 Châtelaine, Genève 75739 Paris Cedex 15 Switzerland France Fax: +41 22 796 9240 Fax: +33 1 44 37 14 74 E-mail: [email protected] E-mail: [email protected]

The GHG Indicator: UNEP Guidelines for Calculating GHG Emissions
2
The opinions expressed in this document are solely the views of the authors and should not be attributed, in any fashion, to UNEP and Henderson Investors, UK. Every effort has been made to ensure the accuracy of this document however the authors cannot take responsibility for any inaccuracies. This publication may be reproduced in whole or in part and in any form for educational or non-profit purposes without special permission from the copyright holder, provided acknowledgement of the source is made. UNEP would appreciate receiving a copy of any publication that uses this publication as a source. No use of this publication may be made for resale or for any other commercial purpose whatsoever without prior permission in writing from UNEP. The designations employed and the presentation of the material in this publication do not imply the expression of any opinion whatsoever on the part of the United Nations Environment Programme concerning the legal status of any country, territory, city or area or of its authorities, or concerning delimitation of its frontiers or boundaries. Moreover, the views expressed do not necessarily represent the decision or the stated policy of the United Nations Environment Programme, nor does citing of companies, trade names, or commercial processes constitute endorsement. United Nations Environment Programme, 2000

The GHG Indicator: UNEP Guidelines for Calculating GHG Emissions
3
“Through the Financial Services Initiatives, UNEP is catalysing action by banks and
insurers to identify innovative responses to climate change, including changing
investment patterns, with the aim of greater sustainability, energy efficiency and
increased use of renewable energy. In this context UNEP welcomes the Insurance
Initiative's efforts to develop a GHG Indicator. This has been used as a model by the United Kingdom to create its own national standard.
I encourage other governments to do the same.”
Klaus Töpfer, Executive Director, UNEP

The GHG Indicator: UNEP Guidelines for Calculating GHG Emissions
4
DDEEVVEELLOOPPMMEENNTT OOFF TTHHEE IINNDDIICCAATTOORR The idea of establishing a standardised methodology for measuring a company’s greenhouse gas (GHG) emissions was initiated in May 1997 by National Provident Institution (NPI)1 Global Care Investments, UK, with the Centre for Environmental Technology, Imperial College, London, UK. Their initial report was published in November 1997 and was circulated for widespread review to accountants, academics, companies, consultants, environmentalists, financial institutions, government agencies and non-governmental organisations, under the auspices of the UNEP Insurers’ Initiative. These guidelines are the result of further consultation with similar groups and incorporate the comments and suggestions from the first review process. They are now intended for translation and widespread distribution in collaboration with the European Bank for Reconstruction and Development (EBRD) and others. There are many inherent difficulties in creating an accounting methodology for GHG emissions of this type and problems in interpretation will inevitably arise. It is therefore up to the user of the guidelines to get the most from them. If users have better information or know better methods, they are encouraged to incorporate them and adapt the guidelines to their specific circumstances, making it clear where and how they have done so. Partner Organisations At the national level, the UK's Department for the Environment, Transport and the Regions (DETR) has adapted the UNEP indicator to make it more appropriate to UK conditions. The DETR document “Environmental Reporting – guidelines for company reporting on greenhouse gas emissions" is widely considered to be a thorough and robust methodology for national reporting. The present guidelines, in turn, use some of the information from the DETR report, where it improves the original UNEP work. The DETR's work is an excellent example of how the UNEP GHG Indicator can be applied by governments to national circumstances. At the international level, a World Resources Institute (WRI) / World Business Council for Sustainable Development (WBCSD) collaboration is aiming to produce a GHG Protocol which companies can apply at three levels: facilities; facilities and internal emissions; and facilities, internal emissions and emissions from other sources. The UNEP indicator is seen as a core part of this third level. Both the DETR and WRI/WBCSD initiatives are highly welcome and widely respected developments in this field. UNEP is also collaborating with the International Energy Agency (IEA), in Paris, which will provide current CO2 (carbon dioxide) statistics for electricity. This assistance, helping to ensure that the indicator is up to date, is greatly appreciated. Within Europe, the European Bank for Reconstruction and Development (EBRD) has agreed to promote the document as part of its due diligence process for projects in Eastern Europe. This illustrates the usefulness of the indicator and will increase understanding and accountability for carbon emissions in those regions. At the corporate level UNEP is pleased to announce collaboration with Blue Circle Industries PLC, to promote and trial the indicator throughout their international operations. This exercise will help to ensure that the indicator is practicable and applicable world-wide. Members of the Global Reporting Initiative (GRI) will also consider the indicator in their future deliberations.
1 In 1999, the AMP GROUP acquired NPI. The NPI Global Care research and investment activities were transferred to their global asset management company, Henderson Investors.

The GHG Indicator: UNEP Guidelines for Calculating GHG Emissions
5
AACCKKNNOOWWLLEEDDGGEEMMEENNTTSS The following people and organisations must be acknowledged for their invaluable input and advice: All those who gave feedback on the first edition of the indicator: Linda Descano Salomon Smith Barney Anne Grafe Buckens Imperial College Christian Armbruster Bayoiscke Laudesbank Munchen Dr. Julian E. Salt Loss Prevention Council Erwin Cotard COGEN Europe George Wood Severn Trent Water Ltd. Graeme Castles British Salt Mark Rhodes Glaxo Wellcome PLC Paul Freund IEA Greenhouse Gas R & D Programme Paul Ramsden Evergreen Consulting Ltd. Peter Matthews National Britannia Ltd. Professor R. H. Gray CSEAR, University of Dundee The following organisations: The following people:
DETR Ken Maguire WRI/WBCSD Ivo Knoepfel EBRD Jan-Olaf Willums INFRAS Aiko Bode IEA Mark Radka UNEP Insurance Industry Initiative The authors: Charles Thomas In 1997, Charles Thomas undertook the initial research for this project as part of his MSc in Environmental Technology at the Center for Environmental Technology, Imperial College, London. The research was undertaken with guidance from the NPI Global Care Investments Research Unit. The first report was completed in collaboration with Tessa Tennant, Head of the Unit, in time for the Kyoto meeting in December 1997. In 1998, Charles was sponsored by NPI, and hosted by UNEP Geneva to conduct an extensive peer review of the work, from which a second version of the report was produced. He now works for BP Amoco and continues as an adviser to the project. Tessa Tennant Since its inception in 1997 to April 2000, Tessa has been the project supervisor and editor. In May she resigned as Policy Adviser to Henderson Investors Socially Responsible Investment Team, UK. She continues to be involved with the UNEP Finance Initiative. Jon Rolls Graduated from Sussex University in 1995. After working for Fina Exploration Ltd. for a short while, he went on to study for an MSc in Environmental Technology at Imperial College. Focusing in particular on Climate Change, he wrote his thesis on the Kyoto Protocol and the oil industry, in collaboration with Total Oil Marine PLC. Jon has updated and revised the guidelines since the last revision and prepared them for final peer review. He is now working as Environmental Engineer at the Thames Barrier, part of the UK Environment Agency. Finally, the document benefited greatly from the professional editing of Geoffrey Bird.

The GHG Indicator: UNEP Guidelines for Calculating GHG Emissions
6
AABBBBRREEVVIIAATTIIOONNSS CEF Carbon Emission Factor CFC Chlorofluorocarbon CH4 Methane CHP Combined Heat and Power CO2 Carbon dioxide CO2EF Carbon Dioxide Emission Factor EBRD European Bank for Reconstruction and Development EEA European Energy Agency EPA Environmental Protection Agency GHG Greenhouse gas GWP Global Warming Potential HGV Heavy Goods Vehicle IEA International Energy Agency IPCC Intergovernmental Panel on Climate Change IPPC/IPC Integrated Pollution Prevention Control / Integrated Pollution Control KWh Kilowatt Hour LGV Light Goods Vehicle LPG Liquefied Petroleum Gas N2O Nitrous oxide NCV Net Calorific Value SME Small and Medium-Sized Enterprise UNEP United Nations Environment Programme UNFCCC United Nations Framework Convention on Climate Change WBCSD World Business Council on Sustainable Development WRI World Resources Institute

The GHG Indicator: UNEP Guidelines for Calculating GHG Emissions
7
LLIISSTT OOFF FFIIGGUURREESS AANNDD TTAABBLLEESS Figure 1: Summary of the Framework of the CO2 Indicator ........................................................................12
Figure 2: Sector Shares of Carbon Dioxide Emissions, 1996.....................................................................15
Table 1: Total electricity consumption growth projections in billions of kilowatt-hours ...............................16
Table 2: Conversion Value References ......................................................................................................21
Table 3: Default Carbon Dioxide Emissions from Fuels .............................................................................23
Table 4: Conversion values for petrol, diesel, and liquefied petroleum gas ...............................................25
Table 5: Emission Factors for Vehicles.......................................................................................................25
Table 6: Conversion values for different passenger transport modes ........................................................25
Table 7: Conversion values for different freight transport modes ...............................................................26
Table 8: Summary of Global Warming Potentials .......................................................................................27
Table 9: Country Specific Net Calorific Values & Carbon Dioxide Emission factors ..................................43
Table 10: NCV’s For Fuels ..........................................................................................................................44
Table 11: CEF’s For Fuels ..........................................................................................................................44
Table 12: Electricity Emission Factors for 1990 and 1996 in t CO2/kWh....................................................47
Table 13: Annex 1 Countries to the Kyoto Protocol and Emission Reduction Requirements ....................56

The GHG Indicator: UNEP Guidelines for Calculating GHG Emissions
8
CCOONNTTEENNTTSS DEVELOPMENT OF THE INDICATOR ...............................................................................................4 ACKNOWLEDGEMENTS…………………………………………………………………………………….5 ABREVIATIONS……………………………………………………………………………………………….6 LIST OF FIGURES AND TABLES…………………………………………………………………………..7 CONTENTS…………………………………………………………………………………………………….8 1 INTRODUCTION.................................................................................................................................10
1.1 ABOUT THE GUIDELINES __________________________________________________________ 10 1.2 STRUCTURE OF THE GUIDELINES____________________________________________________ 11 1.3 HOW TO USE THE GUIDELINES _____________________________________________________ 11 1.4 WHEN THE PROCESS IS COMPLETE__________________________________________________ 13
2 THE NEED FOR AN INDICATOR ......................................................................................................14 2.1 THE ENVIRONMENTAL CONTEXT ____________________________________________________ 14 2.2 NO MANAGEMENT WITHOUT MEASUREMENT ___________________________________________ 14 2.3 WHY ARE SHAREHOLDERS INTERESTED? _____________________________________________ 15 2.4 INDUSTRY'S CONTRIBUTION TO CLIMATE CHANGE________________________________________ 15
2.4.1 Electricity Consumption......................................................................................................................16 2.4.2 Energy Efficiency in Industry .............................................................................................................16 2.4.3 Transport-Related Emissions ..............................................................................................................16
2.5 THE STATE OF CLIMATE CHANGE REPORTING__________________________________________ 16 2.6 UPDATING THE GHG INDICATOR GUIDELINES __________________________________________ 18 2.7 CONCLUSION: SUMMARISING THE NEED FOR AN INDICATOR________________________________ 18
3 GETTING STARTED…A GHG INDICATOR FOR COMPANIES ......................................................19 3.1 THE BASIS FOR CALCULATING A GHG INDICATOR _______________________________________ 19 3.2 SETTING THE BOUNDARIES ________________________________________________________ 19
3.2.1 Defining the Boundaries of a Company ..............................................................................................19 3.3 INTRODUCING CONVERSION FACTORS________________________________________________ 20
3.3.1 Scope and Application of Conversion Factors ....................................................................................21 3.4 CARBON OFFSETS/SEQUESTRATION _________________________________________________ 21 3.5 ENERGY-RELATED GREENHOUSE GAS EMISSIONS ______________________________________ 21
3.5.1 Where to Obtain Data for Fuel Combustion and Electricity Consumption .........................................22 3.5.2 Combustion of Fuels ...........................................................................................................................22 3.5.3 Coal-Derived Emissions......................................................................................................................22 3.5.4 Combustion of all Fuels ......................................................................................................................22 3.5.5 Electrical Generation...........................................................................................................................23 3.5.6 Combined Heat and Power (CHP) ......................................................................................................23 3.5.7 Non-Carbon Dioxide Greenhouse Gases from Fuel Combustion .......................................................24
3.6 TRANSPORT-RELATED EMISSIONS __________________________________________________ 24 3.6.1 Where to Obtain Data on Transport Use .............................................................................................24 3.6.2 Road Vehicle Transport.......................................................................................................................24 3.6.3 Non-Road Transport............................................................................................................................25
3.7 PROCESS-RELATED EMISSIONS ____________________________________________________ 26 3.7.1 Where to Find Data on Process-Related Emissions ............................................................................26
3.8 AGGREGATION AND NORMALISATION OF THE GHG INDICATOR _____________________________ 27 3.8.1 Turnover ..............................................................................................................................................27 3.8.2 Added Value........................................................................................................................................28 3.8.3 Employees ...........................................................................................................................................28 3.8.4 Unit of Production...............................................................................................................................28 3.8.5 Summary of Normalisation .................................................................................................................28 3.8.6 Carbon Dioxide Over Time.................................................................................................................28
4 WORKSHEETS FOR THE CALCULATION OF A COMPANY'S GHG IMPACT..............................29 4.1 CO2 EMISSIONS FROM FUEL USE ___________________________________________________ 29 4.2 ELECTRICITY GENERATION ________________________________________________________ 30 4.3 COMBINED HEAT AND POWER (CHP) ________________________________________________ 31 4.4 ROAD TRANSPORT ______________________________________________________________ 32 4.5 UNIT. KILOMETRE TRANSPORT _____________________________________________________ 33 4.6 PROCESS RELATED GREENHOUSE GAS EMISSIONS _____________________________________ 34 4.7 TOTAL GLOBAL WARMING IMPACT IN CO2 EQUIVALENT ___________________________________ 35 4.8 NORMALISING CO2 POTENTIAL _____________________________________________________ 35 4.9 GHG PROFILE OVER TIME ________________________________________________________ 36

The GHG Indicator: UNEP Guidelines for Calculating GHG Emissions
9
5 RECOMMENDATIONS.......................................................................................................................37 6 FURTHER RESEARCH......................................................................................................................38
6.1 CONVERSION VALUES____________________________________________________________ 38 6.2 OUTSOURCING/BOUNDARY SETTING _________________________________________________ 38 6.3 WASTE EMISSIONS ______________________________________________________________ 38 6.4 IMPLICATIONS OF THE KYOTO PROTOCOL AGREEMENT ___________________________________ 39 6.5 LIFE CYCLE IMPACTS ____________________________________________________________ 39
7 BIBLIOGRAPHY.................................................................................................................................40 8 APPENDIX ..........................................................................................................................................43
8.1 EMISSIONS FROM FUEL USE _______________________________________________________ 43 8.1.1 Coal .....................................................................................................................................................44 8.1.2 Other Fuel Emissions ..........................................................................................................................44
8.2 ELECTRICITY-DERIVED CARBON DIOXIDE EMISSIONS ____________________________________ 45 8.3 COMBINED HEAT AND POWER______________________________________________________ 48
8.3.1 Do you IMPORT electricity or heat generated by CHP? ....................................................................48 8.3.2 Do you EXPORT some of the electricity or heat from your CHP?.....................................................48 8.3.3 EXPORTING electricity or heat from your CHP................................................................................49 8.3.4 IMPORTING electricity or heat generated by CHP............................................................................50 8.3.5 Your CHP Uses MORE THAN ONE FUEL.......................................................................................50
8.4 ROAD TRANSPORT ______________________________________________________________ 51 8.5 UNIT. KILOMETRE TRANSPORT _____________________________________________________ 52 8.6 PROCESS RELATED SECTORS______________________________________________________ 53 8.7 CONVERSION TABLES ____________________________________________________________ 54 8.8 CORPORATE ENVIRONMENTAL REPORTS SURVEYED FOR ORIGINAL INDICATOR (1997) ___________ 55 8.9 ANNEX 1 COUNTRIES TO THE KYOTO PROTOCOL _______________________________________ 56 8.10 CARBON OFFSETS/SEQUESTRATION _________________________________________________ 57
9 CONTACT DETAILS ..........................................................................................................................58 10 USEFUL INFORMATION ...................................................................................................................59 11 FEEDBACK FORM.............................................................................................................................60

The GHG Indicator: UNEP Guidelines for Calculating GHG Emissions
10
IINNTTRROODDUUCCTTIIOONN Climate change resulting from human activities is now recognised as one of the most pressing environmental issues facing the world’s population. In addressing this problem, governments, the international community and industry are moving to control emissions of greenhouse gases (GHGs), setting targets such as those agreed at the Kyoto Conference in 1997. These moves will continue in the future and, inevitably, businesses and other organisations will increasingly have to account for and report on GHG emissions. 1.1 About the Guidelines The purpose of "The GHG Indicator: UNEP Guidelines for Calculating Greenhouse Gas Emissions for Businesses and Non-Commercial Organisations" is to assist organisations in this accounting and reporting process. The guidelines provide a methodology whereby GHG emissions are calculated, then combined to give a single-figure GHG Indicator for an organisation's contribution to climate change. An essential characteristic of the method is that it uses information readily obtainable by companies. This data, expressed in commonly used "basic" units, can be converted and aggregated to calculate the total contribution to climate change. The indicator is applicable at all levels of a company regardless of size, from individual sites to lines of business, to the parent company. Governments are also encouraged to use the guidelines to develop their own country-specific methodologies, substituting national data for the generic international data provided. The data and the methodology employed could become an established basis for calculation of GHG indicators for all organisations world-wide. The guidelines are relevant to both developed and developing countries. Although the quantified reductions in GHG emissions fixed by international agreement apply only to the industrialised nations at present, such reductions may well be required of developing countries in the future. Companies and organisations that are readily able to quantify emissions will find it easier to enter into the Kyoto mechanism and will thus reap the rewards of early action. The usefulness of the GHG Indicator can be summarised in five ways:
!"It is a direct response to the Kyoto agreements. !"It enables countries or companies with little experience to engage in the GHG
accounting process, creating a common reporting platform. !"It encourages companies to think and act more environmentally. !"It anticipates measures that might be adopted by governments in response to Kyoto. !"It stimulates early action.
The GHG Indicator also allows for credible and comparable data inventories, which are essential for the implementation of the Kyoto Protocol.2
2 See “The Kyoto Protocol and Beyond: Potential Implications for the Insurance Industry”

The GHG Indicator: UNEP Guidelines for Calculating GHG Emissions
11
1.2 Structure of the Guidelines The major sections of the guidelines are summarised below: !"Section 1 introduces the indicator and explains how different types of readers may use it. !"Section 2 describes the background of global environmental concerns against which the
indicator has been developed, giving a clear explanation of its purpose and usefulness. The indicator is then set in its wider context by an examination of the overall contribution of industry to climate change, and a brief look at the present state of environmental reporting by companies.
!"Section 3 explains the methodology on which the indicator is based and takes the reader
through the rationale of the approach. This section will be especially useful to companies who do not fully understand why or how their climate change impact arises. For all readers, it provides a thorough preparation for use of the Worksheets in the following section. The important question of defining a company's boundaries, to establish exactly which emissions are to be included, is also discussed.
!"Section 4, – the "working" part of the guidelines – provides a step-by-step guide to
calculating a final figure for a company's emissions. The section consists of Worksheets and instructions for their use. Reference is made throughout to the document's appendices (Section 8) which provide technical information to support the tasks accomplished with the Worksheets.
!"Section 5 gives recommendations for further actions once the process is completed. !"Section 6 outlines some of the methodological barriers encountered at present and identifies
areas where future research must be directed. It is anticipated that feedback will ensure that the indicator constantly evolves and improves in accuracy. Users are invited to take part in this revision process by filling out the feedback form (Section 11) and returning it with their comments, either positive or negative.
Other sections provide additional sources of information and contacts. 1.3 How to Use the Guidelines The guidelines take a step-by-step approach to deriving the GHG Indicator, making them an ideal starting point for users who lack experience in this area. However, the "working" part of the document – a set of Worksheets with clear instructions for their use – is contained in a single section, allowing experienced users to go straight to the process of calculating emissions. Figure 1 shows the generic framework of the process and the information needed to derive the GHG Indicator.

The GHG Indicator: UNEP Guidelines for Calculating GHG Emissions
12
Figure 1: Summary of the Framework of the GHG Indicator
What to do… …For a Company Companies with existing knowledge and experience in implementing this type of indicator may want to skip Sections 2 and 3 and start using the Worksheets in Section 4 directly, referring back when necessary. However, all users are advised to look at Section 3.2, covering reporting boundaries, before proceeding. Companies with little or no experience should take time to go through the process systematically. It may take time to get some of the information required, but good quality data must be collected before trying to use the Worksheets. The IPCC guidelines on GHG Inventories (Section 10) have useful reference material for further study and form the basis for much of this work. Users should go through the Worksheets systematically, referring to the Appendices where necessary. Once completed, each Worksheet will give a single number in a box. Total GHG emissions are obtained by simply adding these numbers together. Section 4.3 should be ignored if the company does not use combined power and heat systems (CHP) or import electricity produced by CHP. …For a Government Governments may not have fully considered the implications of Kyoto or developed GHG accounting guidelines for companies and organisations within their jurisdiction. These guidelines can help to provide a simple methodology on which to base domestic guidelines for companies. They provide the structure and information needed; all governments have to do is to replace the generic international emission factors and conversion factors with appropriate national data. If Governments are included in Annex 1 of the Kyoto Protocol (see Appendix 8.9) they will already be reporting emissions at a national level and submitting this information to the UNFCCC. This UNFCCC data can be used to create national emission factors.
FUEL CONSUMPTION
ELECTRICITY USE
TRANSPORT FIGURES
PROCESS-RELATED EMISSIONS
GHG EMISSION FACTOR
TOTAL GHG
FUEL AND ENERGY DATA CONVERSION DATA

The GHG Indicator: UNEP Guidelines for Calculating GHG Emissions
13
However, the reporting format used for national submissions is unlikely to be suitable for company reporting. This is where the GHG Indicator can help. Countries not included in Annex 1, and which therefore do not submit data to the UNFCCC, can still adapt the guidelines for domestic use. Information on electricity emissions and the net calorific value (NCV) of coal should be available. Adopting the GHG Indicator methodology and adapting the guidelines to domestic conditions will assist in setting up domestic reporting systems. This can help companies to understand the impacts arising from their GHG emissions and to begin to reduce them, or at least to know the extent of their future liabilities. 1.4 When the Process is Complete When the GHG Indicator has been calculated it is important to report findings. Where possible, calculations should go back to 1990 (in line with Kyoto). Whether this is done as an internal exercise or for external stakeholders, it is very important to be open and honest about the assumptions made and boundaries used. For external communications the results can be reported in a number of ways including:
!"An additional section in the company annual report and accounts !"Feeding into existing company environmental or sustainability reports
!"Stand-alone reports on climate change and GHG emissions
For more information on environmental/sustainability reporting, see the GRI Guidelines (Section 10). These outline an initiative to standardise company reporting on environmental, social and financial issues, referred to as the ‘Triple Bottom Line’ approach. Finally, third-party review of the company’s emissions is beneficial, confirming that results are correct and credible. This can be done in the form of an independent verification of statements and data.

The GHG Indicator: UNEP Guidelines for Calculating GHG Emissions
14
2 THE NEED FOR AN INDICATOR 2.1 The Environmental Context Reporting in 1995, the Intergovernmental Panel on Climate Change's Working Group 13 concluded that “… the balance of evidence suggests that there is a discernible human influence on global climate."4 Things have not improved since then. In fact, concerns have increased and it is now widely predicted that increased temperatures would, globally, lead to more severe droughts and/or floods and the possibility of more extreme weather events. Rising sea levels would lead to the displacement of millions of people in low-lying delta areas and some small island states could be wiped out. Agriculture could be affected, with reduced production in areas where food supply is already deficient. Additional health problems may also arise with the ranges of animal species which are vectors for disease (e.g. mosquitoes) being increased. This could lead to vector-borne diseases such as malaria being re-introduced into areas from which they have been eradicated. In spite of these warnings, global emissions of carbon dioxide (CO2), the greenhouse gas responsible for most global warming, have increased over the last decade at an average annual rate of 1.3 per cent or nearly 300 million tonnes per year5. The process of controlling GHG emissions began when delegates at the 1992 Rio Earth Summit gave international recognition to the problems associated with climate change and signed the United Nations Framework Convention on Climate Change (UNFCCC). Subsequent meetings of the Parties to the Convention concluded that more needed to be done and firm targets were set at the third Conference of the Parties (COP 3), held in Kyoto, Japan, in December 1997. The Kyoto Protocol, which emerged from COP 3, is particularly important because the signatory parties committed for the first time to implementing quantified targets for GHG emission reductions. 2.2 No Management without Measurement Although the Kyoto Protocol indicates methods that might be used to achieve GHG reductions, it is left to individual countries to decide how they will use those mechanisms and what individual targets they will impose at the domestic or sector level. However, irrespective of the measures that countries choose to introduce, business will be required to play its part in reducing emissions. In this situation, companies will need to be able to measure their impacts if they are to manage them. By providing a pragmatic, precautionary approach to reducing GHG emissions, the GHG Indicator allows companies to meet this need. Furthermore, managing and reducing energy use and GHG emissions can be a catalyst to improved efficiencies and can pave the way to more environmentally benign energy technologies. Such reduction measures are therefore beneficial to long-term company success in their own right and should be supported by shareholders on their own merits. Many companies already recognise the importance of energy measures as a key indicator of their production efficiency and environmental impacts. It is now time to move towards a standard way of accounting for GHG emissions that has wide acceptance and can become a routine company reporting requirement world-wide. A standard reporting methodology would 3 The Intergovernmental Panel on Climate Change (IPCC) is the scientific body, made up of thousands of scientists,
that advises the UN Framework Convention on Climate Change (UNFCCC). It is an internationally respected expert panel. 4 IPCC Working Group 1 Report, 1995, pp. 11-12. 5 Global Environment Outlook, UNEP 1999, pp 25.

The GHG Indicator: UNEP Guidelines for Calculating GHG Emissions
15
improve market information flows, allow identification of companies with successful emissions reduction programmes and facilitate increased corporate awareness of climate change. 2.3 Why are Shareholders Interested? The proposal that companies should report on their GHG emissions is not just a matter of corporate responsibility towards an important global issue, it is also a matter of providing shareholders with adequate information about exposure to new costs as well as the advantages which can result from improved environmental performance. There are fears that costs are likely to arise from taxes and changing market conditions as measures to counter increased global warming are introduced. On the other hand, proof of a positive correlation between better environmental performance and share price would be a compelling reason for companies to invest in environmental improvements. For their part, investors are also beginning to look more carefully at companies' environmental performance (Blumberg et al. 1997). A growing body of work suggests that companies that rate highly on environmental criteria also provide better-than-average returns to shareholders, and that financial analysts and investors can improve their investment performance by analysing environmental value drivers (Hart and Ahuja 1996, Feldman et al., 1996, Cohen et al. 1995, Cordeiro and Sparks 1997). While these studies are building a case, they do so by assessing a range of environmental issues, not simply measures to abate global warming. A direct correlation between global warming abatement and financial performance has not been made, although it should be noted that companies frequently cite energy saving measures as good for the environment and the bottom line. The IRRC (1994) noted with its emissions efficiency index that it may have identified instances in which firms achieved some competitive advantage. Similarly EFFAS (1994) reported that energy efficiency measures can be regarded as a valuable indicator for the overall efficiency of a company. 2.4 Industry's contribution to climate change Industry accounts for a substantial proportion of GHG emissions. Emissions arise primarily from electricity and heat production, but also from industrial processes and transport use. In 1996, industry accounted for 22 per cent of CO2 emissions directly and a major proportion of the further 52 per cent attributed to transport and electricity supply (See Figure 2).
Figure 2: Sector Shares of Carbon Dioxide Emissions, 1996
32%
22%
20%
15%
11%
Public Electricity and HeatProduction
Manufacturing Industries andConstruction
Transport (incl. Bunkers)
Other Sectors
Miscellaneous
Source: IEA, 1998

The GHG Indicator: UNEP Guidelines for Calculating GHG Emissions
16
2.4.1 Electricity Consumption This is the single greatest contributor to the production of greenhouse gases. Emissions clearly depend on the energy mix and efficiency of the generating stations. Despite the increasing efficiency of some industries, projections for OECD and emerging nations show that industrial consumption of electricity is likely to increase overall. Table 1 reveals the scale of the problem.
Table 1: Total electricity consumption growth projections in billions of kilowatt-hours Region 1995 2000 2005 2010 2015 N. America 3604 3990 4360 4700 5068 Western Europe 2276 2730 3070 3420 3790 Industrialised Asia 1066 1320 1490 1648 1788 Former Communist Block 1530 1575 1744 1920 2070 Developing Asia 1730 2470 3250 4090 5070 S. America 560 680 830 970 1119
(Source: Morgan Grenfell, 1997)
2.4.2 Energy Efficiency in Industry The manufacturing sectors of industrialised countries grew, on average, at about 2.3 per cent per annum during the 1973-1988 period, while energy use decreased by about 1.2 per cent per annum (Schipper and Meyers, 1992). There is substantial evidence of energy efficiency gains in business. While this trend is encouraging and is expected to continue, the scale of industrialisation world-wide suggests that industry will remain a significant source of CO2 emissions. It should also be noted that the greatest savings have been in those industries where energy use is a substantial part of the cost of production. Other industries where this is not the case, such as the construction industry, are still highly inefficient even though the ongoing energy costs may be very high. 2.4.3 Transport-Related Emissions Historically, this source has grown faster than overall economic activity. Increase has occurred because the real prices for transport have fallen, there are more cars on the roads and improvements in fuel efficiency of vehicles have been counteracted by the increase in numbers of kilometres driven (Michaelis, 1996). Vehicle energy consumption accounts for 83 per cent of total transport energy consumption (EEA, 1996). Transport emissions are of particular importance since growth shows no signs of abating in the near future (EEA, 1996). Various future scenarios indicate that transport energy use may rise by 40-100 per cent in industrialised countries by 2025 (IPCC, 1996b). The increasing industrialisation of developing countries, leading to increases in car usage and ownership, is also a well-documented area of concern. Transport is a vital part of most industrial processes, indeed transport emissions may be the largest contributor to global warming for some service sector industries. Transport emissions must therefore be accounted for in the development of any company-based GHG Indicator. 2.5 The State of Climate Change Reporting As an initial part of the research for this indicator, a range of environmental reports were studied to assess the scale of company reporting and establish to what extent climate change was incorporated.

The GHG Indicator: UNEP Guidelines for Calculating GHG Emissions
17
Seventy-five corporate environmental reports were surveyed from UK and international companies for the first edition of the indicator. These reports6 were analysed against a series of criteria to produce quantitative results on the state of global warming reporting. The significant trends from the analysis were: !"Climate change was commonly reported as an issue of business concern (77 per
cent). !"53 per cent of companies were signatories of industry, national or international
environmental charters. !"44 per cent had their environmental information verified externally. !"Energy was the most commonly reported global warming issue (73 per cent) with
many companies reporting on typical fuels and amounts of fuels used. !"Transport results highlighted the poor reporting of quantitative data on fuel usage
and mileage: between 12 and 24 per cent of companies. !"Process-related emissions, although industry specific, were also poorly reported. The measurement of GHG and energy-related emissions is becoming a part of accounting for business. The principal limitation of current methodologies is the lack of a commonly agreed measurement protocol. Companies and organisations have been developing their own methodologies and the results are therefore idiosyncratic and have a limited use for benchmarking purposes. At best companies and shareholders can only ‘guestimate’ the success of emissions reductions policies relative to competitors. The fact that the UNEP GHG Indicator has been adapted by the DETR (UK) and received generous feedback leading to the demand for it to be updated shows that the field of climate change reporting is taking off. Since the publication of the DETR guidelines, approximately 50 companies in the UK and overseas have adopted them and are in the process of reporting on their findings. The KPMG International Survey of Environmental Reporting7, 1999, also shows that environmental reporting is on the increase in general. KPMG surveyed the Fortune 250 (top 250 companies in the world) and also the top 100 companies in 11 countries. The latest report shows that reporting increased from 13 per cent in 1993 to 24 per cent in 1999. Although the KPMG survey does not specifically look at climate change reporting, it does break down reporting into topics. Quantitative data on air emissions was reported more than any other topic. 75 per cent of companies surveyed reported quantitative data on their air emissions, up from 64 per cent in 1996. The overall message from the survey is that reporting is on the increase but there is still much improvement to be made. Heavy industry remains at the forefront of environmental reporting and banks and the financial sectors are lagging behind. The future of reporting lies in the verification of statements and the establishment of a universal approach to reporting. Section 10 gives some valuable sources of environmental reporting data, including links to the GRI, and other environmental reporting sites.
6 See Appendix 8.9 for a full list of environmental reports used. 7 KPMG, 1999, pg. 14

The GHG Indicator: UNEP Guidelines for Calculating GHG Emissions
18
2.6 Updating the GHG Indicator Guidelines UNEP intends to update these guidelines periodically in collaboration with WRI/WBCSD. The following websites will indicate the latest developments:
!"www.unep.ch !"www.ghgprotocol.org
The International Energy Agency has also offered to make electricity emission factors available on a regular basis, setting up a system to extract data relevant to the indicator when required. This will make updating international emission factors relatively easy. The feedback form in Section 11 will also be used to update and incorporate user feedback. 2.7 Conclusion: Summarising the Need for an Indicator Reacting to the increasing evidence of human influence on the Earth's climate through emissions of greenhouse gases, governments are increasingly fixing targets for their reduction. Industry, as a major source of greenhouse gases, will inevitably be affected by new emission-reduction requirements and will increasingly need to be able to account for its emissions. Although measurement of GHG emissions is becoming an accepted part of business accounting practice, and environmental reporting is increasing generally, there is no accepted standard measurement protocol for GHG emissions. Companies and organisations have developed their own methodologies producing results which have limited use for benchmarking purposes. It is therefore difficult for companies and shareholders to accurately assess the success of their emission-reduction policies in relation to those of competitors. It is clear that companies and other organisations now need a way to assess their own contribution to climate change in terms of GHG emissions, and that – on a wider scale – a standard method is needed to allow comparison of the effectiveness of measures and policies introduced at the organisational, national and international levels. These are the needs which the GHG Indicator addresses. By applying the methodology contained in these guidelines, individual companies and other interested organisations can derive GHG Indicators to quantify climate change impact. By adapting the guidelines to their own specific situations, governments and other institutions can use them to provide a widely accepted and established way of assessing such impacts.

The GHG Indicator: UNEP Guidelines for Calculating GHG Emissions
19
3 GETTING STARTED…A GHG INDICATOR FOR COMPANIES
This section describes the parameters and data requirements of the indicator. It looks at the different sources of GHG emissions and indicates where a company might obtain the data to calculate them. It provides an introduction to calculation of the GHG Indicator and some basic instruction for the Worksheets in the next section used to calculate GHG emissions. 3.1 The Basis for Calculating a GHG Indicator There are two main contributors to a company’s GHG emissions: energy-related emissions and process-related emissions. Together they represent a very high proportion of the global warming contribution of normal business activities. To derive the GHG Indicator, they are assessed and calculated separately, then aggregated. The aggregated GHG value is then normalised using a measure of business activity. Normalisation is essential as it this step which allows inter- and intra-company comparison. The methodology used to derive the GHG Indicator is based on fundamental research by the IPCC (1996a) for calculating the global warming potential of chemical species. The key to the model is the conversion of all relevant emissions to the IPCC reference gas (carbon dioxide); emissions are also referred to as carbon dioxide equivalents. To date, the IPCC work is the most scientifically and politically acceptable. It also allows for the combination of energy-related emissions and process-related emissions into a single metric. 3.2 Setting the Boundaries Defining a company’s boundary for the purposes of accounting for GHG emissions is notoriously difficult. Every company has a different structure. For instance, it may own or operate different sites; have equity shares in other operations; own subsidiary companies; and out-source varying amounts of business. For these reasons it is very difficult to create a single definition of a company that allows inter-company comparison. 3.2.1 Defining the Boundaries of a Company In spite of the difficulties involved, use of these guidelines requires some boundaries to be defined if any comparison of final results is to be meaningful. It is, however, accepted that a company using the guidelines will have to make some decisions as to what to include or exclude. These decisions must be made explicit. One approach is to set boundaries according to internationally accepted accounting practice8. This considers three main tiers of inter-company investment:
!"The holding company; !"Where a company owns a controlling interest in a subsidiary (where more than 50
percent of the shares are owned or where control is exercised); !"Any joint arrangement or operations that are proportionally consolidated.
8 This was the approach used for the first version of the Indicator (November, 1997).
“Defining the boundaries of responsibility is a difficult
matter.”
Graeme Castles, Business Development Manager, British Salt

The GHG Indicator: UNEP Guidelines for Calculating GHG Emissions
20
For consolidated accounts, parent companies should require subsidiaries, associate companies and other company investments to follow the same GHG reporting procedures. Using the above criteria is a useful way to define the boundaries for reporting emissions. However, the limitations of such accounting protocols can be seen when, for example, calculating emissions from travel activities, where it may or may not be possible to evaluate data from a travel agent, or fuel-use data from a fleet hire company. In these situations companies must strike a balance between the effort required to obtain this type of data and the overall impact of the particular activity. Where companies own stakes in other businesses but are not in day-to-day control they can, as a shareholder of that operation, exert influence to make operators account for GHG emissions. Even if operators do not agree to a full inventory of emissions, they can make data available so that the shareholding company can calculate its equity share of emissions. This type of structure is common in the oil and gas industry. For example, The BP-Amoco Carbon Dioxide Protocol treats emissions in this way, accounting for the company's share of all operations even where it is not an operator. In conclusion, a company using the indicator should report on all operations that fall within the following boundaries, using the same GHG procedure for all sites:
!"The holding company !"Where a company owns an interest or equity share in a subsidiary, no matter how small !"Any joint arrangement or operations that are proportionally consolidated.
Summary Boundary setting is extremely difficult and can lead to misinterpretation of results unless it is very explicit. Whatever the company chooses to include or leave out should therefore be stated in an accompanying paragraph or section in any resulting report. The assumptions used in estimating companies' GHG emissions must be made public so that informed comparisons can be made and results properly understood. 3.3 Introducing Conversion Factors Conversion factors, used to convert all relevant emissions to the IPCC reference gas, carbon dioxide, are critical to the calculation of the GHG Indicator as global warming impacts arise from a range of gaseous emissions. The assumptions underlying conversion factors are of paramount importance for wide acceptance. Extensive research was undertaken to source and calculate conversion factors that are both reasonable and fair. The GHG Indicator uses internationally accepted reporting procedures and conversion factors already being applied at a regional, national or international level by companies and other organisations. As a result of a decision at the first Conference of the Parties (COP-1)9, it was stated that the IPCC Guidelines for National Greenhouse Gas Inventories “should be used by Annex 1 countries in preparing their national communications pursuant to the Convention”. In so far as the methodology is applicable to companies, these guidelines have been applied for calculation of the GHG Indicator.
9 Decision 4/CP.1, COP 1, Berlin 1995.
“The big problem is making sure you are
comparing like with like.”
Julian Salt, Loss Prevention Council

The GHG Indicator: UNEP Guidelines for Calculating GHG Emissions
21
The ‘References Approach’ defined by the IPCC (IPCC, 1996a) was adopted. This predicts the potency of a greenhouse gas based on an activity statistic. It is a simple procedure requiring relatively little data and lending itself to widespread application as it provides a ‘common denominator’.
Table 2: Conversion value references Sources of greenhouse gas emissions Conversion value references Static energy related emissions #"IPCC
#"OECD #"IEA #"DETR
Mobile energy related emissions #"INFRAS #"IPCC #"DETR
Process related emissions #"IPCC
In producing an indicator that is applicable internationally, certain assumptions have been made and the guidelines obviously have to use average figures on occasion. It is therefore suggested that users apply national conversion factors where possible. If more accurate values are known, these should be substituted. While every endeavour has been made to ensure accuracy of the conversion values in these guidelines, it is in the nature of such values to alter with time. The indicator will be periodically updated to reflect these changes and this should be borne in mind. 3.3.1 Scope and Application of Conversion Factors All conversion factors require the input of data expressed in basic units (e.g. tonnes for coal or kilowatt-hours for electricity, etc.). Standardised conversion tables, provided in Appendix 8.7, allow conversion from other units into these basic units. The conversion factors have been selected to facilitate transboundary application of the indicator, geographically and across different business activities. Where possible, conversion factors have been given for individual countries and activities. Where this was not possible default values have been used. 3.4 Carbon Offsets/Sequestration Some companies are adopting the idea of offsetting GHG emissions by planting trees in another country or storing CO2 in some other way. However, there are problems with such solutions and they are not included in these guidelines. Readers interested in the arguments that led the authors to exclude them should refer to Appendix 8.10. 3.5 Energy-Related Greenhouse Gas Emissions The combustion of fossil fuels is the most significant source of global anthropogenic GHG emissions. At a corporate level, energy-related emissions are often the most significant. Calculating energy-related GHG emissions encompasses many areas of a company’s activities. The calculation can be summarised as follows10:
!"Direct combustion of fuels (Including both primary and secondary fuels11).
10 Companies involved in the generation of energy (e.g. combined heat and power) should include fuel consumption at this stage. See Appendix 8.3 for further instruction 11
Primary Fuel Coal, Natural Gas Secondary Fuel Refined Petroleum products

The GHG Indicator: UNEP Guidelines for Calculating GHG Emissions
22
Some methodologies split fuel use into primary and secondary fuels. However, to keep calculations simple, all fuels are combined in these guidelines. Most companies using the indicator will probably treat fuel in a similar way, not distinguishing between primary and secondary fuels, unless using them as part of a process. 3.5.1 Where to Obtain Data for Fuel Combustion and Electricity Consumption Users may need advice on where to obtain the sort of data they need to calculate their company's GHG impact. The following list indicates sources of information for calculating emissions from fuel use. Accounts or administration departments should have this information; alternatively, it might be held by individual managers. #"Utility provider #"Electricity bills #"Invoices for fuel deliveries #"Meter readings (estimated from invoices if meter readings are not available) #"Gas bills #"Pipeline measurements #"Energy management software 3.5.2 Combustion of Fuels To calculate GHG emissions from the combustion of fuels, these guidelines make use of an activity statistic (e.g. annual fuel consumption in tonnes) and an emission factor (tonnes of CO2 per tonne of fuel combusted). For the purposes of these guidelines, emission factors give values in tonnes of CO2, rather than in kilograms. 3.5.3 Coal-Derived Emissions Emissions from coal vary according to the net calorific value (NCV) of the fuel. This varies from one type of coal to another and therefore varies from country to country or region to region. Appendix 8.1 gives emission factors for as many countries as possible. If a relevant value is found for a particular country, it should be used. If not, the default value for coal, given in Table 3, should be used. 3.5.4 Combustion of all Fuels Carbon dioxide emissions from the most frequently used fuels, including coal, are shown below (Table 3). For the full calculation procedure of CO2 emission factors see Appendix 8.1. Combustion of fuels does not include combustion of mobile fuel sources (from vehicle use etc.), as these are incorporated in the transport calculations. Table 3 gives the emission factors for different fuels that a company might use. The emission factors are given for different units, to aid interpretation. Users should be able to find appropriate fuel consumption data in one of the units below. Once this is done, fuel consumption is multiplied by the appropriate factor. Worksheet 4.1 goes through this process step by step.

The GHG Indicator: UNEP Guidelines for Calculating GHG Emissions
23
Table 3: Default carbon dioxide emissions from fuels
Refined Petroleum Products tCO2/ therm
tCO2/ litre
tCO2/ KWh
tCO2/ tonne
COAL (DEFAULT) 0.0003413 1.84 Gasoline 0.00222 0.0002496 3.07 Natural Gas 0.005919 0.0002020 2.93 Gas/ Diesel Oil 0.00268 0.0002667 3.19 Residual Fuel Oil 0.00300 0.0002786 3.08 LPG 0.006654 0.00165 0.0002271 2.95 Jet Kerosene 0.00258 0.0002575 3.17 Shale oil 0.0002218 2.61 Ethane 0.0002641 2.90 Naphtha 0.00224 0.0002905 3.27 Bitumen 0.0002641 3.21 Lubricants 0.00263 0.0003631 2.92 Petroleum Coke 0.0002641 3.09 Refinery Feedstock 0.0002641 3.25 Refinery Gas 0.007041 0.0002403 2.92 Other Oil Products 0.00254 0.0002641 2.92
3.5.5 Electrical Generation Carbon dioxide emissions derived from the consumption of publicly produced electricity are the single highest source of emissions for many industries. Emission levels from publicly generated electricity are highly dependent on the national energy mix used to produce the electricity. For an additional explanation see Appendix 8.2, which gives a complete list of emission factors for electricity usage by country, calculated using IEA data. If government data on electricity emission factors are available, they should be used. 3.5.6 Combined Heat and Power (CHP) CHP is becoming an efficient and cost-effective way of producing electricity and heat on site. In some situations benefit can also be gained from exporting excess electricity and heat to local heating schemes or to national grids. There are two ways of dealing with emissions from CHP plants in calculating the GHG Indicator. A: If all the electricity and heat from CHP is generated and used on site, the method for calculation of emissions from fuel combustion, described in Section 3.5, should be used. The fuel used for CHP should then be included in Worksheet 4.1. B: When electricity or heat is exported for economic or social reasons, the exporting company is not accountable for the associated emissions. Such emissions will be accounted for by the user of the electricity or heat. The emissions corresponding to the amount of electricity or heat exported should be calculated and should then be deducted from the emissions total. A full explanation of how to account for CHP is given in Appendix 8.3. If electricity or heat from a CHP plant is imported, refer to Appendix 8.3.4. If more than one fuel is used for CHP, refer to Appendix 8.3.5.

The GHG Indicator: UNEP Guidelines for Calculating GHG Emissions
24
3.5.7 Non-Carbon Dioxide Greenhouse Gases from Fuel Combustion Non-carbon dioxide greenhouse gases generated by fuel combustion are mainly methane (CH4) and nitrous oxide (N2O). Emissions of these gases are difficult to quantify but, according to IPCC, their warming contribution is probably minor compared to that of carbon dioxide (IPCC, 1996a). Rough estimates of CH4 and N2O contributions from the combustion of coal, natural gas and oil were calculated to be in the region of 1 per cent. Further research will need to be channelled towards this issue. The GHG Indicator's authors will monitor developments in this area.
3.6 Transport-Related Emissions Emissions from transport are broken down by transport mode. Based on data that a company might reasonably be expected to collect, these guidelines consider: !"Road Vehicle transport !"Non-Road transport Transport data should include all transport by the company for official business activities and should cover transportation of goods and company personnel by all transport modes covered below. Transport data for commuting to the work place should not be included in the calculation. Non-carbon dioxide emissions from transport have not been included for the reasons mentioned in 3.5.7, namely that emissions of gases like N2O and CH4 are very difficult to quantify and their effect on climate change is thought to be much less than that of CO2. 3.6.1 Where to Obtain Data on Transport Use Transport data are generally much harder to obtain than fuel data because they are not always kept in house and are handled externally. However, as indicated by the list below, there are potential sources for such data. For companies that tend to use one particular travel agent for business travel, the agent should have records of all the bookings made. Car rental companies should keep records of cars hired or leased and their mileage. Company accounts departments should also have records of claims by employees for mileage travelled in their own vehicles. Potential sources are: #"Fleet records and invoices #"Employee mileage calculations/claims #"Information from car rental firms #"Tax returns from declarations and fleet monitoring records #"Travel agency invoices and records #"Freight handler invoices #"Company vehicle log books 3.6.2 Road Vehicle Transport Calculating road vehicle emissions is complex, primarily because any one company may use many modes of transport. For the purposes of the GHG Indicator, road vehicle transport is defined as the personnel and freight transport carried out by a company. It should be calculated using total fuel consumption. This avoids the need for data on the different types of vehicles

The GHG Indicator: UNEP Guidelines for Calculating GHG Emissions
25
(cars, LGVs or HGVs) and on the mileage for each category. Since emission levels and fuel consumption tend to vary in parallel − e.g. vehicles with high emission rates also tend to have high fuel consumption and vice-versa (IPCC, 1996a) − calculation based on total fuel consumption was selected. Carbon dioxide emissions were then calculated using default conversion rates12. Emissions from the consumption of three major transport fuels were calculated and are presented in Table 4.
Table 4: CO2 emissions (in tCO2/litre) for petrol, diesel, and liquefied petroleum gas Fuel type CO2 emissions/ fuel type (tCO2/litre) Petrol 0.00222 Diesel 0.00268 LPG 0.00165
Source: DETR, 1999 See Appendix 8.4 for more details Companies frequently rent transport for employees. As this can make a significant contribution to total transport, it is included here. The nature of rented transport makes it difficult to calculate the consumption of specific fuel types. Vehicle kilometre calculations are therefore applied in this instance (Table 5). For more comprehensive calculations see Appendix 8.5.
Table 5: Emission factors for vehicles Transport CO2 Emission Factor tCO2/kilometre tCO2/mile Average Petrol Car13
0.000185 0.000299
Average Diesel Car
0.000156 0.000251
HGV 0.000782 0.00126
Source: INFRAS, 1999 3.6.3 Non-Road Transport Non-road transport requires a different calculation method because of the difficulties in directly attributing a quantitative measure of fuel consumed. For example, it is difficult to determine the amount of fuel used for an individual employee taking an airline flight. An alternative method is to calculate the emissions per transport mode per kilometre. Data from INFRAS (INFRAS, 1995) were used, based on the group’s considerable experience and its data for many transport modes. Data were also provided by the DETR which has undertaken extensive research into emissions from air travel. The emission values (given in Tables 6 and 7) are based on European conditions, provided by INFRAS and the DETR.
Table 6: Emission factors for different passenger transport modes Transport Mode Basis Emission factor for carbon dioxide (tCO2/ P.km)
Air- short haul14 Person.kilometre 0.00018 Air- long haul15 Person.kilometre 0.00011 Train16 Person.kilometre 0.000034
(INFRAS, 1995;DETR, 1999)
12
Values were calculated using default IPCC values as previous. 13 Based on INFRAS data, refer to Appendix 8.5 14
Average distance of 500 km. 15 Average distance of 6495 km. 16
Average length of train 9.8 wagons with occupancy of 31%.

The GHG Indicator: UNEP Guidelines for Calculating GHG Emissions
26
Table 7: Emission factors for different freight transport modes Transport Mode Basis Emission factor for carbon dioxide (tCO2/
T.km) Air Freight Short haul17 Tonne.kilometre 0.000158 Air Freight Long haul18 Tonne.kilometre 0.000570 Train Freight19 Tonne.kilometre 0.000047 Inland shipping20 Tonne.kilometre 0.000035 Marine shipping21 Tonne.kilometre 0.000010
(INFRAS, 1995, DETR, 1999) 3.7 Process-Related Emissions Process-related emissions are those greenhouse gases emitted from non-energy-related sources. Their main sources are industrial production processes that transform materials chemically or physically. Industrial processes can result in the generation of a wide variety of greenhouse gases. Common industrial processes that result in the production of greenhouse gases have been assessed and default emission values have been calculated by the IPCC. A summary of industrial sectors most involved in process-related greenhouse GHG emissions is provided in Appendix 8.6. Emissions from industrial processes are estimated as the potential emissions of greenhouse gases produced by a company that it is assumed will eventually be emitted to the atmosphere over a period of time. Production of process-related greenhouse gases must be reported in tonnes and converted to carbon dioxide equivalents. This is done using the global warming potential (GWP) for a 100-year time horizon22 as a conversion factor. These values are given in Table 8. 3.7.1 Where to Find Data on Process-Related Emissions #"In European countries, companies may already be measuring their emissions from specific
processes under the EU IPPC Directive or national regulations, or may be setting up the infrastructure to do so.
#"Countries outside the EU may have similar regulations governing prescribed processes and sites that require emissions monitoring.
#"National Environmental Protection Agencies or similar institutions may also have records.
17
Average distance of 457 km 18
Average distance of 6342 km 19 Average length of 27 wagons with 49% capacity. 20
Average tonnage capacity of ~2500 tonnes. 21Average tonnage capacity of 51500 tonnes 22
The IPCC publish conversion values for chemical species in three separate time horizons (20, 100 and 500 years). It was decided that a time horizon of 100 years was most suitable for the indicator. This decision was based on indicators already using or applying IPCC GWP data, such as ETSU (1995), ICI (1997) and Dobes (1995), and based on the requirements of the Kyoto Protocol which stipulates that the 100-year time horizon should be used.

The GHG Indicator: UNEP Guidelines for Calculating GHG Emissions
27
Table 8: Summary of global warming potentials (GWP)
Trace Gas GWP Trace Gas GWP Carbon Dioxide 1 HFC-143a 3800 CCl 4 1300 HFC-152a 140 CFC- 11 3400 HFC-227ea 2900 CFC-113 4500 HFC-23 9800 CFC-116 >6200 HFC-236fa 6300 CFC-12 7100 HFC-245ca 560 CFC-l 14 7000 HFC-32 650 CFC-l 15 7000 HFC-41 150 Chloroform 4 HFC-43-lOmee 1,300 HCFC- 123 90 Methane 21 HCFC- 124 430 Methylenechloride 9 HCFC-141b 580 Nitrous Oxide 310 HCFC-142b 1600 Perfluorobutane 7000 HCFC-22 1600 Perfluorocyclobutane 8700 HFC- 125 2800 Perfluoroethane 9200 HFC-134 1,000 Sulphur hexafluoride 23900 HFC-134a 1300 Trifluoroiodomethane <1 HFC-143 300
Source: IPCC 1990 & 1996
3.8 Aggregation and Normalisation of the GHG Indicator The most common form of normalised measure is one that relates an environmental measure (e.g. aggregated emissions, energy use) to a measure of business activity (e.g. production, value added or turnover) (James and Bennett 1994). Normalised measures are critical in the production of environmental indicators since they screen out noise from factors such as changing levels of output and focus on the critical relationships (James and Bennett 1994). They also allow industry comparisons to be made. A study by Belmanesh, Roque & Allen (1993) compared the ranking of American Standard Industrial Classification (SIC) sectors according to different denominators, ranging from value added to number of employees. The results suggested that, although in most cases normalisation does not change the overall performance ranking of industries, in some cases performance varies greatly depending on the normalisation factor used. The study concluded that it was not possible to compare performance using a single normalisation measure. This seems to indicate that each industry sector has its own peculiarities and that normalisation measures must be sector-sensitive. Aggregation involves the summation of the energy- and transport-related carbon dioxide emissions with the process-related CO2 equivalent emissions. In the case of the indicator this is straightforward because carbon dioxide equivalents are used throughout and simple addition of totals in the Worksheets gives the aggregated figure. For normalisation, four denominators were selected as being appropriate for measuring company activity with regard to GHG emissions: turnover, added value, employees, and unit of production. 3.8.1 Turnover Turnover (also referred to as sales) represents the total value of goods and services sold by the company to third parties in the normal course of trade. Turnover as a denominator is a summation of the whole value of a product or a service up to the point of sale. Unit turnover has the advantage of being an obligatory requirement for annual accounts. Thus, for

The GHG Indicator: UNEP Guidelines for Calculating GHG Emissions
28
widespread application by companies, unit turnover is an attractive denominator. However, turnover does not permit inter-sector benchmarking because it does not directly correlate to global warming contribution. On the other hand, turnover may allow intra-sector comparison of companies with similar profiles and production processes. 3.8.2 Added Value In the 1970’s, some companies produced statements focusing on value added for a given period, i.e. sales value minus the costs of bought-in goods and services, including those relating to administrative overheads. These statements showed how much of the added value was distributed to employees as salaries etc., how much to the community via taxes, how much to the providers of capital, and how much was needed to be retained in the business for maintenance or expansion. Value added was considered more socially orientated and was proposed in contrast to profit. The problem with using added value statements as a basis for normalisation is that there are no accepted accounting practices. However, some companies have recently applied a version of this type of added value calculation. 3.8.3 Employees An Employee denominator is quite simply the number of employees under contract and directly employed by a company. The number of employees is included as a denominator because of its current use and also its applicability to industry sectors in which added value and unit turnover have limited value (e.g. the banking sector). 3.8.4 Unit of Production Finally, a product, or unit of production, denominator can be used for manufacturing companies. The ability to relate GHG emissions to product output can aid comparison between similar sectors of manufacturing. For example, energy-related CO2 emissions become part of the ‘overheads’ associated with a unit of output and can be seen as having a direct influence on the bottom line. 3.8.5 Summary of Normalisation Research has confirmed the complexity of normalising data satisfactorily. A normalising denominator should be flexible and widely applicable. In the light of these characteristics no single normalising value of unit turnover was chosen for these guidelines, since all the proposed denominators are easily applicable and have relevance to different target audiences. All the normalising values must be calculated under the same framework for consolidation as the GHG data. 3.8.6 Carbon Dioxide Over Time Along with the normalising factors above, perhaps the best measure of performance is measuring GHG emissions over time. This simple approach allows a comparison to be made year by year and a profile to be created. Worksheet 4.9 shows this in more detail.

The GHG Indicator: UNEP Guidelines for Calculating GHG Emissions
29
4 WORKSHEETS FOR THE CALCULATION OF A COMPANY'S GHG IMPACT IF YOU CAN’T FIND THE RIGHT UNITS, SECTION 8.7 HAS CONVERSION TABLES THAT MIGHT HELP 4.1 CO2 Emissions from Fuel Use
Emission factors $
Basic unit %
Fuel Types &
Therms Litres KWh Tonnes
""""""""
X tCO2/ therm
tCO2/ litre
tCO2/ kWh
tCO2/ Tonne
=
Amount of carbon dioxide released
(t) '
Coal & & 0.0003413 1.8423 = Petrol & & 0.00222 0.0002496 3.07 = Natural Gas & & 0.005919 0.0002020 2.93 = Gas/ Diesel Oil & & 0.00268 0.0002667 3.19 = Residual Fuel Oil & & 0.00300 0.0002786 3.08 = LPG & & 0.006654 0.00165 0.0002271 2.95 = Jet Kerosene & & 0.00258 0.0002575 3.17 = Shale oil & & 0.0002218 2.61 = Ethane & & 0.0002641 2.90 = Naphtha & & 0.00224 0.0002905 3.27 = Bitumen & & 0.0002641 3.21 = Lubricants & & 0.00263 0.0003631 2.92 = Petroleum Coke & & 0.0002641 3.09 = Refinery Feedstock & & 0.0002641 3.25 = Refinery Gas & & 0.007041 0.0002403 2.92 = Other Oil Products & & 0.00254 0.0002641 2.92 = Total & & =
23 Refer to Appendix 8 for specific country emission factors for coal. The default value above should only be used if your country is not listed.
Step 1: Enter your fuel use for each fuel in the units you have available in Column 1. Step 2: Multiply the figures in Column 1 by theappropriate emission factor in Column 2. Step 3: Enter each total in Column 3. Step 4: Add up the totals in Column 3 and enter at the bottom of column.

The GHG Indicator: UNEP Guidelines for Calculating GHG Emissions
30
4.2 Electricity Generation Do not include electricity your company has generated from CHP: this is incorporated in Worksheet 4.3. If you import electricity that is produced by a public CHP scheme, use this Worksheet.
Country
& Basic units (kWh) %%%%
X CO2 EF (tCO2/kWh)
$$$$
= Total CO2 From Electricity Use (tCO2)
'
& X =
& X
=
& X
=
Step 1 Enter the amount of electricity used (in kWh) in Column 1. If you are calculating CO2 for more than one country, use the available rows. Step 2 Find your country in Table 12, Appendix 8.2 and insert the relevant CO2 Emission factor for your Country in Column 2. Step 3 Multiply Column 1 by Column 2 and insert the total in Column 3. This is your total for CO2 from electricity.

The GHG Indicator: UNEP Guidelines for Calculating GHG Emissions
31
4.3 Combined Heat and Power (CHP) If you import, export or produce your own electricity or heat from CHP, use the appropriate calculation methods from Appendix 8.3 and then enter the totals in the boxes below. N.B. You will have only one figure in this table unless you are calculating an indicator for multiple sites.
CO2 FROM IMPORTED CHP
%
CO2 FROM OWN USE MINUS EXPORTED CO2
$
CO2 FROM OWN USE OF CHP '

The GHG Indicator: UNEP Guidelines for Calculating GHG Emissions
32
4.4 Road Transport
Fuel type """" Basic units (litres) %
X Total CO2 emissions/ fuel
type (tCO2/litre) $
= Amount of carbon dioxide released (t)
' Petrol &" & 0.00222 & Diesel & & 0.00268 & LPG & & 0.00165 & Total " "
Step 1: Enter fuel use (in litres) in Column 1. Step 2: Multiply Column 1 entries by Column 2 conversion factors. Step 3: Enter total in Column 3. Add up all totals in Column 3 and enter at bottom of Column 3.

The GHG Indicator: UNEP Guidelines for Calculating GHG Emissions
33
4.5 Unit. Kilometre Transport
Transport Mode
Units Basic Units
(P.km24 or T.km25) %
Basic Units (P.mile26 or
T.mile27) $ """"
X CO2EF (tCO2/ km)
"'"
CO2EF (tCO2/ mile)
!("
= Amount of carbon dioxide
released (t) )
Petrol Km/mile " X 0.000185 0.000299 = Car Diesel Km/mile " X 0.000156 0.000251 =
HGV Km/mile " X 0.000782 0.00126 = Air- short haul P.km/mile " X 0.00018 0.000290 = Air- long haul P.km/mile " X 0.00011 0.000177 = Train t.km/mile " X 0.000034 0.000055 =
Short t.km/mile " X 0.00158 0.00254 = Air Freight Long t.km/mile " X 0.00057 0.000917 = Train Freight t.km/mile " X 0.000047 0.000757 = Inland shipping P.km/mile " X 0.000035 0.000056 = Marine shipping P.km/mile " X 0.000010 0.000016 =
Total X =
24 Passenger.kilometre 25 Tonne.kilometre 26 Passenger. mile 27 Tonne. mile
Step 1: Enter person/tonnage km in Column 1 or miles in Column 2. Step 2: Multiply Column 1 or Column 2 by appropriate conversion factor in Column 3 or 4. Step 3: Enter total in Column 5. Add up all figures in Column 5 and enter at bottom of Column.

The GHG Indicator: UNEP Guidelines for Calculating GHG Emissions
34
4.6 Process Related Greenhouse Gas Emissions Trace Gas & BASIC UNIT
(T) %X Conversion Values (GWP, 100 year
horizon) $ = CO2 equivalents (t)"'
Carbon dioxide &" X 1 CCl 4 & X 1300 = CFC- 11 & X 3400 = CFC-113 & X 4500 = CFC-116 & X >6200 = CFC-12 & X 7100 = CFC-l 14 & X 7000 = CFC-l 15 & X 7000 = Chloroform & X 4 = HCFC- 123 & X 90 = HCFC- 124 & X 430 = HCFC-141b & X 580 = HCFC-142b & X 1600 = HCFC-22 & X 1600 = HFC- 125 & X 2800 = HFC-134 & X 1,000 = HFC-134a & X 1300 = HFC-143 & X 300 = HFC-143a & X 3800 = HFC-152a & X 140 = HFC-227ea & X 2900 = HFC-23 & X 9800 = HFC-236fa & X 6300 = HFC-245ca & X 560 = HFC-32 & X 650 = HFC-41 & X 150 = HFC-43-lOmee & X 1,300 = Methane & X 21 = Methylenechloride & X 9 = Nitrous oxide & X 310 = Perfluorobutane & X 7000 = Perfluorocyclobutane & X 8700 = Perfluoroethane & X 9200 = Sulphur hexafluoride & X 23900 = Trifluoroiodomethane & X <1 = Total & X =
Step 1: Check the table in Appendix 8.6 to see if you are likely to have process-related emissions, although this should be known. Step 2: Enter emissions (in tonnes) in Column 1. (Do not include the CO2 that you have been calculating for the Indicator.) Step 3: Multiply Column 1 by Column 2 GWP’s. Step 4: Enter the results in Column 3. Add up Column 3 and enter the total at the bottom of the Column.
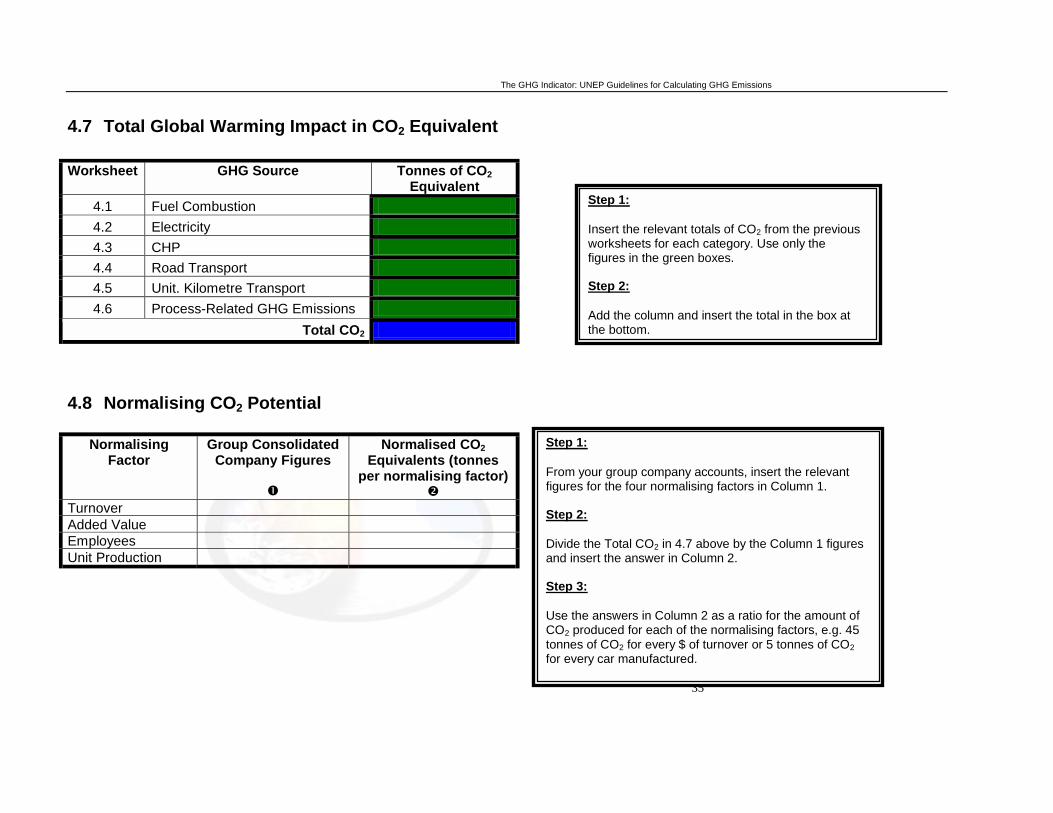
The GHG Indicator: UNEP Guidelines for Calculating GHG Emissions
35
4.7 Total Global Warming Impact in CO2 Equivalent
4.8 Normalising CO2 Potential
Normalising Factor
Group Consolidated Company Figures
"%
Normalised CO2 Equivalents (tonnes
per normalising factor) $
Turnover Added Value Employees Unit Production
Worksheet GHG Source Tonnes of CO2 Equivalent
4.1 Fuel Combustion
4.2 Electricity
4.3 CHP
4.4 Road Transport
4.5 Unit. Kilometre Transport
4.6 Process-Related GHG Emissions
Total CO2
Step 1: Insert the relevant totals of CO2 from the previous worksheets for each category. Use only the figures in the green boxes. Step 2: Add the column and insert the total in the box at the bottom.
Step 1: From your group company accounts, insert the relevant figures for the four normalising factors in Column 1. Step 2: Divide the Total CO2 in 4.7 above by the Column 1 figures and insert the answer in Column 2. Step 3: Use the answers in Column 2 as a ratio for the amount of CO2 produced for each of the normalising factors, e.g. 45 tonnes of CO2 for every $ of turnover or 5 tonnes of CO2 for every car manufactured.

The GHG Indicator: UNEP Guidelines for Calculating GHG Emissions
36
4.9 GHG Profile Over Time Year Tonnes of CO2 Equivalent % Change 1990 1991 1992 1993 1994 1995 1996 1997 1998 1999 2000
Step 1 Insert totals for CO2 for every year you have calculated in the first column. Step 2 You can then work out the percentage change between years and insert it in the second column. Step 3 Using a suitable spreadsheet programme, create a graph similar to that above using the data from the table above.
02000400060008000
1000012000140001600018000
1990 1992 1994 1996 1998 2000
CO2

The GHG Indicator: UNEP Guidelines for Calculating GHG Emissions
37
5 RECOMMENDATIONS When you have worked through the calculations and derived the GHG Indicator, certain actions are recommended to ensure that the company benefits fully from the exercise. These are listed in the table below.
INDICATOR ISSUES AND CONCLUSIONS
WHAT NOW
GHG The GHG Indicator gives a single value for emissions for the current year and should be calculated as far back (to 1990) as possible. These figures should be normalised.
There are ways to present the results of findings:
!"Annual Report !"Sustainability Report !"Environmental Report !"Climate Change Report !"In-house report
An in house report would be the bottom rung of accountability and a sustainability report on environmental, social and business issues would be at the top.
Boundaries The limits placed on the reporting framework for the Indicator: are outsourced activities included? What level of transport has been included? Are subsidiaries and so on included? Assumptions The assumptions made when using the indicator Worksheets. Were users' own conversion or emission factors used?
Along with the reporting medium chosen, there needs to be a statement of the boundaries and assumptions used for the indicator. There needs to be a clear description of what has been included and left out. This is probably the most important part of the reporting format because it enables informed comparisons to be made and allows the framework of results to be understood. If results are to be transparent and verifiable, the boundaries and assumptions made must be disclosed.
Acting on findings The calculation process may indicate areas where emissions are high or efficiencies are low.
*"*"*"*"*"*"*"*"*"*"*"*"*"*"*"*"*"*"*"*"*"*"*"*"*"*"*"*"*"*"*"*"*"*"*
Action must now be taken to reduce emissions and increase efficiency. Increasing efficiency on site and in processes is probably the first way of reducing emissions. After that, looking into the Kyoto mechanisms, CDM, JI and Emissions Trading, may be considered.

The GHG Indicator: UNEP Guidelines for Calculating GHG Emissions
38
6 FURTHER RESEARCH The GHG Indicator methodology in these guidelines provides a solid and practical starting point. However, further research is required to improve accuracy and usefulness of the indicator. There are some issues that the guidelines might have included but where current knowledge is limited; inclusion would have diverted the guidelines from their original aim of providing a simple methodology. This is where other initiatives like the WRI/WBCSD approach and the DETR document will play their part and can be used in conjunction with these guidelines. Some of the issues that warrant further research are discussed below. 6.1 Conversion Values Research on GHG emissions may give rise to new conversion values that are more appropriate for the indicator. Particular attention should be given to the fuel mixes used in electricity generation. These are continually shifting within countries as a result of government policies and fluctuation in fuel prices. Shifts in conversion values are expected to occur and must be accounted for. Emissions from transport are also unique to domestic conditions. More research is therefore required at the domestic level to produce reliable figures for emissions from transport. 6.2 Outsourcing/Boundary Setting In the case of outsourcing, significant discrepancies can arise because the global warming impacts of the outsourced activity will not be accounted for, whereas the financial costs and benefits will be included in the consolidated accounts. Until clearer rules are established, companies have a duty to indicate the extent of outsourced activities and should include as many of their operations as possible. 6.3 Waste Emissions The generation of waste by companies can lead to the production of highly potent greenhouse gases (CO2 and in particular methane (CH4)). Disposal and treatment of waste is possible through landfilling, recycling and incineration of solid wastes. Liquid wastes are mainly disposed of through wastewater treatment. The major reasons why waste has not been included in this indicator are the complexity of the question and the potential for error arising from attempts to create simple default values. Further research into the potential global warming contribution from waste would make the indicator more accurate, especially for industries noted for high levels of organic waste such as food production industries and industries involved in pulp and paper, and starch and textile manufacturing. CH4 is recognised as the most important greenhouse gas produced through waste. Approximately 5-20 per cent (IPCC, 1992) of global annual anthropogenic CH4 is released into the atmosphere. The major sources of release are landfilling and wastewater treatment. Reporting on greenhouse gas emissions derived from waste requires companies to obtain good knowledge of their major waste streams. In particular, companies would

The GHG Indicator: UNEP Guidelines for Calculating GHG Emissions
39
have to know the type and amount of wastes produced (in particular the carbon content of the waste) and the disposal methods employed. Companies should actively seek to quantify their waste now, in preparation for more reliable data on emissions from waste, which can then be incorporated. Anticipating the move to account for emissions from waste will save work in the future. The DETR is currently working on a guide for businesses on their waste emissions. The DETR has also released a software programme entitled ‘WIZARD’ which can help you through the waste management process. To summarise, inclusion of waste emissions in the GHG indicator was made non-compulsory for the following reasons (IPCC, 1996): 1. Landfilling or solid waste disposal:
!"waste disposal practices vary substantially between countries, even down to specific site operators;
!"the composition of industrial wastes varies considerably industry by industry, and company by company;
!"physical factors, such as moisture, pH and nutrients all play significant roles in methane production.
2. Wastewater handling: !"the organic content of wastewater may vary considerably; !"wastewater treatment systems determine the level of aerobic conditions; !"temperature and other factors influence methane production.
6.4 Implications of the Kyoto Protocol Agreement Articles 6, 12 and 16, of the Kyoto Protocol, corresponding to Joint Implementation (JI), Clean Development Mechanisms (CDM) and Emissions Trading, are all significant for a GHG Indicator. The mechanisms of the protocol represent an opportunity for companies to reduce their greenhouse gases at least cost and where it is most efficient to do so. An accurate baseline estimate of emissions is therefore needed. The UNEP GHG Indicator can provide this initial estimate. It is then possible for a company to assess whether entering into one of the mechanisms of the protocol would be beneficial or not. Once this decision is made, inventories of emissions would have to be made more accurate for participation in the mechanisms, and the next rung of the ‘GHG Indicator’ ladder would have to be climbed, i.e. the WRI/WBCSD initiative. 6.5 Life Cycle Impacts The indicator is not currently designed to measure the global warming impacts of products during their life cycle. Such impacts lie outside existing norms for consolidated group accounts. However, product life-cycle global warming impacts may be very considerable, as in the case of the automobile industry. Further research is required to examine how this might reasonably be reflected in an indicator. If a company has sufficient resources, life-cycle impacts should be considered, as this area of research is likely to become more and more important as experience and knowledge grow. This is particularly relevant as emphasis is increasingly moving away from traditional end-of-pipe solutions to reducing impacts at all stages of the process.

The GHG Indicator: UNEP Guidelines for Calculating GHG Emissions
40
7 BIBLIOGRAPHY Alexander D, and Archer S (1992) The European Accounting Guide, Academic Press, London Behmanesh N, Rogue J.A and Allen D T (1993) An Analysis of Normalised Measures of Pollution Prevention, Pollution Prevention Review, spring 1993 Blumberg, J, Korsvold, A and Blum, G (1997) Environmental Performance and Shareholder Value, World Business Council for Sustainable Development, Geneva BP Amoco, (1997) Protocol for the Calculation of Carbon Dioxide Emissions Cohen, M.A, Fenn, S.F and Naimon, S (1995) Environmental and Financial Performance: Are They Related? Investor Responsibility Research Centre, Environmental Information Centre, Washington, D.C Collier, U and Löfstedt R, E (1997) Cases in Climate Change, Political Reality in the European Union, Earthscan Publications, London Cordeiro, J and Sarkis, J (1997) Environmental Proactivism and Firm Performance: Evidence from Security Analyst Earnings Forecasts, Business Strategy and the Environment, Vol.6 pp 104-114 DETR, (1999) Environmental Reporting – guidelines for company reporting on greenhouse gas emissions, London Dobes, L (1995) Greenhouse Gas Emissions in Australian Transport in 1990 and 2000, Bureau of Transport and Communications Economics, Canberra, Australia DG XVII. EU (1992), Energy in Europe. A View to the Future, DGXVII, Brussels EEA (1996), Climate Change in the European Union, European Environment Agency, Copenhagen EFFAS (1994) Environmental Reporting and Disclosures: The Financial Analyst’s View, The European Federation of Financial Analysts’ Societies EIA (Energy Information Administration) (1996) Voluntary Reporting of Greenhouse Gases, US Department of Energy, DOE/EIA-0608(95) ETSU (1995) Full Fuel Cycle Atmospheric Emissions and Global Warming Impacts from UK Electricity Generation, HMSO, London ESTU (1994) Energy and Emissions of a Switch to Diesel, Energy Technology Support Unit, HMSO, London ETSU (1996b) Alternative Road Transport Fuels - A Preliminary Life-cycle Study for the UK, Energy Technology Support Unit, Volume 2, HMSO, London

The GHG Indicator: UNEP Guidelines for Calculating GHG Emissions
41
Feldman, S.J, Sokya, P.A and Ameer, P (1996) Does Improving a Firm’s Environmental Management System and Environmental Performance Result in a Higher Stock Price?, ICF Kaiser International, Inc, Fairfax, VA Hart, S and Ahuja, G (1996) Does It Pay to be Green? An Empirical Examination between Emissions Reduction and Firm Performance, Business Strategy and the Environment, Vol. 5 pp 30-57 ICI (1997) Environmental Burden: The ICI Approach, ICI, London. Unpublished company report IEA (1998) Data provided personally by International Energy Agency, Paris. IEA (1998) CO2 Emissions from Fuel Combustion. A New Basis for Comparing Emissions of a Major Greenhouse Gas, OECD, Paris IEA (1999) Energy Statistics and Balances Of Non-OECD Countries 1996-1997, OECD, Paris IEA (1999) Energy Statistics Of OECD Countries 1996-1997, OECD, Paris INFRAS (1995) Ökoinventar Transporte, SPP Umwelt Modul 5, Zürich INFRAS (1999) Handbuch Emissionsfaktoren des Strassenverkehrs, Version 1.2, HBEFA, Umweltbundesamt Berlin IPCC (1990) Scientific Assessment, Cambridge University Press, Cambridge IPCC (1992) Climate Change 1992. The Supplementary Report of the IPCC Scientific Assessment, Cambridge University Press, Cambridge IPPC, (1995) Working Group 1 Report, pp. 11-12 IPCC (1996) Climate Change 1995: The Science of Climate Change, Contribution of Working Group 1 to the Second Assessment Report of the Intergovernmental Panel on Climate Change, Cambridge University Press, Cambridge IPCC (1996a) Greenhouse Gas Inventory Reference Manual, Revised 1996 IPCC Guidelines for National Greenhouse Gas Inventories IPCC (1996b) Climate Change 1995: Impacts, Adaptations and Mitigations of Climate Change, Cambridge University Press, Cambridge James, P and Bennett, M (1994) Environment-related Performance Measurement in Business; from Emissions to Profit and Sustainability?, Ashridge Management Research Group, unpublished KPMG (1999) International Survey of Environmental Reporting, KPMG, De Meern Marland and Pippen (1990) United States Emissions of CO2 to Earth’s Atmosphere by Economic Activity, Energy Systems and Policy, Vol. 14 pp319-336

The GHG Indicator: UNEP Guidelines for Calculating GHG Emissions
42
Mike McMahon (1999) BP Amoco, Technical Aspects of Measuring Emissions in the Petroleum Industry OECD/IEA (1997-1998) Energy Statistics And Balances of Non-OECD and OECD Countries Schipper, L and Meyers, S (1992) Energy Efficiency and Human Activity: Past, Trends, Future Prospects, Sponsored by the Stockholm Environment Institute, Cambridge University Press, Cambridge TNO (1992) EC Policy Measures Aiming at Reducing CO2 Emissions in the Transport Sector, TNO Institute of Spatial Organisation, Netherlands Torrie Smith (1999) Associates/ICLEI Just Do It! - framework for quantifying and reducing urban GHG emissions Watson, R (November 2, 1999) Report to the Fifth Conference of the Parties of the United Nations Framework Convention on Climate Change

The GHG Indicator: UNEP Guidelines for Calculating GHG Emissions
43
8 APPENDIX 8.1 Emissions from Fuel Use
Table 9: Country-specific net calorific values (NCV) for coal & carbon dioxide emission factors (CO2EF)
COUNTRY NCV
TJ/kilotonne
CO2EF (tonnes of CO2
/tonne of coal used)
COUNTRY NCV
TJ/kilotonne
CO2EF (tonnes of CO2
/tonne of coal used)
Albania 18.284 1.70 Kuwait 17.710 1.65 Algeria 19.176 1.78 Kyrgyzstan 18.673 1.73 Argentina 17.585 1.63 Latvia 20.306 1.89 Armenia 18.673 1.73 Lebanon 18.003 1.67 Australia 21.227 1.97 Libya 17.710 1.65 Austria 22.944 2.13 Lithuania 17.208 1.60 Azerbaijan 18.673 1.73 Luxembourg 24.493 2.28 Bahrain 17.710 1.65 Malaysia 19.427 1.80 Bangladesh 16.329 1.52 Mexico 21.353 1.98 Belarus 18.945 1.76 Moldova 18.673 1.73 Belgium 24.995 2.32 Morocco 18.631 1.73 Bolivia 17.710 1.65 Nepal 17.543 1.63 Bosnia and Herzegovina 20.334 1.89 Netherlands 24.702 2.29 Brazil 25.874 2.40 New Zealand 23.781 2.21 Brunei 17.710 1.65 Norway 28.303 2.63 Bulgaria 18.663 1.73 Pakistan 15.701 1.46 Canada 22.944 2.13 Paraguay 17.710 1.65 Chile 21.143 1.96 Peru 23.572 2.19 China 16.370 1.52 Poland 0.000 0.00 Colombia 17.124 1.59 Portugal 25.581 2.38 Croatia 20.464 1.90 Romania 13.188 1.23 Cuba 17.710 1.65 Russia 18.673 1.73 Czech Republic 20.222 1.88 Singapore 13.105 1.22 Denmark 24.283 2.26 Slovak
Republic 20.071 1.86 Ecuador 19.176 1.78 South Africa 19.739 1.83 Egypt 17.710 1.65 South Korea 19.176 1.78 Estonia 15.910 1.48 Spain 20.934 1.94 Finland 23.069 2.14 Sri Lanka 17.710 1.65 France 26.544 2.47 Sweden 23.404 2.17 FYROM 20.334 1.89 Switzerland 26.084 2.42 Georgia 18.673 1.73 Syria 17.710 1.65 Germany 23.739 2.21 Tajikistan 18.673 1.73 Greece 19.301 1.79 Thailand 19.887 1.85 Hungary 19.301 1.79 Tunisia 17.710 1.65 Iceland 27.591 2.56 Turkey 22.232 2.07 India 16.454 1.53 Turkmenistan 18.673 1.73 Iran 17.710 1.65 UK 27.005 2.51 Iraq 17.710 1.65 Ukraine 19.427 1.80 Ireland 24.367 2.26 United Arab
Emirates 17.710 1.65 Israel 17.250 1.60 Uruguay 17.710 1.65 Italy 24.283 2.26 USA 23.530 2.19 Japan 27.758 2.58 Uzbekistan 18.673 1.73 Jordan 17.710 1.65 Venezuela 17.710 1.65 Kazakhstan 18.673 1.73 Default 19.841 1.84
Source: OECD/IEA, 1997-1998. Energy Statistics And Balances of Non-OECD and OECD Countries

The GHG Indicator: UNEP Guidelines for Calculating GHG Emissions
44
8.1.1 Coal If a company knows the specific net calorific value (NCV) of the coal that it uses, then that value should be used in calculating the GHG Indicator. If the NCV is not known, the default country values in Table 9 can be used. These data are taken from IEA statistics and an average is calculated taking the known NCV’s for each type of coal produced, imported or exported in a country. The NCV’s given by the IEA were originally expressed in tonnes of oil equivalent, in the table they have been converted to terajoules per kilotonne (TJ/kilotonne) to be consistent with the IPCC approach. For the purposes of this methodology the definition of coal covers: bituminous coal and anthracite, sub-bituminous coal, coking coal, lignite, peat, and coal products including, patent fuel, coke oven coke, gas coke and BKB. An average carbon-emission factor of 25.85 tonnes of carbon/terajoule (tC/TJ) is derived from IPCC 1996a, and applied to country-specific NCV’s to give a carbon dioxide emission factor (CO2EF) for each country listed. 8.1.2 Other Fuel Emissions Tables 10 and 11 represent the standard IPCC Net Calorific Values and Carbon Emission Factors given in IPCC, 1996a. To arrive at a CO2 Emission Factor, the carbon values in Table 11 are multiplied by 3.667, as given by the IPCC.
Table 10: Selected net calorific values for fuels Fuels NCV (TJ/ kilotonne) Gasoline 44.80 Natural Gas 52.30 Gas/ Diesel Oil 43.33 Residual Fuel Oil 40.19 LPG 47.31 Jet Kerosene 44.59 Shale oil 36.00 Ethane 47.49 Naphtha 45.01 Bitumen 40.19 Lubricants 40.19 Petroleum Coke 31.00 Refinery Feedstock 44.80 Refinery Gas 48.15 Other Oil Products 40.19
Source: IPCC, 1996a Table 11: Carbon emission factors for fuels
Fuels Carbon Emission Factor (tC/TJ) Gasoline 18.9 Natural Gas 15.3 Gas/ Diesel Oil 20.2 Residual Fuel Oil 21.1 LPG 17.2 Jet Kerosene 19.5 Ethane 16.8 Naphtha 20.0 Bitumen 22.0 Lubricants 20.0 Petroleum Coke 27.5 Refinery Feedstock 20.0 Shale oil 20.0

The GHG Indicator: UNEP Guidelines for Calculating GHG Emissions
45
Refinery Gas 18.2 Other Oil Products 20.0
Source: IPCC (1996a)
8.2 Electricity-Derived Carbon Dioxide Emissions CO2 emissions from electricity supply have been calculated using International Energy Agency (IEA) data compiled from IEA publications, Energy Statistics of OECD Countries, Energy Balances of OECD Countries and Energy Statistics and Balances of Non-OECD Countries, IEA/OECD Paris, 1999. CO2 emissions come from CO2 Emissions From Fuel Combustion 1971-1996. IEA CO2 estimates use the IPCC 1996a reference approach to calculating CO2. The estimates vary slightly from the National Communications: “A recent comparison of the IEA estimates with the National Communications showed that for most Annex 1 countries, the two calculations were within 5%.” (IEA, 1998, pg. 1.3) The resulting emission factors are therefore fairly reliable. However, national factors should be used if known. The indicator attempts to provide as many country emission factors as possible. If your country is not shown then the default value should be used, or a national factor if available. Emission factors on an international scale could only be calculated for 1996 because of the availability of data. There is a potential for collaboration between the IEA and UNEP to ensure these factors are periodically updated to reflect changes in national energy mixes. The factors have been calculated by taking CO2 emissions from public electricity and heat production which incorporate emissions from public electricity generation, public combined heat and power generation and public heat plants. Total emissions are then divided by total electricity production, including electricity from nuclear power and renewables, which are assumed to have zero CO2 emissions 28, to arrive at an emission factor of tonnes of CO2 per kWh of electricity produced. Companies using Worksheet 4.2 should input their total electricity usage in kWh (excluding electricity from private CHP, which is dealt with under section 8.3), in the column next to their country of location. The next step is to multiply electricity usage by the emission factor for your country and enter it in the final column. There should be only one figure for CO2 from electricity. Table 12 gives a comprehensive list of country electricity emission factors for 1990 and 1996. This will be updated as and when the data become available. Some countries in the table have an emissions level of zero for 1990. These tend to be Economies In Transition (EIT’s) from Annex B of the Kyoto Protocol. There is a lack of data in IEA statistics for these countries for 1990, reflecting the difficulty of data collection during that period. The default emission factor for 1990 is therefore of limited use because many countries are not included. It is suggested that users from former
28 Note that this is an approximation, CO2 emissions also occur in the operation and management of a nuclear power station even if to a much smaller extent.

The GHG Indicator: UNEP Guidelines for Calculating GHG Emissions
46
Eastern Block countries, defined as EIT’s for the purposes of the Protocol, attempt to create their own emission factors from national data.

The GHG Indicator: UNEP Guidelines for Calculating GHG Emissions
47
Table 12: Electricity emission factors for different countries for 1990 and 1996 (tCO2/kWh)
COUNTRY 1990 Emission
factor
1996 Emission
factor
COUNTRY 1990 Emission
factor
1996 Emission
factor Albania 0.000228 0.000019 Korea 0.000317 0.000297 Algeria 0.000487 0.000620 Kuwait 0.000591 0.000512 Argentina 0.000320 0.000301 Kyrgyzstan 0.000000 0.000106 Armenia 0.000000 0.000247 Latvia 0.000000 0.000172 Australia 0.000777 0.000791 Lebanon 0.001833 0.000652 Austria 0.000192 0.000155 Libya 0.000471 0.000626 Azerbaijan 0.000000 0.000150 Lithuania 0.000000 0.000142 Bahrain 0.001014 0.000767 Luxembourg 0.000000 0.000425 Bangladesh 0.000604 0.000540 Malaysia 0.000664 0.000594 Belarus 0.000000 0.000301 Mexico 0.000523 0.000508 Belgium 0.000289 0.000281 Moldova 0.000000 0.000535 Bolivia 0.000286 0.000269 Morocco 0.000674 0.000632 Bosnia-Herzegovina 0.000000 0.000943
Nepal 0.000000 0.000017
Brazil 0.000026 0.000032 Netherlands 0.000516 0.000435 Brunei 0.001015 0.000711 New Zealand 0.000103 0.000099 Bulgaria 0.000000 0.000419 Norway 0.000001 0.000002 Canada 0.000189 0.000163 Pakistan 0.000410 0.000438 Chile 0.000274 0.000318 Paraguay 0.000000 0.000133 China 0.000710 0.000772 Peru 0.000057 0.000014 Colombia 0.000178 0.000117 Poland 0.000464 0.000609 Croatia 0.000000 0.000217 Portugal 0.000494 0.000384 Cuba 0.000629 0.000654 Romania 0.000473 0.000304 Czech Republic 0.000539 0.000420 Russia 0.000000 0.000282 Denmark 0.000454 0.000446 Singapore 0.000890 0.000622 Ecuador 0.000196 0.000307 Slovak Republic 0.000306 0.000297 Egypt 0.000546 0.000561 South Africa 0.000796 0.000770 Estonia 0.000000 0.000747 Spain 0.000408 0.000322 Finland 0.000202 0.000249 Sri Lanka 0.000003 0.000205 France 0.000057 0.000040 Sweden 0.000040 0.000062 FYROM 0.000698 0.000825 Switzerland 0.000008 0.000003 Georgia 0.000000 0.000049 Syria 0.000546 0.000650 Germany 0.000460 0.000419 Tajikistan 0.000000 0.000068 Greece 0.000971 0.000812 Thailand 0.000619 0.000618 Hungary 0.000379 0.000362 Tunisia 0.000578 0.000522 Iceland 0.000002 0.000001 Turkey 0.000492 0.000461 India 0.000761 0.000890 Turkmenistan 0.000000 0.000731 Iran 0.000541 0.000534 UK 0.000632 0.000477 Iraq 0.000459 0.000554 Ukraine 0.000000 0.000376 Ireland
0.000724 0.000716 United Arab Emirates 0.000616 0.000783
Israel 0.000814 0.000801 Uruguay 0.000040 0.000100 Italy 0.000488 0.000420 USA 0.000546 0.000503 Japan 0.000346 0.000321 Uzbekistan 0.000000 0.000432 Jordan 0.000720 0.000791 Venezuela 0.000237 0.000176 Kazakhstan 0.000000 0.001312
World
0.000489 0.000466 Non-OECD Europe 0.000496 0.000420
Africa 0.000660 0.000663 Former USSR 0.000417 0.000328 Middle East 0.000632 0.000650 Latin America 0.000184 0.000164
Asia (excl. China) 0.000658 0.000724
Source: IEA, 1998/9

The GHG Indicator: UNEP Guidelines for Calculating GHG Emissions
48
8.3 Combined Heat and Power This appendix, to be used in conjunction with Worksheets 4.2 and 4.3, describes how to calculate CO2 emissions from combined heat and power (CHP) systems. The sections on CHP used in these guidelines have been adapted from the UK DETR's Environmental Reporting Guidelines. Although the information given by the DETR is designed for use in the UK, the CHP calculations are just as applicable to companies elsewhere. The method for calculating CHP requires knowledge of the quantity of fuel used and of how much electricity and heat is generated. Emission factors calculated by the IPCC are then used to convert the fuel used to CO2 emissions. Table 11, Appendix 8.1, lists the IPCC emission factors for different fuels. Users should now read the following sections in order to decide which section applies to their use of CHP and then follow the appropriate instructions to calculate CO2 emissions from CHP. 8.3.1 Do you IMPORT electricity or heat generated by CHP?
YES GO TO SECTION 8.3.4 NO GO TO SECTION 8.3.2
8.3.2 Do you EXPORT some of the electricity or heat from your CHP?
YES GO TO SECTION 8.3.3 NO
• Work out what fuel types CHP uses • Work out the quantities of the fuels used over the year • Using the conversion factors in Worksheet 4.1, calculate CO2 from
fuel use and insert the figure in Column 3 of Worksheet 4.3 8.3.3 EXPORTING electricity or heat from your CHP If you export some of the electricity or heat from CHP then you need to work out the amount that you export in terms of its CO2 equivalent. You can then subtract this from your total CO2. This is because the CO2 from electricity is attributed to the end user, not the generator, for this type of indicator.
If you use more than one fuel in your CHP read Section 8.3.5 before going any further. Enter your data in the boxes provided.
Step 1 Calculate the Total CO2 from fuel use for your CHP, referring to section 8.3.5 if you use more than one type of fuel. This calculation is the same as that for 8.3.2. Enter the total in this box: = TOTAL CO2

The GHG Indicator: UNEP Guidelines for Calculating GHG Emissions
49
Step 2 Requires you to work out the CO2 emission factor for the electricity you produce. This is done by dividing the amount of CO2 your CHP produces by the amount of electricity and heat that is produced. The following formulas should be used. 2 X Amount of Fuel used in kWh X t CO2/kWh Emission Factor (Worksheet 4.1) 2 X Electricity Produced in kWh + Heat Produced in kWh
= tCO2 per kWh of Electricity Produced
Step 3 Is similar to Step 2 but calculates the CO2 emission factor for the heat you produce. Amount of Fuel used in kWh X t CO2/kWh Emission Factor (Worksheet 4.1) 2 X Electricity Produced in kWh + Heat Produced in kWh
= tCO2 per kWh of Heat Produced
Step 4 Requires you to enter the amounts of electricity and heat you export, in kWh. This is multiplied by the new emission factors that you have calculated in steps 2 and 3. This gives you a total for the CO2 emissions you have exported. KWh of Electricity exported X tCO2 per kWh of electricity produced (Step 2)
= CO2 From Electricity Export
KWh of Heat exported X tCO2 per kWh of Heat produced (Step 3)
= CO2 From Heat Export
Add the two figures together to give your total export of CO2
= Total CO2
Step 5 Finally, you need to subtract the CO2 you have exported from the total CO2 that is produced, given in the box in Step 1. This gives your total CO2 from CHP, taking into account the CO2 exported. The final figure should be entered in Column 2 in Worksheet 4.3. 8.3.4 IMPORTING electricity or heat generated by CHP
If you import electricity from a public CHP plant, you should use Worksheet 4.2. This is because the electricity factors used in Worksheet 4.2 incorporate public CHP schemes in the energy mix. If, however, you import from a private CHP plant, you should get in contact with the supplier of the electricity/heat. The calculation for CO2 emissions from the electricity/heat you import is the same as that in 8.3.3, but instead you add the CO2

The GHG Indicator: UNEP Guidelines for Calculating GHG Emissions
50
to your total rather than subtracting it because you become accountable for those emissions. You need to obtain the following data from your supplier to perform the calculation.
!"Type of Fuel !"Total Amount used in original units and in electricity and heat !"Amount of electricity and heat they have generated !"Total electricity and heat you have been supplied/imported
Use the boxes in 8.3.3 to calculate the CO2 emissions from the electricity/heat you import and insert the total in Column 1 in Worksheet 4.3. 8.3.5 Your CHP Uses MORE THAN ONE FUEL
There are two options to consider if you use a mix of fuels for your CHP and you also export some of your electricity or heat.
a) Calculate the total CO2 from all the fuels you have used in your CHP and then divide by the total fuel input to give you an average emission factor, which can be used in 8.3.3. For example:
Fuel Amount Emission factor t CO2 Coal 500 X 1.85 = 925 Refinery Feedstock 3502 X 3.25 = 11382 Petroleum Coke 45 X 3.09 = 139 Totals 4047 12446
Total CO2 / Total Fuel Input = CO2 Emission factor 12445.55 / 4047 = 3.075 t CO2 per tonne of fuel
b) Alternatively, if you want to be more accurate, you can go through the calculation process in 8.3.3 for each individual fuel. Although more time-consuming, this would be more accurate than using one average emission factor for all the fuels you use. When you have decided which method you are going to use, work through section 8.3.3.

The GHG Indicator: UNEP Guidelines for Calculating GHG Emissions
51
8.4 Road Transport Road transport data have been taken from that provided by INFRAS and subsequently the DETR, 1999. The DETR report29 focuses on emissions from driving conditions in the UK. In the absence of quality data for the rest of the world, this information is taken as being applicable to Europe. Other countries should strive to find national data. When applying these data to your company this must be borne in mind. Calculations for road transport emissions require a two-stage process: Stage one: Requirement of information for all transport modes in the appropriate units.
Vehicle transport fuels Units Petrol Litres Diesel Litres LPG Litres
Stage two: Application of appropriate emission factors to the energy sources to produce carbon dioxide equivalents using the same emission factors provided for fuel emissions (listed in Worksheet 4.1).
29 Environmental Reporting – guidelines for company reporting on greenhouse gas emissions, 1999

The GHG Indicator: UNEP Guidelines for Calculating GHG Emissions
52
8.5 Unit. Kilometre Transport Calculations for transport are based on data provided by INFRAS (1999). INFRAS has studied vehicle emissions for a number of pollutants and a range of driving conditions, vehicle types, fuel types and start-up conditions. The INFRAS data are based on studies of German conditions. However, they also cover the standard EU EURO3, 4 and 5 vehicle classifications. Although the study is based in Germany, it is the most comprehensive study of vehicle emissions to date. It is possible to pick out average conditions from the data that could be applied to different countries, based on vehicle mixes, road speed limits, levels of congestion etc. For the purposes of this indicator, the INFRAS data reflect average driving conditions for urban, rural and highway conditions. They set an incline variance of ±2 per cent and have the ability to forecast emission levels for different years based on anticipated changes in vehicle mix and fuel type and on the degree to which exhaust standards will change. The emission factors used should be fairly representative of average driving conditions. If a company is able to obtain specific national data on car emissions, it is advisable to use that data. In the absence of a world-wide study on vehicle emissions, the INFRAS study represents an excellent way of manipulating data for individual circumstances. Information for non-road transport was taken from INFRAS 1995 and the DETR. Both groups have considerable experience in emissions from travel and therefore it was decided to combine research by both. The data for air travel were taken from the DETR report and were calculated using data from various airlines. Although tailored for the UK, the figures represent the most reliable at present for air travel. Figures for train and shipping emissions are taken from INFRAS, 1995. The whole area of emissions from non-road transport needs much more research, especially at the world level, so that reliable emission factors can be calculated for individual countries.
Information requirement of ‘non-road’ transport and appropriate units Transport Mode Units Air Passenger.km Air Tonnage.km Train Passenger.km Train Tonnage.km Inland shipping Tonnage.km
Marine shipping Tonnage.km

The GHG Indicator: UNEP Guidelines for Calculating GHG Emissions
53
8.6 Process Related Sectors POTENTIAL EMISSIONS FROM INDUSTRIAL PROCESSES
Process Greenhouse Gases CO2 CH4 N2O PFC SF6 HFC Mineral Products Cement production × Lime production × Limestone use × Soda ash production and use × Asphalt roofing Brick manufacture Road paving Other × × Chemical industry Ammonia × Nitric acid × Adipic acid × Urea × Carbides × × Caprolactam × Petrochemicals × × × Metal Production Iron, steel and ferroalloys × × Aluminium × × × × Magnesium × × Other metals × × Energy Industry Coal mining × × Solid fuel transformation × Oil production × × Gas production and distribution × × Other Pulp and paper Food and drink Production of halocarbons × × × Use of halocarbons and SF6 × × × Organic waste management × × Other sources × × × × × ×
Source: IPCC, 1996a The table does not cover all potential GHG's or industrial sources. A cross in the table does not imply that the emission estimations methodology is available in these guidelines or that the emission of a given source and gas is always significant. The table is intended as a simple guide to help companies identify potential emission sources.

The GHG Indicator: UNEP Guidelines for Calculating GHG Emissions
54
8.7 Conversion Tables General Conversion Factors for Energy To: TJ Gcal Mtoe MBtu GWh
From: multiply by:
TJ 1 238.8 2.388 x 10⁻⁵ 947.8 0.2778
Gcal 4.1868 x 10⁻³ 1 10-7 3.968 1.163 x 10⁻³
Mtoe 4.1868 x 10⁴ 107 1 3.968 x 10⁷ 11630
MBtu 1.0551 x 10⁻³ 0.252 2.52 x 10⁻⁸ 1 2.931 x 10⁻⁴
GWh 3.6 860 8.6 x 10⁻⁵ 3412 1
Conversion Factors for Mass To: kg t lt st lb
From: multiply by:
kilogram (kg) 1 0.001 9.84 x 10⁻⁴ 1.102 x 10⁻³ 2.2046
tonne (t) 1000 1 0.984 1.1023 2204.6
long ton (lt) 1016 1.016 1 1.120 2240.0
short ton (st) 907.2 0.9072 0.893 1 2000.0
pound (lb) 0.454 4.54 x 10⁻⁴ 4.46 x 10⁻⁴ 5.0 x 10⁻⁴ 1
Conversion Factors for Volume
To: gal U.S. gal U.K bbl ft3 l m3
From: multiply by:
U.S. Gallon (gal) 1 0.8327 0.02381 0.1337 3.785 0.0038
U.K. Gallon (gal) 1.201 1 0.02859 0.1605 4.546 0.0045
Barrel (bbl) 42.0 34.97 1 5.615 159.0 0.159
Cubic foot (ft3) 7.48 6.229 0.1781 1 28.3 0.0283
Litre (l) 0.2642 0.220 0.0063 0.0353 1 0.001
Cubic metre (m3) 264.2 220.0 6.289 35.3147 1000.0 1

The GHG Indicator: UNEP Guidelines for Calculating GHG Emissions
55
8.8 Corporate Environmental Reports Surveyed for Original Indicator (1997)
The calculations and policies on carbon impacts in these corporate environmental reports formed the basis for the methodology set out in this document.
Companies Companies 3M National Power Anglian Water National Westminster Bank ASG Neste Astra Noranda BASF Norsk Hydro BHP Norske Skeg Body Shop Northern Telecom British Petroleum Northern Electric British Airways Northumbrian Water British Gas Novartis British Telecom Novo Nordisk Cargill Nuclear Electric Danish Steel Nuclear Electric Daimlar-Benz Ontario Hydro Dow Chemicals P&O DuPont Polaroid Eastern Electricity Powergen Electrolux AB Proctor & Gamble ELF Atochem Roche ENSO Royal Dutch & Shell ESKOM SAS Fiat Scottish Power Glaxo Wellcome Severn Water General Motors South West Water Henkel Statoil HL & H Timber Holdings Swiss Bank Corp. IBM Tarmac ICI Texaco ING Group Thames Water Intel Thorn EMI Inter-Continental Tioxide J Sainsbury Unilever Kvaerner Volkswagon Eli Lilly Volvo London Electric Welsh Water Migror WMC MoDo Monsanto

The GHG Indicator: UNEP Guidelines for Calculating GHG Emissions
56
8.9 Annex 1 Countries to the Kyoto Protocol Table 13: Annex 1 countries to the Kyoto Protocol and emission reduction requirements
COUNTRY EMISSION REDUCTION
REQUIRED (base year 1990)
COUNTRY EMISSION REDUCTION
REQUIRED (base year 1990)
Australia +8 Liechtenstein -8 Austria -13 Lithuania* -8 Belgium -7.5 Luxembourg -28 Bulgaria* -8 Monaca -8 Canada -6 Netherlands -6 Croatia* -5 New Zealand 0 Czech Republic*
-8 Norway +1
Denmark -21 Poland* -6 Estonia* -8 Portugal +27 EU -8 Romania* -8 Finland 0 Russian
Federation* 0
France 0 Slovakia* -8 Germany -21 Slovenia* -8 Greece +25 Spain +15 Hungary* -6 Sweden +4 Iceland +10 Switzerland -8 Ireland +13 Ukraine* 0 Italy -6.5 UK -12.5 Japan -6 USA -7 Latvia* -8
NB Countries marked with a star in the table above represent Economies In Transition. Under the Protocol, the EU was required to cut its emissions by 8 per cent in relation to1990 levels. Under Article 3 of the Protocol, groups of countries can collectively reducetheir emissions to achieve an overall target. The EU ‘bubble’ countries have thereforeredistributed their targets in order to assist in meeting the EU's overall target of 8 per cent.

The GHG Indicator: UNEP Guidelines for Calculating GHG Emissions
57
8.10 Carbon Offsets/Sequestration Much of the feedback on the original indicator centred on carbon offsets or sinks – the idea that a company or country can offset some of its emissions of GHG’s by planting trees in another country or its own country, or by storing CO2 in another way. Contributors felt that the indicator concentrated on the negative aspects of GHG emissions and not enough was made of a company’s attempt to balance its emissions. Many companies have adopted these methods and started to promote projects in developing countries that will offset their emissions in that country or in the country from which the company originates. The idea of offsets is closely linked with two of the Kyoto mechanisms, the Clean Development Mechanism and Joint Implementation, and under the right conditions can be a useful way for a firm to account for its global warming impact. However, there are numerous problems associated with carbon offsets that lead the authors not to include them.
1. It is difficult to verify that the emission reductions associated with carbon offsets are real and measurable.
2. Many believe that reductions in emissions should be made domestically or on-site rather than offsetting the emissions somewhere else. There is an implication that offsetting delays the effects of climate change and passes the problem on to someone else, often less fortunate.
3. The purpose behind this indicator is to promote early action to reduce emissions of GHG’s and not to offset them. The indicator will show users where there are potential savings to be made financially and in terms of emission reductions.
By profiling GHG emissions over time, in Worksheet 4.9, the indicator allows users to reflect their emission reduction performance. If emissions have been reduced on site through greater efficiency or by switching car fleets to more fuel-efficient cars, then performance will be seen over time. The ability to provide a clear indication of GHG emission trends over time is of primary interest to investors. It is one of the main reasons for developing this accounting methodology and addresses the concern expressed by some commentators that the indicator does not allow benefits to be seen.

The GHG Indicator: UNEP Guidelines for Calculating GHG Emissions
58
9 CONTACT DETAILS Jonathan Rolls Mark Radka 14 Copwood Close Energy Programme Coordinator Torrington Park UNEP DTIE London Coordinator Tour Mirabeau N12 9PR 39-43 quai André Citroen, 75739 Paris United Kingdom FRANCE [email protected] [email protected] Charles Thomas BP Amoco p.l.c. Britannic House, 1 Finsbury Circus London EC2M 7BA UNITED KINGDOM [email protected]

The GHG Indicator: UNEP Guidelines for Calculating GHG Emissions
59
10 USEFUL INFORMATION CLIMATE CHANGE/ KYOTO PROTOCOL:
!"United Nations Framework Convention on Climate Change
http://www.UNFCCC.org OTHER METHODOLOGIES/INITIATIVES:
!"IPCC Guidelines
http://www.ipcc-nggip.iges.or.jp/public/gl/invs1.htm
!"DETR Climate Change Page
http://www.environment.detr.gov.uk/climatechange/index.htm
!"WBCSD/WRI Initiative http://www.ghgprotocol.org/ UNEP:
http://www.unep.org ENVIRONMENTAL REPORTING:
!"International Corporate Reporting Site
http://www.enviroreporting.com
!"GRI - Global Reporting Initiative
http://www.globalreporting.org/

The GHG Indicator: UNEP Guidelines for Calculating GHG Emissions
60
11 FEEDBACK FORM NAME:
ORGANISATION:
HOW EASY WAS THE INDICATOR TO USE?
WHAT METHODS OR DATA OF YOUR OWN HAVE YOU USED?
HAVE YOU FOUND INFORMATION/DATA SPECIFIC TO YOUR COUNTRY/INDUSTRY WHICH COULD HELP OTHERS?
WHAT WAS YOUR OVERALL IMPRESSION?
WHAT AREAS WOULD YOU IMPROVE AND HOW?
HOW WOULD YOU LIKE TO BE KEPT INFORMED?
E-MAIL NEWSLETTER BY ACCESS TO A WEBSITE
OTHER ELECTRONIC WORKSHEET KEPT UP TO DATE
ANY OTHER COMMENTS?
CAN WE USE YOUR COMMENTS IN ANY FURTHER REVISION?
YES NO
Send to: Ken McGuire, UNEP Insurance Industry Initiative, Palais des Nations, 1211 Geneve 10, Switzerland; E-Mail: [email protected]

The GHG Indicator: UNEP Guidelines for Calculating GHG Emissions
61
“Is not the creation of an indicator a drive to firstmeasure, then control, then reduce emissions?Could the indicator not be seen as a goldenopportunity to raise the profile of ever moreaccurate knowledge of what our factories aredoing to the world, year after year?”
Graeme Castles, Business Development Manager,
British Salt


![2016 - Adobe Inc. · GRI CONTENT INDEX KEY PERFORMANCE INDICATOR 2016 DATA G4-EN17 Scope 3 GHG Emissions [tonnes CO2e] 36,769.50 G4-EN17 Scope 3 GHG Emissions from employee travel](https://static.fdocuments.us/doc/165x107/5f1e1384a3085d489c139a5f/2016-adobe-inc-gri-content-index-key-performance-indicator-2016-data-g4-en17.jpg)