
The Ghanaian dug-out canoe and the canoe carving industry ... · ridaf/wp / 35 the ghanaian dug out...
119
rIDAF/ WP / 35 THE GHANAIAN DUG OUT CANOE AND THE CANOE CARVING INDUSTRY IN GHANA FAO LIBRARY AN: 314915 PAO/OLIOk 941 1 01 ISINFEWWPAT Mare.h 1991
Transcript of The Ghanaian dug-out canoe and the canoe carving industry ... · ridaf/wp / 35 the ghanaian dug out...

rIDAF/ WP / 35
THE GHANAIAN DUG OUT CANOE
AND THE CANOE CARVING INDUSTRY
IN GHANA
FAO LIBRARY AN: 314915
PAO/OLIOk 941 1 01 ISINFEWWPAT
Mare.h 1991


IDAF/WP/35
THE GHANAIAN DUG-OUT CANOE
AND THE CANOE CARVING INDUS1RY
IN GHANA
G.T. Sheves
March 1991
Programme de DéveloppementIntégré des Péches Artisanalesen Afrique de l'Ouest - DIPA
Programme for IntegratedDevelopment of ArtisanalFisheries in West Africa - IDAF
GCP/RAF/192/DEN

With financial assistance from Denmark and in collaborationwith the Republic of Benin, the Fisheries Department of FAO isimplementing in West Africa a programme of small scale fisheriesdevelopment, commonly called the IDAF Project. This programme isbased upon an integrated approach involving production,processing and marketing of fish, and related activities ; italso involves an active participation of the target fishingcommunities.
This report is a working paper and the conclusions andrecommendations are those considered appropriate at the time ofpreparation. The working papers have not necessarily been clearedfor publication by the government (s) concerned nor by FAO. Theymay be modified in the light of further knowledge gained atsubsequent stages of the Project and issued later in otherseries.
The designations employed and the presentation of materialdo not imply the expression of any opinion on the part of FAO ora financing agency concerning the legal status of any country orterritory, city or area, or concerning the determination of itsfrontiers or boundaries.
IDAF ProjectFAO
Boite Postale 1369Cotonou, R. Benin
Télex : 5291 FOODAGRI Tél. 330925/330624Fax : (229) 313649
Dr. Gordon Sheves was CTA of the Model Project Benin from1984 to 1989. In 1990 he worked as an IDAF consultant to preparethis report, and the IDAF/FAO subregional workshop, onalternatives to the large dugout canoe for use by small-scaleand artisanal fishing communities, held in the FAO RegionalOffice for Africa, Accra on 26-29 November, 1990.

CONTENTS
2 Recent Developments in the Ghanaian Canoe Fleet 23
2.1 Developments in vessels and gear 232.2 Composition of Ghana Canoe Fleet 2623 Prices in the Ghana Canoe Fleet 272.4 Explanation and Significance of Tables 2.6 and 2.7 312.5 Implication of recent fishery and forestry trends for
the continued supply of Ghanaian dug-out canoes 33
3 The Market in Ghanaian Canoes 37
3.1 Canoe Supply 373.2 Number of Canoes recorded - Kumasi-Accra Road 393.3 Number of canoes recorded - other check points 40
3.4 Demand for Ghanaian canoes 4133 Source and Distribution of Ghanaian Dug-out Canoes 44
4 Canoe Carving Industry 49
4.1 Organisation Structure of the Ghanaian CanoeCarving industry 49
4.2 Migration in the Canoe Carving industry 5043 Relationship in Canoe Carving Groups 51
1 General Background to Forest Resources in Ghana 1
1.1 Current situation of Wawa logs suitable for canoe carving 2
1.2 Availability of Wawa for Canoe Carving 3
1.3 Perception on the availability and supply of wawato the canoe carving industry 9
Timber Concessionnaires 9Canoe Carvers 10
Fishermen 13

4.4 Share system in the Canoe Carving industry 534.5 Relationship between fishermen and canoe carvers 554.6 Role of the Canoe agent 574.7 Cost of carving and canoe prices in forest 614.8 Profitability of canoe carving 644.9 Procedure for carving a Ghanaian canoe 66
5 The working environment of the Ghanaian canoe fleets 75
5.1 Topography of Ghanian landing sites 755.2 General Description of Ghanaian landing sites 7553 Port Development in Ghana 885.4 Classification of Ghanaian canoe landing sites 885.5 Beach conditions and fleet size 925.6 Migration patterns in the Ghanaian canoe fleet 94
6 Summary and Conclusion 107

1 GENERAL BACKGROUND TO FOREST RESOURCES IN GHANA (1)
The total area of Ghana is 23.9 million ha of which 8.2 million ha is conside-
red as the high forest zone. Increasing pressure of shifting cultivation due to po-
pulation increase over the last 15 to 20 years has transformed closed forest into
open forests and fallow lands. The closed forest is estimated at 1.7m ha which is
approximately the same as the reserved forest area of 1.68m ha. This latter area
is used exclusively for forestry production.
Exploitation pressures on both these zones have increased in recent years.
World Bank figures claim that if the largely uninhabited reserved forest areas are
excluded the 2.5% increase in population since 1970 now indicates a population
density of 32 persons/km in Brong Ahafo and 119 persons/km in the central re-
gion. This increasing population with its concomitant increased demand for agri-
cultural land has progressively destroyed the closed forest through swidden
agriculture and has imposed increasing pressure on the reserved forests. This in-
crease in demand for land at the expense of forest reserves is expected to increase
in the foreseeable future. The national population growth rate is expected to in-
crease between 1985 and 2000 to 3.5%. This will have important implication for
forest management, for even in earlier years of lower population growth rates,
pressure on the land from shifting agriculture led to the disappearing of the virgin
forest by 1980, and between 1981-1988 the closed forests area of 1.7m ha was
undergoing deforestation at an annual rate of 1.3% or 22,000 ha.
Industrial forestry which in 1985 contributed 7% to GDP and 30% to export
receipts, operate in both the reserved forest zone and the unreserved zone. While
1) This section is mainly from the World Bank "Ghana Forestry Reveiw". 1987

the unreserved zone resources are diminishing and will continue to do so at an
increasing rate the total log production between 1970-1974 averaged 1.85 million
m3 per year but declined to 680,000 m3 in 1983 due to extreme difficulties in the
Ghanaian economy which prevented the acquisition of the necessary imputs for
extraction. In the last five years however, there has been a five fold increase in
exports and the World Bank was predicting a total extraction of around 1.0 million
m3 in 1986, which was close to the annual allowable cut of 1.1 m3.
Total log production in 1987 however was 1,027,457 m3 which represented
a 28% increase over 1986. When logging wastes are considered which can be as
high as 25% - 50% the this extraction rate represents an actual cutting rate of 1.4
million m3 - 2.0 million m3.
Even now the traditional red woods and odum are likely to be exhausted wi-
thin 2-3 decades at current felling rates.
In Ghana therefore the forestry industry is marked by a rapidly diminishing
resource in the unreserved forest zone and an extraction rate in the Reserved Fo-
rest which at least for some species has exceeded its renewable resource ceiling.
1.1 Current Status of Wawa Logs suitable for Canoe Carving
While the general picture is necessary as a background, the needs of the
Ghanaian canoe fleet and its sustainability requires a more detailed focus on the
policies and practices which affect the availability of wawa trees (Triplichiton scle-
rexylon) from which all Ghanaian canoes are made.
Wawa is the most abundant tree species in Ghana and comrises 21% of
F.I.P. class 1 volume timber in trees greater than 70cm in diameter (2). Although
2) K.K. Ghartey (Project Manager F.I.P.) - "Results of the Inventory" fromForest In-ventory Project Proceedings 29-30 March 1989; Accra. the F.I.P. Class 1 representsspecies which have been exported at least once in the last 15 years.
2

found in all vegetation zones it is most abundant in the moist semi-deciduous
north-west sub-type, which occurs in the area of western Ashanti Region, sou-
thern Brong Ahafo Region and to the north of the Western Region. It is also abun-
dant but less so in the moist semi-deciduous south-east zone which covers the
south eastern portion of the Eastern Region. See figure 1.1.
The species is also the most heavily exploited comprising 32% of all forest
extraction, and has a stock life of 114 years (3).
It would apear therefore that the future of the canoe fleet in Ghana would be
secure. However, canoes are built from the largest trees available and the num-
bers of these decrease in relation to increasing size class.
From interviews with canoe carvers and fishermen and measurements of ca-
noes it has been established that it is now difficult to find trees in sufficient quan-
tities to carve a canoe above 157cm beam. This would need a tree with a diameter
of at least 165cm which would allow for loss of bark and trimming during construc-
tion.
Detailed information on the availability of trees of this size and over was sup-
plied by the Forest Resource Management Project in Kumasi. This project has
been operational for 6 years and has prepared an inventory of the existing fores-
try resources in the Reserved Forest Area. Based on a sampling grid of 1 ha plots
for each 400 ha of forest reserve, the project staff furnished Table 1 which gives
the numbers of wawa trees' above 165cm diameter for the areas sampled.
These estimates were accompanied by certain provisos which are pertinent
to assessing the status of wawa stems available for canoe building. The relevant
portion of the accompanying document is reproduced below.
3) Dr D. Alder "Natural Forest increment, Growth and Yield" ibid.
3

Adm
inis
trat
ive
regi
ons
in th
e hi
gh f
ores
tzo
ne o
f G
hana
AS
HA
NT
I-
Reg
ion
- V
eget
atio
n zo
neW
e

The stocking estimates of remaining Wawa trees gre,ater than 165cm within the forest re-serves of Ghana is 29,784. This estimate supersedes those given in the previous report of Janua-ry 1989.
These estimates are presented as an average or mean of what can be expected to be foundin Ghana. A Reliable Minimum Estimate was not available at the time of writing this report due tothe urgency of your request.
As stated, this value could be considerably reduced due to fire, illegal felling and encroa-chment etc. More accurate values will be available at a later date when an overall assessment ofthe location and extent of forest reserve within The High Forest of Ghana is carried out using theprojects Satellite Imagery Apparatus.
However, the loss of Wawa trees In reserves through fire, illegal felling and encroachmentetc., may be compensated by their presence outside reserves. Unfortunately we are not yet in aposttion to assess the number of Wawa trees outside reserves until our Inventory Oustide Reservescommences later this year.
Wawa is currently the most abundant commercial tree species. It Is also the timber indus-try's mainstay and is one of the very few species which approximates to being harvested on a sus-tained yield basis. However, the Forestry Department feels that management for the sustalnabilityof such large sized trees required by the fishing industry cannot be ensured for the following rea-sons:
The current commercial felling limit for Wawa is lower than required by the traditional ca-noe builders.
There are insufficient stocks of trees greater than 165cm to sustain canoe builders' cur-rent demands until trees below 165cm are recruited into the required size class (passage of timefor Wavva from 90-109cm to 110cm d.b.h. is 43.48 years).
A higher rate of return is realized from the sale of Wawa trees to the industry than for ca-noe building.
A large amount of wood waste is Incurred during the construction of traditional canoes.
The Department therefore does not consider the sustainabiltty of large sized Wawa trees amanagement priority. Their feeling is that because the demand by the Fishing Industry for Wawa,canoes cannot be sustained from the current resource, alternative timbers or method of construc-tion should be considered".
1.2 Availability of Wawa for Canoe building
The maximum number of trees suitable for carving large canoes is-therefore
around 30,000 in both the reserved and unreserved forest. While it is not possi-
5

Table 1.1
Stocking oF large Wawa (TriplochiLon scleroxylon) h) Olana
No of Numhcr oF pr.r s,innre ktiomolrePesere plots 105-171
0 00.0.000.000.0Q
0.000.000 .00
0.00
1.64
0.00
0.00.00
0
0 .00
3.39
26.20.000.00
0.00
0.000.00
0.000.87
0.000.000.000.000.000.000.000.00
0
0.000.00
0.003.330.00
0128
10'45576361
253 0
6936595029'7525152111
16115
1411
86264030
8126
0.000.00
3.850.000.000.00
0.00Ghana0.111170
Totat stems tor (Mana using; 4,75111,590 kte ns forest nrea
FoLal Wawa sLems hi Ghana greater that) 105 cm dhO = 29,784
6
175-181 18:-191 1H5-200 > 200
0 00 0.00. 0.000.00 0.00
(= 0.00 0.00)
20.00 10.00 0.00 0.000.00 0.00 0.00 0.00
0.00)
1.75 0.00(1)Z0.00 0.00 0.00
0.00 0.00 0.00 0.00
0.004.00 0.00 0.003.33 10.0 0 0.00 0.000.00 0.00 0.00 0.000.00 0.00 0.00 0.003.39 0.00 0.00 0.001.00 '-' .0 0 .00 .004 00.00 0.00 0.00 0.001.33 0.00 0.00 0.000.00 0.00 0.00 0.000.00 0.00 0.00 0.00
0 .00 0.000.00()1.0.00 ( )()(1 0.00 0.00
0.00 0.003.48 1.71
0.000.87
0.001.74
7.14 0.00 0.00 0.000.00 0.00 0.00 0.001.16 2.33 0.00 0.000.00 0 . 00 0 .00 0.00
0.000.00
0.000.00
0.000.00
0.00 0.00 0.0000.00 .00 0.00
0.00(
((1.00g 0.00))0 . 00 ( Z 0.00 0.00
0.00, 0.000.00 0 . 000.00 0.00
0.00 3.85
0.00 0.000.00 0.0 0
' 000 000. 0.00 0.000.00 0.00 0.00 0.00
0.01 0.271.08 0 .20
' 12,5)7 7,(m.;) 3,129 2,318
aersAfram HeadwtAmamn ShetterhettAngohen ShelterheitAnum SuAm.: i ;-i so Oro, ipAsenan yoAslikeeAtewn RangeAyiolia/Bediako/Nuensa
Ayum %
Ben GroupBandai HillsBia SoutfiBia TanoBoj TanoBain RiverBura RiverDome RiverFnm HeadwatersFore Headwater)-:,Jema Asemkrom '
krokusua HiltsHamang Ri verMamiri1,11xunesoNkrahiaOda RiverPea AnnmSubin/Denyau S'beit;Tain Trihutaries II;
:
Tano Anwiaf 36
Tano Snhien 22Tano Suraw ' 26Tinte Ben° 28Tonton 35 , '
Tottla Sholterholl 12Yoyo River 11)7
...

ble to quantify the numbers available in the two areas, foresters and canoe car-
vers confirm that the availability of large trees in the unreserved forest is much less
than the reserved forests and also under more indiscriminate pressure through
logging and in particular farming practices which involve burning off existing
ground cover. This is confirmed by canoe carvers who claim that previously, vir-
tually all canoes were constructed in the unreserved forest zone but now they are
being obliged to operate in the reserved forest if and when a concessionnaire will
allow them access.
Basing the discussion on 30,000 trees of a suitable size for canoe carving
estimated to exist, not all of those are available to canoe carvers. Ghana's de-
mand for foreign currency encourages exploitation of the reserved and unreser-
ved forest, but also the 15 years felling cycle introduced in 1971, was expressly to
reduce the number of large and overmature trees in the forest. Older trees while
still increasing in cubic volume, increase in diameter at a decreasing rate. They
are also much more susceptible to insect and fungal attacks and are less repro-
ductive.
The introduction of the 15 year felling cycle and its intended objection of eli-
minating large overmature trees was only partially effective due to the economic
downturn which starved the forestry industry of the necessary inputs for efficient
operation. Since the commencement of the World Bank Economic Rehabilitation
programme, forest industries have been reequipped and ageing plant and machi-
nery renewed, and the larger companies in particular are capable of extracting any
size of tree from their concessions. All sawmillers acknowledged that they prefer-
red as big logs as possible because the conversion rate was higher. Overmature
trees, however, often had defects and up to 70-80% could be of inferior quality for
sawmilling purposes.
7

With the introduction of a 40 year felling cycle in 1990, it is likely that the pres-
sure to fell large overmature trees for conversion will be reduced with loggers pre-
paring to extract trees in the 110-130cm size range which have a better and more
consistent quality.
The 40 year cycle will however operate against canoe carvers. In such a cy-
cle theoretically, only 2.5% of the reserved forest is under exploitation at any one
time. If all the 30,000 trees suitable for canoe carving were in the forest reserves
then in theory, if they had a uniform spatial distribution, an average of only 750
trees would be available annually. In fact, desirable stems for canoe carving are
concentrated to the west and north of Ashanti and Brong Ahafo Regions and all
the existing trees are not in the reserved forest area, and the main source of sup-
ply for the moment is from outside the reserves.
Thus the total number of large Wawa trees which are composed of those
present in the reserved and unreserved forest is being depleted rapidly by exploi-
tation outside the reserves. This will mean that the main source of trees suitable
for canoe carving will eventually be concentrated in the forest reserves which are
now subject to a 40 year felling cycle. Although unquantifiable, the reduction of
the number of trees in the free access area in the unreserved forest will reduce
the total available, and in consequence reduce the average number of trees an-
nually available from the reserved forest areas.
Even then all of the existing trees will not be available to canoe carvers, as
often concessionaries will not allow carvers access to their reserves and often
trees on felling are found to be defective and unutiliseable for carving. This is dis-
cussed in more detail below.
8

1.3 Perception on the availability and supply of Wawa to tile Carving
Industry
a) Timber Concessionaires
At present timber concessionaires provide a source of supply for large wa-
wa for canoe carving from within the forest reserves. However, the large compa-
nies are much better equipped than previously and are now capable of extracting
larger logs from more inaccessible sites. This coupled with a greater demand for
wawa export and local use, has reduced the potential supply of trees for canoe
carving. Conversely, however, timber companies often hesitate to cut large wa-
wa as overmature trees are often subject to heart rot and other defect. It is esti-
mated by canoe canters and loggers that 2 to 3 out of 10 overmature trees may
be found unsuitable for canoe carving once felled. These trees may also be miss-
hapen and of little value either to the logging companies or canoe carvers. Ne-
vertheless large trees are exploited by loggers, as these have a higher conversion
rate when processed.
Many concession holders even if they have large wawa suitable for canoes
in their concession will not allow carvers access because of the difficulty of con-
trolling the carvers' activities. Several companies only allow carvers to operate in
the forest if they themselves are active there, expressly so that they can monitor
the activities of the carvers. The main source of complaints was that carvers da-
maged other trees when felling wawa, but more importantly the access tracks cut
for the extraction of canoes allowed more rapid encroachment by farmers, villa-
gers seeking fire wood and illegal fellers.
9
Smaller, less well equipped companies on the other hand tend to "cream"
the forest, i.e. extract the higher quality timbers and leave (for them) trees of lo-
wer value. In this case small companies are more prepared to sell wawa to car-
vers especially if they do not have their own saw milts or if a saw mill is not located
at an economic transport distance from their concession. This is reckoned in Ku-
masi to be about 75 miles.
When trees are sold to carvers they will be charged 2000c-3000c per m3 for
each log in the forest. This will represent a price to the carver of up to 100,000c,
even more in some cases depending on the volume of the utilisable timber. In
some cases, a concessionaire will not charge for the trees cut by carvers but will
request that a canoe or canoes be carved for him to sell. This practice is not po-
pular with carvers, as it considerably reduces their profits. One particular compa-
ny demanded one canoe for every three carved - a proportion considered totally
uneconomic by the carving team involved.
Despite the fact that wawa supplies for canoes do originate in the reserved
forest zone, it is clear from interviews with carvers themselves that the main source
of raw materials originate outside the reserved forest and mainly from cocoa far-
ming areas, especially in farms with old, less productive cocoa trees which if da-
maged represents less loss to the farmers.
b) Canoe carvprs
A total of nine canoe carving teams were interviewed. These can be classi-
fied broadly into three categories; sedentary, indigenous part-time carvers and
farmers; formerly migrant carvers now sedentary, part-time carvers and farmers;
10

and highly migratory full time carvers. The first two categories were now confined
to operating in an area close to their adopted or home village and were now using
trees already known but rejected previously as being unsuitable, due to size or
shape. The impression was that the north and westward progression of the in-
dustry had passed them by and left them like flotsam stuck on a river bank. In
Obogu for example (south of Juaso and 160 km from the coast by road), the chief
carver had arrived 35 years previously with his father who was also a canoe car-
ver. At this time there was a total of seven groups in the area, now there are on-
ly three all of which engage in part time farming. The other four groups had already
moved on in search of a supply of large trees. As an indication of the quality of
tree now being used by this carver, within a 3-5 mile radius of the village, of six ca-
noes built in 1989 four were rejected by fishermen as being of inferior quality.
This and other sedentary groups were in contrast to the professional migrant
carvers who operated in an area until the supply of suitable trees were exhausted
and sent "scouts" ahead to contact concessionaires within promising forest areas.
It would have been thought that sedentary carvers residing in one village for
a lifetime or for a considerable period would have found greater difficulty in finding
suitable trees. In fact this was not the case, all said that they knew of 3-4 trees in
the vicinity but now had to travel further to operate.
On the other hand all migrant carvers complained of the scarcity of trees.
However, it was evident from the product that the migrants were interested main-
ly in large canoes i.e. + 16m, carving smaller canoes as a by-product when a large
log allowed more than one canoe to be carved or when a tree on felling was found
to be defective thus limiting carving to small canoes.
11

In all cases migrants stated that a move to another site was prompted by ex-
haustion of the available trees in their previous area of operation. This did not al-
ways mean that no trees existed, as on several occasions, carvers said that trees
were known in the forest reserves nearby but the concessionaires would not al-
low carving. Other reasons for moving were too many carvers in one area or the
available trees being too small. To justify a move three or four trees would have
to be on offer.
Apart from the verbal information given by carvers on scarcity of trees, other
corroborative evidence was noted. In one case a group originally from Prampram
numbering thirteen people and composed of three mastercarvers, four general
carvers and six apprentices, had taken temporary accomodation with their fami-
lies at Akrodie (in Brong Ahafo Region about 20km from Goaso). This group wal-
ked 16km into the forest to the hamlet of Kusikrom where they lodged for three to
four days walking each day three kilometres into the forest to carve. In the 1 month
they had operated at Kusikrom, three trees had been felled. Of these two trees
had been afflicted with heart rot. One was totally discarded, from the other two
they had managed to carve one large 17.2m canoe plus a 11m canoe from the
one sound tree, and a 12m canoe from the other which was affected by heart rot.
This group was now awaiting information on the location of further trees in the vi-
cinity. Also at Suntreso (in Brong Ahafo Region about 50km in the bush from Mim)
two groups of Fanti and Ga Adangme were located. The leader of the Fanti group
was working on his last tree, carving a 14.8m canoe for Senya Bereku and had
no more "in stock". His group of seven carvers had arrived here two months pre-
viously but had found only the one tree despite active searching. Already four of
the group had been sent home because of lack of work. The leader himself was
worried about the future of canoe carving and had resolved to return home to
Esetwe near Mankessim (Central Region) to take up farming, if carving prospects
12

did not improve. Within a kilometre of the Fanti group a sixteen-man Ga Adangme
group from Prampram were working. They had been here four months and had
carved 13 canoes from 8 trees. They were also working on their last tree but ho-
ped that tree spotters would inform them of others. Both groups were working in
unreserved forest near to a reserved forest under a concession in which they were
forbidden to fell.
c) Fishermen
In all 39 fishing villages were visited and meetings were arranged by Fishe-
ries Department staff with the Chief Fishermen and elders. All fishermen spoken
to were aware of the problem, some spontaneously stating that availability and in-
creasing price of new canoes were major constraints to their operations. In two
cases chief fishermen said that they did not think that they would be able to conti-
nue after 5-6 years. In several other cases it was stated that canoes are now being
repaired much more than previously due to the difficulty of finding replacements.
At Jamestown, it was said that up to 10 years ago fishermen used their canoes
for only 1-2 years and then would sell them on and buy a replacement. This is no
longer the case and the replacement figure is now around 10 canoes per year.
As indicators of the problem all chief fishermen in the Central and Greater Accra
Regions were asked a series of questions - Source of log supply 10-15 years ago,
and source now, price of canoes now, number of canoes in fleet, replacements
per year, and duration of a new canoe under normal circumstances. The re-
sponses are shown in tabular form in tables 1.2 and 1.3 and on the map figure
1.2. It should be noted that the source of canoes plotted is not exhaustive and
the plots refer to the nearest main settlement. The acutal source of the logs is in
the surrounding forest. If a centre of gravity analysis is performed on the data in
13

figure 1.2 the locus of canoe source between 1975 and 1980 has moved from
6°15'N; 0°45'W to 6°40'N; 2°15'N over the period. That is from a position with a
centre near Abomoso in Eastern Region in 1975 to near Kukuom in Brong Ahafo
Region in 1990 - a linear displacement in locus North and West of approximately
200 km. It should also be noted that the time of delivery refers to the time taken
between placing an order for a new canoe and its arrival at the beach if no inter-
vening problems arise. In many cases fishermen said that it took up to 2 years to
have a replacement, due to suitable trees being damaged or found with heart rot
on felling. Furthermore demand for canoes was so high that carvers would often
sell an ordered canoe to another fisherman if a higher price was offered and the
original buyer was not present.
It would seem that canoe supply has been seen as a problem for quite some
time. In 1982 for instance, the fishermen at Apam made representations to the
Fisheries Department to institute measures to ensure a sustainable supply of sui-
table logs for canoes. Also the fishermen at Teshie had brought up the matter
with the Chief Fisherman for the Greater Accra Region who had discussed the pro-
blem with the fisheries authorities and had even visited Japan to investigate the
possibility of introducing G.R.P. canoes to the canoe fleet. The most recent offi-
cial approach has been by the Gbese Fishermen Association which as recently as
February 1990, wrote to the Ministry of Agriculture on the matter of canoe supply.
14

-5°
CA
NO
E S
OU
RC
ES
3°2°
o
1-.\
Wia
wso
.0
0 O
buas
im
0
.1
oo
0K
ofor
idua
°0
_6o
a1
0 °D
unkw
aO
da
'10a
Enc
hi.i.
...,.,
)0
i0
;)°T
arkw
a(
0ii
Tec
him
an.0
O Sun
yanl
°O
Axi
m
2°
Sek
ondi
Cap
e C
oast
Win
neb
a
Tem
ao A
CC
RA
Ho
t
Ada
6°-
Ket
a
CA
NO
E $
OU
RC
ES
:
1975
-80
1990
5°-
020
4060
SO
kmI
II
II
0K
umas
i
0Mod
puas
o
Bib
iani
00°M
ompo
ng-7
0 /
00 0
0 0
Goa
so.0
0

16
Notes
A further 110 canoes from Komenda operate in foreign countries
Prampram is the main source of canoe carvers. Here the chief fishermanwas very reluctant to divulge precise information.
There are now only 12 canoes fishing from Kporgnya most fishermen have
migrated to the Volta Lake. The 50 canoes refered to were in the fleet previously.
Bortianor Low 100 3 - 4 4 - 6 + 800,000 C
Chorkor Medium 215 10 3 - 4 + 900,000 C 1 - 2
James Town Very high 10 4 - 6 + 900,000 C 4 - 6
Osu High 130 14 6 - 10 7-800,000 C + k
Teshi High 200 20 - 22 8 - 10 650,000-1.2M C +6Tema High 40 + 6 + 1.2 M C 6 - 12
Prampram (2) High 6 -
Kporgnya (3) High 50 4 5 - 7 + 1 M C 2 - 7
Akplabanya High 97 30 6 - 7 900,000 C 1 - 4
Base data on canoe Demand
TABLE 1.2
CENTRAL REGION
Vil lage Awareness Tot. N° Lo- Replacements Life Span Prices Deliveryof problem cal CANOES per year Yrs Time Months
Komenda (1) Very high 60 + 10 5 - 6 800,000C-1MC
Elmina Medium + 25 2- 3 + 10 800,000 C
Cape Coast High + 200 6 - 10 7 - 8 + 1 M C + 6
Motee High + 100 15 - 20 3 - 4 + 600,000
Biriwa Medium 84 + 10 5 - 6 + 700,000 1
Kromantse High 35 3- 5 5 - 7 + 1.2 M C
Ankaful Very High 38 8 - 10 5 1.1 MC - 1.3 MC 2
Otoam Very high 48 2 - 10 6-10 1.2 M C 1 - 6
Gomoa-Dago Very high 89 6 1.2 M C 3 - 6
Mumford High 30 Possible change over from Inshore Trawlers
Apam Very high 130 6- 8 720,000 C + 6
Winneba Medium 300 6 - 7 800,000 C + 6
Senya Bereku Medium 200 5 - 6 + 1 M C + k
GREATER ACCRA REGION

ALP
HA
BE
I IC
KE
Y T
O R
EA
SO
NS
IN L
AS
T C
OLU
MN
S T
AB
LE 1
,3
AS
carc
ity o
f Tre
es/B
ig tr
ees
are
scar
ce
Mat
ure
tree
s ar
e sc
arce
.
Hig
h tr
ansp
orta
tion
cost
of c
anoe
s/P
robl
ems
with
tran
spor
tatio
n.
Dep
letio
n of
nea
rer
fore
stsf
Tre
es a
re fu
rthe
r aw
ay/V
Ve
have
to m
ove
into
dee
p fo
rest
fTre
es a
re in
acce
ssib
le.
1-,D
Res
tric
tions
by
For
estr
y D
epar
tmen
t offi
cial
s.
EB
ecau
se o
f tim
ber
expo
rtat
ion.
Hig
h pr
ice
of c
anoe
s.
Due
to c
hang
es in
bea
ch, c
anoe
s ne
ed fr
eque
nt
repl
acem
ent.
Due
to s
mug
glin
g of
can
oes
to n
eigh
bour
ing
coun
trie
s.

Tab
le 1
.3-
CA
NO
E S
UPP
LY
S/N
O.
QU
EST
,
RF.
GIO
N
Wes
tern
Wes
tern
Wt±
U6'
ege
Wes
tern
Off
::
WeS
teiii
Wei
te
Wes
tern
VIL
LA
GE
I la
lf A
ssin
i
Hal
f A
ssin
i
Axi
m
-AA
OR
IGIN
OF
NE
W C
.AN
OE
VIL
LA
GE
Sef
wi A
sa w
i nso
Te
Fa
'666
Kw
amek
rom
Ter
a
Erw
hi
Nka
wka
w
Kw
amek
rom
Kof
i Bad
u k
rom ...
.
Ass
in F
oso
Akl
tnöd
g
Sefw
i Asa
win
so
,Hw
idie
m
Sefw
i-B
ekw
ai
RE
GIO
N
Wes
term
EaM
""
N/A
Cen
tral
Ash
a nt
i
Wes
tern
est&
ft:i
Ash
anti
Bro
n A
hafo "
Ash
anti
Wes
tern
Eas
tern
Bro
n A
hafo
Bro
n A
hafo
Wes
tern
Cen
tral
Eas
fern
Wes
tern
Bro
n A
hafo
Cdì
it
Wes
tern
MO
RE
DIF
FIC
UL
T
YE
SN
OIF
YE
S R
EA
SON
A, B
A, B

S/N
O.
QU
EST
.
RE
GIO
NV
ILL
AG
E
Page
2
12 W
este
rn
13 W
este
rn...
Sham
a
Sham
a
14 C
entr
alK
omen
da
16 C
entr
al
18 C
entr
al
Ank
aful
Scfw
i Asa
win
so
Scfw
i Asa
win
so
Sefw
i Asa
win
so
Hw
idie
m
Wt.
Dun
kwa
Scfw
i Wia
wso
Hw
idic
m
Jaka
i Whf
lA
kim
Oda
Scfw
i Wia
wso
Suny
ani
Nka
seim
Aki
m O
foas
e
Wes
tern --
Bro
ng A
hafo
Wes
tern
Wes
tern
Bro
ng A
hafo
Cen
tral
Eas
tern
%. Wes
tern
Bro
ng A
hafo
Yes
Mum
ford
Fssa
r
Aki
m N
tron
ang
Bro
ng A
hafo
Eas
tern
Cen
tral
...:0
50W
aVE
aste
rn
%
A, C
MO
RE
Dir
ncuu
rO
RIG
IN O
F N
EW
CA
NO
EIF
YE
S R
EA
SON
YE
SN
OR
EG
ION
VIL
LA
GE

S /N
O.
QU
EST
.
RE
GIO
N
21 C
entr
al
23 C
entr
al
25 C
entr
al
26 C
entr
al
VIL
LA
GE
Otu
am
Seny
a B
erak
u
Kro
man
tse
Bir
iwa
OR
IGIN
OF
NE
W C
AN
OE
VIL
LA
GE
Ose
inso
Goa
so
Aki
m O
da
Aki
m K
ade
Dun
kwa
Kad
e, N
kaw
kaw
444
Tep
a, K
umas
i
Goa
so
TtN
.. A
..D
un k
wa
Hem
an
Wia
wso
Se(
wi W
iaw
so
Sefw
i Wia
wso
Tep
a
Atit
iri
RE
GIO
N
Bro
ng A
hafo
4A'
Bro
ng A
hafo
rett
Eas
tern
Eas
tern
Cen
tral
Eas
terr
t
Ash
anti
Br0
11
Bro
ng A
hafo
Cen
tral tM
nigt
No
Info
rmat
ion
.401
411
Wes
tern
Wes
tern
Wes
tern
Ash
anti
MO
RE
DIF
FIC
UL
T
YE
SN
O
:!::
Pag
e 3
IF Y
ES
RE
ASO
N

S/N
O.
QU
EST
. 27 29 31 32
RE
GIO
NV
ILL
AG
E
A to
rkor
Vod
7.a
Ad
zido
Abu
tiako
pe
OR
IGIN
OF
NE
W C
.AN
OE
VIL
LA
GE
Tem
a
o in
fo.
,.
Tem
a
Akp
abla
nya
Nin
go, T
ema
Akp
abla
nya
Lol
onya
, Akp
abla
nya
C,o
nyi,
Ada
Maw
Akp
abla
nya
Ta
ples
o N
o2
Obu
ase
RE
GIO
N
Gt.
Acc
ra
Gt.
Acc
ra
Gt.
Acc
ra
Gt.
Acc
ra
Gt.
Acc
ra
Gt.
Acc
ra
Bro
ng A
hafo
MO
RE
DIF
FIC
UL
T
YE
S
Yes
NO
Page
4IF
YE
S R
EA
SON
J, D
Vol
ta--
-
Vol
ta
Vol
ta
Vol
ta
Vol
ta
Vol
ta
V 5
No
Gt.
Acc
ra

NO
Page
5IF
YE
S R
EA
SON
Yes
39 G
t. A
ccra
Old
Nin
go
Kum
asi
Ash
anti
Sunt
reso
Bro
ng A
hafo
......
..
42 G
t. A
ccra
Cho
rkor
Kum
asi
Ash
anti
5/N
O.
RE
GIO
NV
ILL
AG
EO
RIG
IN O
F N
EW
CA
NO
EM
OR
E D
IFFI
CU
LT
QU
EST
.V
ILL
AG
ER
EG
ION
YS
37 G
t. A
ccra
Anw
iam
Ash
anti
43 G
t. A
ccra
Coi
Yes
A, C
, K

2 RECENT DEVELOPMENTS IN THE GHANAIAN CANOE FLEET
2. 1 Developments in vessels and gear
The largest category of canoe in the Ghanaian artisanal fleet both in num-
bers and size is the Ali/Poli/VVatsa type. These local names refer to the type of net
operated. The Ali is a sardinella drift/surround net, while the Watsa and Poli are
purse seines, the main difference between the two being the twine and mesh size
used in their construction. The Poli has a much smaller mesh size and is used ex-
tensively for the capture of ancho', the Watsa mainly being used for larger sized
pelagic species . In fact it is now rare to find a pure Poli or Watsa net as fisher-
men are increasingly combining the different mesh sizes including even Ali in one
net, known loosely as a "mixed net". This obviates the need to change over spe-
cific nets for different species and seasons.
The average lengths of the various canoe types used in Ghana are given in
table 2.1
Table 2.1 Average size (in metres) of each category of canoe by Region
Region APW BS SN LN DGN
Volta 12.7 11.1 7.7 8.9 12.3
Greater Accra 14.1 11.9 9.7 9.9 10.7
Central 13.3 11.5 6.6 8.5 8.0
Western 13.6 9.4 7.4 7.8 8.9
Source : "A Report on the Ghana Canoe Frame Survey"
K.A. Koranteng and 0.0. Nmashie FRUB Tema
23

These average figures disguise large variations in lengths of canoes, also
grouping Ali, Poli and Watsa canoes together obscure the fact that Ali canoes are
generally smaller than Poli and Watsa canoes. Average canoe lengths also vary
depending on their home beach. Nevertheless, canoes have been tending to be-
come bigger in recent years, for several reasons. In the main the Poli and Watsa
nets in particular have increased in size over the last six to eight years from around
200-250 fathoms long to 400-450 fathoms and by 15 fathoms deep to 50 fathoms
deep. This increase in netting volume has demanded an increased capacity in
canoes for crew (up to and even exceeding 20 men) and increased catch.
New building, and recently acquired Poli and Watsa canoes were measured
at various beaches and in the majority of cases were over 15m. To obtain even
more capacity all canoes had topside planking to increase their freeboard. It was
noticeable however that the height of the planking increased the newer the ves-
sel. But on several beaches older canoes were also observed to be undergoing
heightening. Some measurements taken on Axim beach will illustrate the trend.
These are given in Table 2.2.
Table 2.2 Measurements of Canoes on Axim Beach
24
Age of Canoe Length Beam Beam Topside Planking
Hull/log Gunwale Height
10 yrs 13.9m 142cm 176.5cm 33cm4 yrs 15m 190cm 51cm4 yrs 16m 174cm 46cm1 yr 16.6m 198cm 250cm 66cm1 yr 17m 175cm 191cm 55cm1 yr 17m 180cm 218cm 63.5cm
New 16m 157cm 200cm 38cm

On many of these canoes and others seen elsewhere, the addition of plan-
king meant that the outboard motor was mounted on its bracket some way below
the gunwale, thus preventing the speed and steering control arm to be used in its
normal horizontal position. In these cases, the motor was operated and the ca-
noe steered with the control arm in the vertical position.
Observation of Poli canoes at moorings showed that many with nets on board
were heeling at an angle of 100 - 15° indicating a loss of stability. It was confirmed
by fishermen that the increasing height of planking had introduced greater insta-
bility and in some cases canoes were tested for stability during fitting out to ascer-
tain the most appropriate height of freeboard. Despite this, fishermen interviewed
denied capsizing at sea was more frequent than previously but now the fishing
operation demanded more agility on the part of the crew to prevent a canoe tur-
ning over, especially when fishing is heavy. Calculations made by the naval archi-
tect Gulbsandsen shows that these canoes are in fact inherently unstable and have
less stability than is considered a minimum by international safety standards and
will swamp at 40° heel.
When it is considered that a wawa tree of the necessary diameter for large
canoe carving can be well over 30m in length, fishermen and canoe builders, when
asked why canoes were not made longer instead of increasing freeboard, which
would give greater capacity without diminishing stability, gave two reasons - that
a larger canoe was difficult to steer and also that larger canoes can crack when
being beached on rollers or even at sea when perched on a passing wave. The
first reason is self evident, also foresters and wood technicians confirmed that the
longitudinal strength of wawa is limited due to its short fibres.
If indeed the length is conditioned by these factors then it is considered that
these canoes have reached a ceiling in their development. If nets are to get lar-
ger, requiring yet more space for crew and storage, it will not be possible to in-
crease capacity by heightening the canoes' sides. Either the artisanal industry will
25

stagnate at its present level of development or a vessel of a different design to re-
place the large dug out will have to be found.
2.2 Composition of the Ghana canoe fleet
Regular canoe frame surveys have been carried out in Ghana since 1969
and from these it is possible to have a time series of the composition of the canoe
fleet This is shown in Table 2.3
(1)
Source : "A Report on the Ghana Canoe Frame Survey"
K.A. Koranteng and 0.0. Nmashie FRUB Tema
(1) '1989 Figures from 1989 Ghana Canoe Frame Survey
Several observ'ers have remarked on the increasing number of canoes in the
APW category in recent years and the tendency is shown in the table. The main
reason for the increase up to the 1986 report is thought by the Fisheries Depart-
ment to have been the high cost of locally available inshore vessels and the lack
of spare parts to keep those in the fleet running. As an alternative, inshore ves-
sel owners and potential owners therefore invested in canoes.
26
Table 2.3 Composition of Ghana Canoe Fleet 1969-1989
Canoe type 1969 1973 1977 1981 1986 1989
Ali/Poli/Watsa (APW) 2315 2244 3005 3359 3969 3684Beach Seine (BS) 1587 1081 761 833 797 850Set Net (SN) 3347 2973 3532 1734 1852 1858Line (N) 734 767 1174 661 1004 1114Drift Gill Net (DON) 351 450 366
TOTAL . 7983 7065 8472 6938 8072 7872

The latest survey shows that the past trend has reversed. When all canoes
are taken into consideration including O.M.C. canoes the fleet has fallen in total
numbers by 162 or 2% over the 1986 numbers. The greatest decrease is found
in the APW. canoes which declined by 285 vessels, a reduction of 7%.
Several possibilities are given to explain these reductions. The high rate of
migration of canoes and canoe fishermen may mean that 162 canoes have left
Ghana to fish in neighbouring countries. Also some APW. canoes may have been
converted to line canoes as these are also becoming bigger to give more capaci-
ty for fuel and ice to allow extended trips. The other reason mentioned in the re-
port is that the figures represent a real reduction in the numbers of large canoes
operating due-to the difficulty in finding sufficient large wawa trees for replacement,
although it was thought that it was too early to attribute the decrease in canoe
numbers to this problem. According to fishermen interviewed during the course
of this survey, many were of the opinion that the high cost of fishing inputs was
discouraging new or replacement investment. This they claimed has slowed down
the growth in the industry as many fishermen cannot acquire new equipment. Al-
so the low returns for fishing makes it unprofitable for entrepreneurs to invest.
2.3 Prices in the Ghana canoe fleet
There are three basic investment costs in fishing operations: the canoe, the
motor and the gear. For the Poli, Ali, Watsa beach seine and drift gill net fishing,
the gear in fact costs more than the canoe, and to equip a new large Poli fishing
unit the cost would be between 6 million and 10 million C, depending on the size
of canoe and net used.
27

Figures for the 1989 canoe frame survey show the variation in prices for all
gear. Some are reproduced in table 2.4 below.
Due to the very high inflation in the Ghanaian economy during the last num-
ber of years, the cost of fishing inputs have risen dramatically over the period.
From the 1986 survey, the national average cost of fishing inputs ior an APW ca-
noe were: canoe 318,500 C; gear 976,750 C; and motor 211,500 C. The prices
in both the 1986 and 1989 surveys refer to new investment costs. During the pe-
riod from 1986 to 1989, the Consumer Price Index for Ghana has risen from a 100
base in 1989 to 229.9 in 1989. The development in the C.P.I. is shown in Table
2.5.
28
Table 2.4 Average national price ranges for different fishing operations
FISHING METHOD ITEM COST RANGE (in 000 C)
ALI _GEAR 50 - 6,000CANOE 160 - 1,500
WATSAGEARCANOE
170500
- 6,000- 1,800
POLI GEAR 400 - 8,500CANOE 500 - 1,800
LINE GEARCANOE
3
10- 1,000- 900
OUTBOARD MOTORS 160 - 575

Table 2.5 Ghana Consumer Price Index 1986 - 1989
Source: Based on IMF, International Financial Statistics, June 1990.
Using this index, the effect of inflation on fishing input costs can be calcula-
ted for canoes and outboard motors. This is shown in Tables 2.6 and 2.7. A si-
milar exercise cannot be performed for gear due to the wide variation in
specifications. Large canoes and 40 hp outboards have however remained stand-
ard over the period.
Table 2.6 Developments of canoe prices between 1986 and 1989
1986 1989
CPI 100 229.9
Cost APW canoes at
current prices 355,000 1,200,000
Cost APW canoes
constant 1986 prices 355,000 521,739
Cost APW canoes
if price followed 355,000 816,500
inflation
29
1986 1987 1988 1989
100 139.8 183.6 229.9

2.7 Development of outboard motor prices between 1986
and 1989
1986 1989
CPI 100 229.9
Cost 40 hp O.M.
at current prices 249,000 760,000
Cost 40 hp O.B. at
constant 1986 prices 249,000 330,000
Cost of 40 hp O.B. if
price had followed 249,000 572,700
inflation
Notes on Tables 2.6 and 2.7
1) Price of APW canoes in 1986 is taken from the 1986 Canoe Frame Sur-
vey. The highest price given i.e. for Greater Accra Region was used instead of
the national average of 318,500 C as the greatest average length APW canoes
were found in that region. The price of large APW canoes for 1989 is from verbal
information from fishermen and is considerably lower than the 1.5 m - 1.8 m price
range given in the 1989 Canoe Frame Survey.
30

2) The price of an outboard motor in 1986 is again from the 1986 Canoe
Frame Survey and again the highest price given is used instead of the national
average of 211,500 C. The current price of 760,000 is that quoted on the open
market by the Yamaha agency. The price is that of a 40 hp motor as used by all
APW canoes.
2.4 Explanation and significance of tables 2.6 and 2.7
Both tables show the changes in real and money terms in prices of canoes
and 40hp outboard motors in the period between 1986 and 1989.
In table 2.6 the cost of canoes in money terms has risen from 355,000 C in
1986 to 1.2 mC in 1989, a rise of 238%. After adjustment for the rise in inflation
the price in real terms is 521,739 C. If the price had risen consistently with infla-
tion the price would have been 816,5000. In fact therefore canoe prices at 1.2
mC have risen 47% more than inflation since 1986.
On the other hand the price of outboard motors in table 2.7 has risen in mo-
ney terms from 249,000 C to 760,000 C, an increase of 205%, while if the price in-
crease had followed inflation it should have been 572,700 C. Thus the price of
outboard motors has risen 33% more than inflation.
Both of these price rises indicate upward pressures other than inflation af-
fecting the prices of canoes and motors. The price increase in canoes however
is considerably greater than for motors. Also the figures in tables 2.6 and 2.7 have
been taken from the 1986 Canoe Frame Surey for a base price for 1986 and from
actual confirmed prices for 1989. In fact these figures may be conservative.
31

It is known for example that in 1986 the prices of 40hp outboard motors from
the Agriculture Develpment Bank and the Rural Development Bank were 360,000
C and 400,000 C respectively. If a similar exercise is performed using the average
price of 380,000 C then the 1989 price is in fact 15% lower in real terms. Similar-
ly the 1.2 mC canoe price may be too low. From the 1989 Canoe Frame Survey
the lowest price of APW canoes is given as 1.5 mC also canoe agents have confir-
med that prices of 1.4 mC are now common. If the exercise is repeated using a
current canoe price of 1.5 mC then in money terms canoes have risen 323%, and
in real terms by 84% in the period between 1986 and 1989.
These figures show that at best the price of the imported inputs (outboard
motor) while rising at a faster rate than inflation ove; the period 1986-1989 has
done so at a considerably lower rate than the home produced input (canoe. At
worst the outboard motor price has in fact fallen in real terms by 15% while the ca-
noe price has risen by 84%.
Whichever scenario is chosen it is clear that canoe prices have been subject
to underlying upward pressure considerably in excess of inflation. The main cost
in canoe carving is the cost of the tree which represents some 60% of total cost
in the carving process (excluding labour costs which are minimal). It may be as-
sumed therefore that the increasing cost of canoes in real terms is due to the in-
creased cost of wawa trees.
This assumption is confirmed by canoe carvers and agents who have stated
that landowners and concessionnaires now had a greater awareness of the de-
mand for large wawa and realised its scarcity value for carving and had respon-
ded by increasing prices. This is in contrast to the situation a few years ago when
farmers especially were happy to sell a tree for a small sum to carvers as, to the
32

farmers the tree represented no value and would be burned or felled in any case
to clear land for crops.
2.5 Implications of recent fishery and forestry trends for the
continued supply of Ghanaian dug-out canoes
From the foregoing in Chapter I the forestry policy in Ghana was to eliminate
the large wawa trees in the forest. This was the explicit reason for the introduc-
tion of the 15 year felling cycle in 1971. This was partially successful and led to a
reduction in the large trees needed for APW ( +15m) canoes, now mostly in de-
mand. With inputs becoming more freely available through the World Bank Eco-
nomic Recovery programme and the Export Income Retention scheme, the forest
in general is becoming more effectively exploited. In fact now the annual cut is
near the allowable cut.
Recently a 40 year felling cycle was introduced by the Forestry Department.
This will have the effect of "locking up" existing large wawa trees in the reserved
forest compartments not under exploitation and where felling is prohibited. This
will put even more pressure on the remaining trees outside the reserved forest
area, so reducing the total numbers available.
At present the minimum felling size for wawa is 11' girth (107cm diametre).
If therefore all trees above 107cm diametre are cut during the felling cycle and
those remaining are allowed to grow for a further 40 years, this will result in an ex-
ploitable resource of trees between 107cm and approximately 140cm to be har-
vested in the next felling period. This is the situation in an efficiently managed
forest, but it is unlikely that no trees of over 140cm will remain after this period,
33

their number will however be drastically reduced and they will occur sporadically
with greater densities in inaccessible or difficult areas.
The main source for an uninterrupted supply of logs for dug-out canoes will
therefore eventually come from the trees of a size between a minimum of 107cm
and 140cm. No accurate data exists on how long the remaining large, ie. + 165cm
diametre trees will last. In theory, with a 40 year felling cycle some should still be
in existence in 40 years time. The total quantity however will be reducing in the
interim.
Briefly the situation is one where the largest trees + 165cm - those in de-
mand by canoe carvers - are under pressure and will continue to be so. These
will not be allowed to regenerate due to forest policy. The climax vegetation which
resulted in the existence of these large trees will then be replaced by a cultured
vegetation, managed specifically to prevent their emergence. In the not too di-
stant future therefore, the sustainable supply of logs suitable for canoe carving will
be culled from the forest resources of wawa of between 107cm to 140cm with pro-
bably an intermittent but diminishing supply of larger logs.
The implications for the canoe fleet will be far reaching. Below in Table 2.8
is given length to beam ratios of canoes measured at four different sites. At Ja-
mestown (Lighthouse Beach Accra) and at Ankaful the smallest of the APW ca-
noes on the beach were measured and at Akplabanya the measurements were of
six new Watsa canoes either completed or being finished off. In Benin the mea-
surements of smaller canoes with a beam of between 80m and 1.30m were mea-
sured. This beam would correspond approximately to trees between 107cm and
140cm after removal of bark and trimming during carving.
34

Table 2.8 Length to beam ratios of canoes at selected sites
Ankaful James Town Akplabanga Cotonou
Poli canoes Poli/Ali Watsa Line/Set net
From the table above all APW canoes measured had been carved from trees
with diametres in excess of 165cm. At Ankaful and Jamestown the measurements
were taken from the smallest of this type of canoe.
At Jamestown a selection of the largest line canoes were also measured and
from the table the majority of these also required trees in the 165cm diametre
range.
Comparing the Cotonou data with the figures in Table 2.1. indicates that gi-
ven the size range of trees which will eventually be available it will still be able to
build canoes of up to 12.8m in length. This would imply that the smallest APW ca-
35
L B 14.0 1.47 15.4 1.83 6.83 .80
15.77 1.65 13.0 1.66 15.85 1.68 7.68 .86
16.45 1.77 11.6 1.51 15.35 1.76 6.70 1.06
15.70 1.78 12.8 1.66 13.40 1.68 7.37 1.10
12.90 1.59 12.4 1.43 14.30 1.63 9.57 1.14
14.00 1.69 Line Canoes 15.56 1.93 11.55 1.24
13.80 1.76 12.5 1.49 11.36 1.25
14.10 1.91 12.6 1.60 11.05 1.30
14.00 1.66 13.8 1.61 11.45 1.30
14.77 2.23 13.1 1.64 12.80 1.30
15.50 1.99 13.5 1.77 10.43 1.31
12.5 1.57
13.5 1.60

noe could still be built. In effect however the beam of 1.30m is much too narrow
for Watsa and Poli fishing, particularly with the bigger nets now in use, and be-
sides it has already been noted that the demand now is for much larger APW ca-
noes. It will therefore not be possible to continue carving these larger canoes
indefinitely with the available forest resources, which will eventually exclude all ca-
noe carving above the larger Beach Seine canoes. However, it is not only the
APW canoes which are increasing in size. As is shown from the data for James-
town many large line canoes now also have a beam of over 160cm. These also
have side planking fitted to allow extended trips through increased capacity for
fuel, bait, and crew members.
If this trend continues then many line canoes may also fall outside the size
category of tree available. This will leave the smaller sized Beach Seine canoes,
smaller line canoes, set net canoes and drift gill net canoes as the categories which
it may be possible to carve given the tree sizes available. This will mean that on-
ly the smaller sized canoes will be available in the future which will in effect regress
the industry by eliminating the larger most productive fishing units.
36

3 THE MARKET IN GHANAIAN CANOES
3.1 Canoe Supply
From the known numbers of canoes in the Ghanaian fleet and those Ghana
canoes operating in other countries, around 10,000 in all, an earlier exercise esti-
mated around 1000 canoes were needed as replacements annually. This rough
calculation was based on an expected average life span of 10 years for a canoe.
The average life span was estimated taking into consideration the canoes which
operated mainly from ports and sheltered creeks which it was thought had a du-
rability of up-to 15 years, and those which landed in harsher open conditions with
a life of 4 to 6 years.
With more research and a structured survey of canoes being transported to
the coast a more detailed analysis could be made although an element of estima-
tion still had to be introduced as all the factors could not be precisely quantified.
The canoe transport survey consisted of issuing log books at the permanent
police and Forest Products Inspection Bureau (F.P.I.B.) checkpoints. The log
books recorded the date, lorry number, source, destination and number of ca-
noes being transported on each vehicle which passed. This combination of infor-
mation allowed canoes to be traced as they passed subsequent barriers and
prevented double counting.
In general, the system operated adequately although in some cases it was
reported that canoes could pass and not be recorded if traffic was heavy. Also
37

some periods would elapse with no registration if, when police personnel were ro-
tated the outgoing officers failed to instruct their relief officers. On the Kumasi-Ac-
cra road where the majority of canoes pass, this did not present a major problem
as the log books kept at Asankora and Achimota police barriers could be used to
corroborate each other. At the other barriers where canoes passed less frequent-
ly it was difficult to determine whether canoes had not been registered or whether
canoes were passing intermittently. Apart from Asankora and Achimota barriers
log books were also placed at Maree and Apramdu (Takoradi) police barriers and
at the FPIB kiosks at Inchaban and Agona Junction (VV/R).
The FPIB officials and the police admitted that on several occasions, espe-
cially concerning FPIB, canoe transporters did not stop to be checked although
by law they were obliged to.
A further limitation to total coverage .was the absence of any permanent or
other checks on several of the main (but badly surfaced) roads running sou-
thwards in the Eastern and the Central Regions. It is known that canoes are trans-
ported on these roads but no quantitative information could be obtained.
Despite the limitations encountered with the survey, a clearer picture of the
source and distribution of canoes has been obtained and a more accurate esti-
mate of annual replacements can be calculated.
The most comprehensive information was collected from the two che-
ckpoints on the Kumasi to Accra road. Because of two independent registrations
it was possible to compare the data to arrive at an accurate figure for canoes trans-
ported during the survey period, their source and destination. The survey began
at Achimota on 28 February 1990 and at Asankora on 18 May 1990. The data was
38

analyzed up to 13 September 1990. In total therefore the survey was continuous
for 197 days at Achimota and 119 days at Asankora. Because of the greater ac-
curacy in using corroborative data the period between 18/5/90 and 13/9/90 was
analyzed, and the additional data for Achimota was excluded.
3.2 Numbers of Canoes recorded - Kumasi-Accra Road
From the Brong Ahafo Region any canoes passing towards Accra must pass
the Asankora barrier. On the other hand, canoes can join the road below Asan-
kora and not be recorded until they reach Achimota, unless they branch off at Nsa-
wam. These canoes will be recorded neither at Asankora nor at Achimota. It is -
known that this does occur but quantification is not possible.
The methodology was to count all canoes recorded at both barriers and add
those only recorded at Achimota or Asankora to the combined total. This gave a
total number of canoes which passed along the Kumasi-Accra road, some of which
may have been recorded at Asankora but branched off to the Central Region, while
others may have joined the road below Asankora but which were recorded at Achi-
mota. The totals for each check point therefore differ.
This arithmetic gave a total number of 189 canoes passing Asankora during
the period and 199 passing Achimota.
The average number of canoes passing therefore would be the totals divi-
ded by the days of the survey. However, it is thought by comparison of the infor-
mation in the log books that each check point collected no data for one week, but
not the same week in both cases. This is shown by the non correspondence of
39

traffic passing through the different barriers. This would therefore give a total sur-
vey period of 112 days and not 119.
The average number of canoes passing per day at Asankora therefore is
1.59 if a survey period of 119 days is taken and 1.69 if 112 days are taken. Simi-
larly for Achimota the average daily figures are 1.67 and 1.78. On an annual ba-
sis, this would give totals of between 580 and 616 canoes passing Asankora and
610 to 648 passing Achimota. If the average of the two extremes are taken, this
gives an annual total of 629 canoes transported along the Kumasi to Accra road.
3.3 Number of canoes recorded - other checkpoints
For various reasons explained above the survey was not so systematically
carried out at other check points and also an important area in the Central Region
was not covered because of the absence of police and FPIB controls. Neverthe-
less, analysis of the data and annualising using the methodology above gives an
additional 206 individual canoes reaching the coast. In fact the total passing
through exceeds this as canoes which were registered at one barrier were seldom
noted at a following barrier which the canoe had to pass in order to reach its des-
tination. The margin of error is impossible to quantify precisely but FPIB officials
estimated independently that at least 50% of canoes were not noted, either be-
cause the vehicles failed to stop or deliberately passed at first light before the of-
ficials were on station, after parking overnight as required by the transport
regulations.
40

3.4 Demand for Ghanaian Canoes
From the foregoing the canoe transport survey has shown that at least 835
traceable canoes are being shipped annually from the forest. But it is known that
this figure underestimates the actual numbers.
Analysis of the data from the Kumasi-Accra road over the 119 survey period
shows that 32% of some 630 canoes transported were destined for the Central
Region and 68% for the Grepter Accra Region.
If it is assumed that the 428 canoes destined for the Greater Accra Region
are the annual replacements necessary for the Greater Accra and Volta Region
fleets (V/R is- supplied by canoes from GA/R), then simple division of the total fleet
in those districts 3690, (1989 Canoe Frame Survey) by 428 gives a coefficient of
replacement of 8.65 which in fact would be the life span of a canoe.
This duration is much higher than that given by chief fishermen interviewed
in the Greater Accra Region, who put the life span, depending on the village beach
conditions, at a minimum of 3 years and a maximum of 10 with a general average
of 6-7 years.
In the Central Region 202 canoes were supplied via the Kumasi-Accra route
and 52% of the other 206 traced canoes were destined for Central Region, which
gives a total of 309 known canoes arriving at the Central Region. Based on a to-
tal fleet of 2717 canoes (1989 Canoe Frame Survey). This would give a replace-
ment coefficient/life span of 8.79. Again this average figure is high compared with
the average figures of 5-7 years given by chief fishermen in the Central Region.
41

Both figures are further suspect when it is considered that they are derived
from a calculation based only on canoes actually in the country. In fact there are
sizeable Ghanaian canoe fleets based in neighboring and other countries. In most
countries accurate figures do not exist. However, from various sources, an at-
tempt has been made to estimate the number of Ghanaian canoes in operation
along the west coast of Africa. This is shown in table 3.1 below.
Table 3.1 Ghanaian canoes present in various West African countries
Country No of canoes Source
Ghana 8052 (1)
Togo 462 (2)
Benin 654 (3)
Côte d'Ivoire 706 (4)
Liberia 268 (5)
Congo 139 (6)
Cameroon 100 (7)
Gabon N.K.
Nigeria N.K.
Total 10,381
Ghana Canoe Frame Survey 1989: K.A. Koranteng
Rapport national du Togo : K. Amégavié 1984
Rapport sur les études Socio-Economiques du milieu des Pecheurs Ma-
rins au Bénin Août 1988: Direction des Péches Cotonou R. Bénin
42

Report on the Technical Consultation on Pelagic Resources in the Côte
d'Ivoire, Ghana, Togo, Benin area 6-9 September 1988. This figure represnts on-
ly pelagic canoes the total number of canoes is likely to be substantially higher.
Report on Artisanal Fisheries Sector Study Liberia: McAlister Elliot and
Partners June 1988.
Individual and Social attitudes of Fishermen Towards new techniques :
P. Jorion 1985.
Figure supplied by A. ljff, IDAF Socio Economist 1990.
The above total can only be considered as an estimation of the total number
of Ghanaian canoes on the coast and it is probably an underestimation but also
it is possible because the sources are widely divergent chronologically that some
canoes have been double counted due to migration. This proportion neverthe-
less is likely to be small.
If indeed the life span of a canoe is in the region of 8.7 years as is sugges-
ted by the figures then the annual demand would be around 1200 canoes of all
sizes. If as is more likely, the life span is nearer the six to seven years as given
independently by chief fishermen interviewed, then replacement would require
some 1600 canoes annually.
If canoe fleets in other countries are composed similarly to that of Ghana
then around 50% will comprise large APW type canoes which require the largest
size logs of 165cm and over in their constuction. This would indicate that a total
annual log supply of 600 to 800 would be needed to replace the existing fleet. If it
is considered that 20% to 30% of trees on felling may be found unsuitable for car-
43

ving due to felling damage or rot then the total number of large trees required will
be between 750 and 1000.
Even if the 30,000 trees of the large size estimated to exist were all available
to canoe carvers this would only provide a supply of logs for between 30 and 40
years.
However under the 40 year felling cycle, if it is assumed all the 30,000 trees
are in the reserved forest only 750 trees will be available theoretically to the entire
industry including canoe carvers of which 25% may be unusable due to various
defects. But the 30,000 trees are distributed in unknown proportions between the
reserved and unreserved forest with the supply in the unreserved forest being de-
pleted rapidly. In consequence when the main supply will eventually come exclu-
sively from the reserved forest the total number of suitable trees will be substantially
less and also their annual availability will be reduced.
3.5 Source and Distribution of Ghanaian Dug-out Canoes
Over the last 15 to 20 years the locus of canoe carving operations has mo-
ved gradually north and west from the Central and Eastern Regions to the present
concentration in Ashanti and Brong Ahafo Regions and to the north of Western
Region. The changing pattern as perceived by fishermen is shown in figure 1.2.
More detail of the source and distribution of canoes was obtained from the canoe
transport survey, especially from the police check points at Achimota and Asan-
kora. The geographical pattern of source and distribution of the canoes registe-
red at these two checkpoints is shown in figure 3.1.
44

The map was compiled using all canoes registered including those passing
Achimota prior to 18/5/90.
In all a total of 251 individual canoes were registered during the total 197 days
of the survey. Thirty-eight canoes registered could not be traced to source as the
village/hamlet of origin could not be located. These were known however to have
passed Asankora and therefore the flow diagram has been increased by 38 at this
point.
Of the 251 canoes traced, 224 originated in Ashanti and Brong Ahafo Re-
gions and north of the Western Region from around Beyerebon.
The most distant sources were from Wamfie and Suntreso some 400 km
from the coast at Accra and only 30-40 km from the Côte d'Ivoire border.
Even when reaching the coast the canoes can be transported considerable
distances. The two canoes delivered to Axim in Western Region for example ori-
ginated from Goaso in Brong Ahafo Region. Thus the total distance travelled by
these canoes was nearly 600 km.
A significant feature of the distribution pattern of canoes along the coast is
the high number which go to the Greater Accra Region, especially between Accra
and Ada. This region accounts for 76% of destinations. To some extent this is
explained by the registration of canoes passing only through Achimota before
18/5/90 when a certain proportion can be expected to have passed off to the Cen-
tral and Western Regions above Achimota. Nevertheless the relatively and abso-
lutely low figures for canoes destined for the Central and Western regions from
the Kumasi-Accra route indicate strongly that other routes exist. This is confirmed
45

by the high incidence, 43% of new canoes originating in the Western and Central
Regions' forests and destined for fishing communities in these regions, as shown
in Table 1.3.
Of the high number of canoes arriving in the Greater Accra Region not all will
be to replace existing canoes at their destination. At Kpone, Tema and Prampram
there are groups of carpenters who specialise in finishing off canoe hulls from the
forest. A proportion of canoes arriving at these sites therefore will be completed
there before entering the local fleet or being distributed to their final destination.
Some of these will go to the Central and Western Regions, although reciprocally
ca.noes from these regions will also enter the Greater Accra fleet. The majority of
canoes arriving at the Greater Accra Region however will stay, to replace ageing
canoes which will be scrapped or sold on as second hand depending on their
condition.
There is for example a strong demand for second hand canoes in Volta Re-
gion where beach seining is predominant. This type of fishing, operated close to
the shore and often non motorised, does not demand such a strong and seawor-
thy canoe as would purse seining or deep sea hand lining. Thus it is often possi-
ble for a 2-3 year old sea-going canoe to be sold second hand to beach seine
fishermen to be replaced by a new, more dependable vessel. The beach seine
fisherman thus buys a cheaper canoe which he can use for 4-5 years.
There is also a considerable trade in canoes from the Greater Accra Region
with neighbouring countries. In 1989 for example, it is known that 9 Poli canoes
were fitted out at Lighthouse beach for Nigerian buyers from Calabar. These ca-
noes now operate with Accra fishermen hired to train Nigerian crews. Other vil-
lages also have trading links with neighbouring countries such as at Anyaman and
46

Ningo where canoes are sold to Côte d'Ivoire, and to countries to the east as far
as Cameroon.
This trade can involve second hand or new canoes but according to fisher-
men and canoe carvers the demand for export is always for the larger sizes of
craft.
47

-7*
_6*
_5°
3. I.W
omfle
.
BR
ON
G A
HA
FO
Sun
tFO
SO
.Ber
ekum
/2uo
mea
ora
/6
#K.u
M
GO
Gs°
51
sekw
ai
loi
: As 0
r e
S:14
411)
:111
2 4
°
vpin
KU
MA
SI
/1//2
149
mpr
OeS
°
.410
1"Z
7-44
».
04.4
.4.:.
<$,
:*°*
.te'1
:$.
RE
G' -
N
'
ro\
Akr
odie
46
_do,4
NY
in°h
in
RE
GI"
obo,
gu
algf
t4
EA
ST
E0R
N
wia
ws°
°
.J21
.è."
gibi
c/n"
433'
)
Boy
erb
LA
SH
AN
TI
o..\ ../
(.0
bogu
suhu
m14
44. Itt.:1
CO
TE
oivo
iRE
Hal
fA
ssin
i
6
Bra
nsak
ro
RE
GIO
N
f
o
4.1:
40:0
4kk,
ximSU
NY
AN
I
t-
3°2°
//M
ampo
ng. / ' C
EN
TR
AL
RE
GIO
N\.
.Tor
kwa
-5
.Fos
o
. -15
4/,,4
;956
06:Z
i:00
,...
-1.
46 0
.0,:2
0- C
127:
c*:::
°49'
2(71
.,o
°°
5
..-N
I
6.
0
...-2,
- ,-
..-k
* So
r»
OA
,G
GH
AN
AIA
N D
UG
OU
T C
AN
OE
S:
SO
UR
CE
AN
D D
IST
RIB
UT
ION
PA
TT
ER
N
0da
Asa
man
kese
.
o a
Ach
imot
o
of. o,
90,
/0.0
006
',ì6,
4.0
o
O.
.KO
FO
RID
UA
247
o°
RE
GI°
N
L
41;4
1ot
N2
2s52
oI7A
8 cC
RA
:g
5k
o6
J-o
4044
:0t..
-0t)
to.W
.14.
1111
0
RE
G/"
22
204-
0IK
ilom
etre
s
1020
3040
Mile
s
70
VO
LT
A
5°-
'W
ES
TE
RN
RE
GIC
IN
. Eno
hi

4 CANOE CARVING INDUSTRY
4.1 Organisation Strupture of the Ghanaian canoe carving
industry
There is no doubt that the dugout canoe has featured in Ghana's fisheries
and trade since earliest times. In Cape Coast Castle reproductions of early 16th
century prints by Visscher depict canoes much as can be seen today and in the
17th century Shama on the Prah River was a centre for the supply of large cargo
carrying canoes. (see Albert Van Dantzig - "Forts and Castles of Ghana" P19. In-
cidentally canoes are still carved in the Agona area of the Central Region and floa-
ted down the Prah to Shama).
It is generally agreed that the industry was begun by the Fanti peoples in the
Central/Western Region of what is now Ghana and the trade did not spread to the
Greater Accra Region particularly Prampram (Ga Adangme people) until the late
19th century.
The present industry is characterised by a continuance of Fanti and Ga
Adangme in the trade with greater involvement of the latter. There are also some
Ashanti carvers involved. It has been estimated that for Prampram about 600 per-
sons are engaged in canoe carving. This represents the greatest concentration
of carvers in Greater Accra Region although other neighboring villages also have
their carvers such as Kpongunor (5 groups) Ahwiam (3) Mangotsonya (4) Old
Ningo (2)(personal communication chief Fishermen Gbetete Obodai, Kpongunor).
49

In the Central Region the industry is less concentrated with a centre at Man-
kessim and individual and small groups of carvers based at or migrating from be-
tween Twifo Praso and Jukwa. Figures for these groups are not available but there
are about 10 sedentary part-time carvers based between Jukwa and Twifu Praso,
with other unkown numbers of groups having migrated as part of the general north
and westward movement in search of a better supply of larger trees.
4.2 Migration in the Canoe Carving industry
Although some Ashanti carvers are involved in the trade and who are resi-
dent in the forest area, the greatest proportion of carvers came from the coastal
villages especially in the Greater Accra Region. Until about 25 years ago the main
source of canoes was from the Eastern Region around Suhum and Koforidua sup-
plying the Greater Accra Region and around Oda also in the Eastern Region sup-
plying the Central Region. Although some canoes, mainly smaller, are still carved
in these areas the majority are now coming from Ashanti and Brong Ahafo Re-
gions. In the canoe transport survey the furthest distance travelled by a canoe to
the coast was from Wamfie in Brong Ahafo to Chorkor in the Greater Accra Re-
gion - a distance of 400 km by road.
The need to travel to find trees and the sporadic nature of their occurrence
introduces a high degree of migration into the carving industry, with groups ope-
rating in an area for some months or even up to a few years and then moving on
to other areas where trees can be found. Also when based in an area there is a
certain degree of temprorary migration from the established base to temporary
bases ocupied on a weekly or monthly periods while trees are being carved. While
50

the short term migrations involve relatively short distances perhaps up to 20 km,
long term migrations cover considerable distances.
The migration pattern of three master carvers are shown in the map figure
4.1. In each case it should be noted that the general pattern is north and west in
each case.
4.3 Relationships in Canoe Carving groups
Of the nine groups and individual carvers interviewed only three groups clai-
med close family relationship. One Fanti group of three people now based at Wia-
maso (AIR) and originally from Mankessim, a group of 15 originally from Prampram
and a three-man group at Obogu which was composed of the leader and his bro-
ther and a close friend. In the Prampram group the leader was the father of one
chief carver and the father-in-law of the second. Other members of the group in-
cluded nephews and cousins.
Although the other groups did not claim relationship to each other it is safe
to assume that their origins in the same small village conferred some sort of kins-
hip however far removed. Individual sedentary carvers tended to work inde-
pendently but pooled their labour to execute heavy work during the carving
process. Although it was confirmed by chief carvers in Prampram and others in-
volved in the trade that the industry was not generally organised on family liaisons
(which would have been expected in such a traditional artisanal industry) the point
was made that groups which were closely related tended to operate more harmo-
niously with problems being regulated within the family.
51

3°
CA
NO
E C
AR
VE
R M
IGR
AT
ION
PA
TT
ER
NS
..Sun
yani ....
--s.2°
I°0°
I°
3..
Mam
pong
ss3,
Of i
n so
Go.
aso
.Kum
asi
tt-
San
kori
Wia
wso
.
.Mpr
aeio
.Ho(
.
Bib
iani
%N
. Kof
orid
ua
.Asa
man
kese
.Dun
kwa
Sek
ondiMan
kesi
m.O
da.
Cap
e C
oast
2°I°
AC
CR
A 0°
7°
Pra
mpr
am
\.
020
4060
80
km1
11
11
Car
ver
with
+30
yea
rs e
xper
ienc
e
Car
ver
with
lOye
ars
expe
rienc
e<
Car
ver
with
6 y
ears
exp
erie
nce

In all groups a hierarchical division could be detected with two to three car-
vers capable of carrying out all tasks required from felling the tree (considered the
most dangerous and skillful operation) to finishing the hull. The general carvers
were able to use the basic hand tools to the finishing stage while the apprentices
performed general tasks such as labouring and cooking to rough excavation with
the general purpose adze (Asorkwa, Fanti; Omee, Ga Adangme).
It would appear that no formal apprenticeship system exists. An aspirant
carver can join a group at virtually any age and progress though the various skill
levels taking 2-4 years to become an accomplished carver depending on his ca-
pabilities and assiduity. However in some cases group members never master
the craft totally and remain "apprentices". When an apprentice is regarded by his
master carver to have attained the necessary skills he is handed the long handled
chisel (Apam, Fanti; Tii, Ga Adangme) by the master as a sign of his acceptance
as a master carver.
Formerly, before an aspirant carver was accepted as an apprentice, it was
the practice to give a cock and two bottles of schnapps before being accepted by
a master carver for training. This form of indenture is now largely ignored as is
the previous practice of a former apprentice, on setting up his own carving group,
to donate his first canoe to his previous master.
4.4 Share system in the Carving industry
The various skills within a carving group is reflected in the payments recei-
ved. In general sedentary carvers will share profits equally once the canoe has
53

been completed and sold. Professional migrant groups however tend to share
the cumulative profits of the carving season at the annual Homowo (Ga Adangme)
festival (July/August). In fact this festival marks the end of the carving season for
some professional groups who will recommence operations in December and Ja-
nuary giving a carving season of six to eight months, most carvers however re-
turn to the forest once the festival is over.
Several methods of sharing profits were described but in all cases the mas-
ter carver received the greatest share as would be expected. It was stated that
before introduction of the chain saw (early 1970's) the master would take 2 shares,
one for himself and one for the tools which he supplied. One other share would
go to the craftsman and the apprentices. At this time a carving group would
consist of one master supported by one craftsman, the rest being apprentices ma-
king in some cases a total group of twelve persons. The remaining share would
be divided usually in the proportion of 40% to the craftsman and 60% divided be-
tween the apprentices with the master deciding the allocation to each individual.
With the advent of the chain saw the most common practice now is for the saw it-
self to receive a share so that in the above case the master would receive 2 shares
as before, the chain saw one share and the remaining share again divided accor-
ding to the master carver's decision. In other cases the first canoe of the season
would be sold as a working capital fund for the repair of the chain saw; any sur-
plus remaining at the end of the season going to the master. A particularly pre-
cise breakdown of the share system was given in Kpone where a group of five
carvers comprising a master carver, three craftsmen and one apprentice applied
the following system;
54
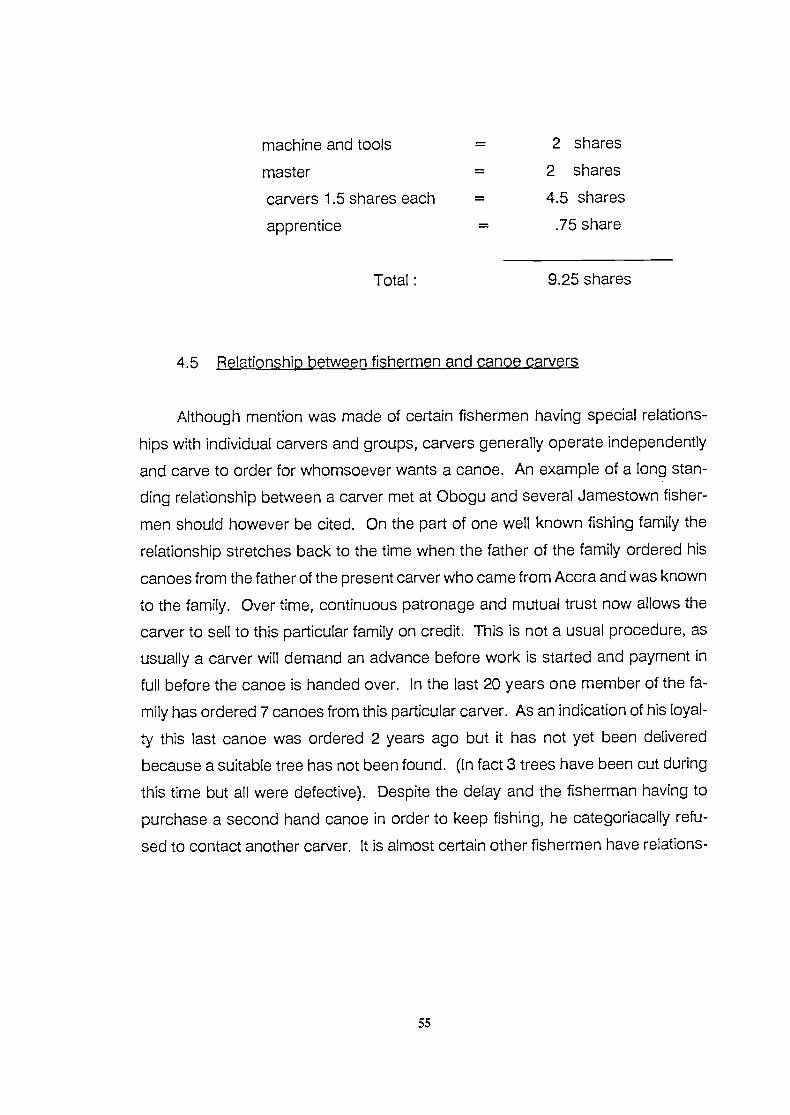
machine and tools = 2 shares
master = 2 shares
carvers 1.5 shares each = 4.5 shares
apprentice = .75 share
Total : 9.25 shares
4.5 Relationship between fishermen and canoe carvers
Although mention was made of certain fishermen having special relations-
hips with individual carvers and groups, carvers generally operate independently
and carve to order for whomsoever wants a canoe. An example of a long stan-
ding relationship between a carver met at Obogu and several Jamestown fisher-
men should however be cited. On the part of one well known fishing family the
relationship stretches back to the time when the father of the family ordered his
canoes from the father of the present carver who came from Accra and was known
to the family. Over time, continuous patronage and mutual trust now allows the
carver to sell to this particular family on credit. This is not a usual procedure, as
usually a carver will demand an advance before work is started and payment in
full before the canoe is handed over. In the last 20 years one member of the fa-
mily has ordered 7 canoes from this particular carver. As an indication of his loyal-
ty this last canoe was ordered 2 years ago but it has not yet been delivered
because a suitable tree has not been found. (In fact 3 trees have been cut during
this time but all were defective). Despite the delay and the fisherman having to
purchase a second hand canoe in order to keep fishing, he categoriacally refu-
sed to contact another carver. It is almost certain other fishermen have relations-
55

hips like this with carvers but on the whole they will be exceptions rather than the
rule.
Normally a carver will build to order. The approach can be in two forms; ei-
ther a fisherman will seek out a carver either by chance or through recommenda-
tion from a satisfied customer and will order his canoe directly, specifying the beam
and length and other characteristics. On the other hand, the carver after finding
a suitable tree will then visit the coastal areas, usually in his home region to seek
out buyers.
Once the three vital ingredients of carver, fishermen and tree are brought to-
gether, the business arrangements begin.
Generally but not always the fisherman will accompany the carver to the fo-
rest to inspect the tree and if acceptable will request that it is felled. The fisher-
man will then specify the shape of canoe required. This is done by roughly
indicating the height at bow and stern by body measurements e.g. bow to be at
forehead height, amidships at midriff height and, stern at chin height. (No mea-
suring tapes or other conventional measures are used at any time during construc-
tion). When the shape has been decided it is roughly etched by a machete or
other instrument on the bark of the log. At this stage an advance of 50-100,000
C is then paid to the carver to begin work. In some cases this advance is suffi-
cient to complete the work; the final payment for the hull taking place after nego-
tiation when the carving is finished and the canoe ready to haul from the forest.
In other cases, the fisherman is requested to visit the work site at regular periods
( + /- 2weeks) to pay further advances and to inspect progress. It is also known
for a fisherman (or his representatives) to remain at the site during the whole car-
ving phase to prevent the canoe being sold to a rival. To fishermen this was a ma-
56

jor problem, because if the canoe is sold to another not only does he lose his ca-
noe but also probably his advance. On the other hand regular visits to the car-
ving site or a permanent presence there costs time and money which adds to the
indirect cost of the finished hull.
4.6 Role of the Canoe agent
Because of the distance from the coast it is now necessary to travel to find
sufficient trees of suitable size and the concomitant inconvenience for fishermen,
coastal based canoe agents are becoming more important in the industry.
These individuals who are usually well respected in the community by both
fishermen and carvers act as "honest brokers" between the two parties. He will
guarantee the fisherman the canoe he desires at the price agreed and will act as
business manager and banker for the carvers. In one case, the agent for a Pram-
pram group of carvers also supervised the construction of their dwellings in their
home village. These agents, usually men of some substance can also extend cre-
dit to both fishermen and carvers either to buy canoes or to finance carving. They
will also arrange transport from the forest. In this case it was claimed that all the
transport trucks came from the coast and expenses were defrayed by carrying
commodities inland like roofing and other building materials for the local agricul-
tural communities and smoked fish to sell on the local markets. These agents will
also sell any "by product" canoes which have been carved from the surplus tim-
ber left after the completion of an ordered canoe.
One of the main roles played by these agents is the provision of working ca-
pital and arranging logisitics for the carvers in the forest. Both the agent and the
57

master carver keep records which form the basis of their accounting system. The
various responsibilities for expenses are clearly defined. For the carvers these in-
clude :
Purchase of tree
Lands commission levy
Stool chief libation
Fuel
Chain saw expenses
Food, board
Pocket money
Damage to farm crops
The agent on the other hand guarantees to buy all canoes carved subject to
quality but also pays :
Tractor extraction from carving site
Transport from forest
District council levy
The agent makes periodic visits to the carving teams disbursing advances
as required until the work is finished. In one particular case between april-june
1990 this represented in money terms :
58

Total 342,550 C
In the above the main expenses during periods a) - c) included advances for
fuel, living expenses, purchase of tree, incidental transport for the carvers and
pocket money. Period d) represents payments for labour to extract the canoe
from the forest, compensation to farmers for damage to crops, lands commission
levy and stool chief libation. In fact, there still remained 17,0000 outstanding to
pay for crop damage and 3000 C to the stool chief. Period e) which covers one
week represents payment advances for food for the carving group while awaiting
the transporting lorry which was delayed. All the advances disbursed make pay-
ments to this carving group 362,550 C in the forest. In addition a further 80,000
C was paid to the group on delivery of the canoe at its destination along with 15,000
C for a new chain saw blade, making a total of 457,550 C disbursed. The parti-
cular canoe to which these advances refer is being negotiated at 815,000 C but
the agent thinks he will have to pay only 700,000 C. In which case he will actual-
ly pay only 242,450 C to the carvers.
59
Period
a) 8/4/90 - 11/4/90 100,000 C
b) 26/4/90 - 15/5/90 189,500 C
C) 22/5/90 - 24/5/90 18,000 C
canoe completed - --------
307,500 C
d) 1/6/90- 6/6/90 28,800 C
e) 10/6/90 - 16/6/90 6,250 C

The agent has however other expenses which fall on him, these are, the cost
of the tractor for extraction from the forest, 65,000 C, lorry transport to the coast,
100,000 C and the district council levy of 40,000 C. Then the total cost of the hull
delivered to the coast to the agent is as below :
Advances to carvers 457,550 C
District council levy 40,000 C
Tractor 65,000 C
Transport 100,0000
Total expenses 662,550 C
Balance to carvers at negotia-
ted price of 700,000 C 242,450 C
Total cost of canoe delivered
to coast 905,000 C
This case is complicated to a certain extent in that the advances covered the
cost of two canoes built one of which was found to be damaged nearing comple-
tion and was refused by the agent. This cost is borne by the carvers who will re-
ceive the balance for the canoe purchased after deduction of the total advances.
Nevertheless the description alone adequately illustrates the financial symbiosis
between the carver and agent.
On the other hand the canoe buyer must also finance the agent. Here the
advances are made over a shorter period of time but in larger amounts. The agent
therefore acting as ''go between" handles the end purchaser's money in an effec-
tive manner and ensures that the canoe ordered will be built on time to the quali-
ty standard required by the purchaser. His management of this operation also of
60

course obviates the need for the fisherman himself to go to the carving site with
all the attendant inconveniences.
Complicating the whole system is the fact that the industry is enmeshed in a
web of credit. It is often the case that a purchaser will not have sufficient funds to
advance before carving can start. In this case the agent may pay the advances
required from his own resources and even by obtaining a loan himself, until such
time as the purchaser can amass the required capital, again often through credit
from family or fish dealers and money lenders. Even then the end purchaser may
not be able to meet the total cost of the negotiated price when the canoe is rea-
dy for delivery and the agent must wait until further credit can be raised by the pur-
chaser or his fishing operations enable him to cancel his debt.
It was said that canoe agents do not charge interest on these outstanding
debts, however this risk is accounted for in the final negotiated price of the canoe,
which will be higher if paid in installments.
4.7 Cost of carving and canoe prices in forest
The time taken to carve a canoe depends not so much on the size of the
group working but rather on the number of chain saws, the servicibility of these
and the availability of sufficient suitable trees. A lone carver can make 4-5 large
canoes a year if no difficulties arise. In fact carvers seldom work entirely alone
and will enlist the assistance of other individuals in the vicinity, whereby a group
of three can in theory make 12-15 canoes per year. In practice according to car-
vers this figure is rarely reached and a more realistic figure would be around a
maximum of eight large canoes completed each year. With around one month for
carving each canoe the rest of the time is taken off for illness, family visits and
61

other reasons, for example searching for trees or seeking customers. In larger
groups carving time is around two weeks but depends more on the number of
chain saws, and the completion rate depends on the supply of trees.
The major direct expenses involved in canoe carving after the purchase of a
tree is in the operation of the chain saw. Below is given the direct costs for car-
ving by different groups in different locations.
Group No 1
(Part time carver helped by another 2 independent carvers)
Location - Hwidiem (Anumfrom)
Canoes carved 17m x 1.68m
62
12.5m x 1.37m
Cost of Tree (one)
Land owner (farmer) 50,000 C
Concessionaire 80,000 C
Stool chief 7,000 C
137,000 C
Cost of carving
19 gallons of petrol at 380 C/gallon 7,220 C
9 gallon lub oil at 2600 C/gallon 23,400 C
8 gallon diesel oil at 360 C/gallon 2,880 C
1 1/2 chains at 10,000 C each 15,000 C
3 files at 800 C each 2,400 C
4 Adze heads and handles 10,000 C
60,900 C
Total cost 197,900

Group No 2
(group of 15 migrating professional carvers originating from Prampram)
Location - Akrodi
Canoes carved 17.2m x 1.93m
12.0m x 1.6m
13.0m x 1.65m
Cost of trees (Two; three felled but one found to be rotten)
63
Cost of carving
40 gallons petrol at 360 C/gallon 14,000 C
20 gallons of Lub oil at 2500 C/gallon 50,000 C
1 pkt files at 3500 C 3,500 C
4 spark plugs at 600 C each 2,400 C
15 gallons diesel oil at 300C/gallon 4,500 C
2 chains at 10,000 C 20,000 C
Adze heads and handles 20,000 C
114.4000
Total cost 279,400 C
Land owner (farmer) 15,000 C
Concessionaire 100,000 C
Stool chief (village development) 50,000 C
165.000 C

Note the prices of fuel oil and lub oil for this group is less than group No
1 as these had been supplied by their agent from Accra.
These costs do not include food, lodging, repairs to the chain saw and
other incidental expenses which are discussed in section 4.6.
Lubrication of the chain blade is with a 50% mixture of diesel and lub oil.
4.8 Profitability of canoe carving
It is not known with any precision the profit levels in the canoe carving indus-
try. Some speculation can however be made using information from various
sources. It is reckoned that a group of 3-5 canoe carvers can make up to 12 large
canoes per year but seldom reach this target. From figures supplied by one ca-
noe agent his carvers will receive at the end of the season a net balance of be-
tween 1.5 million C and 1.8 million C for carving 5-6 large canoes. This would put
a net profit on each canoe of 300,000 C. This figure was also mentioned by other
carvers interviewed in the forest. From other information supplied by the agent
he will pay a net balance of around 242,450 C for his latest canoe (see section
4.6). This however represents the price of one canoe whereas expenses were
disbursed for carving two, one being rejected upon completion. There the cost is
borne by the carver. If both canoes had been acceptable and sold for 700,000 C
each the total balance received by the carvers would have been 942,450 C. In
fact this risk to the carver is quite high as anything from 2 to 3 trees out of ten may
prove defective. The highest risk is however when the canoe is found to be unac-
ceptable after the work is nearly completed and the carving costs have been in-
curred.
64

Nevertheless taking the low figure annual net balance paid by the agent to
his carving group and applying their share system then annual income would ap-
pear as below :
This however does not include food, lodgings and pocket money while em-
ployed in the forest. Excluding these at the end of a season a master carver would
receive the equivalent of 27,000 C per month, a craftsman 20,300 C and the ap-
prentice 10,135 C. These salaries should be compared with those of a bank clerk
earning around 15,000 C per month.
Calculating profits made by the canoe agents is more difficult. The canoe
hull for which costings were given in section 4.6 would cost at least another
150,000 C to finish off with side planking, painting and decorative work taking the
price to 1,055,000 C. Such a canoe would sell for between 1.2 million C and 1.3
million C giving a profit of between 145,000 C and 245,000 C. Taken into acount
however must be the high incidence of bad debt and late repayments which consi-
derably reduce the profit margin of canoe agents.
A medium size canoe would cost slightly less to transport from the same area
(in this case Ashanti Region) at around 80,000 C and also the district council levy
would be less at 30,000 C. The tractor cost would be the same at 65,000 C. The
65
Chain saw and tools x 2 shares 324,324 C
Master carvers x 2 shares 324,324 C
3 craftsmen x 1.5 shares each 729,729 C
Apprentice x .75 shares 121.621 C
1,500,000 C

hull would however be considerably cheaper at around 450,000 C. This would
give a total delivered cost at the beach of 625,000 C while finishing off would be
in the region of 100,000 C, making the finished canoe 725,000 C. This canoe
would sell for between 800,000 C and 900,000 C giving a profit of between 74,000
C and 175,000 C.
If the canoe comes from Brong Ahafo Region however the transport could
be as high as 200,000 C but the district council levy is much lower at only 6,000
C for all canoes (May 1990).
4.9 Procedure for carving a Ghanaian canoe
a) The tools
When one sees a well made Ghanaian canoe from a perfect tree one won-
ders that such a fine form can be obtained from the rawest of raw materials using
only hand wielded adzes and gouges. No conventional measuring instruments
are used in the construction and the only modern tool is the chain saw which eases
the work considerably but has not replaced the need for traditional craftsmanship
in carving.
The tools used apart from the chain saw (Dolmar and Sthil) are blacksmith
made and range from the heavy general purpose rough duty adze, Asorkwa (Fan-
ti), Omee (Ga Adangme) to the long handled gouge Apam (Fanti), Tii (Ga
Adangme). Illustrations of the tools seen, with their measurements are given in fi-
gure No 4.1. As these tools are non standard but blacksmith forged no doubt va-
riations will exist from carver to carver depending on personal preferences.
66

b) The procedure
The sequence of payments from the fishermen to the carver can vary consi-
derably. What is described below is a general case constructed from interviews
with several carvers.
On approaching the carver the fisherman will give a small sum for drinks.
This sum (Ayekoo, Ga Adangme) is a pledge of good-will on both sides and re-
serves that particular tree to be worked on for that particular fisherman. At this
stage also an advance may be paid to enable work to start, this can vary subs-
tiantially but will usually be between 20,000 C and 100,000 C.
Before cutting the tree, in some cases but not all, a libation is poured to
placate the spirit of the tree in order to prevent accidents to the carvers when wor-
king.
Felling is the most dangerous operation and is usually undertaken by the
chief carver. If the tree is not properly cut it can turn and fall on the feller or fall
badly and be damaged. The feller then must carefully decide how he is to cut the
tree so that it falls clear of any potentially damaging obstacles such as rocks and
in a position in which it can be worked upon. Also if a tree falls without some cus-
hion to absord the impact it may break on falling. To avoid this the feller tries to
make his cut so that the tree hits other smaller trees as it falls. This of course may
damage highly valued species. As these over mature wawa often suffer from
heart-rot, especially spreading from the root upwards, after the feller begins to cut
he may detect rot through a reduced resistance in the wood and the form of the
saw-dust. If this occurs he will enlarge the cut he is making to enable the mid-rib
of a palm frond (usually oil palm Elaeis guineensis) to be pushed upwards into the
rot to guage the extent. If the rot extends too far the tree will be abandoned and
another sought.
67

TOOLS USED IN GHANAIAN DUG OUT CANOECONSTRUCTION
APAM, FANTI; Tu, ADANGBE.
T6.5cm
Q.570
TETEWA, FANTI; TETEWA, GA ADANGBE.
ASORKWA, FANTI; OMEE, GA ADANGBE
13.5cT1
27.5cm ---I
NOTE DRAWINGS NOT TO SCALE
60crn
0 3cm
KOTOKLO, GA ADANGBE
SECTION
50mm
68
SUSA, FANTI; USED WITH HANDLE KOTOKLO BY GAADANGBE ASANKROMA
I2.5cm
3.5cm
75mm,
0 5cn-
-1 0 5cm
I9cm 12 5cm

iv) After felling, the tree is cut to the required length. For a large canoe this
is usually described as 19-19 1/2 yards (in fact 9-9 1/2 arm spans, measured from
finger tip to finger tip). A certain amount of extra wood will be allowed for working
at each end. With the log separated from the main tree its lie is inspected for ease
of working. A decision to turn the log to a more convenient position may be ta-
ken because a flatter surface for carving the shear is available on another part of
the circumference of the tree, or the heart wood is too high, or the log is simply
unstable for working upon.
The i'eason for turning the log to have the heart wood in a lower position is
so that the heart wood is not at the prow of the canoe where it would constitute a
weakness, but well down in the hull where it can be strengthened by stapling with
reinforcing bar staples when the canoe is being fitted out on the beach. The prin-
ciple is shown in fig. 4.3.
ros o A/ OF CoHPLCra32,
CAP/cre tol RACLei7tod1 ro
frizorigr 4.100_1>
Once the log is positioned to the satisfaction of the carver he and the fisher-
man decide on the shape. Shear is measured using body measurements eg.
69

amidships at midriff or chest height and at bow and stern at chin or head height.
The various combinations will depend on the fisherman's preference normally, al-
though carvers supplying specific areas will know the design required and carve
accordingly.
The basic profile is then, by eye, marked on the log using a machete or other
tool and this section is chain sawed off leaving the log intact but with a flattened
concave top surface. Chain sawing off this surface usually entails cutting blocks
half a metre by half a metre and usually the cut is made about 5 cm oversize to al-
low for final carving. At this stage the log appears as in fig 4.4.
Li
am COW ass -
vi) Working on the flat concave top surface the carver then marks out the
canoe plan. An 18 yard canoe needs a minimum beam of at least 176 cm at the
outside top rail which may require a beam at the turn of the tumble home (Ntsi-
man, Ga Adangme; Ngyirema, Fanti) of 192 cm or more. The top rail beam amids-
hips is measured using the carver's feet and fingers - seven feet + four fingers
giving the standard minimum beam +1- 176 cm. (If the log allows, more beam will
70

be given). A mark is made 2-3 fingers inside the edge of the log and the required
beam is marked off on the opposite site. These two marks represent the outside
of the top rail at its widest point. Moving then to the fore and after end of the log
the fore and aft extensions (Nkodua, Fanti; Shenkodua, Ga Adangme) which are
characteristic of Ghanaian canoes will be marked out off the centre line using a
hand span for measurement, for the length and width of the projection. (In some
cases however these extensions have been measured to be larger than this, ne-
vertheless the procedure remains the same). The next stage is to draw the out-
line of the canoe. To achieve the smoothly rounded plan shape the carver strips
the side fronds from a palm branch (oil palm, Elaeis guineensis) and uses the na-
turally curved mid rib as his guide. Usually 4 of these are used to mark out the
bow and stern. After marking with charcoal, these lines are joined up to the marks
made amidships.
Carving begins by cutting away the waste wood at the bow and stern with
the chain saw. This may be done roughly or with some degree of precision de-
pending on the carver. Work is then begun on the final carving of the top sides
(Abata, Fanti and Ga Adangme) as this cannot be done once the canoe is hollo-
wed out. The measure for the top side varies with canoe size but is between "I
hand span and i hand span plus tour fingers breadth in height. To achieve this
the excess is removed by the chain saw and final finishing with the special gouge
reserved for this task (Apam, Fanti; Tii, Ga Adangme). T'nis tool gives a fluted ef-
fect to the topside (Utaapam, Fanti; Tii, Ga Adangme) which one carver claimed
was to give purchase to haulers when previously canoes were smaller and man-
handled from the forest without the use of tractors as today. Another characteri-
stic of a well made canoe is that the topsides are inclined inwards so producing
tumble home. It was claimed that no special measure was used to obtain this an-
gle and it was cut by eye and depended on the experience of the carver. Never-
71

theless on several canoes of similar size the angle was measured and was in all
cases +/- 150. At this stage the log in plan and profile will appear as in figure 4.5.
P_5
72
Carving of the inside can now begin. The inside shape is first marked again
using charcoal. The side thickness being four fingers breadth. This can be mar-
ked simply by using the hand or by a pencil attached to a piece of string marked
at the appropriate length. The curvature of the outside is traced and the bow and
stern either rounded off as in Fanti canoes or squared in Ga Adangme. Rough
excavation then begins by cross hatching with the chain saw, the blocks being re-

moved with the Asankruma. Care must be taken at the sides. Given the inwardly
inclined form of the Abata, if the chain saw cuts too deeply it will pierce the hull so
reducing the value of the canoe. To measure the required depth of the inside cut
to prevent penetrating the hull, and also to ensure a uniform thickness in the wood
the Abata is measured with a twig. From this measurement three fingers breadth
are subtracted, and this length is marked on the chain saw bar. By following the
outside inclination in parallel, the required depth and angle is then achieved by the
chain saw operator. The rough carving proceeds in this manner, with sufficient
wood being left on the bottom and sides for final finishing off with the finer adzes
(Tetewa, Fanti and Ga Adangme; and Asorkwa, Fanti; Omee, Ga Adangme). At
this stage the customer may return to the vvork site to inspect progress and pay
a further advance.
When the canoe is finally carved inside, the outside form will then be sha-
ped. The bulk of the remaining waste wood is cut away, the log being maneove-
red by the use of monkey jacks. In some case it may only be necessary to incline
the canoe for this purpose, especially if it is small, in larger canoes the log is usual-
ly turned over, first being strengthened by jamming batons athwartships. The bow
and stern are then roughly formed with the chain saw and the Asankruma. Finis-
hing is supervised by the chief carver who uses only his eye and experience to
decide the final form. It should be noted that the bottom is left overthick by 18-20
cm to allow for abrasion during hauling to the access road. This will be finally fi-
nished off at the beach or in some cases after dragging from the forest.
When the canoe is completed the client and carver then negotiate the
price. After agreement and payment had been made the carver has no more re-
sponsibility. It is up to the purchaser to arrange the tractor to extract the canoe
73

from the work site and to find transport to the coast. Any damage sustained af-
ter payment is supported by the client.
Despite the high degree of traditional skills involved in carving a ghanaian
canoe and the quality of the craftsmanship achieved using the most basic of tools,
the process is extremely wasteful in raw materials. In fact the actual wood used
in carving a canoe is only about 10% of the felled timber if it is assumed that one
large and one small canoe is carved from each tree. The other 90% of the tree is
left to waste in the forest in the form of unused off-cuts and chippings.
74

5 THE WORKING ENVIRONMENT OF THE GHANAIAN CANOE FLEETS
5.1 Topography of Ghanaian Landing Sites
Before a replacement canoe can be designed the conditions under which
the present fleet operate must be taken into consideration. It was thought at an
early stage in the canoe replacement programme that the vessel to be replaced
was confined to operating from ports or sheltered creeks and surf beaches. While
designing a replacement vessel to fish from sheltered moorings would present few
difficulties, the sea and landing conditions of surf beaches was recognized as
being the major features which would influence any future design. In fact, exten-
sive field work at the various landing sites along the Ghanaian coasts dispelled
earlier preconceived ideas of the type of craft which had to be replaced. Contra-
ry to earlier thought canoes are not operating only from sheltered landing sites
and surf beaches but from a variety of landing sites presenting conditions which
range from safe to extremely dangerous.
5.2 General description of Ghanaian landing sites
It was found that "classic" surf beaches composed entirely of sand, and surf
beaten, occur unbroken only in the Western Region from New Town (Côte d'Ivoire
border) to Axim, a distance of about 70 miles, and in the Greater Accra and Volta
Regions from Prampram to Aflao (Togolese Border) about 80 miles. In fact, Pram-
pram itself has a very dangerous landing site which must be entered through two
channels in a wavecut platform. Open beach landing also occurs in the area west
75

of Accra from Chorkor to Kokrobite with lesser extents from Shama to Kafodzidzi
and Kromantse. Lagoonal landing sites also exist at New Ningo, Kpone (seaso-
nal) and Nyanyano. Typical classic surf beach topography is shown in maps No.
1 and 2 in large and small scale.
The remaining landing sites in the Western and Central Regions are charac-
terized as being associated with exposed underlying geological formations, main-
ly upper Precambrian Quartzite shale and phyllite and upper Birimian
metamorphosed lavas and pyroclastic rock. The selective erosion of these expo-
sed geological formations, their orientation and sand transported by littoral drift
gave rise to the variety of landing sites which can be identified. These sites can
be in the form of depositional beaches behind headlands, such as at Maree and
Senya Bereku, Map No. 3, and depositional beaches associated with low rock out-
crops, Abuesi and Aboadze Map 4, natural coves with depostional pocket beaches
such as Dixcove, and eroded embayments such as Axim Map 5. IVIany of the sites
also exhibit an abrasion platform or a fragmented platform. These are particular-
ly noticeable at Komenda and Cape Coast and to a lesser extent at Winneba and
Axim Maps 6, 7, 8 and 5.
The landing beach at Komenda is particularly dangerous. Here vessels must
approach the landing beach to the east and then turn broadside to the surf before
negotiating a narrow gully in the rock platform which extends directly out from the
landing site, Map 6. Apart from the intrinsic danger to life and property in cros-
sing rock in heavy seas, the constricted nature of the approach causes numerous
collisions between vessels trying to land at the same time.
Komenda is arguably the most dangerous landing site on the Ghanaian co-
ast but virtually all landing sites with exposed rock present difficulties and paten-
76

tial damage to vessels attempting to land. Also although some of the beaches are
to a certain extent protected by rock outcrops when the wind is from the S.W., line
squalls which are frequently experienced at the start of and during the rains have
always an easterly component, when these beaches become lee shores.
Despite the difficulties presented by these sites it is noteworthy that in the
Western Region, of 481 canoes listed in the 1986 Ghana Canoe Frame Survey on-
ly 94 were located on "classic" landing beaches. Yet this type of coastline cove-
red 70 miles of the Western Region, while beaches with exposed geology covered
only 52 miles.
Apart from these unimproved landing sites there are four constructed har-
bours at Tema, Elmina, Sekondi and Takoradi Maps 9 and 10. Another natural
harbour occurs at Apam on the Apabaka Lagoon in the Central Region, and shel-
ter is available at Shama on the Pra River but here the entrance can be dange-
rous. Of the constructed ports only Tema and Elmina are used by canoes.
Commercial craft are denied use of the facilities at Sekondi which are naval pro-
perty. At Takoradi, although no restrictions are placed on fishing vessels, harbour
dues are levied which fishermen will not pay. At Takoradi and Sekondi however
there are sheltered landing sites in the lee of the port installations. These are used
by canoes and inshore vessels at Sekondi, and by inshore vessels at Takoradi.
Unfortunately, at Takoradi the main market site is across the bay on an exposed
lee shore, yet canoes and inshore vessels land their catches here because pre-
viously when transporting catches from the sheltered vvesterly beach to the mar-
ket site, about 1 mile, too many thefts occurred. However, vvhen landing at this
site with an onshore wind, it is too dangerous to beach a canoe and fish must be
transported in small transport canoes from the fishing canoes lying off at anchor.
Capsizes here are very common.
77

HA
LF
ASS
INI

PRA
MPR
AM

80
MAP 3
SENYA BERAKU{54'6 8 \\ ' ! ,17). 5.... ',,,,I, \I .,..:1i ijr.
- 9,-2 - S8 9 f\ \\ 1 ., 1
,s \ \ ///' \,
\sk /X/63/
\ \ \ \ 1
\ \ \1
te....r'.-r)I
11:
1 (774\ \ \.\\\, 6,97,/' - ' \ , ,\ .
\/
\ ' \ \ \ \,I\ \ \\\
11\ \
4 I \ '
ZONGO,t,'CP7/30/62
4-80 4IN ...;;.,' 7409 i' -'
...04.-it I /\\ \ 'i
CP.7/30/.. o----'32.1.9 ?..,'-is.,/
z,-- ,. .../a /
. r/7738 . ,.
(-.7
, --,--- /1/ , .. ..,0,
i,,u-.7/7. /..,....6891
-7/..:,"`:.`4.,/
--- - - f ' - 4 /-----, 4' ', //./Ert5:3\41,' 0 + ,/-i /
4..10 5 /.... //
, ....."..V.Z. / .1!"-
/ / / -(5':
I.- gC07(30/60I./ . ,_
4-5 ,
77.34
6...,,b $7,0 -.4s.......,.:=::
//(4 ..ti. // 1I Is7.'I.'
ei0F17516 -.- , / k0 o .1(,,, s',.j,..,.,8 .. .34Q: / V
Well.,0 o
. ,' 77 z-,.... ' i/.'i
'
'(3
i0, .`...1..g.13TS.19 ../
'..:7,7,0 27 --./ ...'''-' ,',C>> ...s..CP.215iff).a 'IN 16,37i
11 '//13 t i
)V/-427 /
, 1
\ ¿w 41 \s.,......,..
. CCG,C.g7/3013,
4g6: ---- .4.:-,00s.o4:7/3014 fr" .___c87/3013.3..5 1:2k3/.112,
eli... -;.T.. '-.;:...
I 1111144c r , 13 c /2 sp,,,,
5,
! Larate '-, 't ,--' t.-, : GC6 CP7/20/, -.6 , '2,
--',...K 't.
4
.., ,,
., 71,0162 3.;-,-- f. 75 - ''....-
.-'5'2---S 1.4).g .. 1' '";;;,,
. ,-0-
-..f 3 4
,,,647 ...`
) ! ^Feel 200 100 o 200 .00 600 gcc Fcf:

SH
AM
A ,
AB
OE
S1,
AB
OA
DI

AXIM
. 8 2
P 5
-t".".'"
....
,'.
I
'..,
s'k , &-,...,...20t01., POINT
tft.
Ff. :,
_,.;
e,c:),:::1,..:..q )
R EWA:
,
,z.....: 1*
410.1-0--,- -----....
sNi. ACCRA;
t-`-11
7 +T.>. .
. ..trowtt.:'..,..,,- .
-".- 't 4/22::X%22,..1ANFUKUMA, \ P,a2/7.,20,
." f.:.,'',
... Ì . ..--
41= . ,,17.-
i
.43.-<).-'.c,V ff t.-.......
-KLBRAU4 PO NT / .,
,.. , .. '..
.."2 e.
,.._.6? j.
F? ._----'c-= ,..o
.. t.'"
c'5. - '8 . N o .';''\ ' tg 1.1;,1=Sk
rk(, ..' .v........, (' `,
..'''' ,..[J 4"'
,( °OLD ZONGO
, 1 1 k c r ''''
-----..AI
...-.:
'----
v.76- --Er ,D1::- -.:',---,.4,_---
.Z.:.1......:: .:-- '''''''"'''''''''''- 3
".,
o-,-1
,,,, 3.nt.-)gg k,.,,.../.___,11
-6, -'17'rn...`.F ,;1,L
...=-_-;-_,-_,,,.. k-,,i_ _____,1,,,..1- 7-47-T [1'; li --..&4 ,1:,.....:,.., -"'"'"..4u; "6.-..-. .., g a : , ..r
1! -...
.3,4::-... c':., V---------:.:t.0gp / j jr-bgr'' --- ' '''' ,..,..-2, r.-...
0 ;r- '...'.(. e.','W - 'Q-' ''' LowEN -row N NEW ZONV.
....:,
_, -
,
-'.
.,
, - .. ..-
/....L.-1,-,- -6 /
!`..1 /4....
Q] /5:f II 3
.../,--k
z
...,:-...
OfOIVASi ISLÁIS
- /C.
,
/'- //
'.7.---
/-. ,
(A/POSi IC / - '-1(':.'......`.7
c----1-........
.-
do 500 1000 2500 7.00. Putt

KO
ME
ND
A

CA
PE C
OA
ST
1&
SP
Lt
11
1;
1I
7A\
'C'tT
1 t
1.0
OC
R 'A
I
(7P
S I
fr:::
P33
'7E
J-(
.5H
AM
.: (
),:,J
,10:
1,,,.
.)\','J14,.,1-4.-:/(f>,7A-i
,k.
,--
c_,
i:,
,r-
.....,
C C
AR
TH
Y ,.
..4
45 *
6°n?
..0
\\\>
'...
.'CP
77/
7...
."\
...::,
WIC
,;
.-4
g4-6
\'
P
07 -
e"0,
,.,C
..
CI
S,s-
',2
611
l'o_;
',74,
,1.
...*4
:14:
1#'''1
'.; !
V:t4
:'/,:
"
P R
7r
e.1
.'5
7 ;.e
rk--
----
:."''5
7//,[
1 19
:
,s-.
.r q
) H
....,.
;,..4
...
.
.:t
,541
.0:..
: --
.4.0
,
.t)3
ati
g*
4104
'se r
olo
OC
P
4A
t. V)1
1;
#4 W
",o,
0070
2/3
./3
......
..7.
C17
.17
./
1-66
, 100
100
077
;6=
661=
76c:
1m:r
at10
040
060
0o0
0 re
el
S
/

85
MAP 8
WINNEBA
i
f
1 35.
f
. )49;
-......_e, ,,,
271, ...,
_ / ;" 8 f-'.': s
4.1i ,_
V ';''' .1R)',-`
ztzz9.30,
.7.--'7'.7 2.-. 'it. ,:, , , '-tz-7...... 546 P
0 st -F:, ,,' -4)
..- 1 fr3
,e/
,:r .
1/4,
,
1/4;
i,
,
.
....,
,-
S
%P
80.
,o,, %
\'`'..,
PI
.N.,
e.-, t::,,..
..., \ ii;,. k ei,<>,`-"s., "I 1:-.', 0- .,y icY. ---- 0,,------... -..
... C.0, .r..SIP I 71,,,,,,iy, ,&.,¿ßo jef
:.;.; ', ,V;vs-<.>/ ',K. ,0..,,,..33-, L
-, LI e 2f.l i , -Ì- ,
- )-,s i Y.'7-77 .*' ,, / / /, ..t. ol.t. <>.2),3/4...../,.... yr./. ... e ...0, ,... j4,110 1r CIe:,.... , 1.e % ,,' e',./ Cl/eeellIsar,/ 64.100 I
' 4 , $V,- /,- .2 \ 14 ey , e i 7,
1
' '
......`4
/ 4,0
,A:
liaV
.0* .
4g,
11-.S41
: . .
1 'i
._ .. ,
o
>
.. ,04 Q 00 " C) --
Ain Pel,:',C.)N.. p. C;) AI 0.3.0e - ej 0,z,
',..,",.71e ' 48,.'jcse,"0 04)%.°"?4010 p41.2.c...2 ,
oo c.,, Nr : 7 .--/c) - ,u e; 6 .90 9. 0p.,. pc' 4:::), ,I,' 0 ou e rl,p,, a,o 'JO' o .7-nCl. 0 , Q ale ° h
0,.. : Erst s., N .Pr W (P. O' e9/ --C., c-j cliii N9
el ),....., ,0 LYJ s;,is a ï-;' Q'' :14,° 'isil7'.1C:::10, 0 'r4z, 4''' ' ''' 8 f229 "."- i "4"A , I a
" o,4&' ' o. 1120 0 0S= , ,,e t, Fb 4, c: es, C/ --o0 DS P
. ' '',' 0 e ,i),e!, Ei It 0
CZ'o -. ° ,-,
,574-,-,7AQ DB --q.,_ z_., 00 ,Cnouo .:.5`;' "-'-'39Ó9 43 ..--er Year T.:1 Caa- / r 1.. , . , F ,,,,90,8z. -4-
, "-à. ' 40," :acbD-0, CUD r
/ = 14 /' % ° ''' 0 0 ep,d'eP4 4'(> O .f.J 3643 ''' to,G, 0 *> ..., - . 4 ino -4- °1110, . e e ' e , 0 % 4, .14.0 ...-,,,,5> n AA Q4" °
..,- (.., .V/ 4° % V toe. 'lea ""a 1;.0' ° I I.;./. . ,'....s.) ''. m 0*, C9r, ,,o, so ', )1, 7.6e AN% r :". (16 -, aitt,..rjo 00 - 's
IA 42.... i sh. A It L... .E. Am
j,..e , 'Mr** ,elg. V rte.. ..."....N. a . a ..1
.-._,,,,..... -.. in ' W., "44"11/ ' iit * , ea , i .1 ,z 4,,j
7'N .o a. ile ` e0 N. ,... 1..._. I. Ifte,o.oye .." .%90i 46 CI oret tii, \
L, lempe.. 0 / 0 . .:,S , b '.1. ....... o , ...... 0 I i '''',-' e ¡pi a'
0,,t,' 9' 4' ,:.:;s8''.. - ° AO '.;-
.Q.4 ;.o Q.: °0 ° (:), (9 1,..e., , 15 ,e-
- I, - , * I .... e +eo.e? <g84,e oc ;-= .< eos '1).0' , si,' 4k;-;
_ r,,, -st-'-.. , "la;;;:tc4.0:,, ,,-- 3"`.11-,"3.5(....tr.,
tt ''\
, 1, .V
k',,,
,-,..
.L.,." Slaughter!í..
4
,,V
1.
'?:,
-
' ° '
.
.
,
.
,.
4
1.00 ,4,
. 0 A-. ,
11110,
' .. t . )' _Jo, -
APO' go
P
, vz. - 19.25
,
.,,
- --_, ,'-'''
.4,
/ O / ,,C4, ..
M.'./ .77. 5 0 s 1/.J:, -,
4,
4" .
Tne. fact of a boundary bcrng shown on thas plan
Feet sooZO 500 1000 1500 2000 2500 Feet

SE
KO
ND
1 -
TA
KO
RA
DI
eryn
ta.
,-.,)
?atio
-nA
r
3.1
elie
ta0t
. eon
."
-0';'
,.1.e
rrnn
onnf
a;
:
-

EL
MIN
A\
----
r-`;
v,.,
`G
.0
,nr.
q.
1
P o
n d
--,;-
0.1
, ° ,0
6
,
1111
1111
1, ,
0,,
00,,,
(to
:,0
/7 C
7..
Lir
B
r ).
Pond
,:::::
,e,;9
..-
t-
er,':
0.0.
0
.0,
de a
1.S
QS5
1.4.
°e
"°kb
i;;; i
1 g
,." s
oo.
1,,o
,3°P
o's
.-Pi
t4 5
7 44
.`-
<,,
,,,ac
iii3
°01
5.-
.--a
.1),
,,,°
csM
a"
; of
4;y,
-9,
1. C
.1tC
HO
OL
wis
r,,-
....
11;1
0 23
,, ...
i,.
_agu
e, ,
0__
,Ei.
B-
--,t,
,,c 0
.o
04,r
,,,, a
019,
BE
NA
s, ,..,
<IL
YA
tree
coo
,Nkr
1:,.
Fi°
a° °
"*"
°R9
,;7,,,
,-r
10 :,
--te
igio
'.:4,
,--,
too
o,,t
euN
.4D
il°e
l° °
,%, A
,7-
.114
,3 0
ftg
,,,ce
? ,-
mon
oUsU
ro, C
Dw
isa.
C.,
ÇH
UR
CH
,,,d-
01:H
ousE
o%0
,0'
o::M
AR
t,ET
O.?
0 4
9 ,
-i
0'H
OD
DIT
AL
:,it
ea.,
.s,&
.,IT
.,1' P
,,.:.
4:".
1,,Y
-'''''
OL
D D
OT
CH
,'''
eVe
. I...
.,C
ÈD
ET
ER
0,.
Erv
a3, 4
,IA
0C. S
CH
OO
Lto
tniP
,./L
AG
OO
N,°
, .=,
....
,o.
..,.,
,,,,,
%m
ow&
(.,
r-
o E
usos
.ill
iaa
a--
: 2 ,.
3C
liurt
cH ,,
,,O...
t...
On
A °
Flu
°sss
,a'..
,..0.
,CS.
54.
o.hit,
:--
--.
0-,'"
' *FA
-:,1
-11
, '77
,,,,7
0",n
utt
' at°
-.,,,
,-:
,.n
.no
%-o
.,...
.tat,
,.,1
e1
smO
C21
.....
-..,_
- a
ito
in<
1 =
,,rtr
i to
..--
o,..
.,....
t ole
s...
--
',"-
'B
D a
- 4
''''
sess
) ."
' 'o'
A.
:, :o
a.-
°.,:
..at
d-
sjs.
,s,o
u'3'
,.
g;e
ggp.
rt9
7:a
,, .,
.....0
.D
....
- e
wo
.> S
. 0
J4.
.1 ..
...°
o. o
it...
. ''''
o ,
g,
so s
ta.
Ill
M +
.' "4
eqr
°.''''
orri
...,
C.6
---
. 00
=O
ra:"
6 28
-kki
,rl
isfu
n..,
A1
ii ...
. .. .
3...
.,:,.
fi-
'"1
:1:1
8E
d n
4e 4
),m
7,,T
ri4
",
,r
,9,4
4-"L
aaas
3 .
n -.
.A-
.
tt..-
.0,
'
1, ,
yL
L9
-o-
-....
...I
.O
G5.
00 BrI
dg.
,e
ZO
NG
O tg
a°
t':
14 Q
..."
......
a. ,
--T
.-Z
--Z
,C°C
;C7'
".._
*/?
°c,
00-
aSk
1 e7
---
oa..,
Q-a
......
",er
s-,..
.-y-
......
GC
`
-,.,-
,-.-
e-t2
r2=
--
rts
Spor
ound
G:
,-.-
---e
r
..-.L
t_-
__S
.
'C'4
7--.
7-, 5
st. 4
5tur
geis
Cat
tle'.1
"--''
''-
- , .
--.
...-:
;,.7
°::'.
',H3°
°q, 1
3 o°
2:,,,
,,, p
un ._
.,,,-
--,-
-,--
Q.-
0,_
..e.
--.z
..-5.
0-!"
--t.)
; c--
Z.:-
:_,-
....
"
c,
---,
--...
-...,
...,..
:^,-
O:°
;0 6
.DIT
.:"'''
's,
.._.-
4,7t
.t.,
"
0 ,0
CI*
e,
0
I:9
°o
,5. t
1.1A
N T
U I
M A
és-
Pea
0078
° -
-30°
. -io
015
00. 2
000
Fin
i.
.. ...
........
.....
.-
._
- -
.
__
..
Lt
tr'

5.3 PQrt Development in Ghana
The possibility of constructing additional fishing harbours in Ghana was exa-
mined in 1987 by Sir William Halcrow and Partners in association with Fisheries
Development Limited. Ten sites were studied and of these it was concluded that
Elmina and Sekondi were the most favoured locations. The Ghana Ports and Har-
bors Authority however see no possibility of any new construction being underta-
ken either at those two sites or elsewhere in the foreseeable future. The only
construction on-going which affects the canoe fleet are improvements at Tema
port, which includes the erection of a covered fish market, the extension of a woo-
den pier for net mending and the possible dredging of the canoe basin.
5.4 Classification of Ghanaian Canoe Landing Sites
As an aid to description, an attempt was made to classify the main beach
landing sites according to their characteristics. These characteristics headed un-
der Protection Factors, Beach Composition, and Potential Danger Factors was al-
phabetically coded to avoid lengthy description and to have a standardised system
for comparison. Inevitably in some cases the assessment of characteristics is sub-
jective. Nevertheless the system as it stands gives a reasonably standard classi-
fication of the conditions at each landing site.
Some explanation may be needed for interpretation of the coding system.
88

Protection Factors
In some cases beaches can exhibit varying degrees of safety. For example,
at Lighthouse beach (Accra) the western end of the landing site is partially shelte-
red by an old jetty while the eastern end has much less protection from the pre-
vailing winds and indeed vessels beached here are often damaged by wave action.
This beach is thus classified under 'Protection Factors' C;0. Similarly there may
be a combination of protective factors such as at Axim which has five landing sites,
all with some, but often limited protection, from either headlands or offshore islets,
thus the classification is I;H. It should be noted that the classification "Beaches
with some shelter from Rock Spurs" refers to rocky projections offering some pro-
tection to a sandy beach lying in the lee.
Beach Composition
Here the classification attempts to describe the nature of the surface upon
which canoes must be beached. This indicates the nature of wear upon a canoe,
thus "Sand with Rock Spurs" SRS is in fact a repretition of RS under "Protection
Factors", but here there is the possibility of abrasion to the sides and gunwales of
the canoes. Similarly the classification SWP and SFWP signify the presence of a
wave-cut plaform or a fragmented wave-cut platform indicating possbile rapid bot-
tom wear.
89

C) Potential Danger Factors
Here the classification is self evident but RD would be used on any beach
classified under "Protection Factors" as RS or under "Beach Composition" as SRS;
this is because although these features can give protection, under certain wea-
ther conditions they become hazardous.
Classification Code for Ghanaian Landing Beaches
90
a) Protection Factors Symbol
1) Open beach with no protection
2) Beaches with some shelter from rock spurs RS
3) Beaches with some shelter from head lands
4) Beaches with some shelter from islets or
rockbars
5) Beaches with acess from estuaries or
lagoons E
6) Beaches with natural but not perfect shelter N
7) Beaches sheltered by constructions
8) Constructed ports
b) Beach Composition
1) Pure sand S
2) Sand with rock spurs SRS

INDIVIDUAL BEACH CHARACTERISTICS
Western Region
Vil lage No of Local APW Protection Factors Beach Composition Potential Danger
Canoes(1) Factors
Half Assini 40 0 S HS;SC
Bonyere 0 S HS;SC
Axim 81 I;H SRS;SWP;SFWP RD;Aw
Dixcove 15 N S;WP RD
Busua 1 H S AW
Butre 2 H S AW
Takoradi (1) ) C S AW10
Takoradi (2) ). 0 S AW;HS;SC
Sekondi 25 C S Lm0
Aboadze 70 S;I SRS HS;RD;AW
Atoase 178 S;I SRS HS;RD;AW
Shama (1) 15 E S SC;HS
Shama (2) 35 S SFWP HS;RD;AW
Central Region
Komenda 60 s SRS;SWP HS';RD;AW
Elmina 30 P;E SILTING L-0
Cape Coast 50 RSAI SFWP PD; MS
Mocee (1) ) 0 S HS;AW
Mocee (2) ). 120 RS;H SRS RD;HS
Mocee (3) ) RS SRS RD;HS
Biriwa 70 RS SRS RD;HS;AW
Kromantze 40 0 S MS
Ankaful 60 0 S MS
Otuam 48 RS SRS MS
Gomce Dago 55 H S HS;AW
Mumford (1) ) H s HS;AW20
Mumford (2) ) H;S SRS;SWP RD;HS;AW
Apeo 50 N S L
Winneba 200 s SRS;SFWP RD;AW
Senya Bereku 150 H S HS;AW
Greater Accra Region
Bortianor 100 0 S HS;AW;SC
Chokor 245 0 S HS;AW;SC
Lighthouse 218 C;0 s HS;AW
Osu 130 H;0 s MS
Teshie 200 H s MS
Tema 235 P 0
Prampram 61 0 SFWP RD;HS
Kporgnya 12 0 S HS
Iekpogunor 50 0 S MSAkplabanya 97 0 S HS
(1) These figures are based on interviews with chief fishermen cross-checkedby reference to the 1986 Canoe Census Survey and replies to a survey carriedout by the Regional fisheries officers. The figures do not include canoeswhich have migrated.

From the descriptive table of beach characteristics it can be seen that al-
though as might be expected, large fleets are associated with sheltered landing
sites, fleet size does not correlate inversely with the potential danger factors which
are present. Large fleets are found at several landing sites which give only mini-
mal protection and which can be dangerous in heavy sea conditions. Senya Be-
reku for example has a fleet of 150 vessels, yet is subject to heavy surf and is a
lee shore when a line squall occurs and is considered a dangerous landing site
by fishermen even from Prampram which has a very dangerous exposed reef ac-
cross the landing site. Similarly, at Winneba rock damage and line squalls cause
damage and yet the fleet numbers 200. Apam and Sekondi and even Elmina on
the other hand, all offering a high degree of shelter have only between 25 and 50
92
3) Sand with wave cut platform SWP
4) Sand with fragmented wave cut platform SFWP
c) Potential Danger Factors
1) High surf HS
2) Rock Damage RD
3) Strong currents SC
4) Adverse winds (eg. line squalls) AW
5) Limited danger
6) Sheltered port
5.5 Beach Conditions and Fleet size

APW canoes in their local fleets. These figures are however augmented conside-
rably by migrating canoes operating at these sites during the season. Similarly
Dixcove which has natural shelter has only a local fleet of 15 large canoes, again
this number increases during the Drift gill net season in October-November. The
smallest fleet on the table occur at Busua and Butre. Both of these beaches are
well protected from the prevailing S.W. wind and are much better landing sites
than others in their near vicinity such as Axim and Half Assini which have local
fleets of 81 and 40 vessels respectively.
From information supplied by fishermen and fishery officers the simple ex-
planation for the seeming anomalous situation of dangerous beaches having large
local fleets is because of the ability of the market to absorb potential landings. The
situation at Takoradi concerning landing close to the market site has been descri-
bed above. But the presence of a market also explains large concentrations of
canoes between Teshie and Batanar in the Greater Accra Region.
The importance of a good market in the utilisation of a landing site is further
discussed in the following section.
Interestingly it can be noted that many landing sites either with a large local
fleet or with large seasonal migratory fleets are associated with the presence of a
castle or a castle was formerly in existence but is now ruined. Several examples
can be cited such as Senya Bereku, Shama, Cape Coast, Elmina, Axim. Although
conjecture it may be the fact that local fishing industries developed and were en-
couraged at these sites during the slaving period. Fish in abundance in the local
coastal seas would have provided a cheap and plentiful supply of protein for fee-
ding slaves (Cape Coast alone could incarcerate 1200 slaves at any one time) ei-
ther awaiting shipment or on the passage across the Atlantic. Garrisons in the
93

castles would also have needed protein and in the absence of well developed live-
stock rearing, capable of providing sufficient animal protein on a regular and de-
pendable basis, the most logical and easily available source would have been from
fish landings.
It may be the case then that the important fishing beaches today are in fact
a relic of the past but through inertia and despite difficult landing conditions have
retained their strong association with fishing and fish marketing.
5.6 Migration patterns in the Ghanaian canoe fleet
Complicating the already difficult task of designing an alternative craft to the
present dug-out canoe is the strong migratory tendencies in the Ghanaian canoe
fleet. If canoes operated exclusively from specific sites, to replace those opera-
ting from ports and sheltered creeks would present few problems, and would per-
haps allow a partial solution to the problem allowing time to test and design vessels
suitable for more extreme conditions. The high degree of migration in the canoe
fleet would however prevent this stepped approach as canoes working or based
at a port may within a few days be operating on an exposed or rocky beach. Any
alternative to the dug-out canoe must therefore consider the changing environ-
ment in which these canoes operate and a replacement vessel capable of withstan-
ding the most extreme environment must be the objective if dramatic
socioeconomic changes in population distribution and marketing are to be avoi-
ded in the communities which depend on the present dug-out.
Migration flows can be either short term, seasonal movements in response
to the geographical occurrence of fish, or longer term permanent or semi-perma-
nent movements to bases providing better marketing and/or better landing facili-
94

ties. Outward migration to neighboring countries and farther is also a feature of
the Ghanaian canoe fishery.
The following discussion will concentrate on short term seasonal migration
as it is the conditions in which the present dug-out canoe operates in Ghana which
is of interest in defining the characteristics of a replacement craft.
Short term migration is usually as a response to the appearance of fish shoals
in specific areas and often these flows entail considerable numbers of canoes.
The Fishery Research and Utilisation Branch (FRUB) at Tema supplied data on
the active canoes at selected landing sites for the first eight months of 1990 in or-
der to quantify the amplitude of migration. The methodology is to record all ac-
tive canoes at each site on the first fishing holiday of each month, le. when no
canoes are at sea. Figure 5.1 has been prepared using the FRUB data on active
APW canoes for seven of the most important landing sites. Two definite periods
of influx can be identified, between january and march, and june and august.
These periods correspond to the major upwelling season which ocurrs between
june and september and the minor upwelling between december and february.
The most striking variation in absolute fleet size are shown at Elmina and Se-
kondi . At Elmina the fleet using the port varies from a lower figure of 162 in ja-
nuary to 396 in august, while a more dramatic increase in canoe numbers is shown
at Sekondi which increased from 36 in june to 544 in july.
95

550 NUMBER OF ACTIVE APWCANOES BY MONTH, 1990
500
450
400
100
50
Ct 250LIS
CO
2 A
z200\\
I \ ,. /...., /\ /150 \ / \ .
.............___//N. I
ELMINA
\
\ SEKOND1
TEMA
WINNEBA
AXIM
Figure 5.1
SENYA BEREKUAPAM
AM A im
MONTH
96

From the Beach Classification table ... both of these sites have minimal dan-
ger factors. Also both are main marketing centres, where in periods of heavy lan-
dings fishermen have the possibility of disposing of their catches albeit at low
prices. These two factors therefore virtually predestine these landing sites to be
heavily frequented.
More interesting are the migration flows at the other sites. Neither Senya Be-
reku, Axim nor Winneba can be considered safe beaches, and yet at Senya Be-
reku the fleet varies between 53 canoes in march and 125 in august. At Winneba
the variation is even greater with a low of 132 in april and a peak of 256 in june.
Apam on the other hand which is a safe and easy landing site has a peak fleet in
august of only 120 APW canoes operating. If the main consideration for migra-
tion was safety then it would be logical to conclude that Tema - the single port in
the country which possesses a specific canoe basin (apart from Elmina) would
show the greatest influx of migratory craft. In fact while Tema has a consistently
high number of APW canoes operating, the fleet varies little in total numbers with
a peak of 189 in august and 154 in february. It must be mentioned here however
that canoes from nearby villages do land at Tema during the season but return to
their home landing beaches daily. Nevertheless, the fact remains that Tema des-
pite its safe landing and marketing and other facilities does not attract significant
numbers of migratory canoes.
More detail on canoe movements within Ghana is given in tables 5.1 and 5.2.
Both tables are compiled from answers given by chief fishermen to a question-
naire survey carried out by the different regional fisheries officers. Table 5.1 shows
the destination of canoes out - migrating rom the village/landing beaches numbe-
red 1-44 while table 5.2 shows the origin of canoes migrating into the village/lan-
ding beaches.
97

From the table it can be seen that most of the short-term migration is over
relatively limited distances and often within the same region. Also virtually every
landing site is both an origin and a destination for migrant canoes, irrespective of
the condition of the landing facility. In fact at only five villages, was poor or dan-
gerous landing conditions given as a reason for migrating elsewhere (coded F and
G in tables). Predominantly the reasons for movement were either to follow fish
movements (coded A and B) or for economic reasons (coded C to E).
98

RE
AS
ON
S F
OR
FIS
HIN
G E
LSE
WH
ER
E
A-
For
goo
d/be
tter
catc
hes/
follo
w fi
sh m
ovem
ent.
Fol
low
her
ring
mov
emen
t.
CP
rom
pt p
aym
ent/s
pot c
ash.
-In
crea
se s
avin
gs.
-B
ette
r M
arke
t
..0F
-A
cces
s to
eas
ier/
bette
r la
ndin
g fa
cilit
ies.
,x)
-B
ecau
se o
f rou
gh n
atur
e of
sea
/tide
s in
loca
lity.
Bec
ause
of a
vaila
bilit
y of
ice.
IT
o bu
y fis
hing
inpu
ts.

TA
BL
E 5
.i -
SHO
RT
TE
RM
OU
TM
IGR
AT
ION
PA
TT
ER
N W
IT!
IIN
CI
TA
NA
VIL
LA
GE
:: D
AT
A
S/N
O.
QU
EST
.
:6 14 C
entr
al
RE
GIO
N
"
2 W
este
rn
.3 W
este
rn4
Wes
tern .
.
5 W
este
rn
Wes
tern
9 W
este
rn
WeM
ern
11 V
este
rn
..
12 W
este
rn'
'' :'
'
¡fig 20 32
..:10
1:1;
11
120
64
Hal
f A
ssin
i
Adi
si-A
xim
Axi
m
,-;.;
::.
I)ix
cov
e'
Nel
y.T
al-k
)rac
l).
Seko
ndi
Alx
incl
e :
A tm
Kom
enda
VIL
LA
GE
Stu/
ma
Shzt
rna
. ..
.. :"
.
13E
AC
1 I
Ew
e L
ine
Atto
Apo
osIk
sFa
me
Lin
e
Ape
wos
ika
Anh
wea
do
Low
er D
ixco
ve.
.:..,.
..
Seko
ndi
"13
roiti
ittIc
ritt
Be
n ts
ir
Apo
Aka
ta k
yi
MA
IN
ET
HN
IC
GR
OU
P
Ew
e
gigt
éFa
nte
Pant
e....
....
......
...
pant
e
Fa n
ti
.::!¡
;:;4:
.
Fant
e
111,
111:
Fant
e
Fa n
te
Eff
utu
Eff
utu
Fa n
te
caAha
nta
Ef
f u
tu
Aha
nta
CA
NO
E F
LE
ET
CO
MPO
SIT
ION
14 49 15 25 162
35 601
20 10 5
'
6 82 24
10
20
OU
TM
IGR
AT
ION
PA
TT
ER
N A
PW A
ND
LN
CA
NO
ES
AW
AY
0-6
MO
NT
HS
A P
WL
N
8 6 2 30 7 2 3 Ni!
DE
STIN
AT
ION
Thw
ii
Elm
ina
Seko
ndi-
Tak
orad
t
Hal
f A
ssin
i
Se k
on d
i-T
akor
adi
IL Seko
nd i
tlrrn
rC
ape
Coa
st
Abu
asi
boai
zA
xim
SEA
SON
NO
. OF
CA
NO
ES
Nil
Oct
-Nov
Nil
Jul-
Sept
Nil
Jnl-
.Se
pt*L
June
-Oct
Nil
"". .
.
Feb-
Aug
Nil
DE
STIN
AT
ION
Apa
m
SEA
SON
RE
ASO
N
......
..
'lbi-
Nov
A
A, C A
. A; I
)D
ixco
veA
ug-S
ept
Apa
mJu
ly-S
ept
Ni!
A
Seko
ndi
July
-Oct
Nil
C
Seko
ndi
May
-Sep
t
OT
HE
R
ET
HN
IC
GR
OU
P
APW
135
SND
GN
OM
C N
O. O
FC
AN
OE
S
5N
il

S/N
O.
QU
EST
.
RE
GIO
N
Cen
tral
VIL
LA
GE
DA
TA
()W
arn
VIL
LA
GE
.PE
AC
H
Ea
nteMA
N
E7I
-IN
IC
GR
OU
P
Fant
e
OT
HE
R
ET
HN
IC
GR
OU
P
CA
NO
E F
LE
ET
CO
MPO
SIT
ION
NO
. OF
CA
NO
ES
OU
TM
IGR
AT
ION
PA
II
ER
N A
PW A
ND
LN
CA
NO
ES
AW
AY
0-6
MO
NT
HS
DE
STIN
AT
ION
Nya
nyan
o
Elm
ina
Nye
sia
Acc
ra
Tak
orad
i
Abu
esi
May
-Jan
Aug
-Oct
Aug
-Oct
une-
Oct
4
Jan-
Apr
July
-Aug
July
-Aug
Feb-
Mar
Nil
Feb-
Mar
Aug
-Sep
t
Aug
-Sep
t
NO
. OF
CA
NO
ES
DE
STIN
AT
ION
A,C
,F
A,F
,G
18 C
entr
al
21
Cen
iral
Con
trA
I
'
A n
ka f
ul
Arl
ka f
u I
..
...
iln-t
f)ri
l'-'d
urnf
LN
Page
2

aht
'"'.:
:
OU
TM
1GR
AT
ION
PA
TT
ER
N A
PW
AN
D L
N C
AN
OE
S A
WA
Y 0
-6 M
ON
TI
Fet
ich
......
.....F
eb-A
pr
V.
Win
nseb
aJu
ly-S
ept
Apa
t
Kro
man
tse
July
-Sep
t
Jan-
Feb
S /N
O.
QU
ES
T.
2.2
2,3
26 27 25 29 31 :32
-3-6
RE
GIO
N
Cen
tral
Cen
tral
Vol
ta
Vol
ta
%%
Oita
V(.
); ta
VoI
t
Vol
ta
%/O
ita
Vol
ta ... .
.
VIL
LAG
E D
AT
A
VIL
LAG
E
rVny
a R
erak
u
Cap
e C
oast
...
. : .
13iri
wa
A to
rkor
Vrx
iza
....
.
Abu
ti a
kop
e
ElI
C;n
ti..
A c
l in
a
I lo(
izra
nano
Ca
re C
oast . .
......
......
......
..
.
13i r
i wa
Fki
nu
A lo
rkc)
r...
. :'V
can
Voc
lza
Ala
n tia
1(c
)pe
Ad
ina
Ato
vtjd
I led
era
n i
no
Gho
rk.o
r .
Scn
ya
Pan
te
Pan
te
Ew
e
Ew
e
Ew
e
Pag
e 3
AM
.
A, E
A, E A

S/N
O.
QU
EST
.
-X)
38 G
t. A
ccra
14
RE
GIO
N
;9t.
Acc
ra
40 G
t. A
ccra
Te.
shie
42 G
t. A
ccra
Cho
rkor
VIL
LA
GE
DA
TA
tutw
rnA
rrni
'
Kpo
ne0<
linyo
rna
S4-6
.loin
aa
9
..
......
..
Coi
A
OT
IIE
R
ET
HN
IC
GR
OU
P
DG
NO
MC
NO
. OF
CA
NO
ES
OU
TM
IGR
AT
ION
PA
TT
ER
N A
PW A
ND
EN
CA
NO
ES
AW
AY
0-6
MO
NT
HS
DE
STIN
AT
ION
SEA
SON
NO
. OF
CA
NO
ES
Page
4
A P
WL
N
APW
CA
NO
E F
LE
ET
CO
MPO
SIT
ION
LIS
SNL
NM
AIN
ET
HN
IC
GR
OU
P
BE
AC
I I
VII
_LA
GE
RE
ASO
ND
EST
INA
TIO
NSE
ASO
N
43G
t. A
ccra
(.;t.
.:Acr
.ra

TA
BL
E 5
.2 -
SH
OR
T T
ER
M I
NM
IGR
AT
ION
PA
TT
ER
N W
ITH
IN G
HA
NA
S/N
O.
QU
EST
.
RE
GIO
N
We*
t
7 W
este
rnD
bc c
ove
.I W
este
rn
Low
er D
ixco
vePa
nte
DG
NO
MC
IMM
IGR
AT
ION
PA
TT
ER
N A
PW A
ND
LN
CA
NO
ES
AW
AY
0-6
MO
NT
HS
NO
OF
CA
NO
ES
OR
IGIN
3N
ew T
akor
adi
ET
HN
IC
GR
OU
P
Fant
e
8 W
este
rn
11
'vV
:c;s
t::7-
n
1 2
'sV
esie
rnSh
arna
Ben
tsir
":1 14
Cen
tral
Kom
enda
Aka
taky
i
Pant
e
Pant
e
Aha
nta
82 601
82 24
120
6420 10
X.
X. 32
10 20
5 3 15 26 5
Abu
esi
PEC
V:'"
Elm
ina
Kom
enda
Abu
esi
Abu
esi
Mor
es
Fant
e
ante
Fan
te
Fant
e
Jul-
Oct
jui-
oct
VIL
LA
GE
DA
TA
CA
NO
E F
LE
.ET
CO
MPO
SIT
ION
VIL
LA
GE
BE
AC
I I
MA
IN
ET
I IN
IC
CR
OU
P
OT
HE
R
ET
HN
IC
GR
OU
P
APW
BS
SNL
N
Hal
f.4
..k5u
.1,1
:...
Hal
f A
ssin
i
Adi
si-A
xim
Pant
i.Lin
Ew
e L
ine
Pani
c L
ine
Ape
wos
ika
Ew
e
Fa n
te
Pant
e
Eff
utu
Eff
utu
14 4920
6A
ccra
Ga
Iirc
oiíb
im
3A
xim
Fant
e
New
Tak
orad
iN
ew T
akor
adi
Pant
e
SeV
,6h(
iiO
k(T
P.E
ffut
u
15 10
Aha
nta
10
SEA
SON
RE
ASO
N
2 W
este
rn
4 W
este
rn
5 W
este
rn.
...

S /N
O.
QU
EST
.
RE
GIO
N
VIL
LA
GE
DA
TA
1)4
150
VIL
LA
GE
BE
AC
I
1:lin
ina
0111
MA
IN
ET
HN
IC
GR
OU
P
OT
HE
R
ET
HN
IC
GR
OU
P
CA
NO
E. F
LE
ET
CO
MPO
SIT
ION
APW 30
0
20
135
24 1
SN
25 11
DG
NO
MC
INM
IGR
AT
ION
PA
Il E
RN
AP'
W A
ND
EN
CA
NO
ES
AW
AY
0-6
MO
NT
EIS
NO
. OF
CA
NO
ES
40 30 10 40 35 10
:f4
Nil
OR
IGIN
Mor
ee
Bir
iwa
Tem
a
Fette
h
Win
neba
Mor
ee
Dag
o, O
tuam
Kom
enda
, Mor
ee
jaga
gi
Seny
a B
erak
u
ET
HN
IC
GR
OU
P
Fant
e
Fant
e
Ga
Fan
te
Fant
e
Fant
e
SEA
SON
Pa e
2
RE
ASO
N
A, E A
Cim
faI
Alk
:tful
.
A[1
1,...
k
......
......
.
1? (
..-A
4)t r
o
18 C
entr
alW
inne
baW
inne
baE
ffut
uE
we
19 C
entr
alA
pam
Apa
mFa
nte
.
20C
entr
alM
umfo
rdM
umfo
rdFa
nte
Ew
e
21 C
n In
dO
tuam
Fant
eE
we
154
50 90
-3$
45 56
'"A
band
ze
'1/1
1110
fAg
Eff
itt4
....
AC
isot
ral
&,tt
yci B
nrak
u.5
oftiy
o T
3ota
i<i,t
dtly
4E
quttt
.
,;¡C
Ato
Coo
tat
25 C
entr
alK
rom
ants
eK
rom
a n
tse
Fant
e
1010

VIL
LA
GE
DA
TA
S /N
O.
QU
FST
.
RE
GIO
N
27 V
olta
8 V
olta
29 V
olta
W 31 V
olta
33 V
olta
Vb
35 V
olta
:
37 G
t. A
ccra
40 G
t. A
ccra
VIL
LA
GE
13E
AC
I1
27ts
:
Ew
eC
a A
dang
be5
24
Ca
Ada
ngbe
Ca
Ada
ngbe
15
aFa
nte
153
Ew
e5
7
136
"IO
MM
Pram
pram
Ew
e
Ada
Ad
angb
es
Fant
e
C,
Win
neba
Win
neba
A to
rkor
Vit.
tv:
Vod
Abu
tiak
ope
Ad
ina
1 le
dzra
nano
7 :::
'"
A n
wia
m
Ato
rkor
W.t;
0 44
Vod
7.a
Abu
tia
kope
I le
d zr
a na
no
An
wia
m...
......
......
......
Old
Nin
go
Tes
hie
Old
Nin
go
Sang
ona
42 G
t. A
ccra
Cho
rkor
Cho
rkor
43:
: 44
Ct.
Acc
ra ::G
t.:A
ccra
Coi
Coi 4;47
Pag
e 3
CA
NO
E F
LE
ET
CO
MPO
SIT
ION
INM
IC R
AT
ION
PA
I I
ER
N A
PW A
ND
IN
CA
NO
ES
AW
AY
0-6
MO
NT
HS
MA
IN
ET
IIN
IC
CR
OU
P
OT
HE
R
ET
I IN
IC
GR
OU
P
APW
BS
SNL
ND
GN
OM
CN
O. O
F
CA
NO
ES
OR
IGIN
ET
HN
IC
GR
OU
P
SEA
SON
RE
ASO
N
Adi
naE
we
832

6 SUMMARY AND CONCLUSION
The forest resources in Ghana are being exploited at or near their rene-
wable ceiling with some of the most desirable species likely to be exhausted wi-
thin the next 20-30 years. The only species which approximates to sustained yield
is Wawa (Triplochilon sclerwrylon). This species is also the most heavily exploi-
ted, representing 32% of forest extraction. It is the large specimens of this spe-
cies, those in excess of 165cm diametre, which are in demand for canoe carving.
Forestry policies in force in the recent past in Ghana have been designed
expressly to eliminate these large trees because of their susceptibility to heart-rot,
fungal attacks and other defects. These policies have been partially effective.
It is now estimated that in both the reserved and unreserved forest areas,
a total of 30,000 of these large wawa trees suitable for canoe carving remain. It
is not possible to quantify the proportion in each area but at the moment the un-
reserved forest zone is the most heavily exploited by canoe carvers. As the stock
outside the reserves is depleted more reliance for supplies will fall on the reserved
forest.
The recently introduced 40 year felling cycle will effectively preserve a
buffer stock of large wawa trees in the reserved forest areas suitable for canoe
carving. These will not be available to canoe carvers except in limited annual
amounts. Even if all the 30,000 trees were in the forest reserves and were made
available exclusively to carvers, under the 40 year felling cycle theoretically only a
supply of around 750 trees over 165cm in diametre would be extracted annually.
107

From analysis of the total annual demand for Ghanaian canoes in the sub-
region it is estimated that to sustain the fleet at its present level and with its pre-
sent composition would require 750-1000 trees per year, when it is considered
that 25% of these large trees on felling may be defective. The 750 trees theoreti-
cally available will similarly be reduced to 562, which will be insufficient for annual
replacement even using the higher 8.7 years average life span of a canoe.
The growing scarcity of wawa trees for canoe carving has been recogni-
zed by carvers and fishermen for some time. Over the last 15-20 years there has
been a marked shift in the locus of canoe carving from the Eastern Region to the
Ashanti and Brong Ahafo regions, and now carvers are operating at near the li-
mits of distribution of Triplochiton scleroxylon. It is impossible to predict the time
frame within which scarcity of supply of suitable logs will pose a serious constraint
to the sustainability of the Ghanaian canoe in the sub-region but essentially what
is now a problem will gradually become a crisis.
To replace a dug-out canoe operating from a port or sheltered landing
site with a suitable alternative would not present a major difficulty. As it is there
are many canoes which are based at sheltered landing beaches.But the Ghanaian
artisanal fishing industry is characterised by strong migration flows, either outside
the country on a semi-permanent basis or along the Ghanaian coast in seasonal
movements, according to fishing grounds and location of markets. These migra-
tions require canoes to land in a variety of conditions from ports to rock strewn
beaches. In order to avoid serious socio-economic dislocations in the coastal
communities dependent on fishing and fish marketing, any replacement craft must
be capable of beaching under the most extreme conditions likely to be encounte-
red.
108

The present larger A.P.W. canoes have reached a technical ceiling in their
development. Their beam is restricted by the diametre of logs which can be found
- a maximum of 2 metres, and their length by the strength characteristics of the
timber utilised. Only limited advances in gear and techniques are therefore pos-
sible by continuing dependence on the dug-out canoe. Modernisation and deve-
lopment of the sub-regional artisanal fishing industry will therefore be restricted.
The situation will become more acute when the larger canoes can no longer be
carved due to a scarcity of suitable trees. In fact the industry may regress by being
forced to use smaller craft if a suitable and acceptable replacement is not found.
Economically the dug-out canoe represents a waste of resources, with
around 90% of the timber used being left in the forest in the form of off-cuts and
chippings. At current prices a large A.P.W. hull in the forest is valued at 700,000
- 800,000 C. If the same volume of timber were to be converted this would yield
around 60m3 of sawn timber, assuming a conversion rate of 50%. This timber on
the local market would be valued at around 2m C and for export at 5m C.
109

LISTE DES RAPPORTS DIPA - LIST OF IDAF REPORT
Documents de travail Workin* a.ers
De Graauw, M.A., Etude de préfactibilité technique de l'aménage-
1985
ment
d'abris
pour
la
pêche maritime artisanale
au
Benin. Cotonou, Projet DIPA. 55 p., DIPA/WP/1.
Black Michaud, M.J., Mission d'identification des communautés
1985
littorales
de pécheurs
artisans
au
Benin.
Cotonou,
Projet DIPA, 24 p., DIPA/WP/2.
Gulbrandsen, 0.A., Preliminary account of attempts to introduce
1985
alternative types
of
small craft into West Africa.
Cotonou, IDAF Project, 51 p., IDAF/WP/3.
Gulbrandsen, 0.A., Un compte-rendu préliminaire sur les tentati-
1985
ves
d'introduire
des
types
alternatifs
de
petites
embarcations en Afrique de l'Ouest.
Cotonou, Projet
DIPA, 53 p., DIPA/WP/3.
Jorion P.J.M., The influence of socio-economic and cultural
1985
structures on small-scale coastal fisheries development
in Benin. Cotonou, Projet DIPA, 59 p., IDAF/WP/4.
Jorion P.J.M., L'influence des structures socio-économiques sur
1985
le développement des péches artisanales sur les cates
du Benin. Cotonou, Projet DIPA, 59 p., DIPA/WP/4.
Tandberg, A., Preliminary assessment of the nutritional situation
1986
of subsistence fishermen's families. Cotonou, Projet
DIPA, 31 p. IDAF/WP/5.
Wijkstrom, O., Recyclage des personnels péche en gestion et comp-
1986
tabilité. Cotonou, Projet DIPA, 25 p. DIPA/WP/6.
Collart, A., Development planning for small-scale fisheries in
1986
West Africa, practical and socio-economic aspects of
fish production and processing. Cotonou, IDAF Project,
34 p., IDAF/WP/7.
Collart, A., Planification du développement des pêches artisana-
1986
les en Afrique de l'Ouest ; production et traitement du
poisson,
ses aspects matériels,techniques et socio-
économiques. Cotonou, Projet DIPA, 67 p. DIPA/WP/7.
Van der Meeren, A.J.L., Socio-economic aspects of integrated fi-
1986
sheries
development
in
rural
fishing
villages.
Cotonou, IDAF Project, 29 p., IDAF/WP/8.
Haling, L.J., et Wijkstrom, O., Les disponibilités en materiel
1986
pour la pêche artisanale. Cotonou, Projet DIPA, 47 p.,
DIPA/WP/9.
Akester S.J., Design and trial of sailing rigs for artisanal fi-
1986
sheries of Sierra Leone. Cotonou, IDAF Project, 31p.,
IDAF/WP/10.
Vétillart, R., Rapport détude préliminarie sur l'aménagement d'un
1986
abri
pour
la
pêche maritime
artisanale
àCotonou.
Cotonou, Projet DIPA, 31 p., DIPA/WP/11.
Van Hoof, L., Small-scale fish production and marketing in Shen-
1986
ge,
Sierra
Leone.
Cotonou,
IDAF
Project,
36
p.,
IDAF/WP/12.
Everett, G.V., An outline of West African small-scale fisheries.
1986
Cotonou, IDAF Project. 32 p., IDAF/WP/13.
Black-Michaud, J., et J. Johnson, Participation communautaire aux
1987
projets intégrés des péches artisanales. En cours de
preparation (DIPA/WP/14).
Anon.,
Report of the second IDAF liaison officers meeting;
1987
Freetown,
Sierra
Leone
(11
-14
November
1986).
Cotonou, IDAF Project, 66 p., IDAF/WP/15.
Anon.,
Compte-rendu de la deuxième reunion des officiers de
1987
liaison
du
DIPA.
Cotonou,
Projet
DIPA,
27
p.,
DIPA/WP/16.
Campbell, R.J., Report of the preparatory technical meeting on
1987
propulsion in fishing canoes in West Africa (Freetown,
15-18
November
1986).Cotonou,
IDAF Project,
88
p.,
IDAF/WP/17.
Davy D.B.,Seamanship, Sailing and Motorisation. Cotonou, IDAF
1987
Project, 85 p., IDAF/WP/18.
Anum-Doyi, B., and J. Wood, Observations on fishing methods in
1988
West Africa. Cotonou, IDAF Project, 53 p., IDAF/WP/19.
Anon.,
Report of the third IDAF liaison officers meeting (Co-
1988
tonou, 2 - 4 December 1987). Cotonou, IDAF Project, 88
p., IDAF/WP/20.
Anon.,
Compte-rendu de la troisième reunion des officiers de
1988
liaison du DIPA (2-4 Décembre 1987). Cotonou, Projet
DIPA, 85 p., DIPA/WP/20.

Haakonsen, J.M. (Ed.) Recent developments of the artisanal fishe-
1988
ries
in
Ghana.
Cotonou,
IDAF
Project,
69
p.,
IDAF/WP/21.
Everett, G.V., West African marine artisanal fisheries. Cotonou,
1988
IDAF Project, 41 p., IDAF/WP/22.
Everett, G.V., Les péches maritimes artisanales en Afrique de
1988
l'Ouest. Cotonou, Projet DIPA, 44 p. DIPA/WP/22.
Coackley, A.D.R., Observations on small fishing craft develop-
1989
ments in West Africa. Cotonou, IDAF Project,
22 p.,
IDAF/WP/23.
Zinsou, J. et W. Wentholt, Guide pratique pour la construction et
1989
l'introduction du
fumoir
"chorkor".
Cotonou,
Projet
DIPA, 33 p., DIPA/WP/24.
Zinsou, J. and W. Wentholt, A pratical guide to the construction
1989
and introduction of the chorkor smoker. Cotonou, IDAF
Project, 29 p., IDAF/WP/24.
Chauveau, J.P., F. Verdeaux, E. Charles-Dominique et J.M. Haakon-
1989
sen,
Bibliographie sur les
communautés de pécheurs
d'Afrique de l'Ouest
- Bibliography on the fishing
communities in West-Africa. Cotonou, Projet DIPA - IDAF
Project, 220 p., DIPA-IDAF/WP/25.
Everett, G.V., Small-scale fisheries development issues in West
1989
Africa. Cotonou, IDAF Project, 47 p., IDAF/WP/26.
Haakonsen, J.M., et W. Wentholt, La péche lacustre au Gabon. Co -
1989
tonou, Projet DIPA, 36 p., DIPA/WP/27.
Anon.
Report of the ad hoc technical meeting on artisanal fi -
1990
sheries craft,
propulsion, gear and security in the
IDAF region ; Cotonou, 25 - 26 September 1989. Cotonou,
IDAF Project, 111 p., IDAF/WP/28.
Anon.
Report of the fourth IDAF liaison officers meeting (Da-
1990
kar,
21 - 23 November 1989). Cotonou, IDAF Project,
135 p., IDAF/WP/29.
Anon.
Compte-rendu de la quatrième reunion des officiers de
1990
liaison
du
DIPA.
Cotonou,
Projet
DIPA,
121
p.,
DIPA/WP/29.
Houndékon, B.R., D.E. Tempelman et IJff A.M., Report of round ta -
1990
ble
meeting
on
women's
activities
and
community
development in artisanal fisheries (projects) in West
Africa.
Cotonou,
IDAF
Project,
12
p.,
+annexes,
IDAF/WP/30.
Houndékon, B.R., D.E. Tempelman et IJff A.M., Rapport du séminai-
1990
re
sur
les activités
féminines et le developpement
communautaire dans les projets de peches artisanales
en Afrique de l'Ouest. Cotonou, Projet DIPA, 14 p., +
annexes, DIPA/WP/30.
A.M. IJff, Socio-economic conditions in Nigerian fishing communi-
1990
ties - Based on studies along the Benin and Imo river
estuaries. Cotonou, IDAF Project, 113p., IDAF/WP/31.
M.O. Okpanefe, A. Abiodun and J.M. Haakonsen, The fishing commu-
1991
nities of the benin river estuary area: Results from a
village survey in Bendel State, Nigeria. Cotonou, IDAF
Project, 75 p., IDAF/WP/32.
Anon.,
1991
Compte-rendu du cours "Analyse Quantitative des Aspects
Sélectionnés de Développement". Cotonou, Projet DIPA,
6 + xlvi p., DIPA/WP/33.
Anon.,
Report of the course on "Quantitative Analysis of Se-
1991
lected
Aspects
of
Fisheries
Development".
Cotonou,
IDAF Project, 6 + xlv p., IDAF/WP/33.
Callerholm Cassel E., Cost and Earnings and Credit Studies on
1991
Ghanaian Canoe Fisheries. Cotonou, IDAF Project, 38 p.,
IDAF/WP/34.
Liste des documents de travail du Projet Modele, Benin/
List of working papers of the Model Project, Benin
Coackley, A.D.R., Report on installation of a diesel inboard mo-
1988
tor in a Ghana canoe. Cotonou, Model Project, 7 p. +
annexes, PMB/WP/1 (En).
Coackley, A.D.R., Installation d'un moteur diesel "inboard" dans
1988
une pirogue ghanéenne. Cotonou, Projet Modèle, 9 p. +
annexe, PMB/WP/1 (Fr).
Zannou, L.H., Etudes technico-économiques des fours améliordes
1988
pour le fumage de poisson en Republique Populaire du
Benin.
Cotonou,
Projet Modèle,
8 p.
+ 6
tableaux,
PMB/WP/2.
Atti-Mama, C., et M. Rais, Etude démographique des communautés
1988
cibles du projet Modèle Benin. Cotonou, Projet Modèle,
20 p. + 10 annexes, PMB/WP/3.
Jorion, P., Non-monetary distribution of fish as food in Beninois
1988
small-scale fishing villages and its importance for
auto-consumption.
Cotonou,
Model
Project,
26
p.,
PMB/WP/4.

5
Tanimomo, P.F., Catalogue des engins de péche maritime artisanale
1989
du Benin. Cotonou, Projet Modele, 46 p.
+ 3 annexes,
PMB/WP/4, PMB/WP/5.
Tanimomo, P.F., Rapport de consultation sur la formation des jeu-
1989
nes p6cheurs de l'UNICOOPEMA à Lome. Cotonou, Projet
Modèle, 17 p. + 6 annexes, PMB/WP/6.
Atti Mama, C., Impacte Socio-économique de la piste Pahou-Kpota.
1989
Cotonou, Projet Modèle, 10 p. + 3 annexes, PMB/WP/7.
Ahouanmènou, C., C. Atti-Mama, B. Houndékon, D. Tempelman et D.
1989
Turcotte, Animation, gestion et planification, séance
de travail avec les agents de terrain. Cotonou, Projet
Modele, 142 P. + annexes, PMB/WP/8.
Atti-Mama, C., D. Turcotte, et W. Wentholt, Evaluation interne
1989
des activités du projet modèle Benin dans le secteur de
Ouidah.
Cotonou,
Projet Modèle,
36 p +
7annexes,
PMB/WP/9.
Tempelman, D., The participatory approach in an integrated arti-
1989
sanal
fisheries
project
;structuring
community
development
-womens
activities.
Cotonou,
Model
Project, 43 p. PMB/WP/10.
Landry J., Cours d'alphabetisation fonctionnelle en calucul. Co-
1989
tonou, Projet Modèle, 59 p. + 3 annexes. PMB/WP/11.
Landry J., D. Tempelman, Functional literacy, Training Guide for
1989
a numeracy course. Cotonou, Model Project, 55 p. + 3
annexes. PMB/WP/11
Atti-Mama, C., Systèmes traditionnels et modernes d'épargne et de
1990
credit en milieu pécheur au Bénin.
Cotonou,
Projet
Modèle, 41 p. + annexes, PMB/WP/12.
Senouvo, P., Statistiques de péches des villages du Projet Modèle
1990
Année 1987. Cotonou, Projet Modèle, 33p. PMB/WP/13.
Sheves, G.T., Holler P.T. and Tanimomo P.F., Report on demonstra-
1990
tion
with
echosounders,
compasses
and
multimono
gillnets
in
Ghana.
Cotonou,
Model
Project
22p.
PMB/WP/14.
Coackley, A.D.R., and G.T. Sheves, A review of the experimental
1990
intrOduction of diesel inboard motors to Ghana canoes.
Cotonou, Model Project 41 p., PMB/WP/15.
IJff, A.M. et D.E. Tempelman, Etude sur les relations entre les
1990
captures
de
poisson
et
l'état
nutritionnel
des
communautes de pécheurs dans la province du Mono, au
Benin. Cotonou, Projet Modèle, 27 p., PMB/WP/16.
Sènouvo, A.P. et Gbaguidi, A.A. Recueil des données statistiques
1991
des péches maritimes au Benin. Période de 1984 h 1989.
Cotonou, Projet Modèle, 134 p., PMB/WP/17.
Houndékon, B.R., Initiative locale et développement: Experience
1991
des communautés de p6cheurs marins du Benin. Cotonou,
Projet Modèle, 17 p., PMB/WP/18.
Rapports techniques et des documents choisisi Selected
list of technical reports and documents
Direction Nationale du Projet Modèle Benin, Mise en place et plan
1985
d'exécution. Cotonou, Projet DIPA, 43., + 3 annexes.
Sheves, G.T. Integrated small-scale fisheries projects: princi-
1985
pies, approaches, and progress in the context of the
Benin
prototype
project.
Paper
presented
at
the
workshop
on
Small-scale
Fisheries
Development
and
Management, Lome, 20-29 November 1985, 33 p.
Sheves, G.T. Projets intégrés de péches artisanales : approches
1985
et
evolution
dans
le
contexte
du
projet
pilote.
Document
présenté
al'atelier
regional
sur
le
développement et l'aménagement des peches artisanales,
Lome, 20-29 Novembre 1985, 36 p.
IDAF Newsletter/Lettre du DIPA,
1, October/Octobre 1985, 4 p.
IDAF newsletter/Lettre du DIPA,
2, January/Janvier 1986, 14 p.
IDAF Newsletter/Lettre du DIPA,
3, June/Juin 1986, 40 p.
IDAF Newsletter/Lettre du DIPA,
4/5, Sept./Dec. 1986, 76 p.
IDAF Newsletter/Lettre du DIPA,
6, September 1987, 58 p.
IDAF Newsletter/Lettre du DIPA,
7, June/Juin 1988, 84 p.
IDAF Newsletter/Lettre du DIPA,
8, June/Juin 1989, 74 p.
IDAF Newsletter/Lettre du DIPA,
9, October/Octobre 1989, 84 p.
IDAF Newsletter/Lettre du DIPA, 10, AUGUST/Août 1990, 84 p.
IDAF Newsletter/Lettre du DIPA, 11, January/Janvier 1991, 6 p.
Paraiso F-X., rapport sur stages de recyclage en identification
1985
des poissons Cotonou, GCP/RAF/192/DEN 24 p.
Collart, A. et M
Guidicelli, Développement des pécheries mariti-
1984
times et continentales de la pisciculture au Gabon.
Rome, FAO (GCP/RAF/192/DEN) 77 p.
Johnson, J.P. et M.P. Wilkie, pour un développement intégré des
1986
péches artisanales
;du bon usage de participation et
de la planification.
Cotonou Projet DIPA,
157 p.
+annexes, Manuel de Terrain N° 1.
Meynall, P.J., J.P. Johnson, and M.P. Wilkie, Guide for planning
1988
monitoring
and
evaluation
in
fisheries
development
units. Cotonou, IDAF Project, 116 p. IDAF Field Manual
N° 2.


![&RQILJXUDWLRQ :L]DUG](https://static.fdocuments.us/doc/165x107/61a8afa4f70c766d3378a956/amprqiljxudwlrq-ldug.jpg)
