Implementation Strategy of CAgM for WIGOS IP under GFCS umbrella - Approach & Progress -
The GFCS Pillars: Developing climate services at the national level Observations and Monitoring
Sarat C. Kar
NCMRWF, MoES, India
Regional Stakeholder Consultation on Climate Services for the Third Pole Region Jaipur, Rajasthan, India 9-11 March 2016
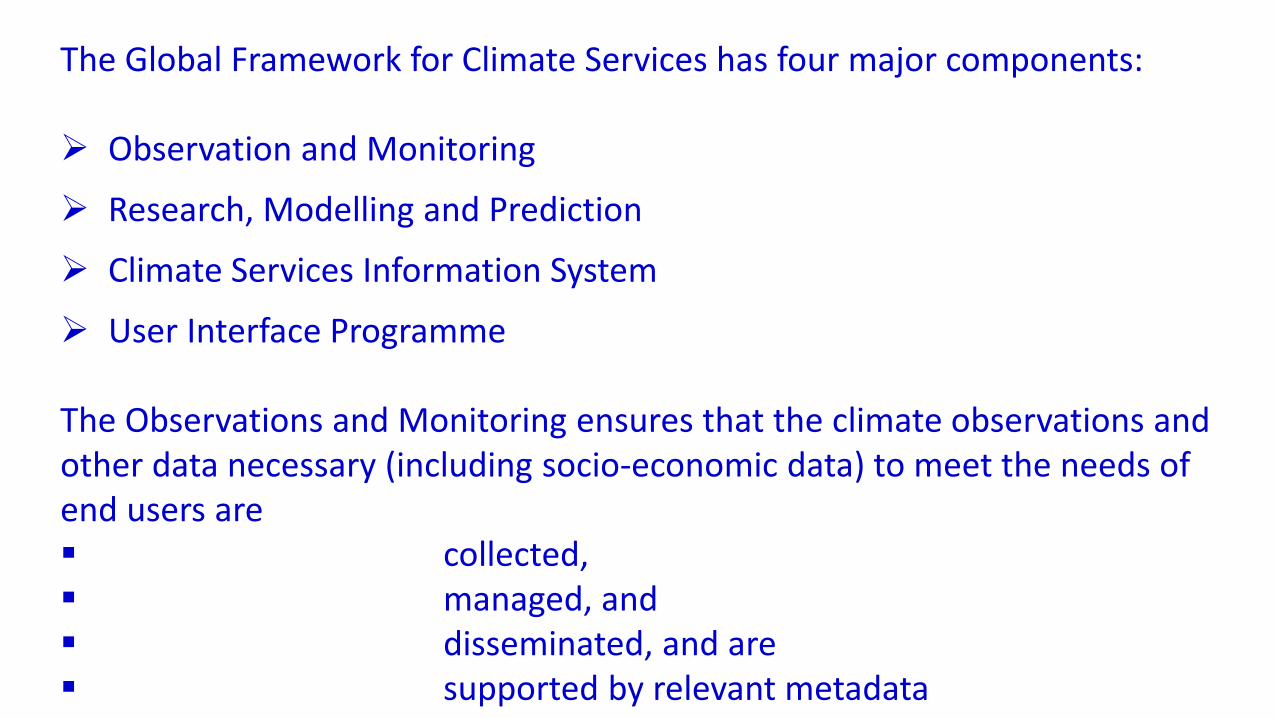
The Global Framework for Climate Services has four major components: Observation and Monitoring
Research, Modelling and Prediction
Climate Services Information System
User Interface Programme The Observations and Monitoring ensures that the climate observations and other data necessary (including socio-economic data) to meet the needs of end users are collected, managed, and disseminated, and are supported by relevant metadata
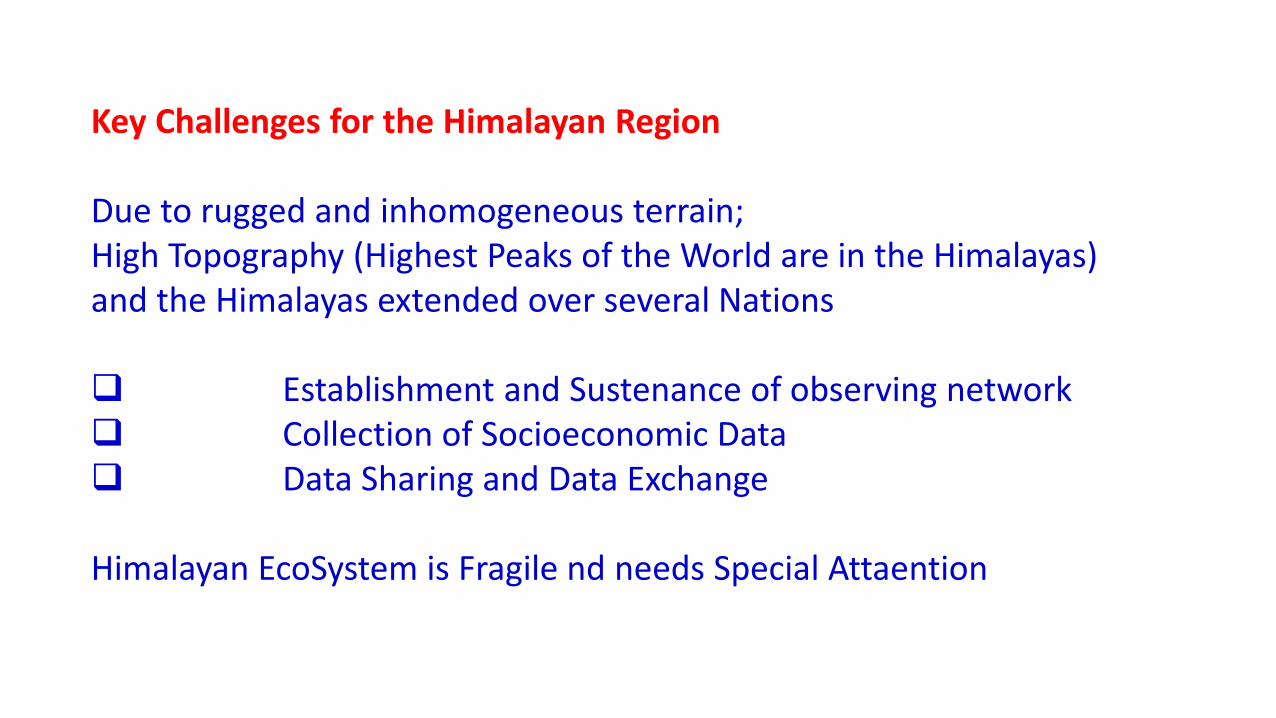
Key Challenges for the Himalayan Region Due to rugged and inhomogeneous terrain; High Topography (Highest Peaks of the World are in the Himalayas) and the Himalayas extended over several Nations Establishment and Sustenance of observing network Collection of Socioeconomic Data Data Sharing and Data Exchange
Himalayan EcoSystem is Fragile nd needs Special Attaention
The Observations and Monitoring Pillar is one of the foundational pillars of GFCS
Need of Observations of appropriate types and of adequate quality and quantity.
Observations availability at the right place and at the right time.
Requirement of conventional data of the atmosphere (as needed for weather services) as well as variables needed to describe the climate system of the Third Pole including hydrologic and carbon cycles and the cryosphere.
Remote Sensing data is Key in the Third Pole region where sustenance of ground-based observations is a challenge
Delivering useful climate services also requires the availability of socio-economic, biological, and environmental data, for national use in particular.
Physical and chemical climate observations, along with complementary socio-economic and other data, must be effectively integrated to develop and provide users of climate services—farmers, public health officials, disaster risk reduction managers, water resources administrators etc
with information that will help them minimize losses due to climate variability and change and to manage natural and human systems effectively.
Existing capabilities for climate observation and data exchange provide a strong basis for improving climate services.
However, there are major gaps in climate observations (particularly in our context) over the Himalayas.
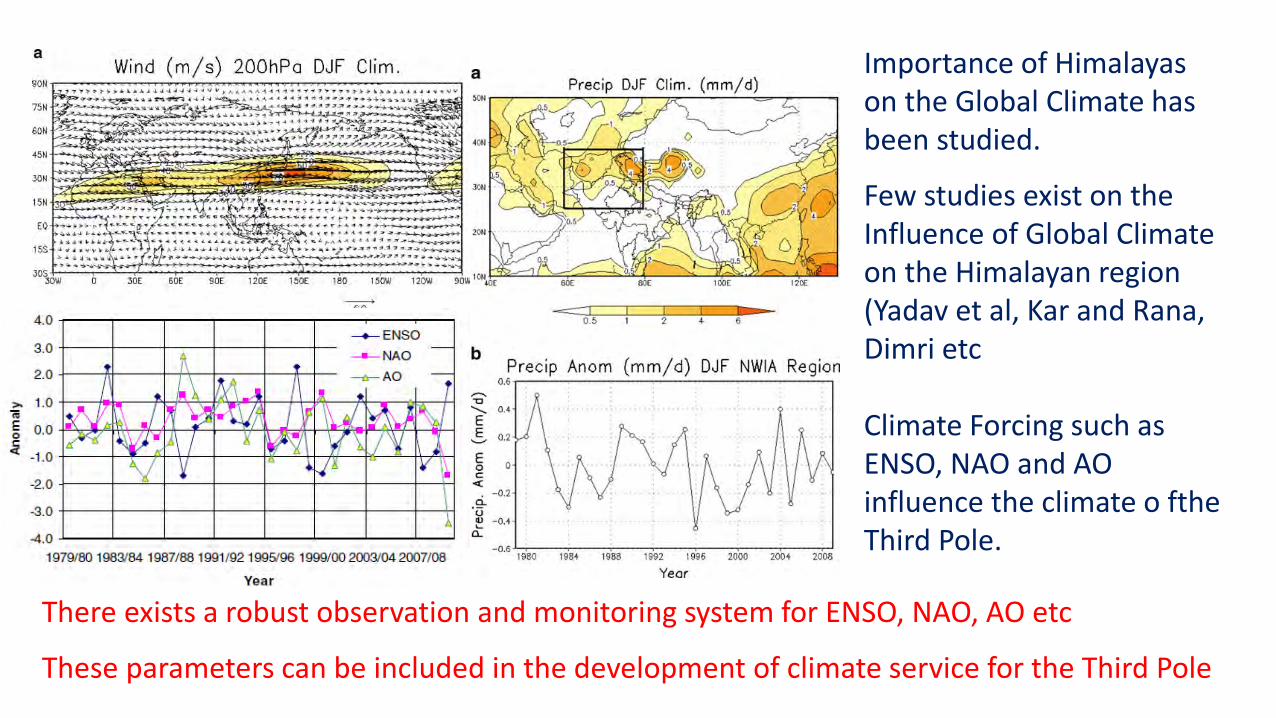
Importance of Himalayas on the Global Climate has been studied.
Few studies exist on the Influence of Global Climate on the Himalayan region (Yadav et al, Kar and Rana, Dimri etc Climate Forcing such as ENSO, NAO and AO influence the climate o fthe Third Pole.
There exists a robust observation and monitoring system for ENSO, NAO, AO etc
These parameters can be included in the development of climate service for the Third Pole
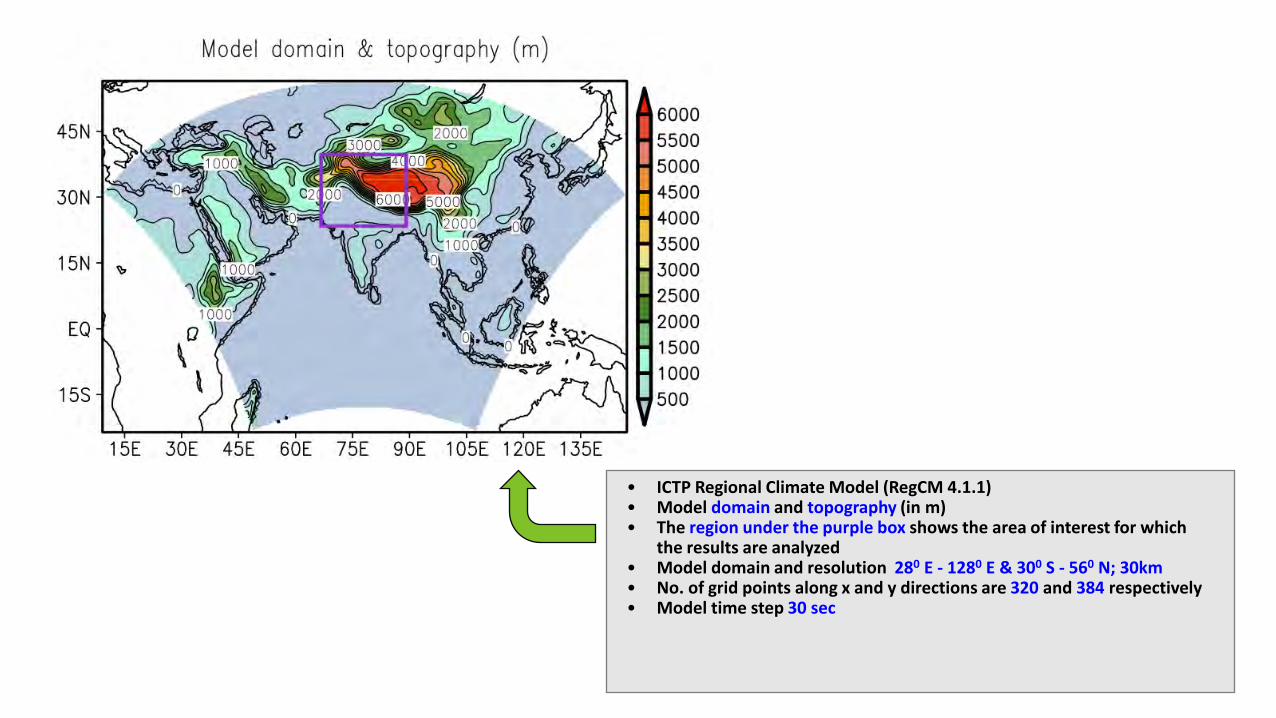
• ICTP Regional Climate Model (RegCM 4.1.1) • Model domain and topography (in m) • The region under the purple box shows the area of interest for which
the results are analyzed • Model domain and resolution 280 E - 1280 E & 300 S - 560 N; 30km • No. of grid points along x and y directions are 320 and 384 respectively • Model time step 30 sec
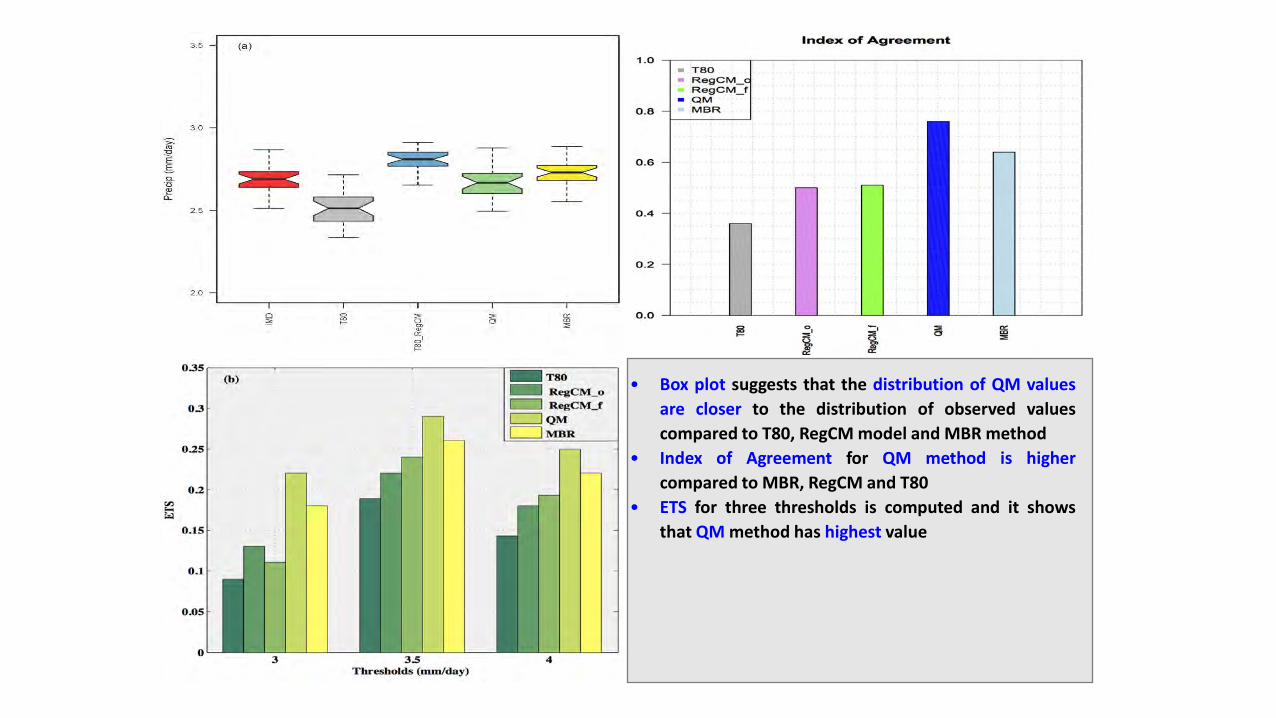
• Box plot suggests that the distribution of QM values are closer to the distribution of observed values compared to T80, RegCM model and MBR method
• Index of Agreement for QM method is higher compared to MBR, RegCM and T80
• ETS for three thresholds is computed and it shows that QM method has highest value
0
5
10
15
20
25
30
35
0
0.5
1
1.5
2
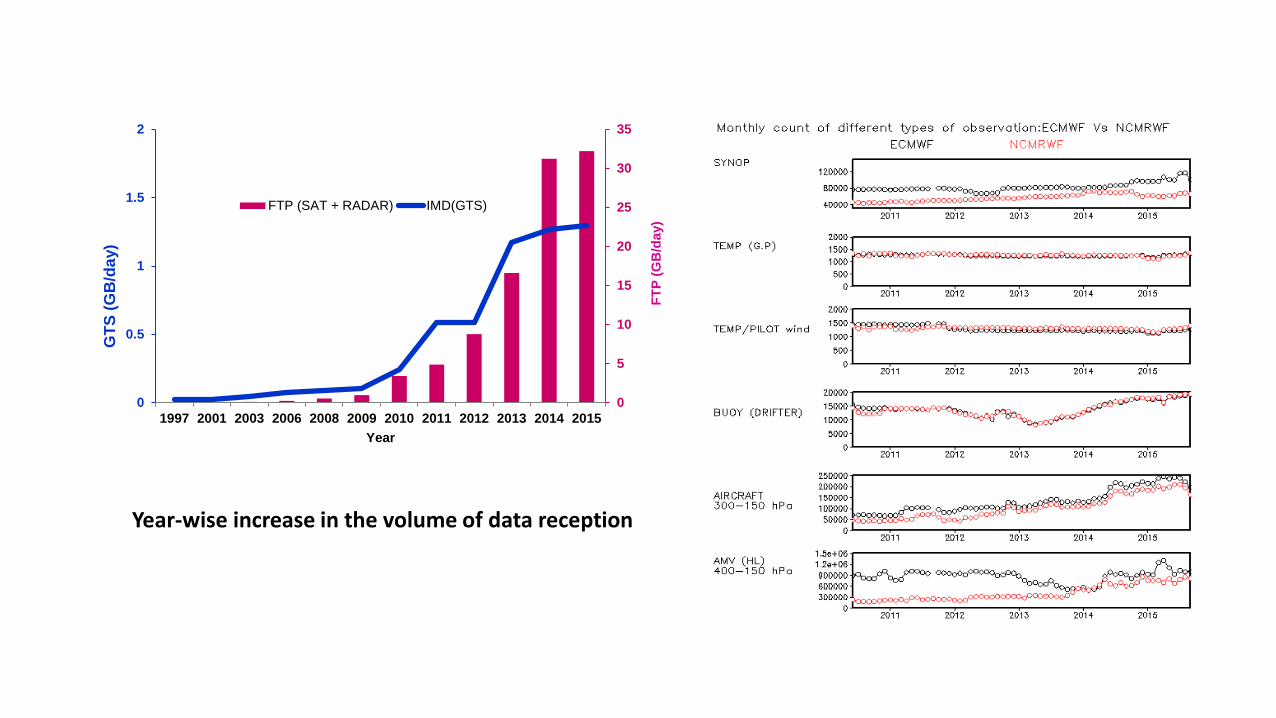
1997 2001 2003 2006 2008 2009 2010 2011 2012 2013 2014 2015
FTP
(GB
/day
)
GTS
(GB
/day
)
Year
FTP (SAT + RADAR) IMD(GTS)
Year-wise increase in the volume of data reception
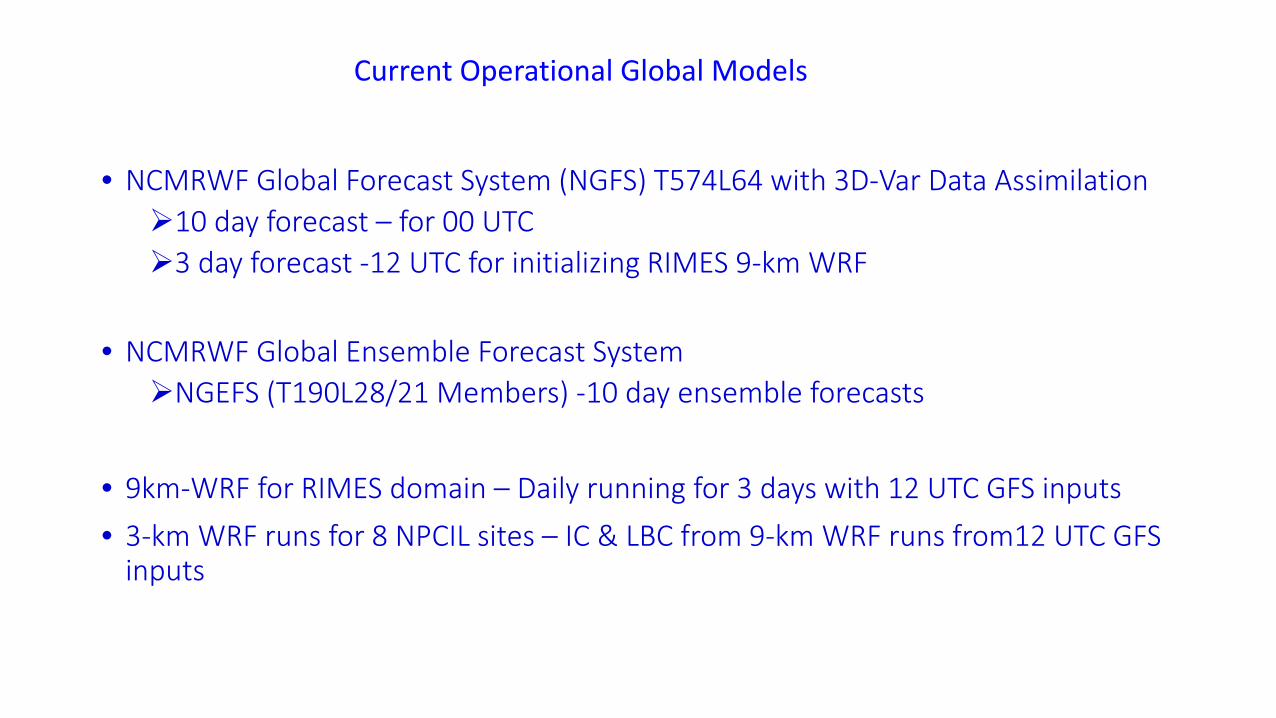
• NCMRWF Global Forecast System (NGFS) T574L64 with 3D-Var Data Assimilation 10 day forecast – for 00 UTC 3 day forecast -12 UTC for initializing RIMES 9-km WRF
• NCMRWF Global Ensemble Forecast System NGEFS (T190L28/21 Members) -10 day ensemble forecasts
• 9km-WRF for RIMES domain – Daily running for 3 days with 12 UTC GFS inputs • 3-km WRF runs for 8 NPCIL sites – IC & LBC from 9-km WRF runs from12 UTC GFS
inputs
Current Operational Global Models
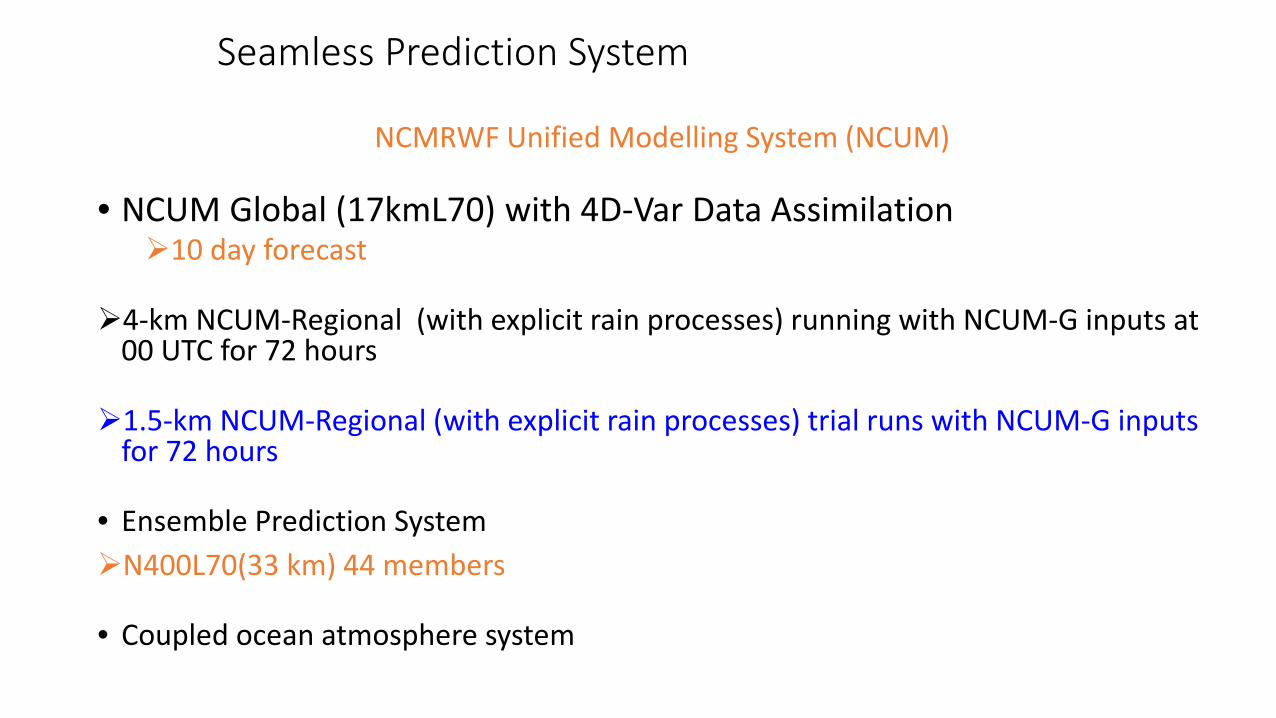
Seamless Prediction System
NCMRWF Unified Modelling System (NCUM)
• NCUM Global (17kmL70) with 4D-Var Data Assimilation 10 day forecast
4-km NCUM-Regional (with explicit rain processes) running with NCUM-G inputs at 00 UTC for 72 hours
1.5-km NCUM-Regional (with explicit rain processes) trial runs with NCUM-G inputs for 72 hours
• Ensemble Prediction System N400L70(33 km) 44 members
• Coupled ocean atmosphere system
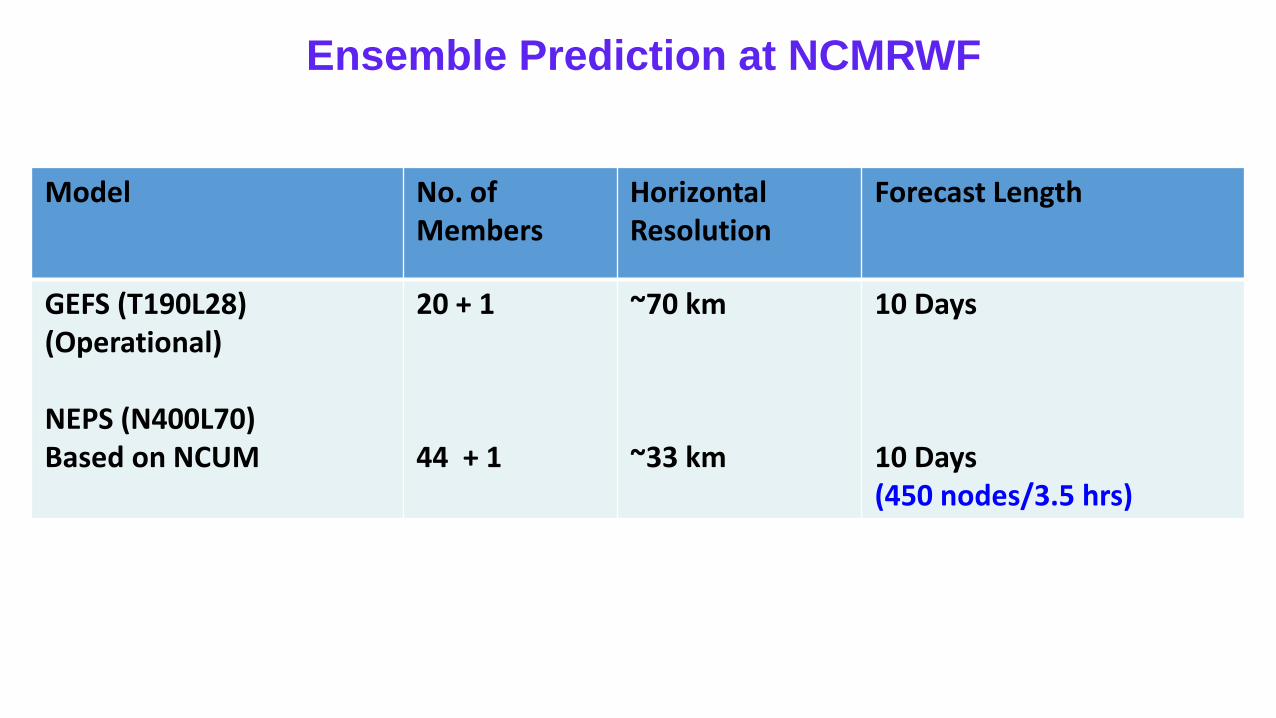
Ensemble Prediction at NCMRWF
Model No. of Members
Horizontal Resolution
Forecast Length
GEFS (T190L28) (Operational) NEPS (N400L70) Based on NCUM
20 + 1 44 + 1
~70 km ~33 km
10 Days 10 Days (450 nodes/3.5 hrs)
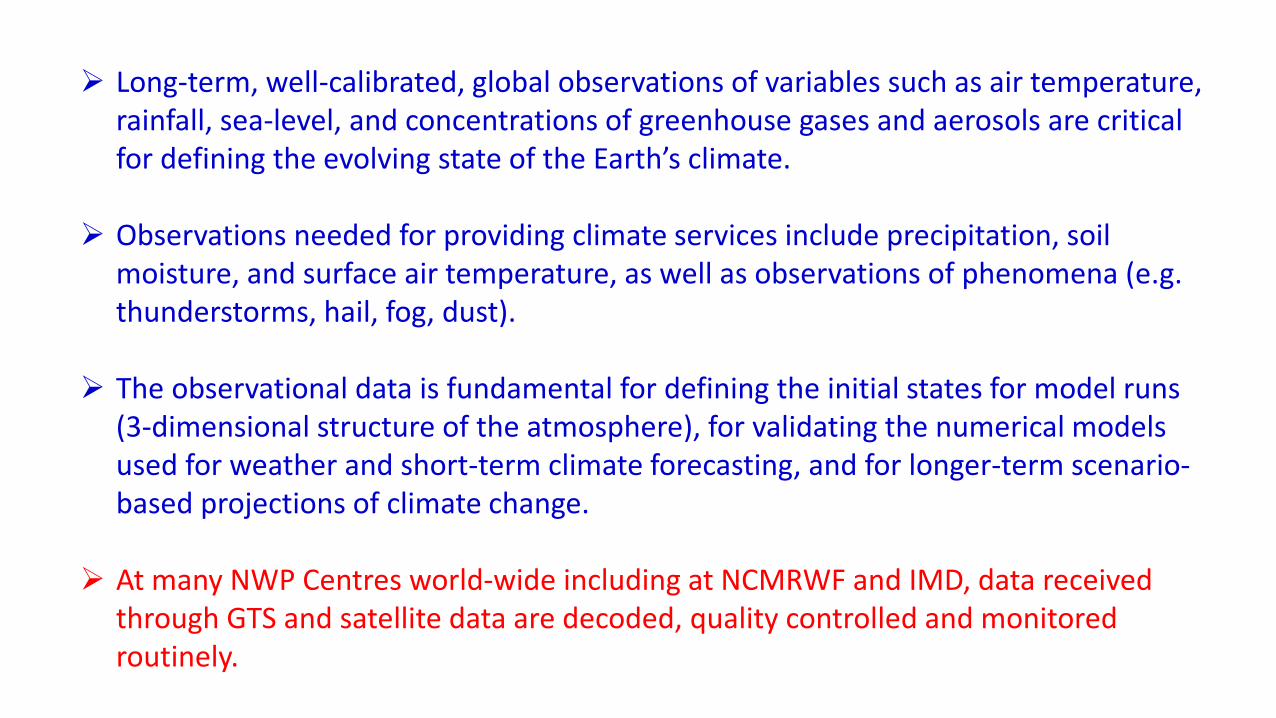
Long-term, well-calibrated, global observations of variables such as air temperature, rainfall, sea-level, and concentrations of greenhouse gases and aerosols are critical for defining the evolving state of the Earth’s climate.
Observations needed for providing climate services include precipitation, soil moisture, and surface air temperature, as well as observations of phenomena (e.g. thunderstorms, hail, fog, dust).
The observational data is fundamental for defining the initial states for model runs (3-dimensional structure of the atmosphere), for validating the numerical models used for weather and short-term climate forecasting, and for longer-term scenario-based projections of climate change.
At many NWP Centres world-wide including at NCMRWF and IMD, data received through GTS and satellite data are decoded, quality controlled and monitored routinely.
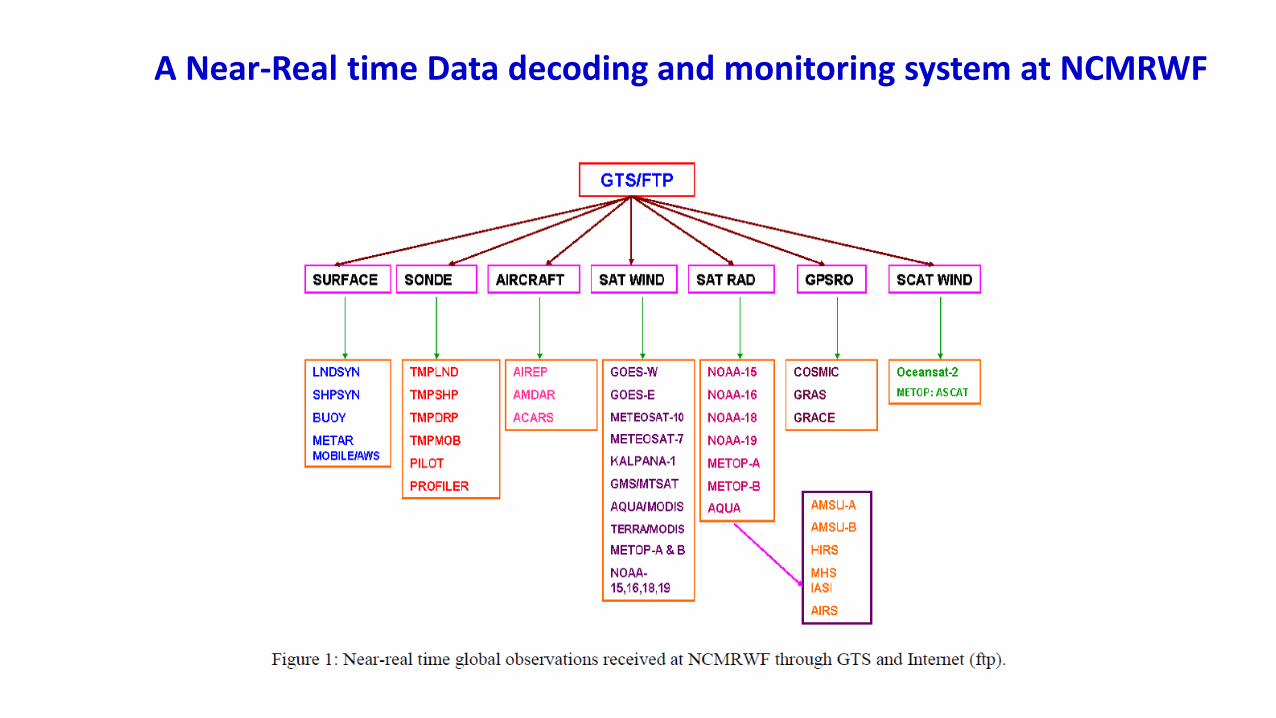
A Near-Real time Data decoding and monitoring system at NCMRWF
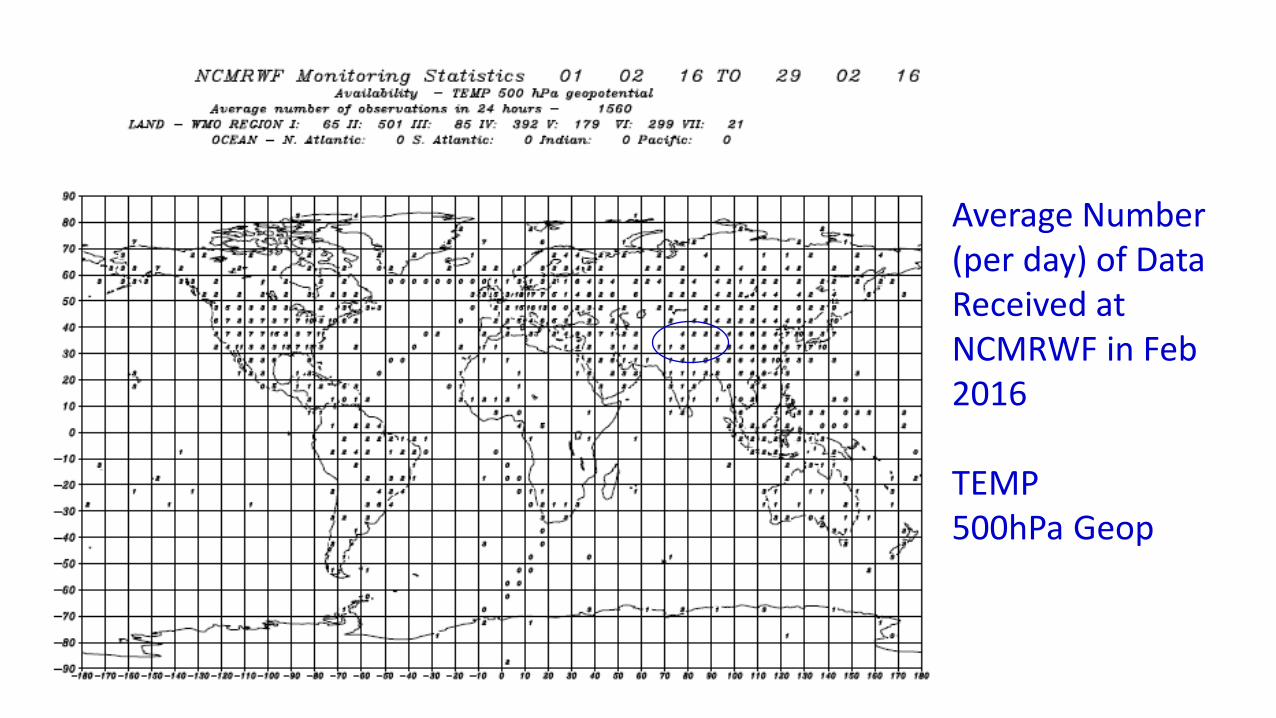
Average Number (per day) of Data Received at NCMRWF in Feb 2016 TEMP 500hPa Geop
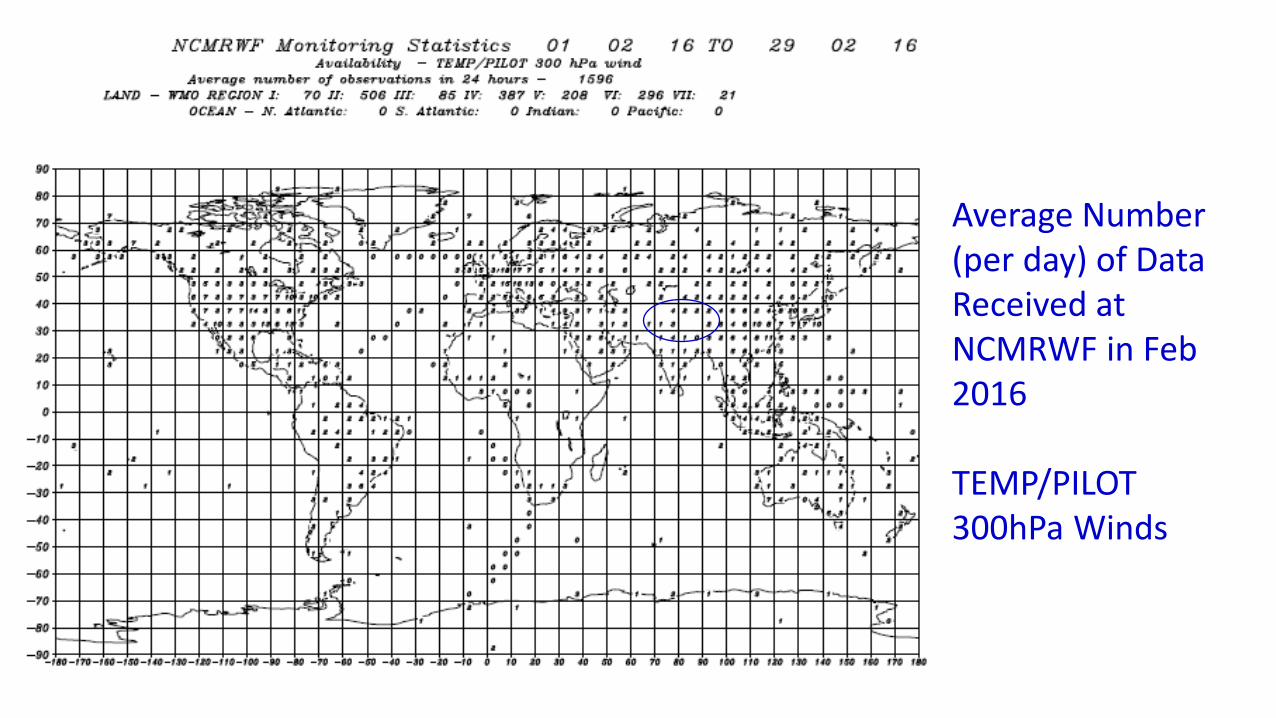
Average Number (per day) of Data Received at NCMRWF in Feb 2016 TEMP/PILOT 300hPa Winds
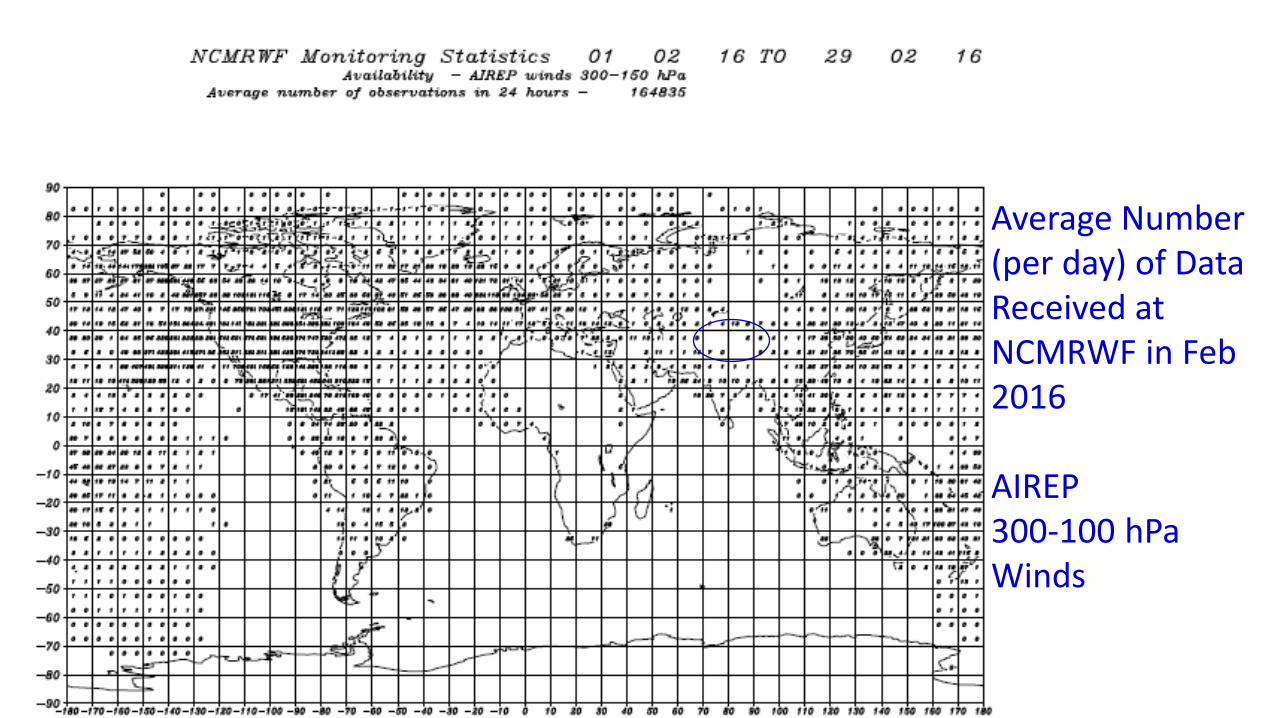
Average Number (per day) of Data Received at NCMRWF in Feb 2016 AIREP 300-100 hPa Winds
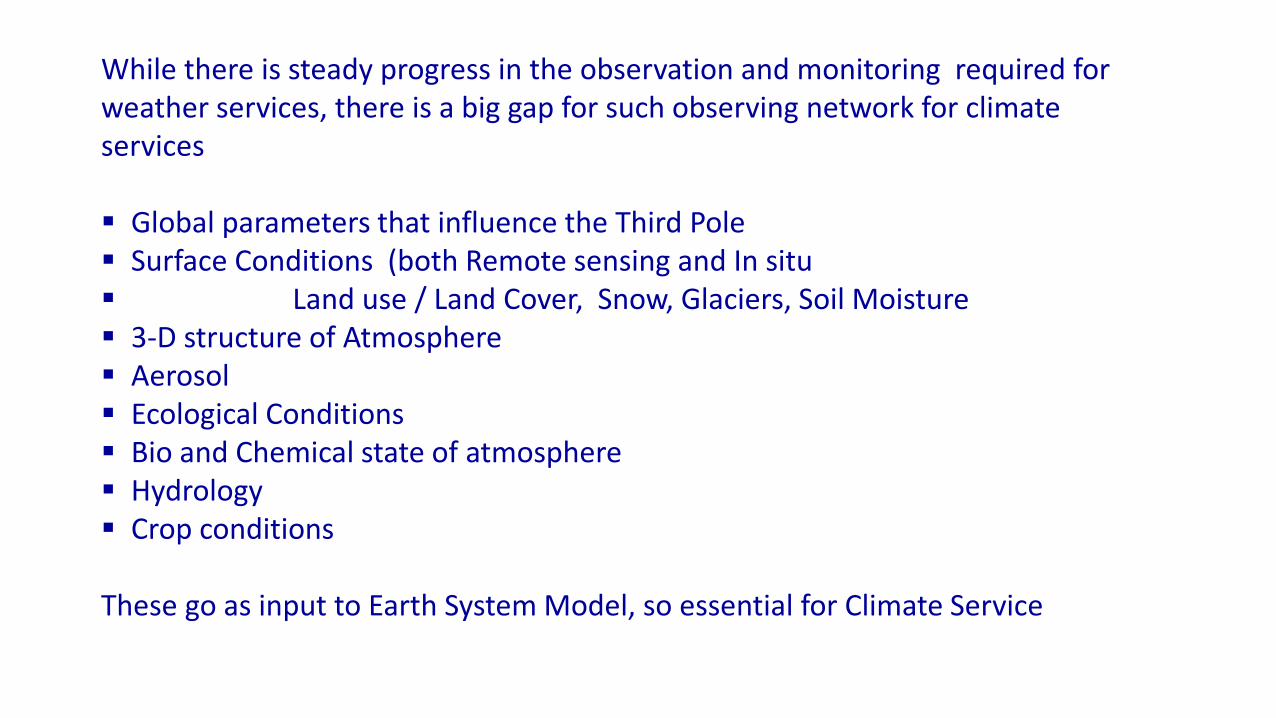
While there is steady progress in the observation and monitoring required for weather services, there is a big gap for such observing network for climate services Global parameters that influence the Third Pole Surface Conditions (both Remote sensing and In situ Land use / Land Cover, Snow, Glaciers, Soil Moisture 3-D structure of Atmosphere Aerosol Ecological Conditions Bio and Chemical state of atmosphere Hydrology Crop conditions
These go as input to Earth System Model, so essential for Climate Service
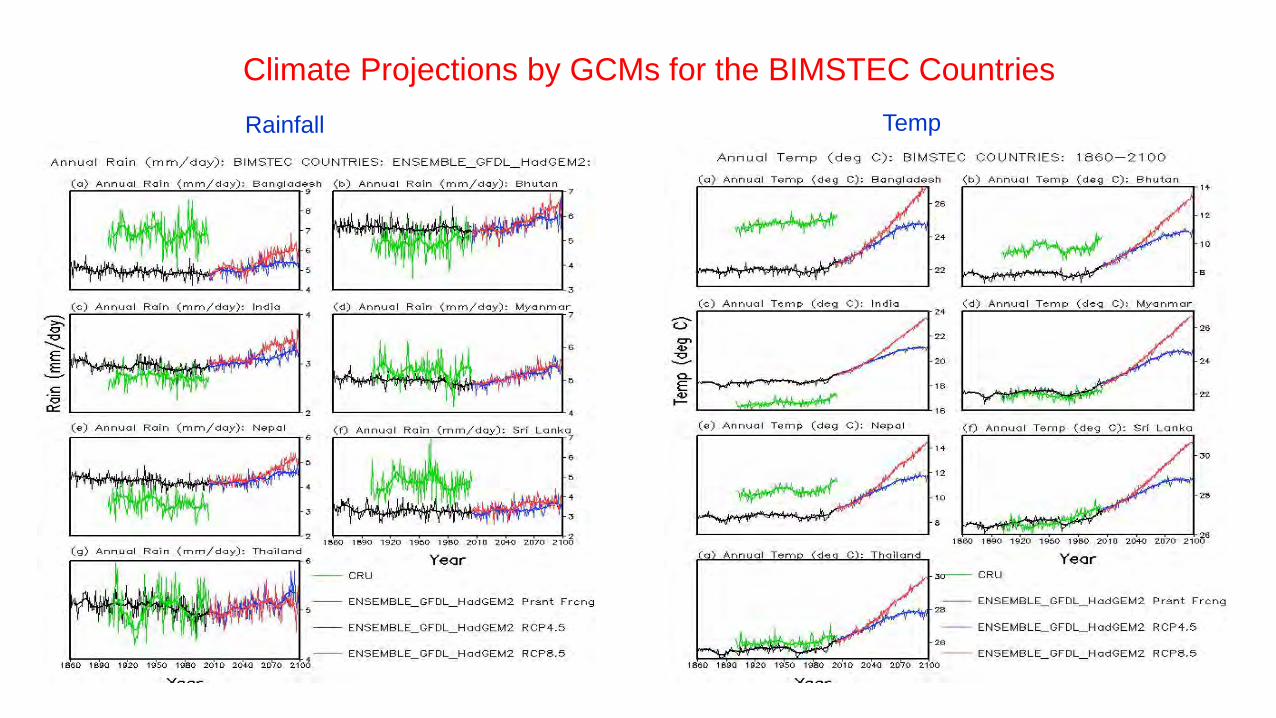
Rainfall Temp
Climate Projections by GCMs for the BIMSTEC Countries

Constraints affecting climate and related data access and data exchange Major concern is the restrictive data policies of some data providers.
Data Agencies for management and exchange of data have their own data policies,
often based on national legislation.
Therefore, many are not able to provide free and unrestricted access to their data.
As a fundamental principle of data sharing within the GFCS, an open door policy should be pursued.
Thus countries should continue to be encouraged to adopt free and unrestricted (non-discriminatory and without charge) international exchange of climate-related data and products.
For Successful Implementation of the Observations and Monitoring Pillar all data needed by climate services be measured and available on a sustained basis. depend on several factors: Agencies having observing networks (such as NMHSs, research institutes,
universities, and the private sector) need to make their observations, data, and observational products available (including historical data and products);
Technological developments and national, regional, or global economic circumstances must enable these entities to collect and deliver observations and data sustainably over the long term.
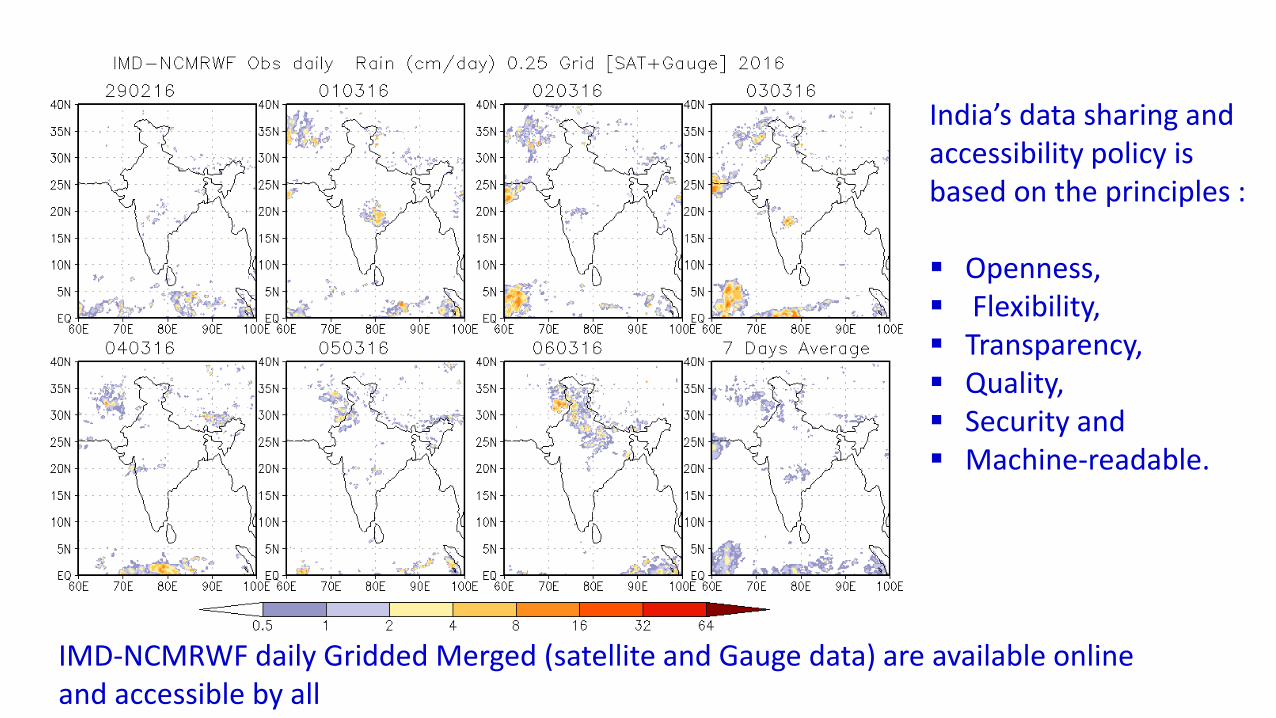
India’s data sharing and accessibility policy is based on the principles : Openness, Flexibility, Transparency, Quality, Security and Machine-readable.
IMD-NCMRWF daily Gridded Merged (satellite and Gauge data) are available online and accessible by all
Addressing observing system gaps Effective engagement among entities operating or coordinating observing systems,
including their users
Implementing agreed observing standards and best practices
Identifying data gaps and building of capacities and technical support to fill them;
Providing adequate funding, human resources, and IT technology
Implementing policies for open and broad access to all data needed for providing climate services at the frequencies required;
Ensuring the relevance of observed variables and data to climate services required by users;
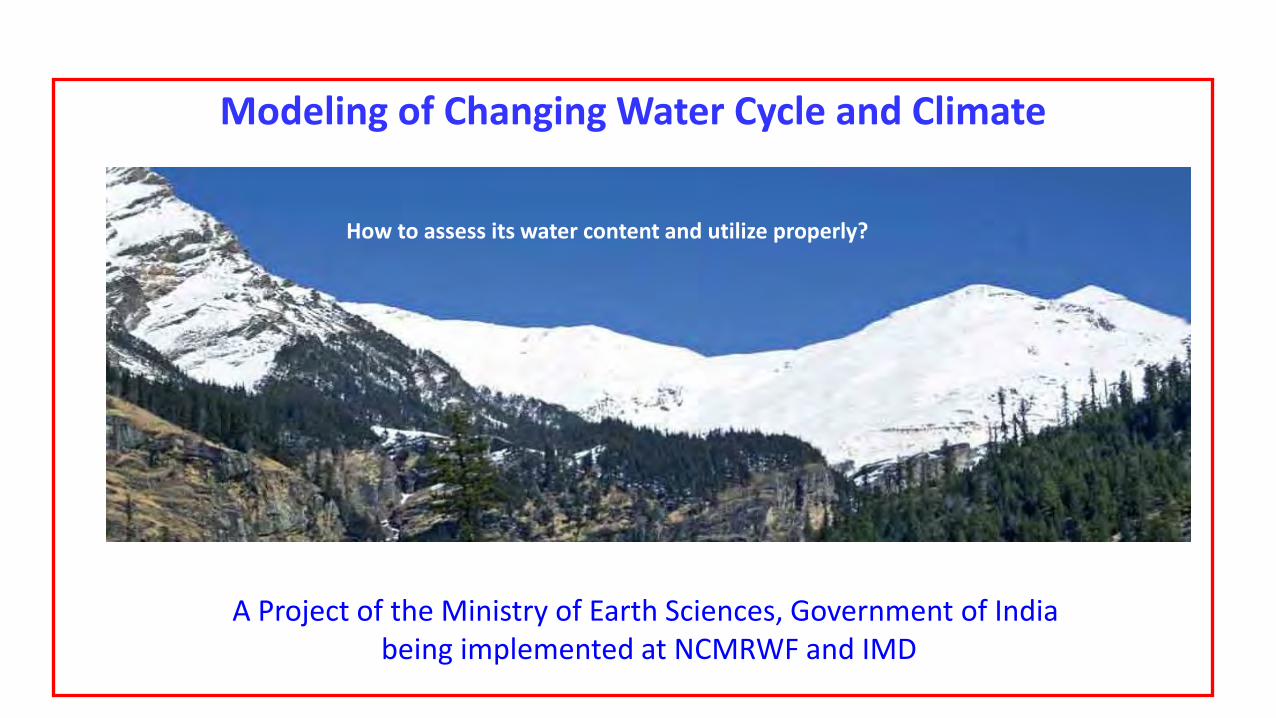
Modeling of Changing Water Cycle and Climate
How to assess its water content and utilize properly?
A Project of the Ministry of Earth Sciences, Government of India being implemented at NCMRWF and IMD
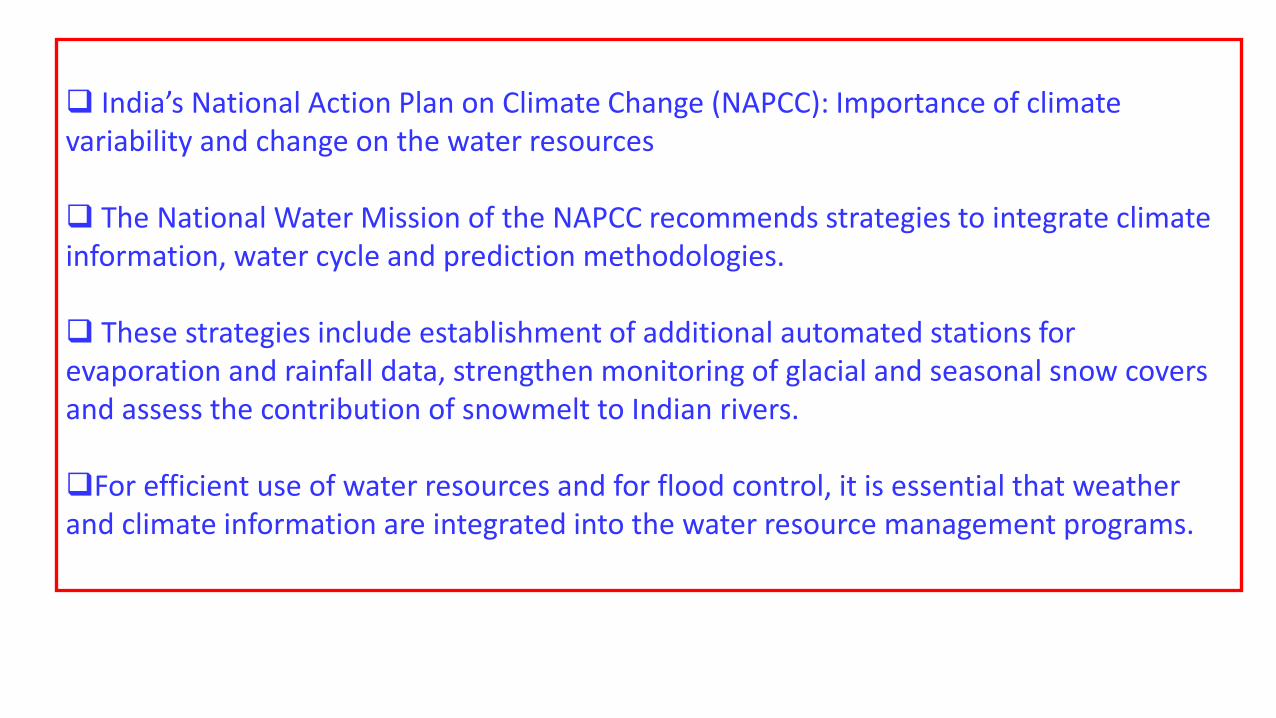
India’s National Action Plan on Climate Change (NAPCC): Importance of climate variability and change on the water resources
The National Water Mission of the NAPCC recommends strategies to integrate climate information, water cycle and prediction methodologies.
These strategies include establishment of additional automated stations for evaporation and rainfall data, strengthen monitoring of glacial and seasonal snow covers and assess the contribution of snowmelt to Indian rivers. For efficient use of water resources and for flood control, it is essential that weather and climate information are integrated into the water resource management programs.
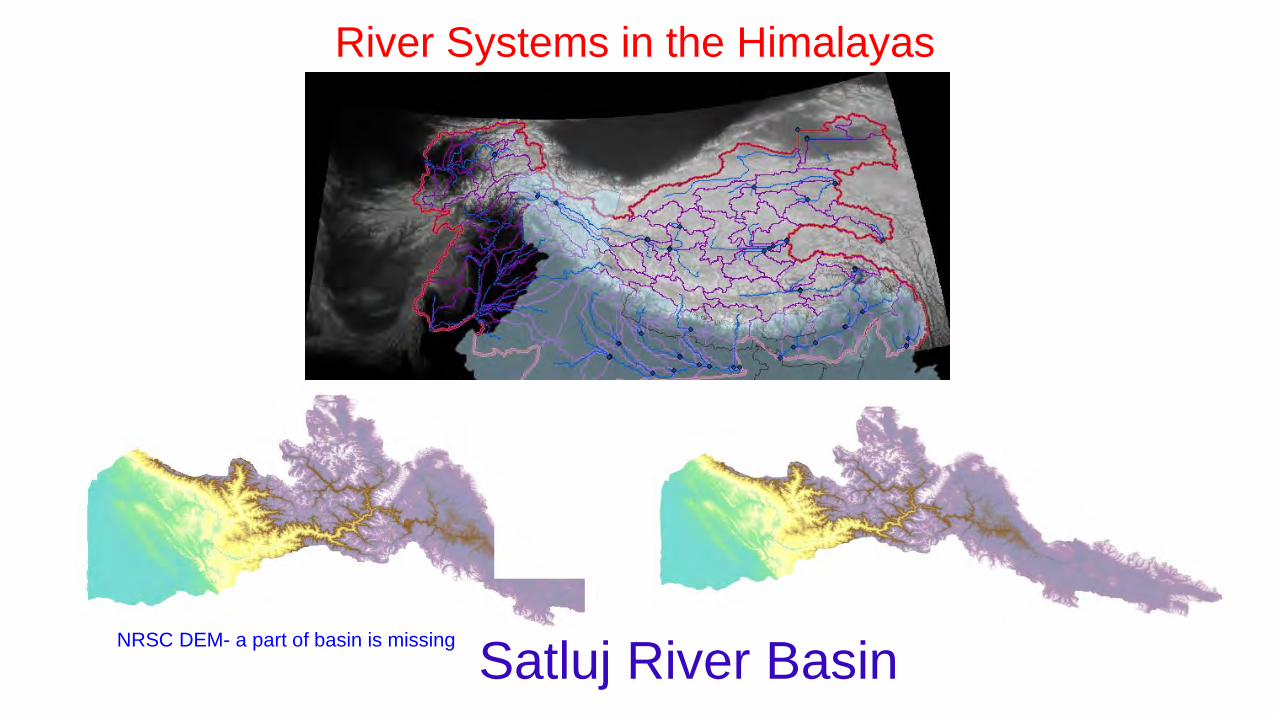
Satluj River Basin
River Systems in the Himalayas
NRSC DEM- a part of basin is missing
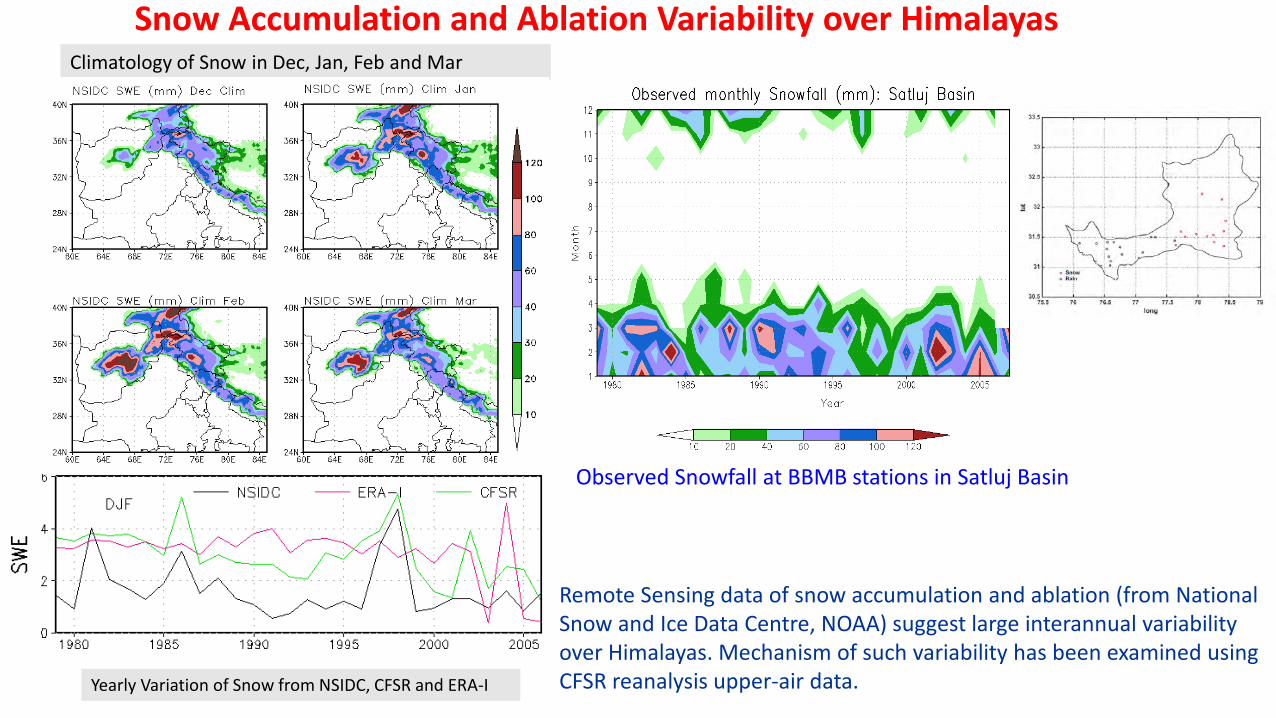
Yearly Variation of Snow from NSIDC, CFSR and ERA-I
Climatology of Snow in Dec, Jan, Feb and Mar
Snow Accumulation and Ablation Variability over Himalayas
Remote Sensing data of snow accumulation and ablation (from National Snow and Ice Data Centre, NOAA) suggest large interannual variability over Himalayas. Mechanism of such variability has been examined using CFSR reanalysis upper-air data.
Observed Snowfall at BBMB stations in Satluj Basin
a
c
e
b
d
f
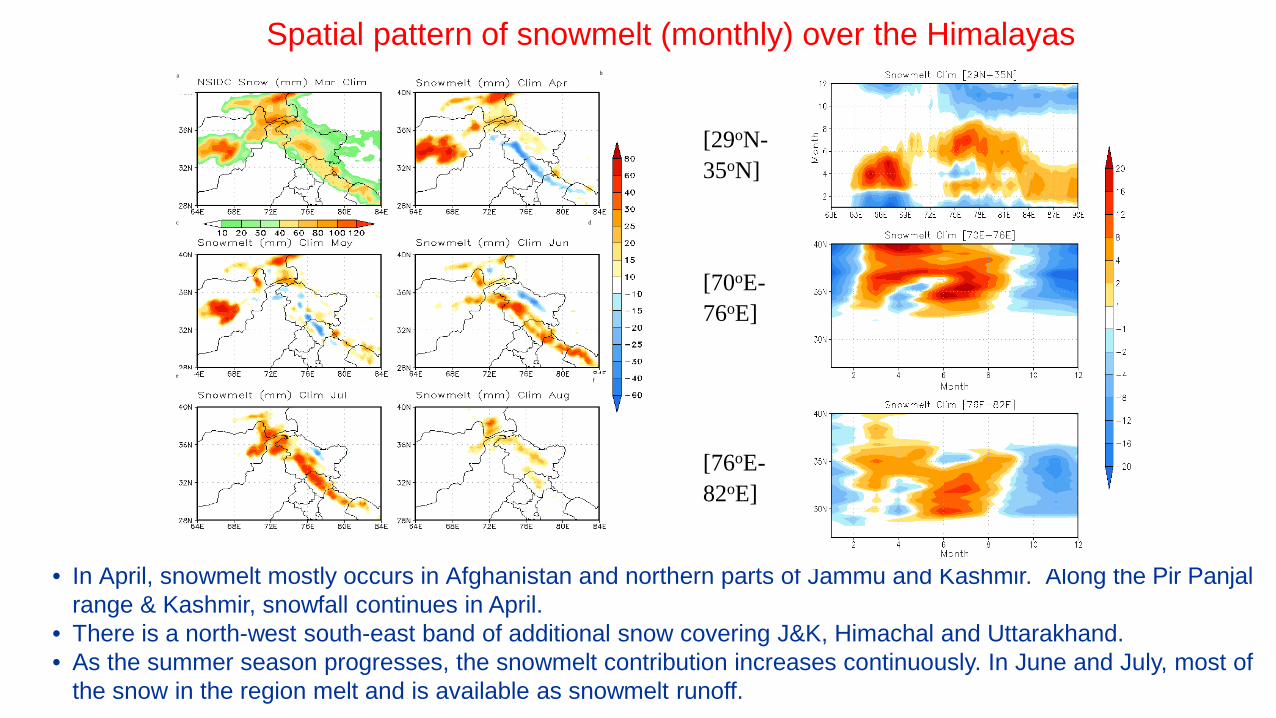
Spatial pattern of snowmelt (monthly) over the Himalayas
• In April, snowmelt mostly occurs in Afghanistan and northern parts of Jammu and Kashmir. Along the Pir Panjal range & Kashmir, snowfall continues in April.
• There is a north-west south-east band of additional snow covering J&K, Himachal and Uttarakhand. • As the summer season progresses, the snowmelt contribution increases continuously. In June and July, most of
the snow in the region melt and is available as snowmelt runoff.
[29oN-35oN] [70oE-76oE] [76oE-82oE]
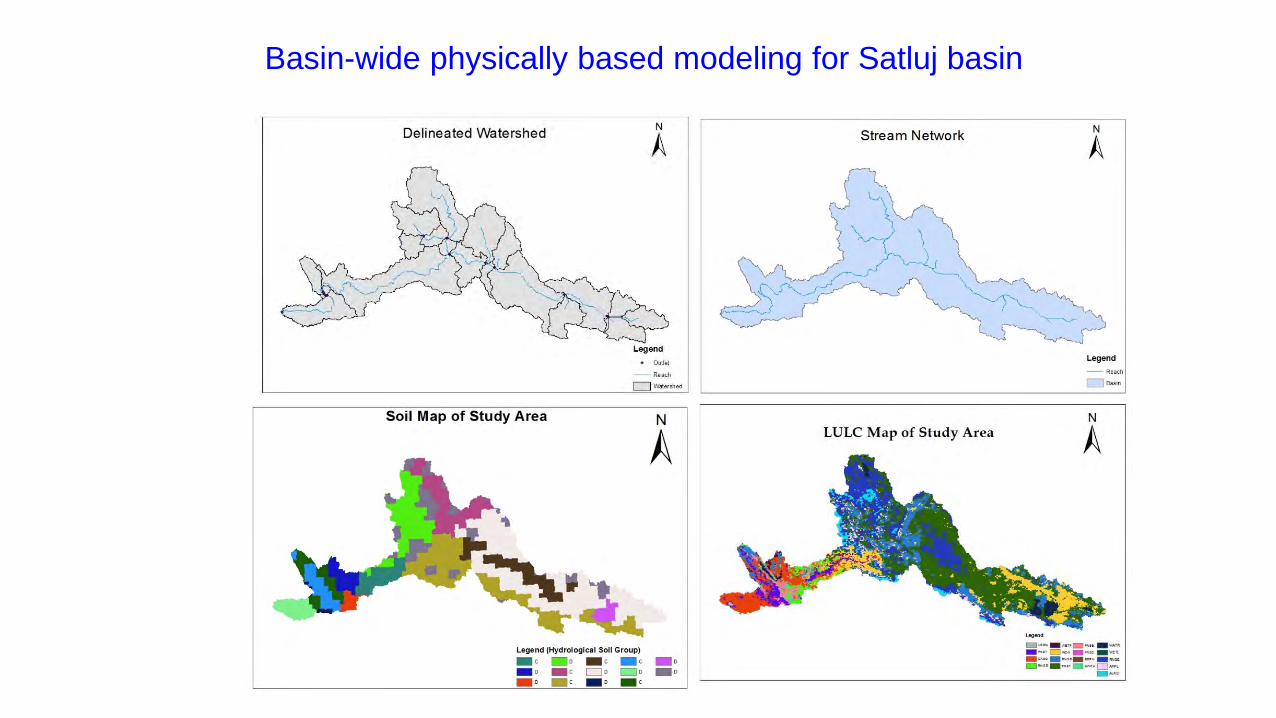
Basin-wide physically based modeling for Satluj basin
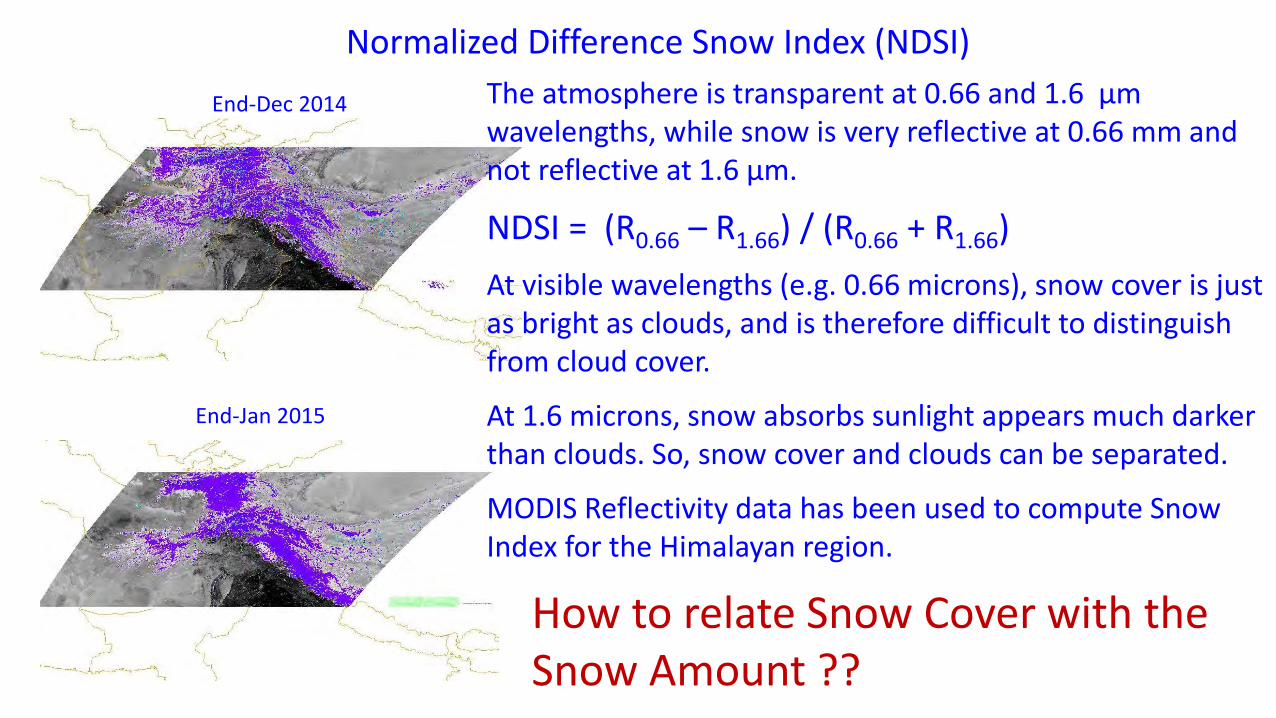
Normalized Difference Snow Index (NDSI) The atmosphere is transparent at 0.66 and 1.6 μm wavelengths, while snow is very reflective at 0.66 mm and not reflective at 1.6 μm.
NDSI = (R0.66 – R1.66) / (R0.66 + R1.66)
At visible wavelengths (e.g. 0.66 microns), snow cover is just as bright as clouds, and is therefore difficult to distinguish from cloud cover.
At 1.6 microns, snow absorbs sunlight appears much darker than clouds. So, snow cover and clouds can be separated.
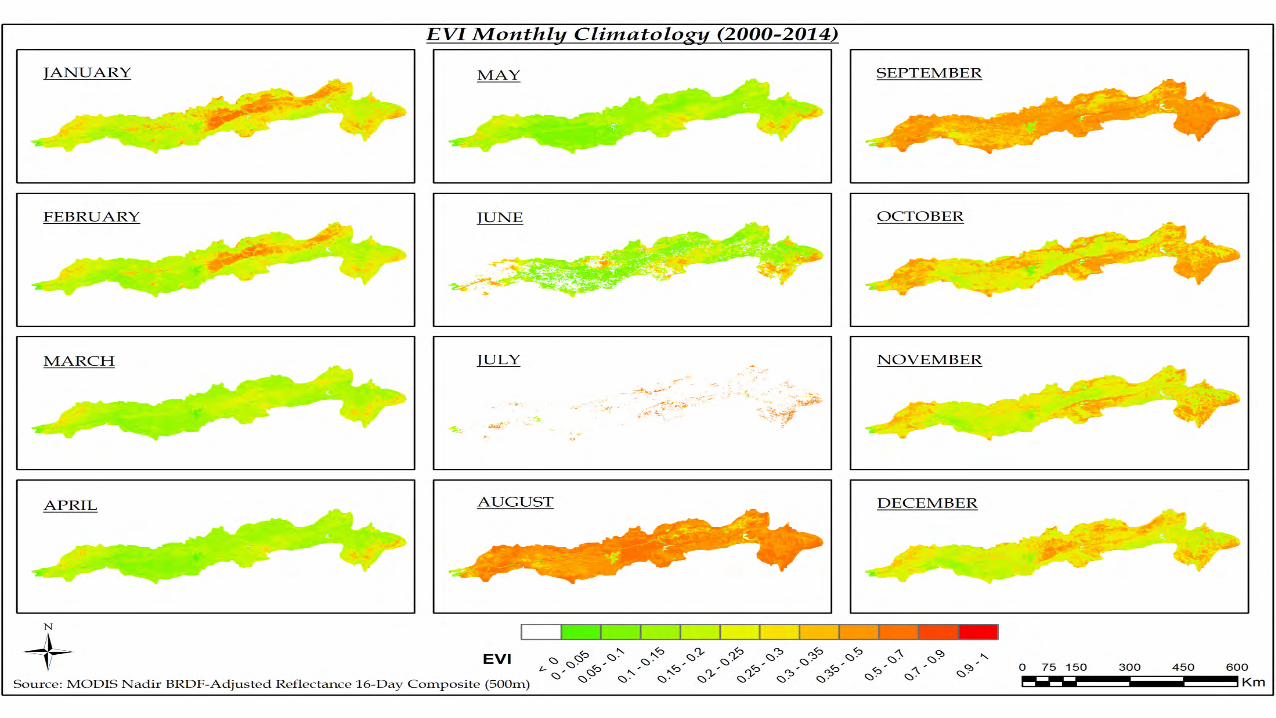
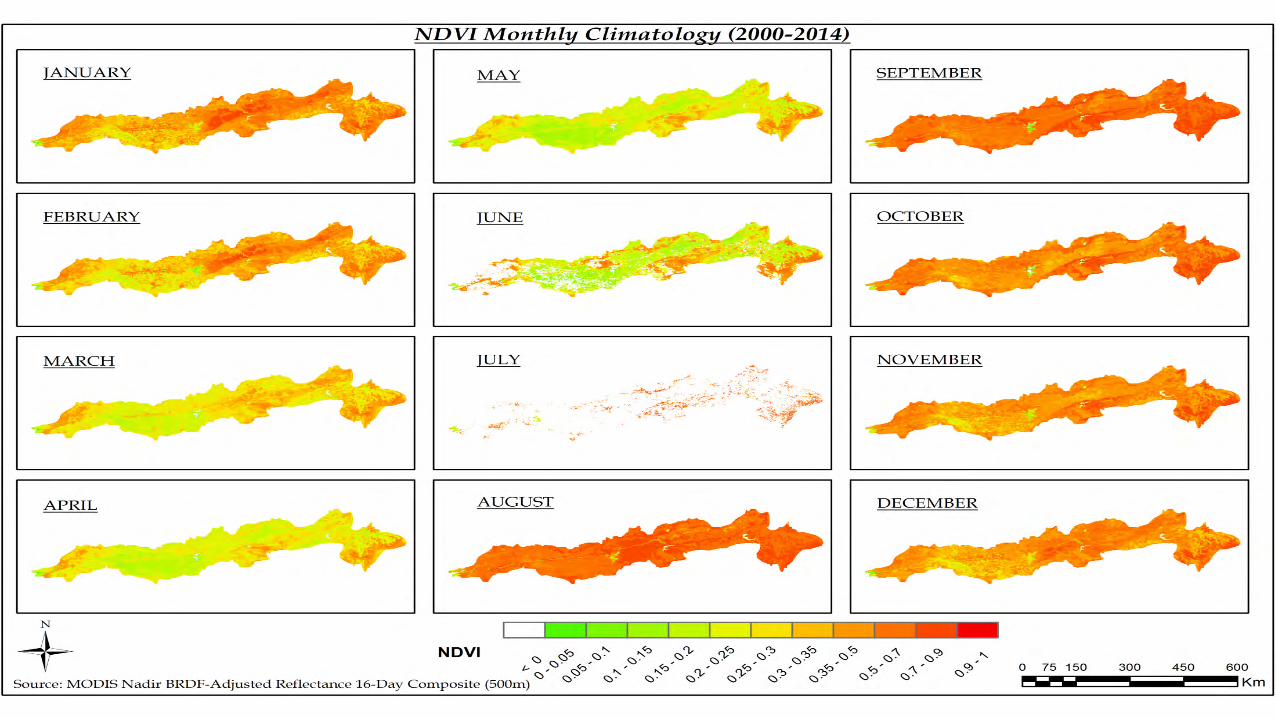
MODIS Reflectivity data has been used to compute Snow Index for the Himalayan region.
End-Dec 2014
End-Jan 2015
How to relate Snow Cover with the Snow Amount ??
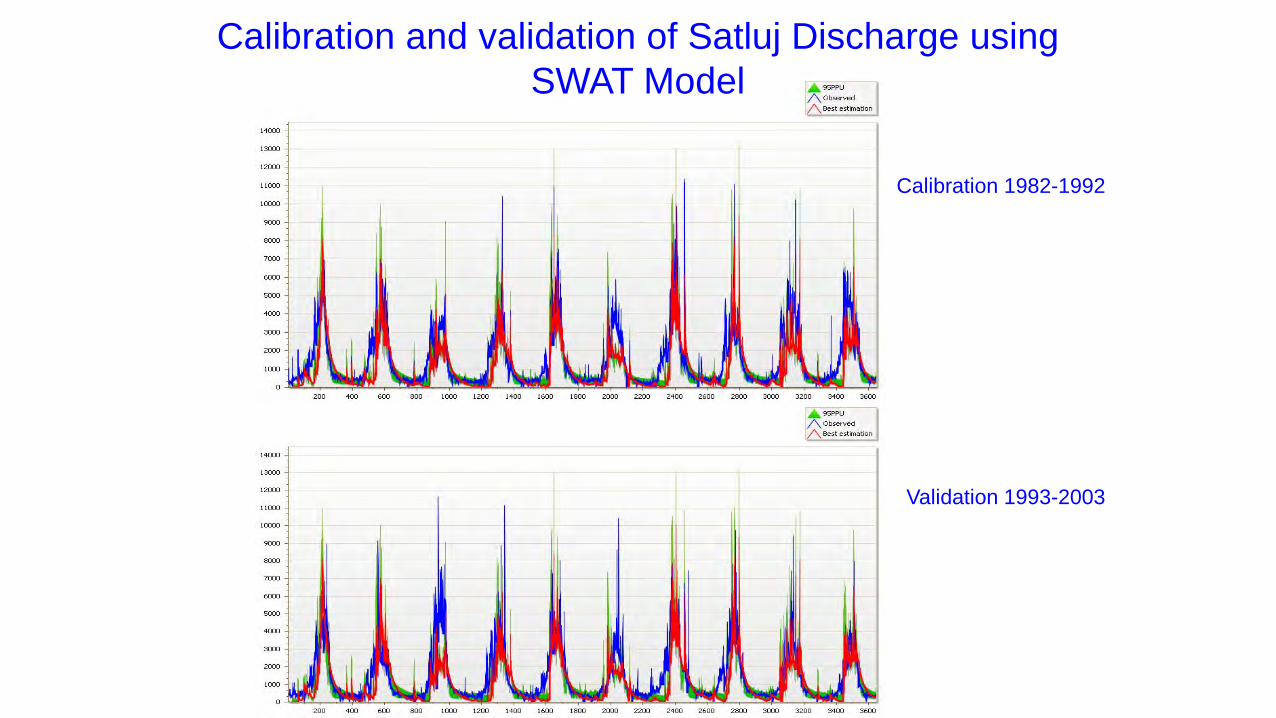
Calibration 1982-1992
Validation 1993-2003
Calibration and validation of Satluj Discharge using SWAT Model
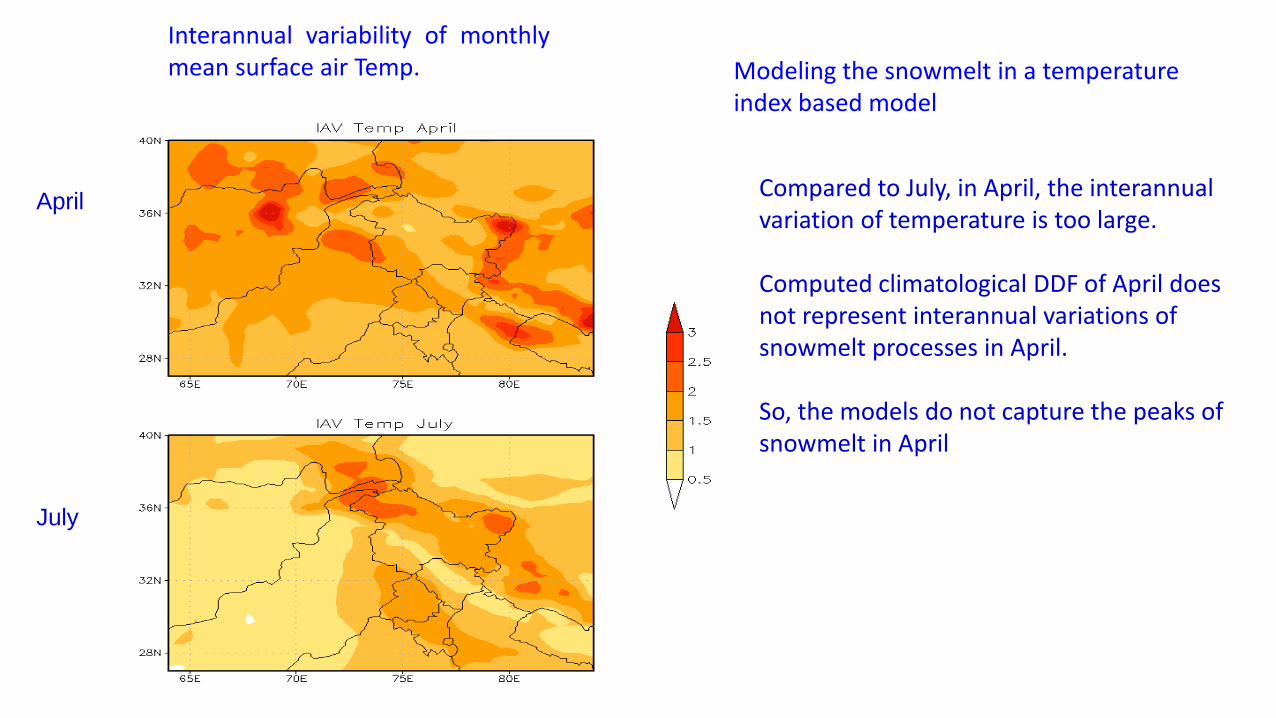
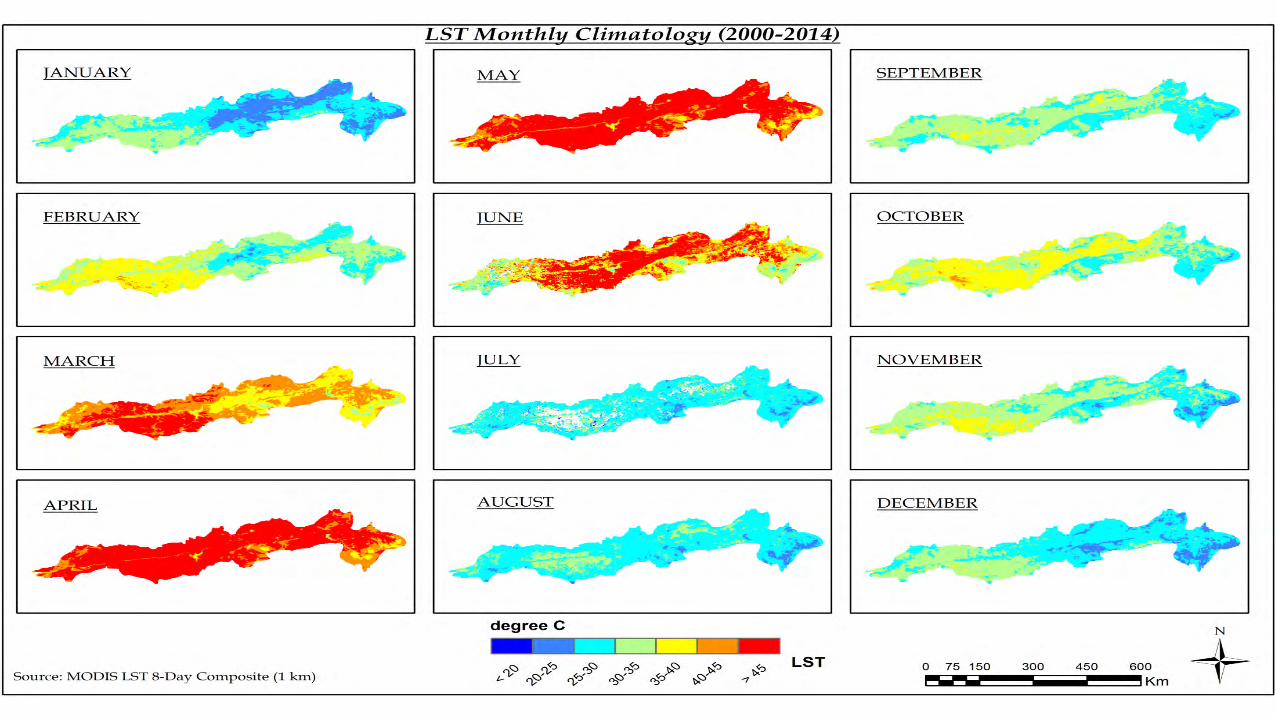
Interannual variability of monthly mean surface air Temp.
Compared to July, in April, the interannual variation of temperature is too large. Computed climatological DDF of April does not represent interannual variations of snowmelt processes in April. So, the models do not capture the peaks of snowmelt in April
April July
Modeling the snowmelt in a temperature index based model
India’s Cryosphere Research The Himalaya forms the most important concentration of snow covered region outside the polar region.
The Himalayan glaciers are highly sensitive to the on-going warming. The detailed glacier inventory of Indian Himalayas (GSI, SAC) indicates presence of 9579 glaciers in the Himalaya, some of which form the perennial source of major rivers.
Changes in glaciers are one of the clearest indicators of alterations in regional climate, since they are governed by changes in accumulation (from snowfall) and ablation (by melting of ice).
The main objectives are 1.To study the dynamics and the rate of change in glaciers to understand its impact on hydrology, ecology and climate; 2.To assess the climate change using ice as an archive of information on past climate and its future implications. 3.To study the biogeochemical aspects of Himalayan ice and compare it with the polar environment.
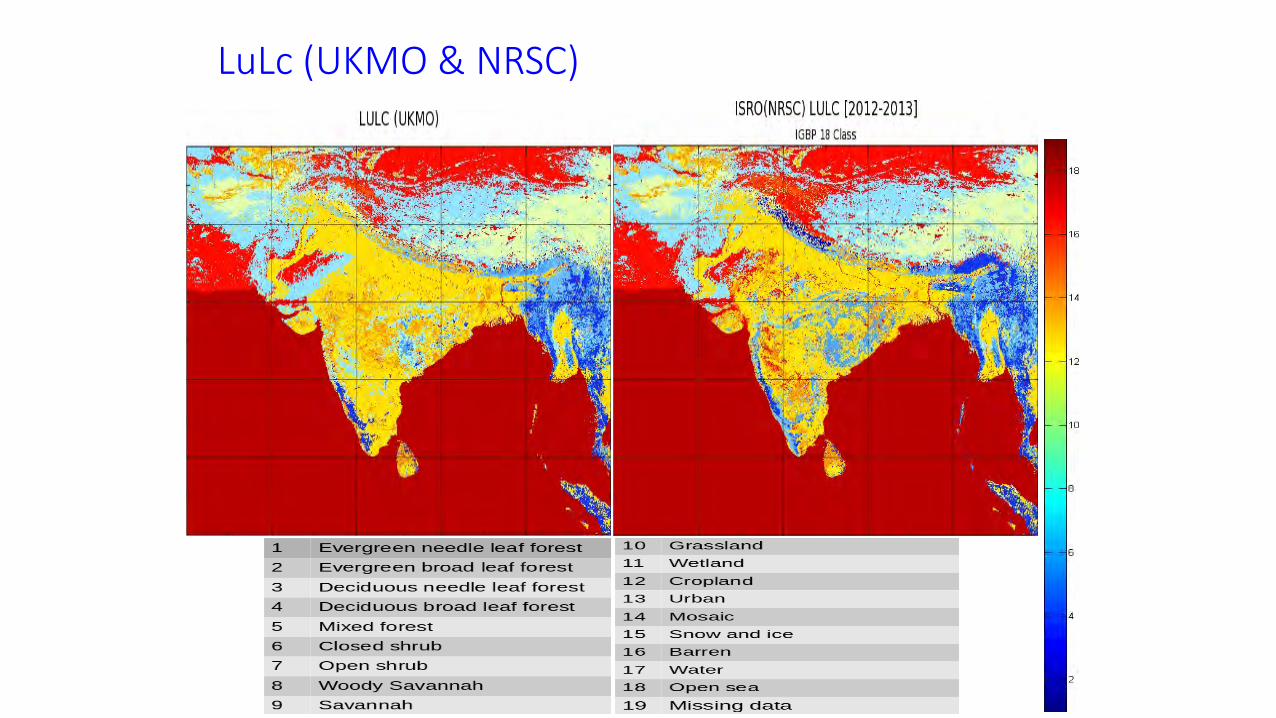
LuLc (UKMO & NRSC)
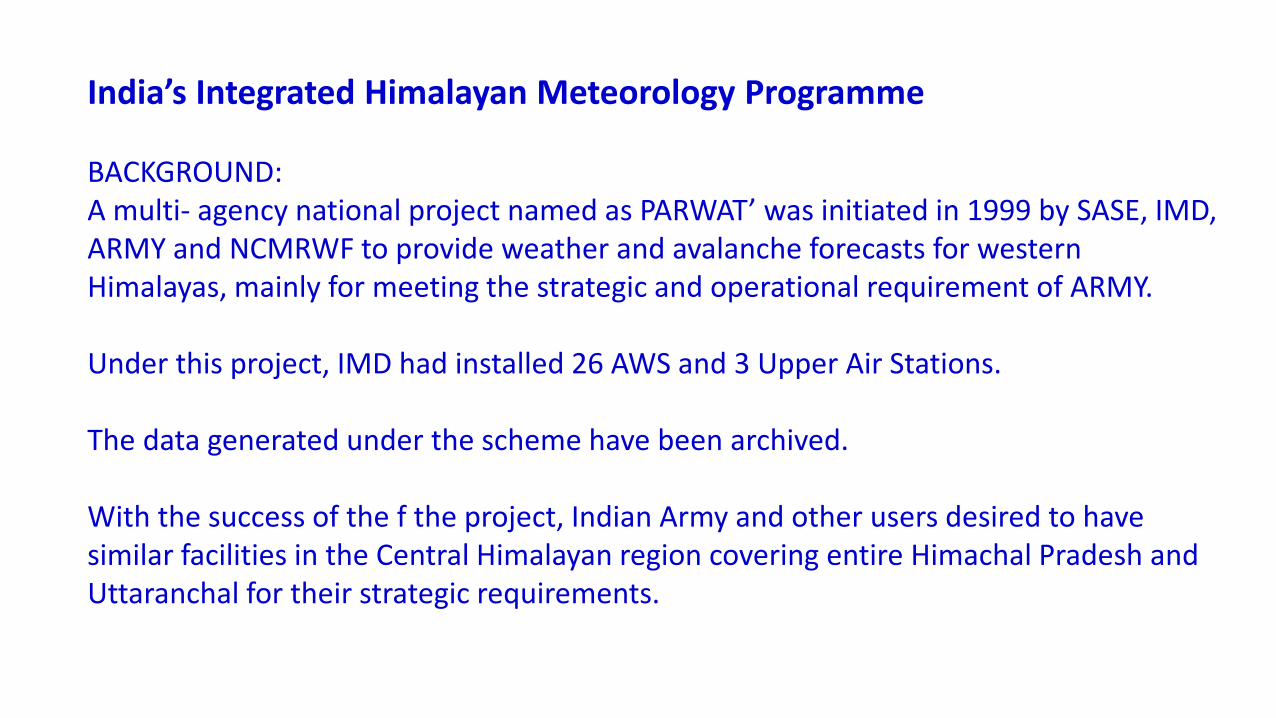
India’s Integrated Himalayan Meteorology Programme BACKGROUND: A multi- agency national project named as PARWAT’ was initiated in 1999 by SASE, IMD, ARMY and NCMRWF to provide weather and avalanche forecasts for western Himalayas, mainly for meeting the strategic and operational requirement of ARMY. Under this project, IMD had installed 26 AWS and 3 Upper Air Stations. The data generated under the scheme have been archived. With the success of the f the project, Indian Army and other users desired to have similar facilities in the Central Himalayan region covering entire Himachal Pradesh and Uttaranchal for their strategic requirements.
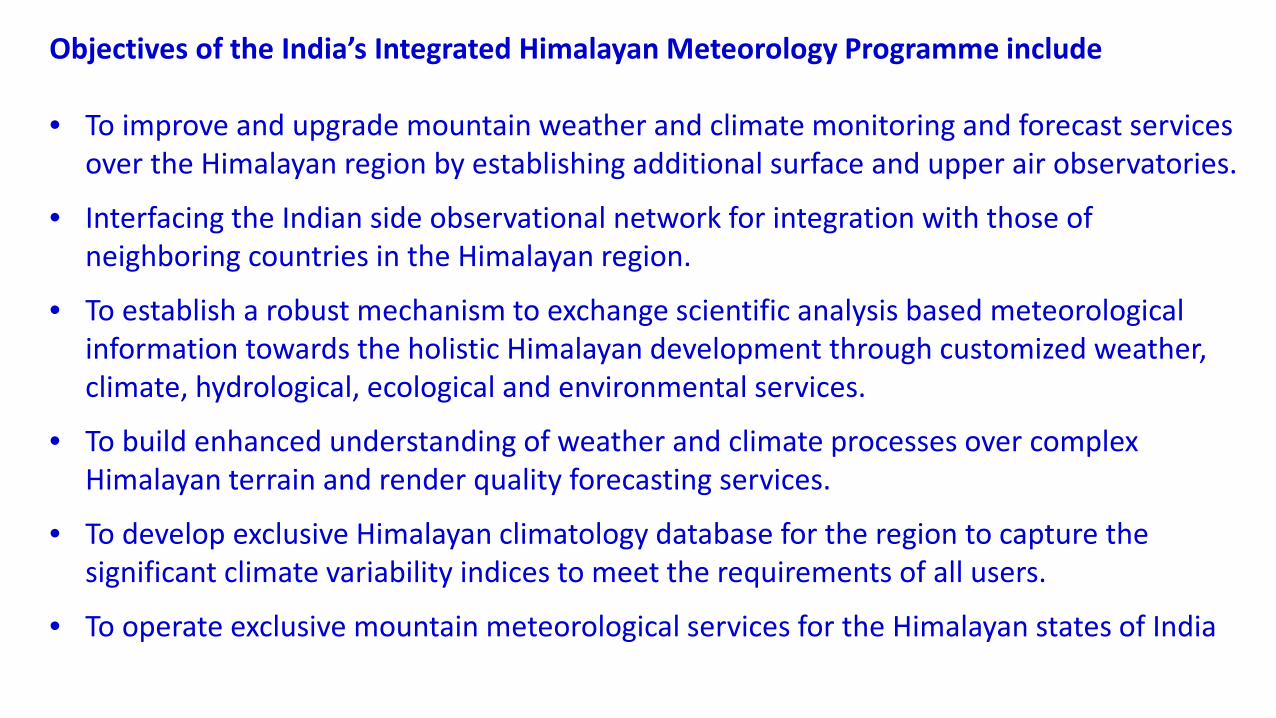
Objectives of the India’s Integrated Himalayan Meteorology Programme include • To improve and upgrade mountain weather and climate monitoring and forecast services
over the Himalayan region by establishing additional surface and upper air observatories.
• Interfacing the Indian side observational network for integration with those of neighboring countries in the Himalayan region.
• To establish a robust mechanism to exchange scientific analysis based meteorological information towards the holistic Himalayan development through customized weather, climate, hydrological, ecological and environmental services.
• To build enhanced understanding of weather and climate processes over complex Himalayan terrain and render quality forecasting services.
• To develop exclusive Himalayan climatology database for the region to capture the significant climate variability indices to meet the requirements of all users.
• To operate exclusive mountain meteorological services for the Himalayan states of India
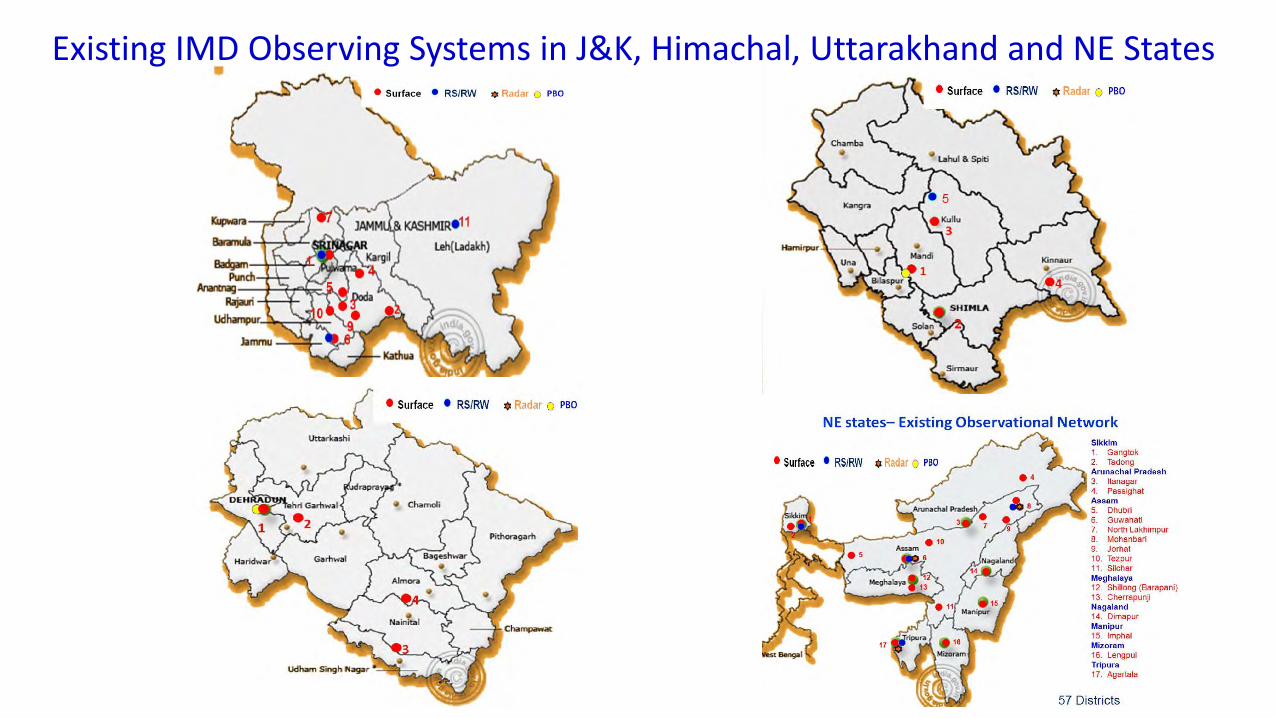
Existing IMD Observing Systems in J&K, Himachal, Uttarakhand and NE States
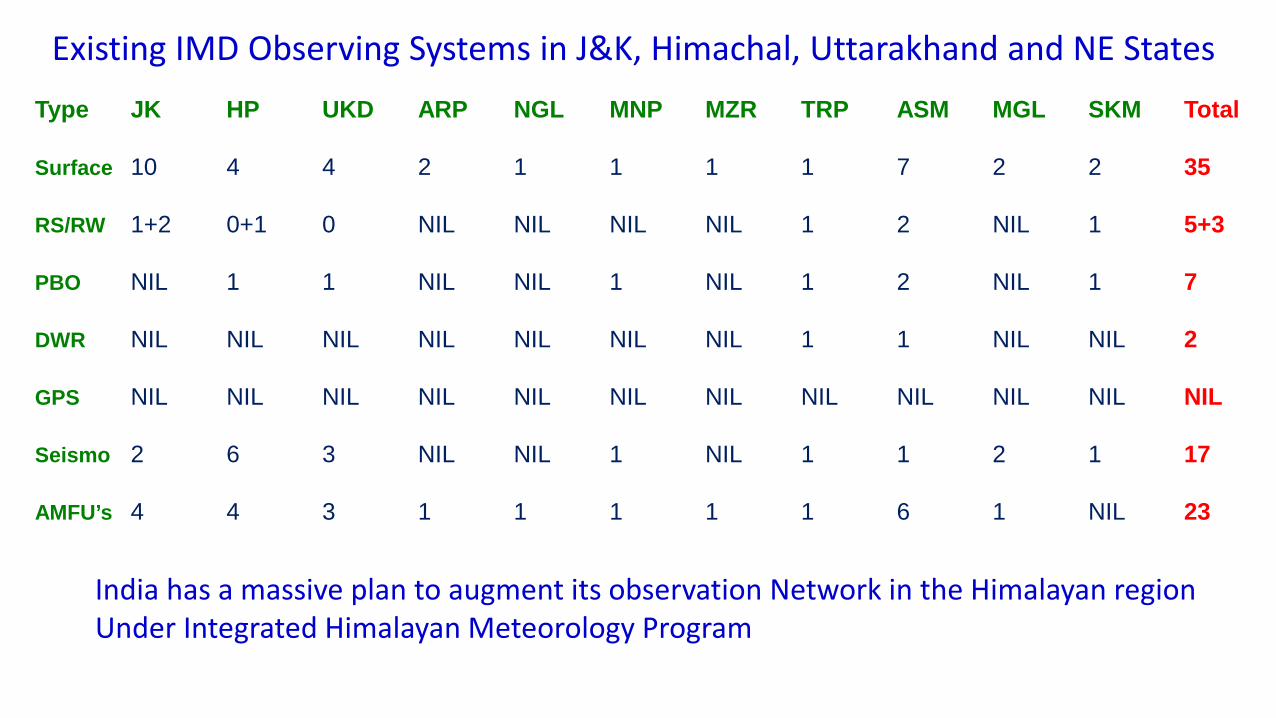
Type JK HP UKD ARP NGL MNP MZR TRP ASM MGL SKM Total Surface 10 4 4 2 1 1 1 1 7 2 2 35 RS/RW 1+2 0+1 0 NIL NIL NIL NIL 1 2 NIL 1 5+3 PBO NIL 1 1 NIL NIL 1 NIL 1 2 NIL 1 7 DWR NIL NIL NIL NIL NIL NIL NIL 1 1 NIL NIL 2 GPS NIL NIL NIL NIL NIL NIL NIL NIL NIL NIL NIL NIL Seismo 2 6 3 NIL NIL 1 NIL 1 1 2 1 17 AMFU’s 4 4 3 1 1 1 1 1 6 1 NIL 23
Existing IMD Observing Systems in J&K, Himachal, Uttarakhand and NE States
India has a massive plan to augment its observation Network in the Himalayan region Under Integrated Himalayan Meteorology Program
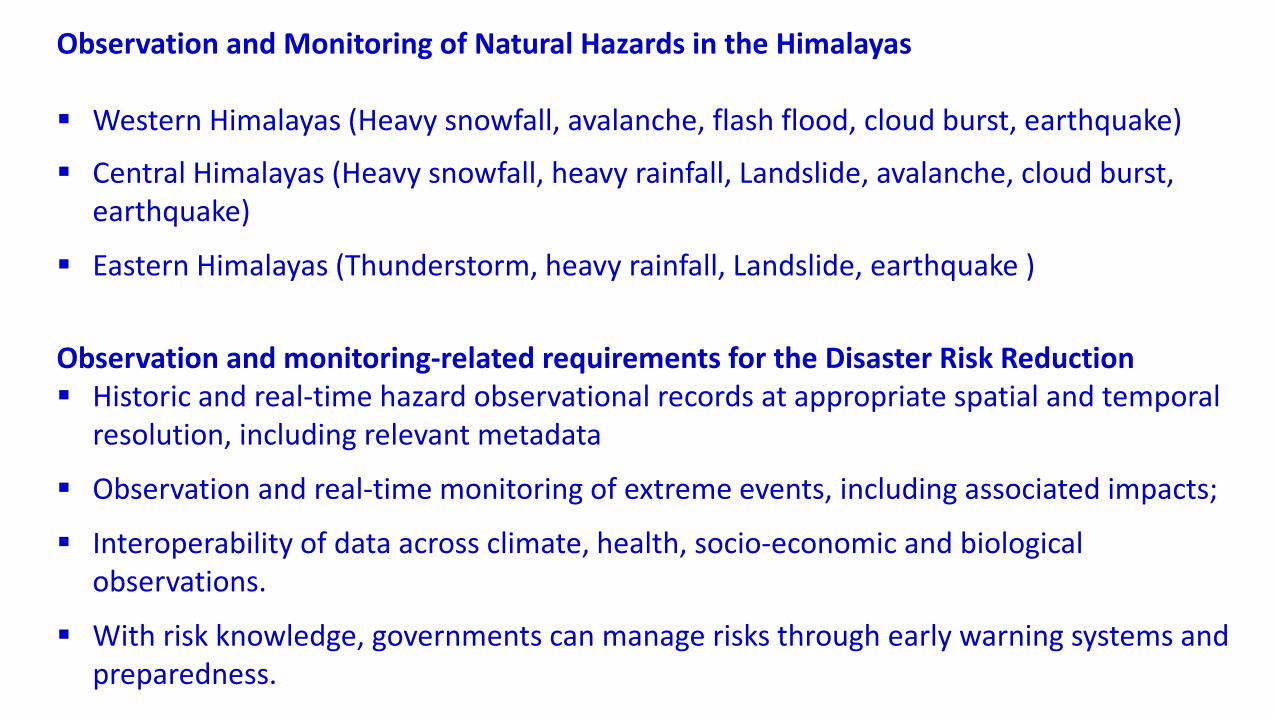
Observation and Monitoring of Natural Hazards in the Himalayas
Western Himalayas (Heavy snowfall, avalanche, flash flood, cloud burst, earthquake)
Central Himalayas (Heavy snowfall, heavy rainfall, Landslide, avalanche, cloud burst, earthquake)
Eastern Himalayas (Thunderstorm, heavy rainfall, Landslide, earthquake )
Observation and monitoring-related requirements for the Disaster Risk Reduction Historic and real-time hazard observational records at appropriate spatial and temporal
resolution, including relevant metadata
Observation and real-time monitoring of extreme events, including associated impacts;
Interoperability of data across climate, health, socio-economic and biological observations.
With risk knowledge, governments can manage risks through early warning systems and preparedness.
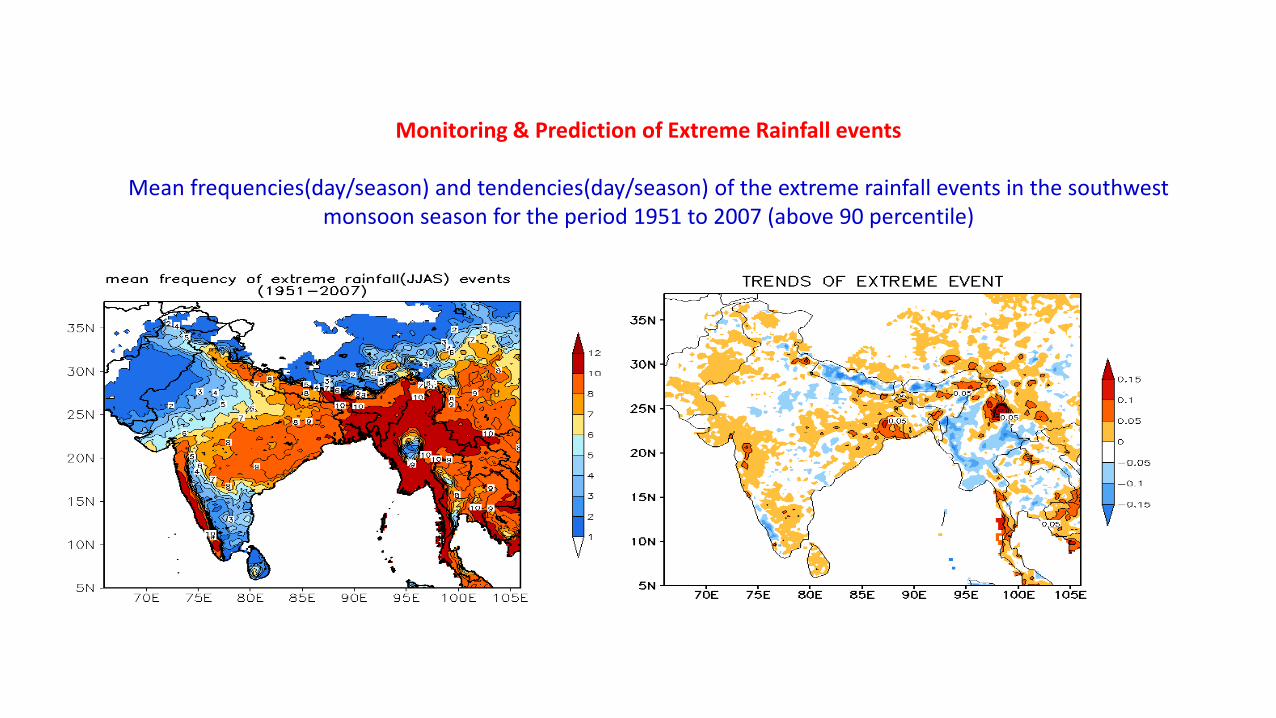
Monitoring & Prediction of Extreme Rainfall events
Mean frequencies(day/season) and tendencies(day/season) of the extreme rainfall events in the southwest monsoon season for the period 1951 to 2007 (above 90 percentile)
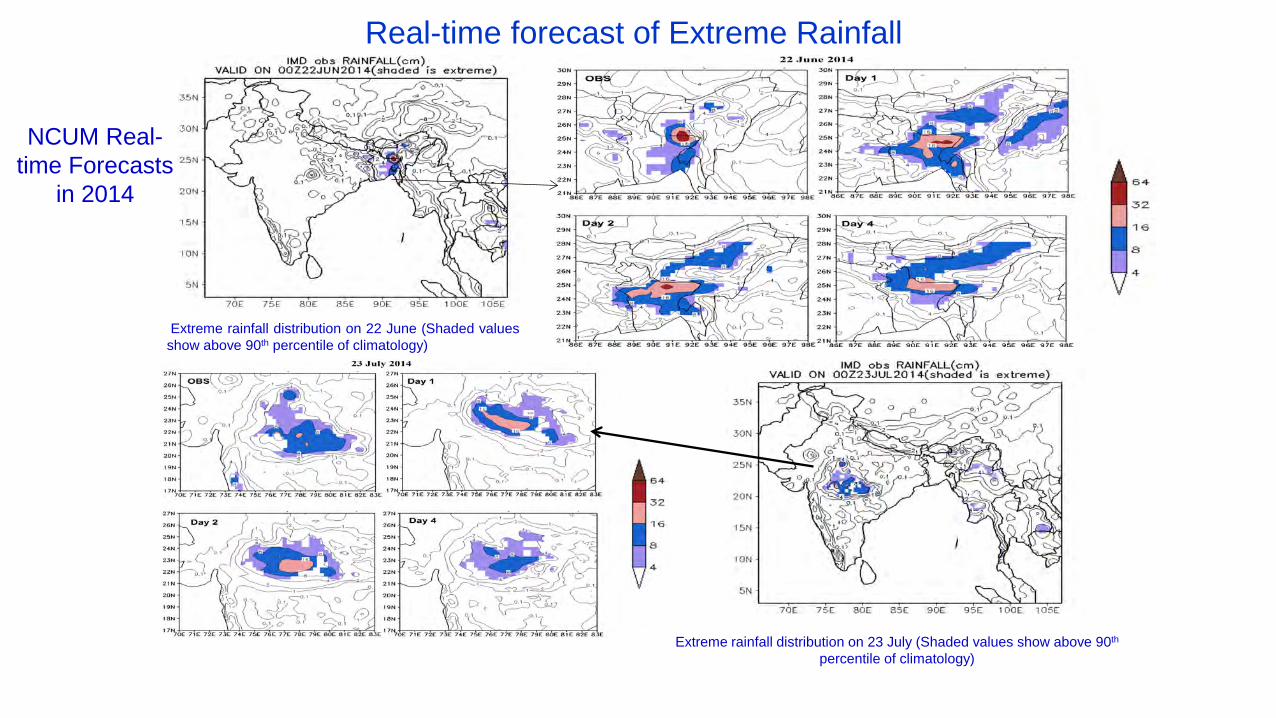
Extreme rainfall distribution on 22 June (Shaded values show above 90th percentile of climatology)
Extreme rainfall distribution on 23 July (Shaded values show above 90th percentile of climatology)
NCUM Real-time Forecasts
in 2014
Real-time forecast of Extreme Rainfall
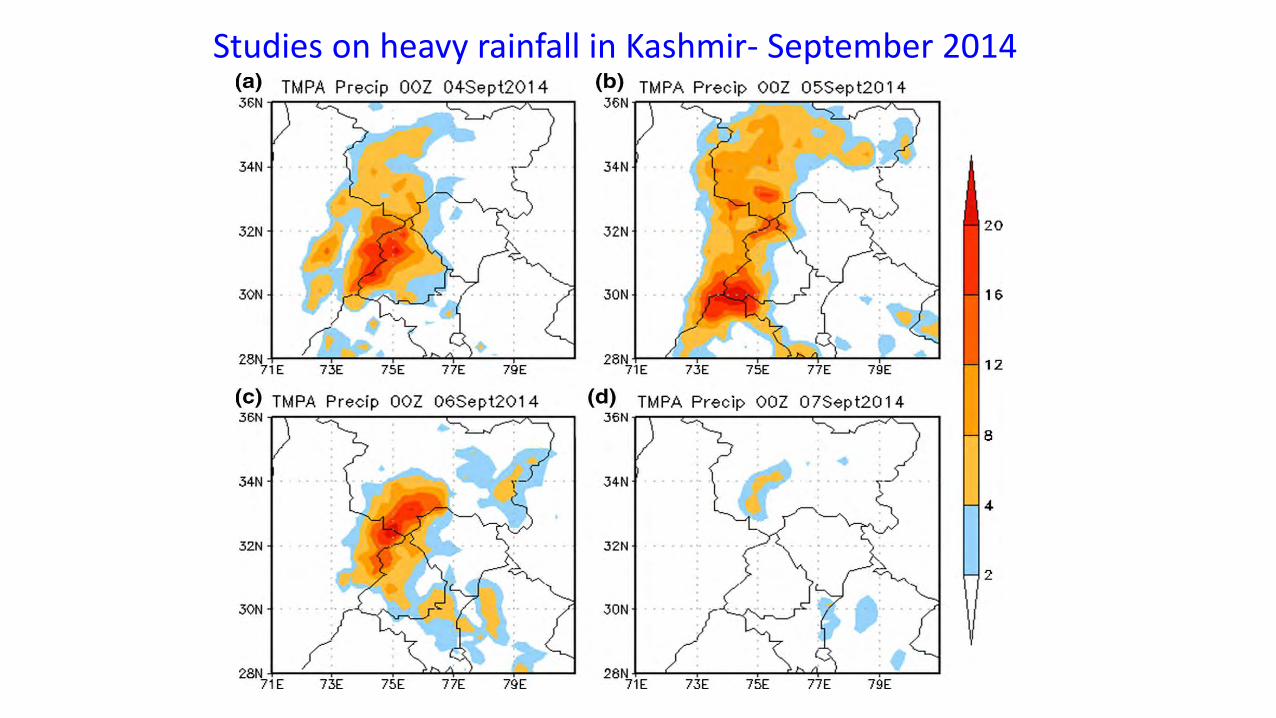
Studies on heavy rainfall in Kashmir- September 2014
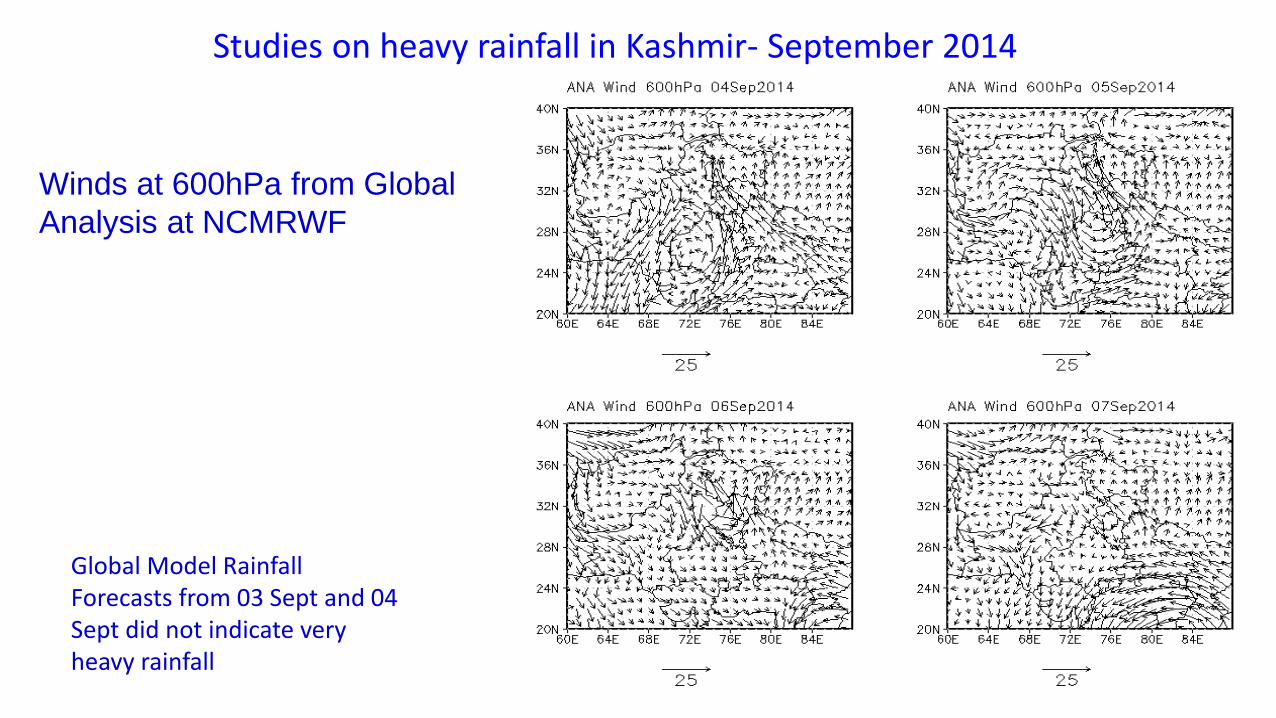
Winds at 600hPa from Global Analysis at NCMRWF
Studies on heavy rainfall in Kashmir- September 2014
Global Model Rainfall Forecasts from 03 Sept and 04 Sept did not indicate very heavy rainfall
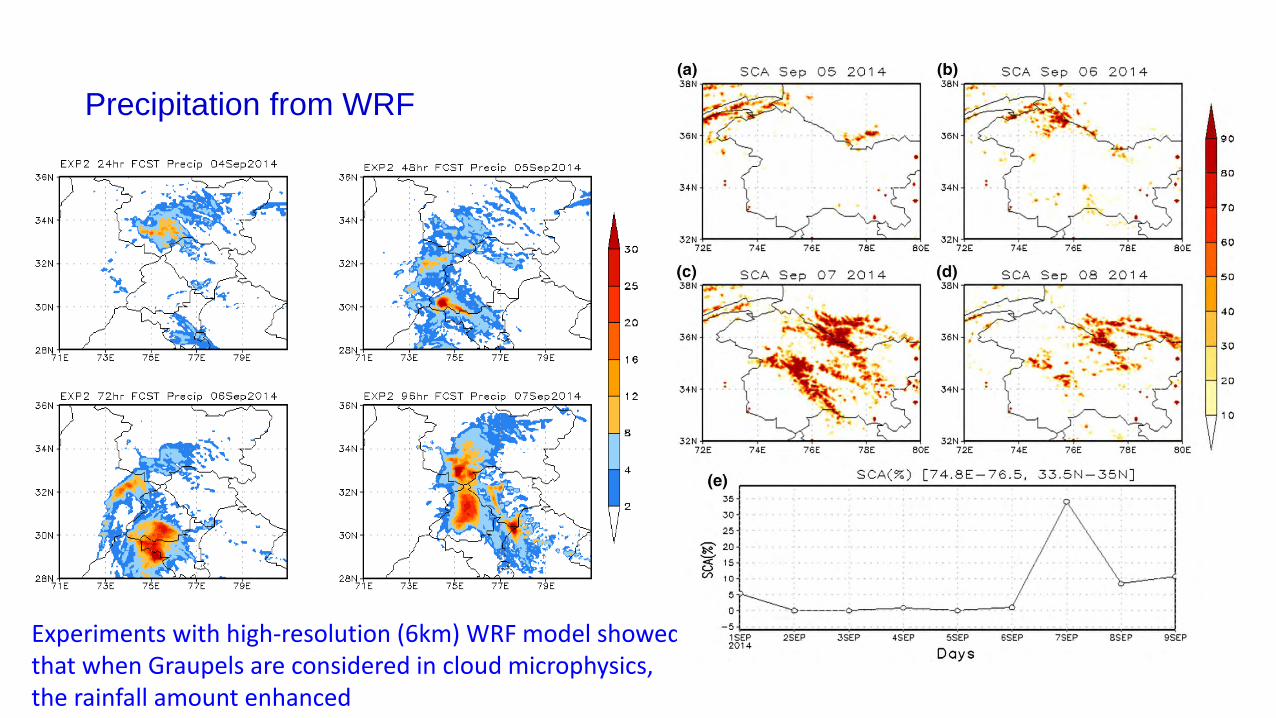
Precipitation from WRF
Experiments with high-resolution (6km) WRF model showed that when Graupels are considered in cloud microphysics, the rainfall amount enhanced
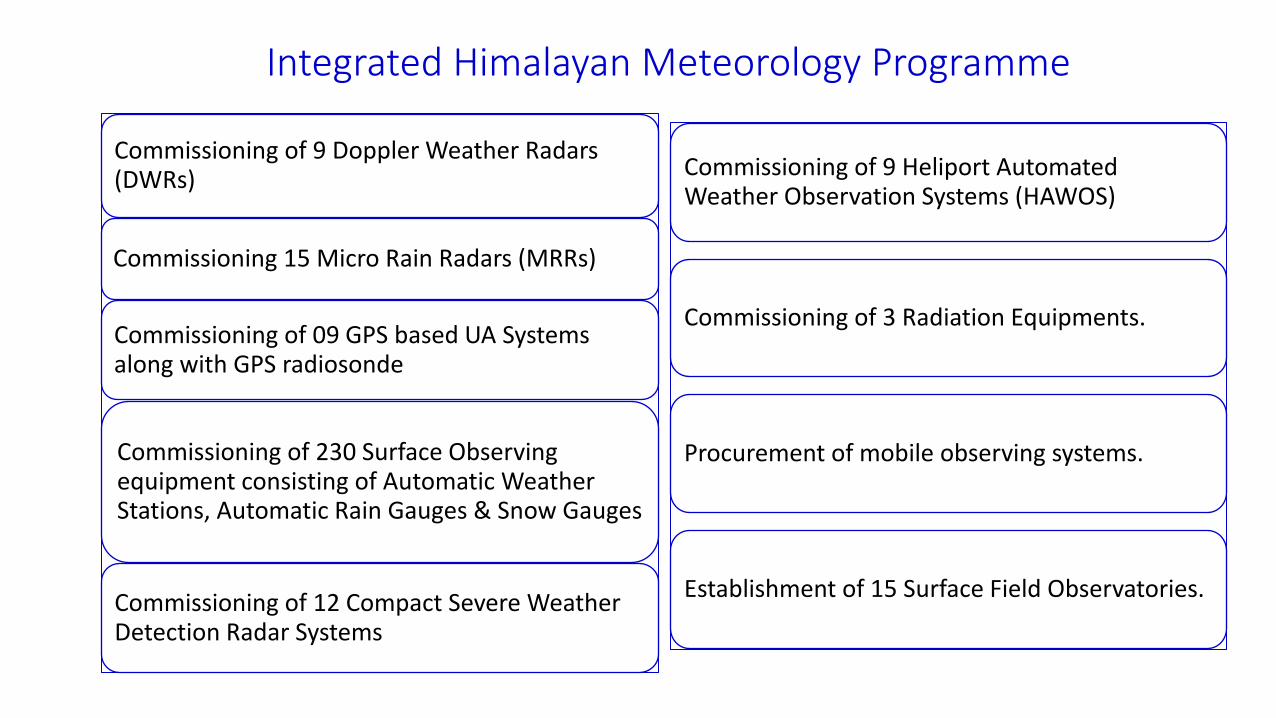
Integrated Himalayan Meteorology Programme
Commissioning of 9 Doppler Weather Radars (DWRs)
Commissioning 15 Micro Rain Radars (MRRs)
Commissioning of 09 GPS based UA Systems along with GPS radiosonde
Commissioning of 230 Surface Observing equipment consisting of Automatic Weather Stations, Automatic Rain Gauges & Snow Gauges
Commissioning of 12 Compact Severe Weather Detection Radar Systems
Commissioning of 9 Heliport Automated Weather Observation Systems (HAWOS)
Commissioning of 3 Radiation Equipments.
Procurement of mobile observing systems.
Establishment of 15 Surface Field Observatories.
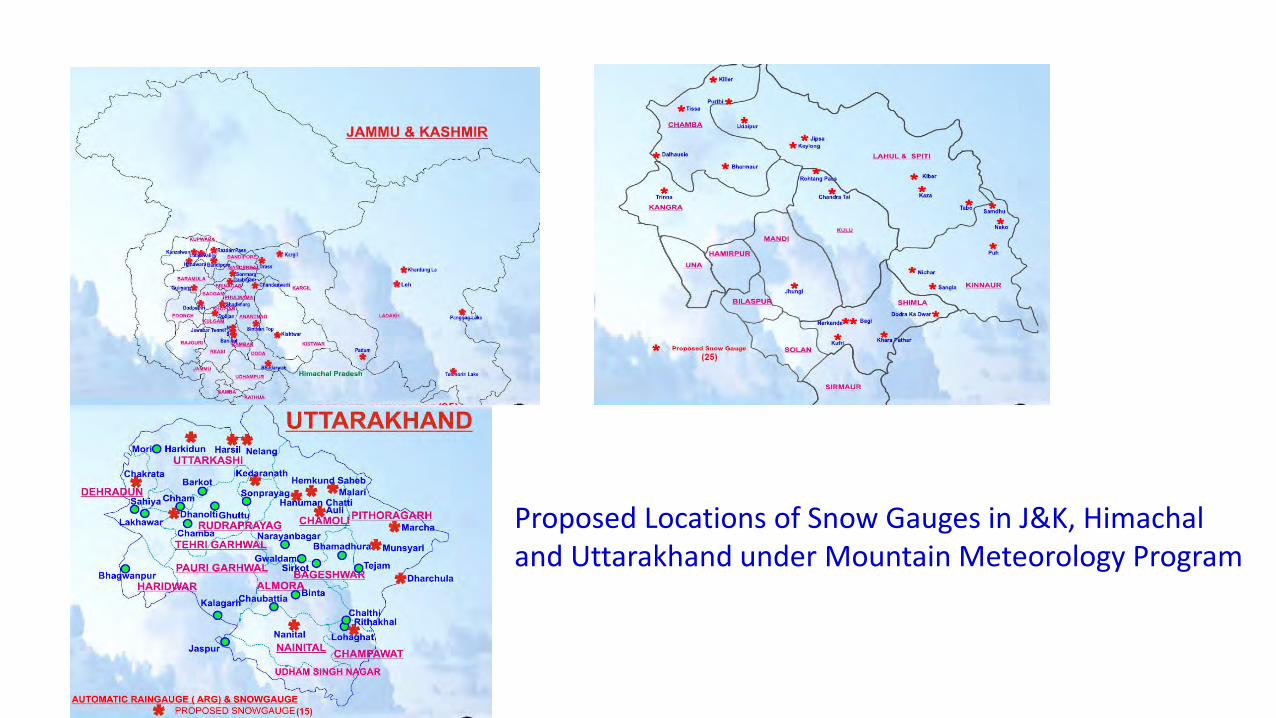
Proposed Locations of Snow Gauges in J&K, Himachal and Uttarakhand under Mountain Meteorology Program
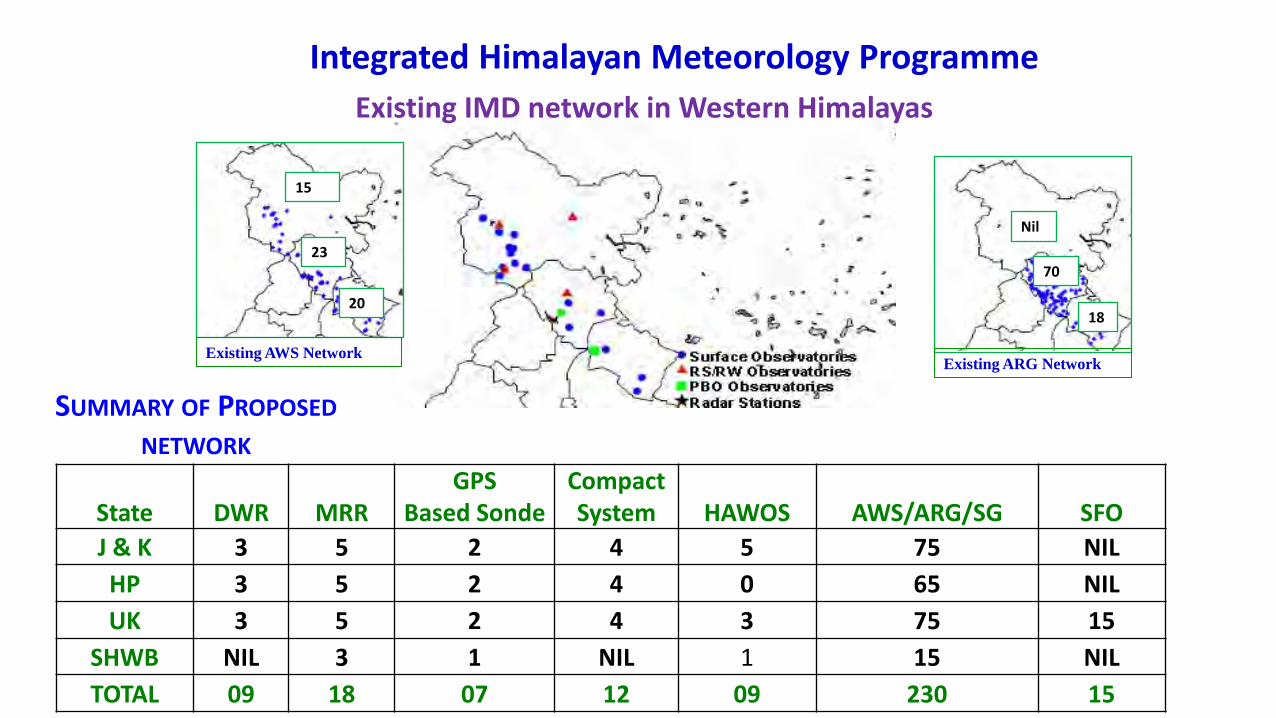
Existing IMD network in Western Himalayas
Existing AWS Network
15
23
20
Existing ARG Network
70
18
Nil
Integrated Himalayan Meteorology Programme
State DWR MRR GPS
Based Sonde Compact System HAWOS AWS/ARG/SG SFO
J & K 3 5 2 4 5 75 NIL HP 3 5 2 4 0 65 NIL UK 3 5 2 4 3 75 15
SHWB NIL 3 1 NIL 1 15 NIL TOTAL 09 18 07 12 09 230 15
SUMMARY OF PROPOSED NETWORK
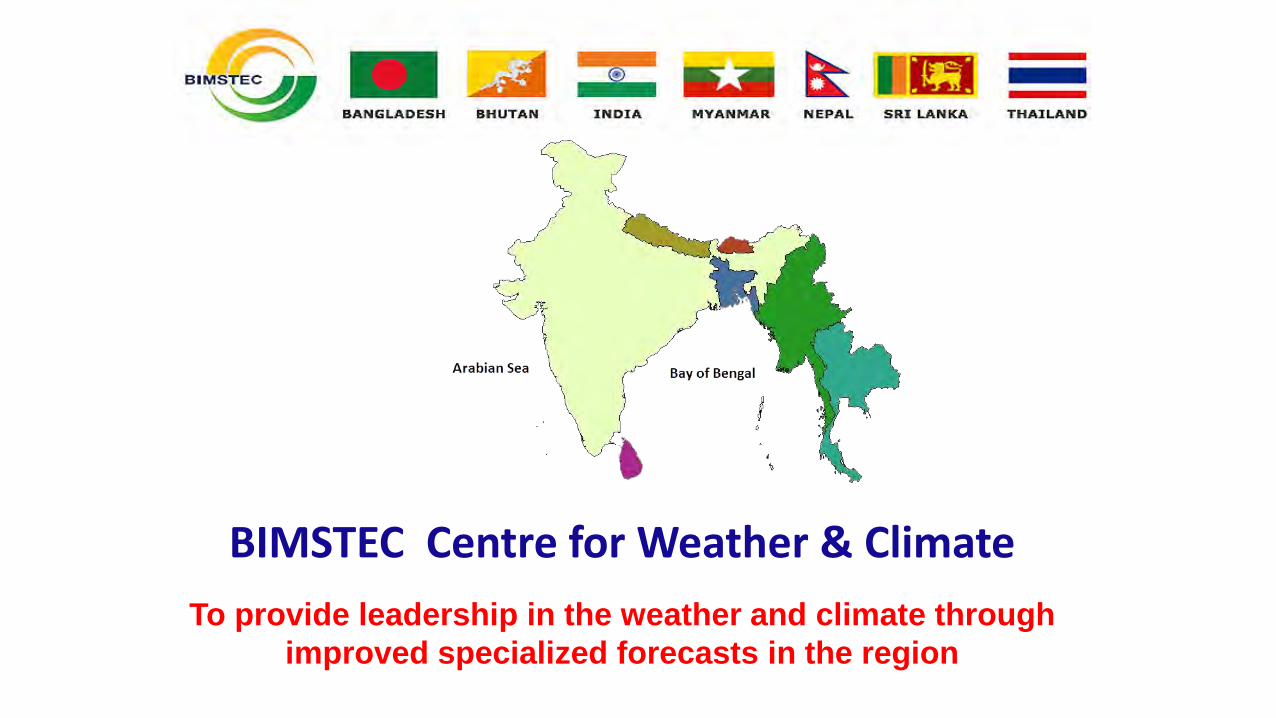
BIMSTEC Centre for Weather & Climate To provide leadership in the weather and climate through
improved specialized forecasts in the region
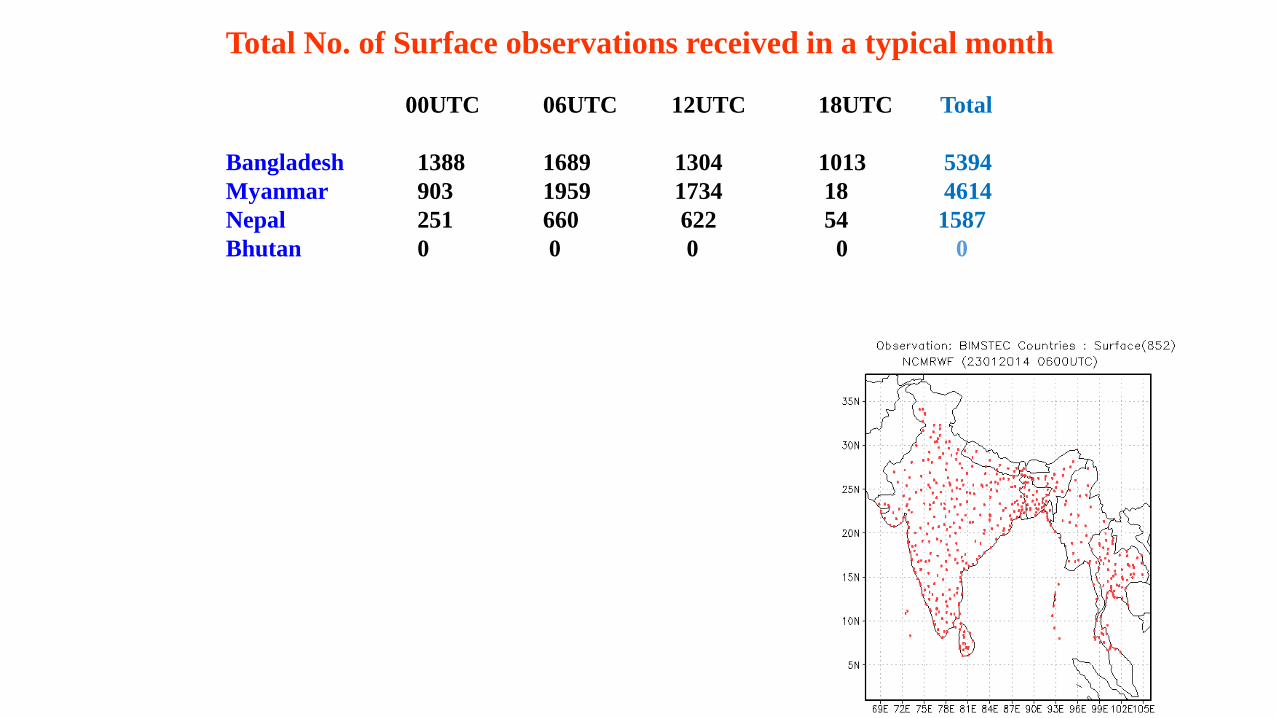
Total No. of Surface observations received in a typical month 00UTC 06UTC 12UTC 18UTC Total Bangladesh 1388 1689 1304 1013 5394 Myanmar 903 1959 1734 18 4614 Nepal 251 660 622 54 1587 Bhutan 0 0 0 0 0
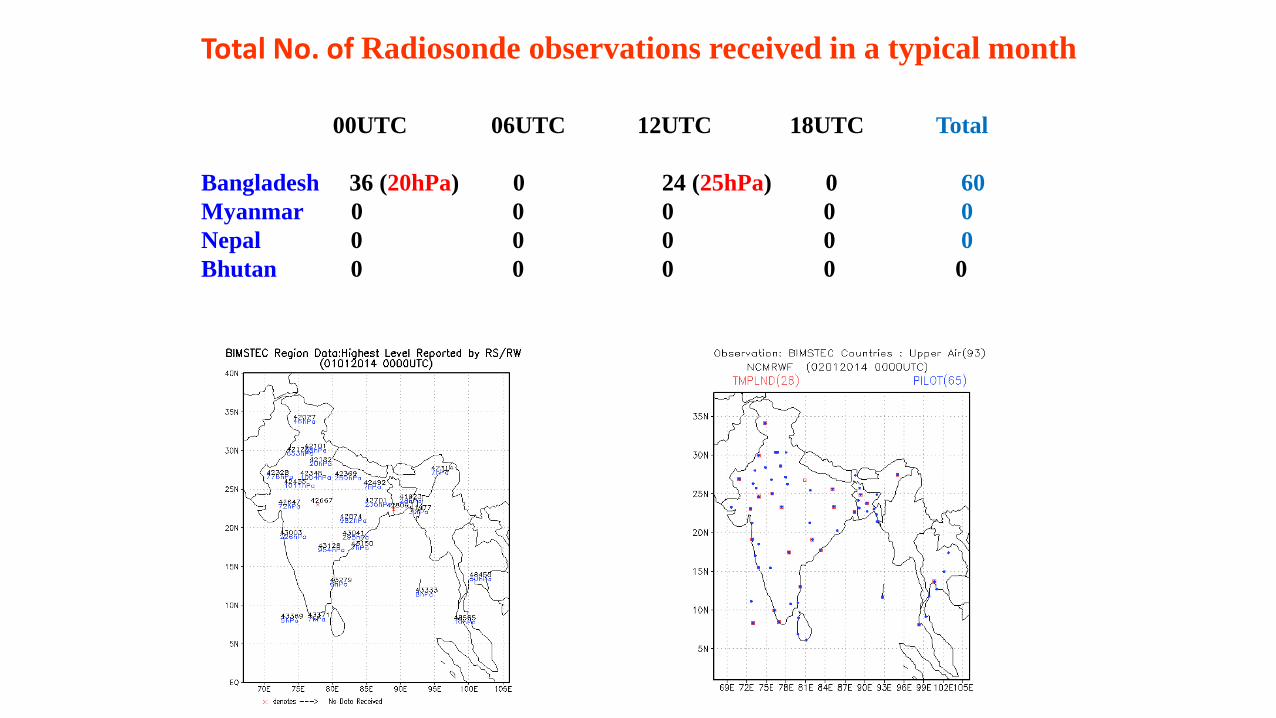
Total No. of Radiosonde observations received in a typical month
00UTC 06UTC 12UTC 18UTC Total Bangladesh 36 (20hPa) 0 24 (25hPa) 0 60 Myanmar 0 0 0 0 0 Nepal 0 0 0 0 0 Bhutan 0 0 0 0 0
Recovery of Climate Data of the Past Large-scale data recovery, digitization, and homogenization of climate records Use modern techniques, procedures, and tools to safeguard climate records risking damage or loss and to recover and digitize them. Enhance the capacity of NMHSs and other climate data communities to accelerate the recovery, digitization, and homogenization of climate records, and to use modern data archiving and management tools
Need of High-Resolution Reanalysis of Climate System of the Himalayas Partners could be all the stake holders including NMHSs, and of the application sectors: Agriculture, Water, health and Disaster etc BIMSTEC Centre for Weather and Climate would be happy to be associated with all the stake holders for improving Climate Services over the Himalayan region

Thank You for Your Attention