The Geographical Distribution of UK Talent
22
The Geographical Distribution of UK Talent: Causes and consequences Marc Cowling 1 Institute for Employment Studies JEL Codes: J24; J61; O18; R23 Abstract In this paper I consider, in a UK context, how talent is distributed across the larger cities of the UK and the key factors which appear to be driving this spatial distribution. I also consider what the potential economic outcomes of these disparities are for cities in the UK. The first finding is that talent is unequally distributed across cities, with some having three times more highly educated workers than others. Talent concentration at the city level is associated with entrepreneurial activity, culture, the presence of a university, and to a lesser degree the housing market. This appears to feed into more knowledge based industry, which is, in turn, associated with higher gross value added. 1 Address for correspondence: [email protected]. Institute for Employment Studies, Sovereign House, Church Street, Brighton BN1 1UJ. England. IES © October 2009 ISBN: 9 781 85184 424 1 IES Working Paper: WP24
Transcript of The Geographical Distribution of UK Talent

The Geographical Distribution of UK Talent:
Causes and consequences
Marc Cowling1
Institute for Employment Studies
JEL Codes: J24; J61; O18; R23
Abstract In this paper I consider, in a UK context, how talent is distributed across the larger cities of the UK and the key factors which appear to be driving this spatial distribution. I also consider what the potential economic outcomes of these disparities are for cities in the UK. The first finding is that talent is unequally distributed across cities, with some having three times more highly educated workers than others. Talent concentration at the city level is associated with entrepreneurial activity, culture, the presence of a university, and to a lesser degree the housing market. This appears to feed into more knowledge based industry, which is, in turn, associated with higher gross value added.
1 Address for correspondence: [email protected]. Institute for Employment Studies, Sovereign House, Church Street, Brighton BN1 1UJ. England.
IES © October 2009 ISBN: 9 781 85184 424 1 IES Working Paper: WP24

2 The Geographical Distribution of UK Talent
1 Introduction
The creation and distribution of human capital, often termed talent, has been recognised in economic geography as an important factor in the locational decisions of firms (Florida, 2002), and at a more general level as a key driver of economic growth (Romer, 1990). An interesting debate has also been considering the question of what spatial level we should consider when examining these theories of talent distribution and economic growth. The early work of Jacobs (1961) argued that cities play an important role in attracting and integrating talented people, whilst Ullman (1958) considered similar issues in the context of regional economic development, and Lucas (1988) makes a broader argument that clustering of talented people drives productivity growth, which in turn raises incomes at the city and regional level. Berry and Glaeser (2005) contend that it is entrepreneurs choosing knowledge intensive modes of business that drive clustering of skilled people in cities, whilst Faggian and McCann (2006), and Florida (1999) argue that universities act as a conduit to bring talent into cities. Interestingly, Greene et al. (2006) argue that the shift in focus away from cities (to city regions and regions) in the UK as the analytical point of focus has been largely driven by political expediency rather than theoretical or empirical considerations. It is certainly true, however, that much of the early US contribution to this empirical literature focuses on regions and regional economic systems (Glaeser, 2000; Simon, 1998), although more generalisable findings are that human capital is fundamental to economic growth (Lange and Topel, 2004) and that growth and innovation are highly correlated with openness and creativity.
But there now exists a significant body of work at the city level too (Glaeser et al., 2001; Lloyd, 2001, Florida, 2002) examining similar issues, and often generating similar results. What tends to differentiate the city level work from the regional level work is the inclusion of new types of variables in analysis covering interesting issues and characteristics (such as culture, public amenities, arts, and other more lifestyle orientated and social considerations) that differentiate one city from another even within a region. This is a significant departure from the more traditional thinking that assumed that people act (more or less solely) on the basis of economic factors such as jobs and potential future income streams in making their locational decisions.
This paper takes this latter body of work, in particular the work of Florida (2002), as its theoretical and empirical point of departure to investigate the economic geography of talent in the one hundred largest cities (measured by population) in the UK. As far as empirically possible, it replicates the Florida op. cit. US paper by focusing on identifying city level factors in the UK that attract talent (human capital). The general starting hypothesis is that talent is attracted by human and

Institute for Employment Studies 3
economic diversity and that subsequent geographic concentrations of talent impact on innovation and wealth (or incomes) at the city level.
The rest of the paper is organised as follows. In Section 2 the relevant theoretical and empirical literature is reviewed to provide insight and context. Section 3 outlines the nature of the data used in the empirical analysis and the econometric methods employed. In Section 4 the key data are described to highlight general relationships between key variables and the city distributions, along with the econometric estimates of talent distribution across the one hundred largest cities of the UK. Conclusions and implications are drawn in Section 5.
2 Literature review
Over the last few decades, the socio‐economic experiences of cities and regions have varied substantially. Whilst some of this dispersion can be explained by purely geographic factors, the really interesting questions relate to economic growth and quality of life and how these impact on peoples’ locational decisions. Yet these questions have not been fully answered, despite a widening body of research of mainly US origin.1
Glaeser et al. (1995), for example, in their examination of the growth experiences of 203 large US cities, explicitly focus on human capital as a determinant of city growth. Further, they strongly argue that there is a need to focus research attention on cities as they operate as open economies with ‘tremendous movement of capital, labour, and ideas’ (p.118). And cities are more specialised and less arbitrary units of socio‐economic activity than regions (or countries). This focus on knowledge and the transfer of ideas accords with established theory such as Romer (1986) on disembodied knowledge, Lucas (1988) on human capital and Porter (1990) on high‐tech clustering.
So what does previous research tell us about city and regional growth? Glaeser et al. (1992) found evidence that cross‐industry intellectual externalities were particularly important for urban growth. The later, Glaeser et al. (1995), work found that population migration responds to growth opportunities and importantly, that movements in wages and population are primarily determined by productivity not quality of life changes. Yet this is disputed by Shapiro (2006), also using US evidence, who finds that only 60 per cent of employment change at the city level can be explained by productivity. This leaves the remaining 40 per cent to be explained by quality of life measures. Another important contribution by Gabriel and Rosenthal (2004) found substantial differences between what businesses
1 UK research has been constrained until quite recently by lack of data below the regional level

4 The Geographical Distribution of UK Talent
regard as high quality cities and what people regard as high quality (of life) cities. Further, they also found that employment growth depended upon quality of business environment not quality of life. This is further confused by the UK empirical evidence from Fingleton (2003) who found that the key determinant of efficiency variations across areas relates to differences in workers ability to make use of available technology.
Thus, on the basis of the empirical evidence presented, we might conclude that human capital is important as a determinant of city (and regional) growth, but the mechanisms by which this occurs are less clear. We are unsure about what role, if any, quality of life plays, and how we can link in human capital, innovative capacity, innovation and subsequent economic growth. If we took the most common approach adopted by economists we would end up with a model which allows for cities to differ only in their productivity and quality of life. Thus a city output model could take the form:
Ai,t ƒ (Li,t) = Ai,tLσi,t (1)
where, Ai,t, productivity in city i at time t, Li,t is the population, and ƒ (.) is a Cobb‐Douglas production function with a common parameter σ. From this the wage of the potential migrant would equal the marginal product of labour, and total utility could be defined as wages multiplied by a quality of life index of the form:
Quality of Life = Qi,t L‐δ i,t (2)
where δ>0, and quality of life captures a wide range of factors eg crime, environment, housing etc.
From this total utility of a potential migrant to city i is :
Utility = σ Ai,tQ i,t Li,tσ‐δ‐1 (3)
This type of framework would be suitable for estimating city growth models, but raises a few issues about heterogeneity of labour which of course is a fundamental aspect of human capital theory in this context. It is also the case that this kind of structure does not really enlighten us about how human capital feeds through the socio‐economic system, and in particular how it impacts on innovative capacity.
In this context, one particularly interesting sub‐group of the population, in both an economic and quality of life context, is (primarily young) people who enter a process by which they attend a Higher Education Institution, subsequently graduate, and either enter the labour market or drop out of it. Pietro (2006), in his analysis of university drop‐out rates in Italy, shows that the state of the local labour market significantly affects the stay or drop‐out decision which has implications for the quality of human capital available. The locational decisions of these individuals, and flows that derive from these decisions are hugely interesting, and

Institute for Employment Studies 5
of great importance, as they possibly represent the greatest flow of human capital around a region or country at a given point in time. And further, they have fewer geographical mobility barriers thus are more closely aligned to the open economy model of the city or region. It is also the case that an individual’s decision over choosing an HEI might be quite different than their labour market decision post‐graduation (Cowling and Pollard, 2008). Specifically, we might a priori expect that quality of life issues might be more important in the HEI decision than the labour market decision. Yet there may be an element of hysteresis with graduates becoming reluctant to move from their HEI location if they enjoy the quality of life.
The multivariate models can estimate the dynamic inter‐relationships between human capital (talent), innovative capacity, and economic value added. These can be estimated, using talent as an example, in the form:
Human Capital Measurei = α0i + α1i Innovative Capacity + α2i Quality of Life + α3i Labour Market Indicators + α4i Economic Indicators + α5i HEI Indicators + β6i Population Demographics + β7i Population + υi
Thus for our new graduate talent human capital measures we could hypothesise that the ability of a locality to retain its incoming as students and graduates is related to the innovative capacity of that locality, as well as quality of life, labour market conditions, general economic conditions. The second part of the system which captures local innovative capacity should in itself be a function of the stock of human capital as well as other population size and demographic variables.
To conclude, we hope to shed more light on the factors that determine the locational decisions of talent, and the extent to which this is associated with into local innovation systems and innovative capacity and economic value added. The potential new insights of this research are that it explores the impact of quality of life and economics on the locational decisions of talented people in the UK. That it focuses on the city as a unit of analysis, and that we expand the range of talent measures to consider new graduates.
3 Data and methods
The core variables for analysis can be classified into eight categories, namely: (1) diversity, (2) technology & innovation, (3) talent, (4) entrepreneurship, (5) housing, (6) culture, (7) population, and (8) value add. Table 1 describes the measures adopted in relation to each of the eight categories. The data refer to the 100 largest cities, by population, in the UK excluding the capital city London. London is excluded as it is 50 times larger than the average UK city and is a truly international city.

6 The Geographical Distribution of UK Talent
Talent
The basic talent measure is simply the proportion of the adult population with an undergraduate degree and above. This data are derived from the 2001 population census. Four additional measures of talent are also used which relate to recently graduated university students. These four measures are derived from the Higher Education Statistical Agency (HESA) Destinations of Leavers Survey which tracks graduates as they begin their working lives post‐university. The student and graduate information comes from UCAS applications database and HESA destinations of leavers from higher education survey. The UCAS data has the potential to allow postcode tracking of applicants to HEIs in the UK. The HESA data gives us postcode information on domicile, HEI and employer location as well as other alternative labour market states between 4 and 9 months after graduation. The 2004/05 HESA data has information on 258,420 full‐time graduates and a further 60,840 part‐time graduates giving a total of 319,260 complete records. The 2003/04 data gave a total of 313,040 records. This would then be integrated with other local labour market, economic, innovation and quality of life data at two spatial levels. The largest unit would be the 36 NUTS 2 areas of Great Britain, and the smallest the Local Authority (city) level. It is this latter spatial dimension that this research considers.
The measures are all defined as the proportion of graduates out of the total relevant population. The first, new female talent, relates to female graduates who left their home to move to a new university city and then subsequently remained in that city after graduation. As such it represents a talent flow into the host university city. The second, new male talent, is the equivalent for male graduates. The third measure, new talent in talented jobs, represents new graduate talent into a host university city who were working in graduate level employment within six months of graduation. The fourth measure, new talent in talented jobs, relates to the proportion of new graduate talent with 1st Class or Upper 2nd Class degrees who moved to their university city and remained in that host city after graduating.
Culture
Several measures of cultural amenities are combined into a culture domain constructed by the UK government as a component of its Index of Multiple Deprivation. The items included in this domain are sports & leisure facilities, theatre & concert halls, and parks and open spaces.
Entrepreneurship
One measure of openness and vibrancy is the inflow of new, entrepreneurial, businesses as entrepreneurs start up new firms to take advantage of perceived

Institute for Employment Studies 7
new market opportunities and gaps in the provision of goods and services. In this respect the measure is the proportion of new firms normalised as a percentage of the existing stock of firms. This variable is captured for two time periods, 1997 and 2003, and is derived from UK government VAT statistics.
Diversity
The measure of diversity refers to the ethnic diversity of the population. It is derived from the 2001 population census and reflects the proportion of the total population who do not classify themselves as White British. In this sense it is a locational quotient.
Housing
Here the measure is representative of the average Council Tax bill for individuals. This is a local tax falling on the individual household. This is an alternative to house prices which are subject to substantial inter‐temporal variability. It can be argued that Council Tax captures quality and size of housing, as well as local provision of public goods and services which makes it more suited to this research. This is derived from government statistics for the UK.
Gross value added
This measure is gross value added per worker and is derived from the population census for 2001 and government input‐output tables. As such, it is total gross value added created by the working population of each city divided by the working population. Alternative measure such as income per capita were also available.
Table 1: Descriptive statistics
Variable Obs Mean Std Dev Min Max
Housing (Council Tax, £s) 88 904.11 100.99 576.24 1171.54
Diversity (Fractional Ethnic) 83 0.16 0.13 0.03 0.70
Technology (Knowledge Business 1997) 93 0.17 0.05 0.10 0.38
Technology (Knowledge Business 2003) 93 0.20 0.06 0.12 0.43
Talent (Degree) 93 0.28 0.08 0.15 0.53
Talent (College) 93 0.16 0.03 0.10 0.23
University (1,0) 95 0.58 0.50 0 1
Entrepreneurship 1997 95 0.03 0.01 0.01 0.06
Entrepreneurship 2003 95 0.03 0.01 0.01 0.06
Culture Index 82 0.00 1.00 –1.94 2.59
Income per Capita 2003 (£s) 80 10,363 2,124 7,700 19,269
Gross Value Added per worker 2002 (£s) 93 0.029 0.004 0.022 0.041
8 The Geographical Distribution of UK Talent
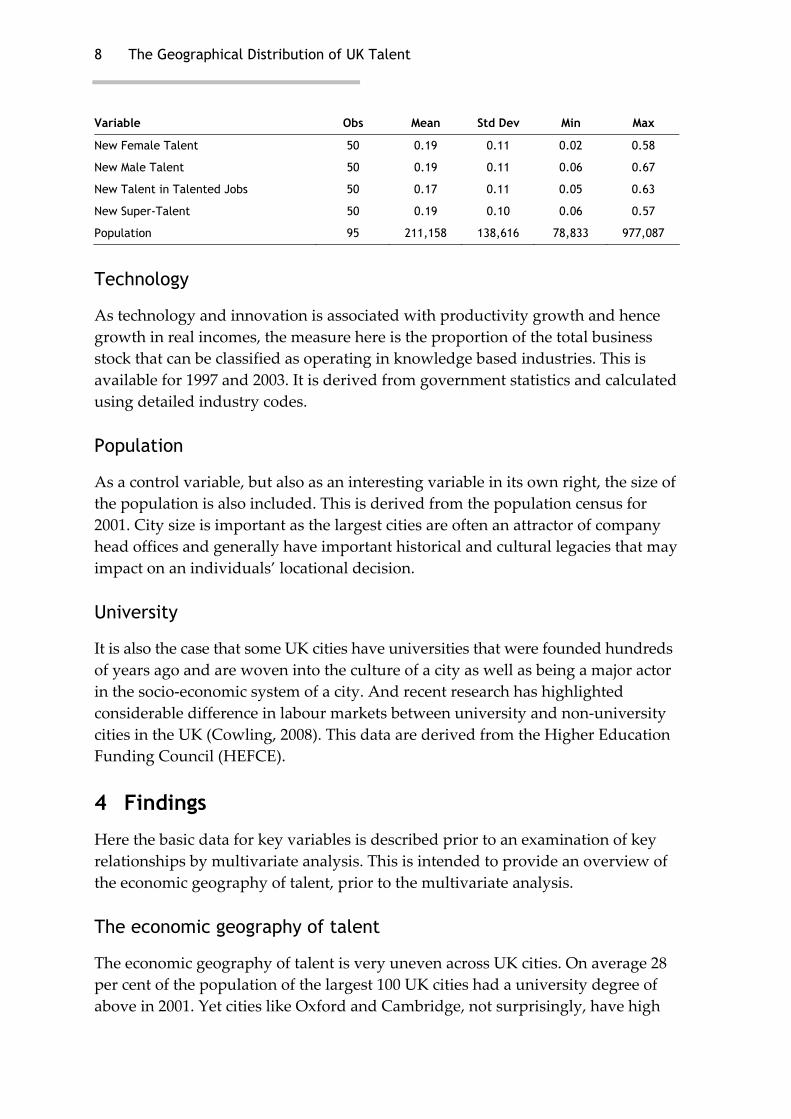
Variable Obs Mean Std Dev Min Max
New Female Talent 50 0.19 0.11 0.02 0.58
New Male Talent 50 0.19 0.11 0.06 0.67
New Talent in Talented Jobs 50 0.17 0.11 0.05 0.63
New Super-Talent 50 0.19 0.10 0.06 0.57
Population 95 211,158 138,616 78,833 977,087
Technology
As technology and innovation is associated with productivity growth and hence growth in real incomes, the measure here is the proportion of the total business stock that can be classified as operating in knowledge based industries. This is available for 1997 and 2003. It is derived from government statistics and calculated using detailed industry codes.
Population
As a control variable, but also as an interesting variable in its own right, the size of the population is also included. This is derived from the population census for 2001. City size is important as the largest cities are often an attractor of company head offices and generally have important historical and cultural legacies that may impact on an individuals’ locational decision.
University
It is also the case that some UK cities have universities that were founded hundreds of years ago and are woven into the culture of a city as well as being a major actor in the socio‐economic system of a city. And recent research has highlighted considerable difference in labour markets between university and non‐university cities in the UK (Cowling, 2008). This data are derived from the Higher Education Funding Council (HEFCE).
4 Findings
Here the basic data for key variables is described prior to an examination of key relationships by multivariate analysis. This is intended to provide an overview of the economic geography of talent, prior to the multivariate analysis.
The economic geography of talent
The economic geography of talent is very uneven across UK cities. On average 28 per cent of the population of the largest 100 UK cities had a university degree of above in 2001. Yet cities like Oxford and Cambridge, not surprisingly, have high

Institute for Employment Studies 9
graduate shares amongst the local population, accounting for 53.3 per cent and 46.8 per cent of the population. Both are higher than the top‐ranked region of Washington DC at 42 per cent reported in Florida (2002). Other UK cities with high graduate shares are Brighton, Bradford, Winchester, and Harrogate, all cities with over 40 per cent graduate shares. However, this contrasts with Ipswich, which has the lowest graduate shares at 14.9 per cent, and Blackpool, Stoke‐on‐Trent, Dover and Colchester, cities that all have graduate shares considerably below 20 per cent. The interesting feature is that these cities are geographically diverse being located widely across UK regions.
Using a broad measure capturing average new graduate talent to university cities across our four new graduate talent variables, the findings are equally uneven. The highest ranked UK city for retaining new graduate talent from outside is Belfast at 61.2 per cent. Glasgow, at 42.3 per cent, Aberdeen, at 40.3 per cent, and Edinburgh, at 36.7 per cent, also rank highly. The notable feature is that these are all historically important, large cities, in Northern Ireland and Scotland. Cities with the lowest new graduate talent retention are Colchester, at 5.4 per cent, Wallsall, at 6.7 per cent, Lancaster, at 7.9 per cent, Chelmsford, at 8.3 per cent, and Canterbury, at 8.4 per cent.
Table 2 (see Appendix) presents correlation analysis results. From Table 2 it can be observed that technology is correlated with talent, entrepreneurship and incomes all in a positive, and significant, way. And these relationships appear fairly stable over time. Talent, per se, is correlated with the presence of a university in a city, higher entrepreneurial activity, higher culture index scores, and higher incomes. Entrepreneurship, per se, is correlated with higher culture index scores and higher incomes. It is also noted that larger sized cities are also correlated with more graduate talent of all types, and also with more talent in general. Further, new graduate talent is correlated with better housing and public goods and services. So these correlations provide some support for the a priori hypotheses drawn from Florida (2002) positing linkages between talent, technology and incomes. An interesting aspect is the additional link, or mechanism by which this might occur, which allows a role for the entrepreneur. And the possible inherent advantages that large cities have in attracting inflows of new talent to add to their existing higher stocks of talent is also noteworthy.
Culture
The results of the correlation analysis indicate that talented people appear to be attracted by cultural amenities. The correlation coefficient for the basic talent index and culture index is positive and significant (0.281, Table 2). Figure 1 graphically depicts this relationship and places the 100 cities in talent and cultural space. This is consistent with recent research by Cowling and Pollard (2008) using the 2007

10 The Geographical Distribution of UK Talent
graduating cohort at the University of Sussex survey as a case study for analysis. Their research identified good public transport, availability of affordable housing, good restaurants etc., and good standard of public healthcare as key factors in graduating students’ locational decisions.
Figure 1: Culture and talent across UK cities
by
bs
bhbm
bl
bo
br
bk
bfbn
bi
bu
cm
cb
cr
cfchco
cv
dadbdodv
du
ex
ga
gl
ha
hr
hu
ip
la
ld
lelilvlu
ma
mc
mimk
ne
nt
nw
no
ol
ox
pepl
popm
pr
re
ro
rh
sd
sb
sf
sl
so
spse
sa
sh
sr
sv
sk
sot
st
su si
wl
wr
ww
wfwg
wn
wi
wv
wc
yo
-2-1
01
23
10 20 30 40 50% economically active with NVQ4+
Culture Index Fitted values
New graduate talent
The results of the correlation analysis indicate that talented people and the ability to retain new graduates from outside are correlated. The fact that the talent measure predates the new graduate talent measure might suggest that newly graduating talented people are attracted by higher levels of (existing) talent. The correlation coefficient for the basic talent index and new graduate talent index is positive and significant (0.395, Table 2). Figure 2 graphically depicts this relationship and places the 100 cities in talent and entrepreneurship space.

Institute for Employment Studies 11
Figure 2: Average new graduate talent and talent across UK cities
ab
bh
bm
bo
br
bfbn
bi
cmcb
ca
cr
cf
ch
co
cv
dbdd
ed
ex
gg
glhu
la
ld
leli
lv
lu
mc
mk
ne
npnt
nw
no oxpl
pmpr re
sf
sp
sasot susw
wl
wc
0.2
.4.6
10 20 30 40 50% economically active with NVQ4+
avgradtalent Fitted values
Entrepreneurship
The results of the correlation analysis indicate that talented people and entrepreneurship are correlated. The fact that the entrepreneurship measure predates the talent measure might suggest that talented people are attracted by higher levels of entrepreneurial activity. The correlation coefficient for the basic talent index and entrepreneurship index is positive and significant (0.473, Table 2). Figure 3 graphically depicts this relationship and places the 100 cities in talent and entrepreneurship space.
Figure 3: Entrepreneurship and talent across UK cities
ab
by
bs bh
bm
bl
bo
brbk
bf
bn
bi
bucm
cb cacr
cf
chco
cvda dbdo
dv du
dd
edex
ga
gggl
ha
hr
hu
ip
la
ldle
lilv
lu
ma
mc
mi
mk
nenp
ntnw
nool ox
pe
pl
po
pm
prre
rorh
sd
sb
sf
sl
so
sp
se
sa
sh
srsv
sg
sk
sot
st
su
sw
siwkwl
wr
wwwf
wg
wn
wd
wi
wv
wcwo
wx
yo
12
34
56
10 20 30 40 50% economically active with NVQ4+
Business start ups 2003, UK Competitiveness Index Fitted values

12 The Geographical Distribution of UK Talent
Diversity
The results of the correlation analysis indicate that talented people and diversity are not associated with one another. The correlation coefficient for the basic talent index and diversity index is positive but not significant (0.009, Table 2). Figure 4 graphically depicts this relationship and places the 100 cities in talent and diversity space.
Figure 4: Talent and diversity across UK cities
bybs
bh
bm
bl
bobrbk
bf
bnbibu
cmcb
cr
cf
ch
cocv
da
db
do
dv
du
ex
ga
gl ha
hr
huip
la
ld
le
lilv
lu
ma
mc
mi
mk
nent
nwno
ol
oxpe
pl po
pm
pr
re
ro
rh
sd
sb
sfsl
so
spse
sash
sr
sgsk
sot
st
sw
si
wk
wl
wr
ww
wfwg
wnwd
wiwv
wcwx
0.2
.4.6
.8
10 20 30 40 50% economically active with NVQ4+
Ethnic Fractionalisation Index, Census 2001 Fitted values
Housing
The results of the correlation analysis indicate that talented people and housing are not associated with one another. The correlation coefficient for the basic talent index and housing measure is positive but not significant (0.051, Table 2). This might bring into question the contention that talented people are willing to pay more for better public provision of goods and services at the local level. However, for new graduate talent the correlation is positive and significant (0.319, Table 2). This might suggest that housing and public provision of goods and services have become more important for attracting talent.
5 Multivariate findings
Multivariate analysis was used to explore these issues in more detail in an attempt to isolate more robust relationships between talent and its economic geography. As there are three core dependent variables of interest, namely; talent, technology and income, two of which are expressed as percentages, and bounded between 0 and 1, the most appropriate modelling strategies differ. In the case of talent and

Institute for Employment Studies 13
technology, both of which are bounded, the most suitable method is the fractional logit. Given the bounded nature of the two dependent variables of interest, the share of the population with a graduate degree, and the share of the business stock accounted for knowledge based industries, the most appropriate form of estimation model is a fractional logit. The modelling of these sorts of allocation to various categories have generally taken the form of structural equations models, doubly censored tobit models, or more simplistic regression‐based models. However, there are limitations associated with these approaches. While the structural equations and regression approaches cannot guarantee allocation predictions that are plausible and sum to the total available, the doubly censored tobit models are computationally more burdensome when attempting to model skills allocation among competing activity categories (here degree level talent and other educational qualifications).
A methodology that can overcome these limitations is the fractional logit model. The fractional logit model offers a powerful framework for predicting allocations among various activity types (Ye and Pendyala, 2004) because each allocation constitutes a “fraction” of the total available (here educational qualifications). Thus the fractional logit model ensures consistency in prediction and provides behavioural sensitivity through the incorporation of explanatory variables that influence allocation patterns (here city demographics, personal demographics, industry mix and culture effects).As gross value added per capita is expressed in absolute, cash, terms this easily lends itself to Ordinary Least Squares analysis, although even in this case robust regression models are estimated.
Talent
Table 3 shows the core talent models. It can be observed that entrepreneurship is significantly associated with talent across models with a coefficient around 0.18 (at the 0.0001 level of significance). This suggests that entrepreneurial activity can act as an attractor of talent at the city level. It was also found to be the case that culture was significantly associated with talent across model specifications with a coefficient around 0.09 (at the 0.03 level of significance). This differs from the null result reported by Florida (2002) for the effect of culture on talent in US cities. In addition, the presence of a university in a city was found to have the strongest association with talent with a coefficient around 0.20 (at the 0.01 level of significance). In these models, no significant relationships were identified between population size, housing, or diversity, and talent.

14 The Geographical Distribution of UK Talent
Table 3: Regression model findings for talent
Dependent Variable: Talent (BA and above)
Model 1 Model 2
Variables Coefficient P>z Coefficient P>z
Diversity 0.139 0.408 0.147 0.398
Entrepreneurship 0.180 0.000 0.179 0.000
Housing 0.505 0.114 0.505 0.159
Culture 0.086 0.025 0.086 0.021
University 0.202 0.008 0.204 0.008
Population –0.002 0.983
population squared –0.000 0.864
Observations 77 77
log likelihood –30.41 –30.41
New graduate talent
Table 4 shows the new graduate talent models using the four alternative measures. Model 1 shows that new female graduate talent is associated very strongly with existing talent. This is also supported for new male graduate talent in Model 2 with a similar size of coefficient (2.62 for females compared to 2.68 for males) and level of significance (0.003 compared to 0.007), and in Model 3 for new graduate talent with a graduate job (coefficient 2.46, significance 0.005), and in Model 4 for new super talent (coefficient 2.21, significance 0.008). These findings suggest that there is a positive, and mutually reinforcing, dynamic at the city level with high, historical, stocks of graduate talent in the population acting as an attractor to new, incoming, graduates, who then add to the existing stocks etc. It also implies that cities who begin with low graduate stocks will find it very difficult to change their relative position and add to their smaller stocks of talent.
The results also show that entrepreneurial activity is also associated with attracting new male graduate talent and new super graduate talent (coefficients of 0.33 and 0.37 respectively, significance 0.04 and 0.03 respectively). This was not the case for new female graduate talent or for new graduate talent in graduate jobs. In contrast, the housing variable was found to act in a positive, and significant, way on new graduate talent across all four models with coefficient ranging from 1.59 for new super graduate talent to 1.77 for new male graduate talent. Across all four models significance levels were below 1 per cent. The new graduate talent models all show a significant association with population size of city. In short, new graduate inflows of talent to a university city are attracted to larger cities. This is particularly so for graduates working in graduate level jobs (coefficient=0.48, significance 0.01), and for male graduates more than female graduates (coefficients of 0.41 compared to 0.35 respectively). In three of the four new graduate talent models culture is positively associated with new graduate talent. The association was highest for

Institute for Employment Studies 15
graduate super talent (0.14, significance 0.02), and also higher for males than females (coefficient 0.17 compared to 0.12 respectively).
Table 4: Regression model findings for new talent
Dependent Variables
New Female Talent New Male Talent New Talent in Talented Jobs New Super Talent
Variables Coef P>z Coef P>z Coef P>z Coef P>z
Existing Talent 2.618 0.003 2.681 0.007 2.459 0.005 2.205 0.008
Diversity –0.102 0.829 0.205 0.670 0.195 0.685 0.135 0.761
Entrepreneurship 0.356 0.105 0.326 0.043 0.307 0.106 0.367 0.034
Housing 1.676 0.011 1.769 0.003 1.514 0.004 1.590 0.002
Culture 0.0120 0.096 0.174 0.006 0.082 0.206 0.149 0.017
Technology –5.340 0.187 –7.451 0.005 –5.016 0.139 –5.068 0.096
Population 0.353 0.077 0.410 0.010 0.484 0.014 0.342 0.034
population squared 0.004 0.405 0.002 0.553 0.003 0.541 0.002 0.716
Observations 41 41 41 41
log likelihood –12.52 –12.69 –11.53 –12.48
These new graduate talent findings, compared to the general stock of talent findings, are more consistent with the underpinnings of the model outlined by Florida (2002) in that new inflows of graduate talent are attracted by a wider variety of economic and social (quality of life) considerations. Whilst there is commonality and consistency in the findings in respect of the positive influences of entrepreneurial activity and culture on talent, the attraction of new inflows of graduate talent are also associated with quality of housing and public provision of goods and services and a preference for larger cities. These differences are important as they will affect the relative position of cities in respect of talent accumulation in the future. As noted previously, new graduate talent also appears to gravitate towards cities that already have relatively high talent stocks, which makes it even more difficult for cities playing catch‐up.
Talent and knowledge-based industry
The focus of the analysis now develops to explore relationships between talent and knowledge‐based industry activity. From Table 2 it is evident that talent is highly correlated with knowledge industry (coefficient 0.420). Knowledge industry is also correlated with entrepreneurship (coefficient 0.797), and culture (coefficient 0.271), but not with housing or diversity. Figure 5 graphically depicts the relationships between diversity and knowledge‐based industry, and shows a slight, but statistically insignificant, positive relationship. Figure 6 shows the strong and positive relationship between talent and knowledge‐based industry.

16 The Geographical Distribution of UK Talent
Figure 5: Technology and diversity across UK cities
by
bs
bh
bm
bl
bo
br
bk
bf
bn
bi
bu
cm
cb
cr
cfch
cocv
dadb
do dv du
ex
ga
gl
ha
hrhu
ip lald
leli
lv luma
mc
mi
mk
ne ntnw no
ol
oxpe
pl
popm
pr
re
rorh
sdsb sf
sl
so
sp se
sa
sh
srsg
sk
sot
st
sw
si
wkwl
wrwwwf
wg
wn
wd
wiwv
wc
wx
.1.2
.3.4
.5
0 .2 .4 .6 .8Ethnic Fractionalisation Index, Census 2001
Knowledge Business 03 Fitted values
Figure 6: Technology and talent across UK cities
ab
by
bs
bh
bm
bl
bo
br
bk
bf
bn
bi
bu
cm
cb
ca
cr
cfch
co cv
dadb
dodv du
dd
ed
ex
ga
gggl
ha
hrhu
ip lald
le li
lvluma
mc
mi
mk
ne
np
nt nwno
ol
oxpe
pl
popm
pr
re
rorh
sdsbsf
sl
so
spse
sa
sh
sr
sv
sg
sk
sot
st
su
sw
si
wkwl
wr wwwf
wg
wn
wd
wiwv
wcwo
wx
yo
.1.2
.3.4
.5
10 20 30 40 50% economically active with NVQ4+
Knowledge Business 03 Fitted values
Multivariate (fractional logit glm) models were used to further explore these potential relationships. From Table 5, it is observed that knowledge‐based industry is associated with talent in a positive and significant way (coefficient 0.87, significance 0.006), diversity (coefficient 0.29, significance 0.045), and entrepreneurship (coefficient 0.23, significance 0.0001). No associations were found between knowledge‐based industry and housing, culture or city size. The results are consistent with those reported by Florida (2002), although he uses a tech‐pole index measure based on concentrations of high‐technology output.

Institute for Employment Studies 17
Table 5: Regression model findings for knowledge based industries
Dependent Variable: Knowledge Based Industry
Model 1 Model 2
Variables Coefficient P>z Coefficient P>z
Talent 0.866 0.006 0.903 0.006
Diversity 0.290 0.045 0.283 0.053
Entrepreneurship 0.234 0.000 0.235 0.000
Housing 0.089 0.695 0.081 0.735
Culture 0.029 0.244 0.030 0.230
University –0.021 0.679
Population 0.018 0.778
population squared 0.000 0.900
Observations 77 77
log likelihood –26.03 –26.03
What these findings suggest are that the availability of talent is an important factor in the locational decisions of knowledge‐based industry. But this not only applies to potential talented workers, but more widely to entrepreneurs. This latter aspect is intriguing and might be explained by the desire to create clusters of knowledge‐based activity and the types of social and business networks which, if successful, can promote mutually beneficial generation and exchanges of new ideas and technologies. This, in the UK, was the rationale under‐pinning the creation of Science Parks. It also brings into question the relative importance of local taxes and physical amenities which many public sector regional development agencies consider to be crucial factors in attracting knowledge industries.
Table 6. Regression model findings for gross value added
Dependent Variable: GVA
Model 1 Model 2
Variables Coefficient P>z Coefficient P>z
Talent 0.769 0.024 0.662 0.039
Technology 2.842 0.000 2.826 0.000
Diversity 0.259 0.174 0.321 0.083
Housing 0.188 0.403
Culture –0.017 0.510
Population –0.175 0.020 –0.181 0.015
population squared 0.005 0.121 0.005 0.106
Observations 77 77
Adjusted Rsq 0.478 0.502

18 The Geographical Distribution of UK Talent
Talent and gross value added (GVA)
In micro and macro economics researchers have hypothesised and proven a strong and significant relationship between human capital and income and human capital and productivity at all spatial levels from countries down to small localities. In addition, the role of technology in enhancing productivity and ultimately, income and wealth has also been widely investigated again at all spatial levels. Here similar relationships are explored at the city level in a multivariate framework using robust OLS models.
The models generally show that there is a relationship between knowledge‐based industry activity and gross value added (coefficient 2.83, significance 0.0001), which reconfirms its fundamental importance to productivity. Talent was also positively associated with gross value added (coefficient 0.66) as was diversity (coefficient 0.32). It is also interesting to note that there was a negative relationship between city size and gross value added (coefficient ‐0.18) which might suggest that, on average, larger cities are implicitly less efficient holding talent and other factors constant. There is also some partial evidence that the relationship between city size and GVA is non‐linear. Here the city size coefficient is positive suggesting that at some point in the city size distribution cities begin to become more productive. Or put more simply smaller and larger cities are more productive than medium‐sized cities. This predicted relationship is shown in Figure 7.
Figure 7: City size and predicted gross value added per capita
.105
.11
.115
.12
.125
.13
GV
Apr
edic
ted1
0 200000 400000 600000 800000 1000000Population size
As can be observed, the predicted nadir in terms of gross value added is for cities around the 400,000 – 500,000 population level. Given that the average population size of city was 211,000, and the median city size 177,000, this might suggest that further population growth might be associated with a decline in GVA per capita,

Institute for Employment Studies 19
unless this was a huge population explosion taking a city up to 600,000 people. This is extremely large by UK standards. In fact at the 90th percentile in the city size distribution the average city size is only 315,000 people.
6 Conclusions
This paper set out to consider the economic geography of talent in the 100 largest cities in the UK in an attempt to understand more about what shapes and drives this spread of talent and the economic consequences of having more (or less) talent. Drawing on a framework adopted by Florida (2002) for 50 MSA areas in the US, the a priori predictions were that talent is attracted by culture, diversity, and a new measure, the presence of an entrepreneurial culture as well as other more conventional factors such as the presence of technology and knowledge based industry. This paper, further adds to our understanding of the economic geography of talent by incorporating four new measures which relate to new university graduates.
Our general findings are that talent is unevenly concentrated in certain cities of the UK. Our analysis shows that talent is not particular attracted by diversity, but more generally by culture and cultural amenities, and the presence of an entrepreneurial culture captured by lots of people starting new businesses. However, new graduate talent is associated with a much broader set of city attributes, including a preference for larger cities per se, the presence of a large stock of existing graduate talent and high levels of provision of public services and good housing. Of course, this means that it is likely to be very difficult for cities with low existing levels of talent to ‘catch‐up’ with more ‘talented’ cities as a disproportionate share of new talent will be attracted to those cities already best placed in this respect.
Knowledge based industry, however, is associated with diversity, entrepreneurial cultures, and talent, thus establishing a link between the attraction, and retention, of talent, creativity and innovation. Further, the evidence also points to the presence of more knowledge based industry activity and higher gross value added at the city level. Holding knowledge based industry activity constant, there is also an independent effect from having more talent available in a city. These latter findings suggest that economic based, human capital, models are important in explaining the geographic differences observed in the location of knowledge based economic activity and economic performance. But if we take a step back from this final outcome, our findings shed more light on the key drivers relevant to attracting new talent to cities. This is what Florida (2002) refers to as ‘creating an environment or habitat that can attract and retain talent, or human capital’ (p.754), and our findings suggest that creating an entrepreneurial culture, together with high levels of provision of public goods and services are important in this respect.

20 The Geographical Distribution of UK Talent
Again the findings lead to similar conclusions arrived at in the US work of Florida op. cit., who argues that these types of results give local policy‐makers new tools for intervention rather than relying on subsidies to attract firms and industries.
References
Berry C, Glaeser E (2005) The Divergence of Human Capital Levels across Cities. Harvard Institute of Economic Research, Discussion Paper No.2091. September.
Cowling M, Pollard E (2008) Graduate Locational Decisions. Mimeo: Institute for Employment Studies, Brighton. England.
Faggian A, McCann P (2006) Human Capital Flows and Regional Knowledge Assets: a simultaneous equation approach. Oxford Economics Papers, 52. 475‐500.
Fingleton B (2003) Increasing returns: evidence from local wage rates in Great Britain. Oxford Economic Papers, 55. 716‐739.
Florida R (1999) ‘The Role of the University: Leveraging Talent, Not Technology’. Issues in Science and Technology, XV (4). 67‐73.
Florida R (2002) ‘The Economic Geography of Talent’. Annals of the Association of American Geographers, 92 (4). 743‐755.
Foggarty M, Sinha A (1999) ‘Why older regions can’t generalize from Route 128 and Silicon Valley: university‐industry relationships and regional innovation systems’. In Florida R (ed.), Industrializing knowledge: university‐industry linkages in Japan and the US. Cambridge, MA. MIT Press.
Gabriel S, Rosenthal S (2004) ‘Quality of the Business Environment Versus Quality of Life: Do Firms and Households Like the Same Cities?’ The Review of Economics and Statistics, 86 (1). February. 438‐444.
Glaeser E, Kolko J, Saiz A (2001) ‘Consumer City’. Journal of Economic Geography, 1. 27‐50.
Glaeser E (2000) ‘The New Economics of Urban and Regional Growth’. Oxford Handbook of Economic Geography, ed. G Clark, M Gertler and M Feldman. 83‐98. Oxford. Oxford University Press.
Glaeser E, Scheinkman J, Schleifer A (1995) ‘Economic Growth in a Cross Section of Cities’. Journal of Monetary Economics, 36. 117‐143.
Glaeser E, Kallal H, Scheinkman J, Schleifer A (1992) ‘Growth in Cities’. Journal of Political Economy, 100. 1126‐1152.

Institute for Employment Studies 21
Greene F, Tracey P, Cowling M (2007) ‘Recasting the City into City Regions: Place Promotion, Competitiveness Benchmarking and the Quest for Urban Supremacy’. Growth and Change, 38 (1), March. 1‐22.
Jacobs J (1961) The death and life of great American cities. New York. Random House.
Lange F, Topel R (2004) The Social Value of Education and Human Capital. Mimeo: Yale University.
Leslie S, Kargon R (1996) ‘Selling Silicon Valley: Frederick Terman’s model for regional advantage’. Business History Review, 70. 435‐472.
Lloyd R (2001) Digital Bohemia: New media enterprises in Chicago’s Wicker Park. Mimeo: Annual meeting of the American Sociological Association, Anaheim, CA. August.
Lucas R (1988) ‘On the mechanics of economic development’. Journal of Monetary Economics, 12. 3‐42.
Peitro G (2006) ‘Regional Labour Market Conditions and University Drop‐Out Rates: Evidence from Italy’. Regional Studies, 40 (6). 617‐630.
Pollard E, Williams M (2005) ‘Graduate Employment Choices in the East Midlands’. Graduate Market Trends, Spring. 5‐8.
Porter M (1990) The comparative advantage of nations. Free Press. NY.
Romer P (1986) ‘Increasing returns and long‐run growth’. Journal of Political Economy, 94. 1002‐1037.
Romer P (1990) ‘Endogenous Technical Change’. Journal of Political Economy, 98 (5). S71‐S102.
Shapiro, J (2006) ‘Smart Cities: Quality of Life, Productivity, and the Growth Effects of Human Capital’. The Review of Economics and Statistics, 88 (2). May. 324‐335.
Simon C (1998) ‘Human Capital and Metropolitan Employment Growth’. Journal of Urban Economics, 43. 223‐243.
Ullman E (1958) ‘Regional Development and the Geography of Concentration’. Papers and Proceedings of the Regional Science Association, 4. 179‐198.
Ye X, Pendyala R (2004) A Model of Time Use Allocation using the fractional logit methodology. Mimeo: Department of Civil and Environmental Engineering. University of South Florida.

Table 2. Correlation Analysis Results
Housing Diversity Technology,
1997 Technology,
2003 Talent University Culture GVA per worker
New Female Talent
New Male talent
New Talent in Talented
Jobs
New Super Talent Population
Housing 1.00
Diversity –0.14 1.00
Knowledge 1997
–0.11 0.13 1.00
Knowledge 2003
–0.04 0.09 0.93 1.00
Talent 0.05 0.01 0.42 0.57 1.00
University –0.00 0.00 -0.01 0.03 0.31 1.00
Culture –0.11 –0.09 0.20 0.27 0.28 0.08 1.00
GVA per worker
–0.13 0.31 0.68 0.64 0.27 0.34 –0.01 1.00
New Female Talent
0.31 –0.04 0.03 0.10 0.36 0.15 0.07 0.02 1.00
New Male Talent
0.31 0.03 0.12 0.18 0.42 0.23 0.13 0.03 0.93 1.00
New Talent in Talented Jobs
0.30 0.11 0.10 0.15 0.37 0.16 0.03 0.11 0.94 0.96 1.00
New Super Talent
0.33 0.00 0.11 0.18 0.39 0.18 0.11 0.08 0.96 0.96 0.94 1.00
Population 0.14 0.19 –0.12 –0.09 0.03 0.24 –0.08 –0.11 0.44 0.40 0.44 0.37 1.00
2009 © Institute for Employment Studies
Institute for Employment Studies Sovereign House, Church Street, Brighton BN1 1UJ, UK Tel +44 (0) 1273 763400 Fax +44 (0) 1273 763401 London Office: 30-32 Southampton Street, London WC2E 7RA, UK www.employment-studies.co.uk