The generalized data management and collection … · The generalized data management and...
11
The generalized data management and collection protocol for Conductivity-Temperature-Depth Satellite Relay Data Loggers Photopoulou et al. Photopoulou et al. Animal Biotelemetry (2015) 3:21 DOI 10.1186/s40317-015-0053-8
Transcript of The generalized data management and collection … · The generalized data management and...

The generalized data management and collectionprotocol for Conductivity-Temperature-DepthSatellite Relay Data LoggersPhotopoulou et al.
Photopoulou et al. Animal Biotelemetry (2015) 3:21 DOI 10.1186/s40317-015-0053-8

Photopoulou et al. Animal Biotelemetry (2015) 3:21 DOI 10.1186/s40317-015-0053-8
REVIEW Open Access
The generalized data management andcollection protocol for Conductivity-Temperature-Depth Satellite Relay Data Loggers
Theoni Photopoulou1*, Michael A. Fedak2, Jason Matthiopoulos3, Bernie McConnell2 and Phil Lovell2Abstract
The software routines for data sampling and processing that are implemented on-board telemetry devices (tags)called Conductivity-Temperature-Depth Satellite Relay Data Loggers (CTD-SRDLs) enable the simultaneous collection ofbiological and in-situ environmental data by animal-platforms over periods of weeks to months, despite severe energyand bandwidth limitations imposed by their relatively small size. This extended operational lifetime is made possible bythe use of software protocols on-board the tags that manage sensors, data collection, storage, compression andtransmission to ensure that the most useful data are sent at appropriate resolution while minimizing redundancy.While tag software is tailored to the particular species under study and the questions being addressed with agiven field deployment, the philosophy behind Sea Mammal Research Unit Instrumentation Group (SMRU-IG) softwareprotocols is to adopt a general set of principles to achieve the best results within the energy and bandwidth constraints.Here, we discuss these and review the general protocol that is used to simultaneously collect information ongeographical movements, diving behaviour and in-situ oceanographic information from marine mammals.
Keywords: CTD-SRDL, SMRU-IG, Software protocol, CLS-Argos, Marine mammals, Diving, Oceanography,Constraints
BackgroundThe development and manufacture of animal telemetrydevices that exploit the Argos satellite data collectionand transmission system (CLS-Argos, http://www.argos-system.org/) began at the Sea Mammal Research Unit(SMRU) in the late 1980s [1]. Research and developmentare on-going by a dedicated group within SMRU (SMRUInstrumentation Group; SMRU-IG) using a package ofsensors produced by Valeport Ltd (UK), but a stable ver-sion of these tags that has been routinely deployed since2003 on wide-ranging polar marine mammals, is theConductivity-Temperature-Depth Satellite Data RelayLogger, or CTD-SRDL (Fig. 1).A precursor of the CTD-SRDL was deployed on be-
luga whales in 2001 to study the hydrographic condi-tions in an Arctic fjord [2], in Svalbard, and on Antarctic
* Correspondence: [email protected] for Statistics in Ecology, Environment and Conservation, Departmentof Statistical Sciences, University of Cape Town, Rondebosch 7701, CapeTown, South AfricaFull list of author information is available at the end of the article
© 2015 Photopoulou et al. This is an Open AcLicense (http://creativecommons.org/licenses/medium, provided the original work is propercreativecommons.org/publicdomain/zero/1.0/
fur seals at Bird Island, South Georgia [3]. Some of thefirst studies to use CTD-SRDLs involved the instrumen-tation of southern elephant seals from South Georgiaand Kerguelen [4, 5] illustrating the usefulness of the de-vices for jointly studying mobile top predator behaviourand ecology and the ocean environment they inhabit [6].Data from CTD-SRDLs are used not only to learn aboutthe instrumented animals themselves [4, 7, 8], but alsoto update bathymetric information in poorly surveyedareas [9], collect extensive and sometimes otherwise in-accessible oceanographic data [10–15], and have becomesubstantial contributors to the global ocean observingsystem [16–19].The purpose of this instrument and its data collection
protocol is to remotely and autonomously collect andtransmit simultaneous hydrographic and behaviouraldata from air-breathing marine vertebrates. Hence, theprotocol is designed for the collection of time-series dataover long periods, while being constrained by the physicalsize of the device and bandwidth for data transfer; boththose imposed by the limit time animals are at the surface
cess article distributed under the terms of the Creative Commons Attributionby/4.0), which permits unrestricted use, distribution, and reproduction in anyly credited. The Creative Commons Public Domain Dedication waiver (http://) applies to the data made available in this article, unless otherwise stated.

Fig. 1 Photograph of a CTD-SRDL, with visible hardware components labelled (photograph by Lars Boehme, SMRU). The tag is housed in normalsolid epoxy rated either to 500 m or 2000 m depth. Standard sensors include pressure, a wet/dry saltwater switch, temperature, conductivity. Thetag has a PC interface, is powered by a primary cell (battery) and the standard version includes an antenna
Table 1 Data collection and transmission summaries(CTD_GEN_07B)
Note: All values that can be changed to accommodate individualexperimental needs are enclosed in [square brackets].
Behavioural state definitions
Enter “hauled out” if dry for [10] min, exit if wet for [40] sec.
Enter “diving” if wet and depth is greater than [6] m for [8] sec,exit if depth is less than [6] m for any length of time ([0] sec),or dry at any time.
“At the surface” is the complement of “hauled out” and “diving”.If this state persists, and there is no dive for [9] min, it is called “cruising”and is treated as a separate state. Entry and exit information is storedand transmitted.
Data types
i. Dive record: [30 k] bytes are made available for dives, which arestored in groups of [3]. If we assume average dive duration of [10]min this results in a [6.25] day buffer with capacity for [300] dives.
ii. Haulout and cruise record: [480] bytes each are available for hauloutsand cruises. Since only the entry and exit times are stored for hauloutsand cruises this means that [30] haulouts and [30] cruises can be storedin the buffer.
iii. Summary record: [680] bytes are made available for [6] hoursummaries, which are stored in groups of [3]. This results in a[7.5] day buffer.
iv. CTD or temperature cast record: [5 000] bytes are available forCTD casts which results in a [7.5] day buffer.
Photopoulou et al. Animal Biotelemetry (2015) 3:21 Page 2 of 10
and by CLS-Argos technology. These constraints necessi-tate the use of efficient algorithms to produce small par-cels of information that have a chance of being receivedby the ground station once they are transmitted, such asdata summaries and abstracted data [20–22]. Ultimately,the objective is to achieve the most effective representa-tion of animal behaviour and the in-situ environment,given the constraints on data processing, data storage, anddata transmission. A thorough appreciation of the waythey are collected and the algorithms by which they arecompressed [20, 23] is critical for the meaningful scientificinterpretation of the data that are finally received.CTD-SRDLs are particularly relevant for studies in
which long-term datasets are required, and in caseswhere archival tags can only infrequently be recovered.These instruments have been deployed on a wide rangeof animals and have been particularly successful in pro-viding oceanographic information from under-sampledlocations, such as remote, ice-covered or near-shore re-gions in polar oceans [19]. The oceanographic data pro-duced by these tags is widely used and are increasinglybeing made freely available [24]. For example, there isnow a web portal [25] for accessing much of the datacollected by these tags in a consistent format and stan-dardized accuracy [10]. Here, we document the generalstructure of the protocol for data collection by CTD-SRDLs and, where useful, give example parametervalues. We present a condensed overview of the types ofdata that are collected, in Table 1. We present schematicrepresentations of the relationships between the differentbehavioural states (Fig. 3), the protocol for collection of

Table 2 Data relay
The tags are certified to communicate with six polar orbiting satellitesoperated by Argos [27]. Communications between the tag and thesatellites are subject to strict rules. Information is sent in units, ormessages (termed “uplinks”), which may be up to 960 msec in durationand require a minimum of 40 sec between attempted transmissions.Two or more complete uplinks are required for the system to computea location. Uplinks have a fixed length: 28 bits are used to identify theinstrument. A further 248 bits are available to represent the behaviouraland hydrographic data.
The combination of this transmission regime, the brief and infrequentsurfacing behaviour of air-breathing marine animals, the fact thatsatellites will not always be available, the lack of acknowledgement ofreceipt of a message and the tags’ energy constraints all demandcomplex data collection software, extreme data compression andtransmission strategies that maximise the information that is sent usinga small amount of energy. As a result, the software and processingroutines implemented on-board CTD-SRDLs have been developed overmany years to try to maximise the amount of biologically andhydrographically relevant information that can be sent, while usingthe lowest possible bandwidth.
The critical factor in terms of effective use of energy is the balancebetween the rate of data collection and the transmission of the data(Fig. 2). Routine sampling of the instrument’s sensors requires littleenergy. It should be noted however, that even when longevity of thetag is forfeited for higher resolution data, there is still an upper limit tothe throughput and rate of information transfer this tag is capable of.
Photopoulou et al. Animal Biotelemetry (2015) 3:21 Page 3 of 10
CTD profiles (Fig. 4), and an overview of the possibleoutcomes as one parcel of information passes throughthe algorithm (Fig. 5).
ReviewAimIn this section we provide a detailed description of theorder and hierarchy of events that take place on-board aCTD-SRDL when collecting, processing and sendingdata, so as to highlight the strengths, limitations andpotential applications of the data returned by the in-struments. The CTD-SRDL software specificationCTD_GEN_07B, developed in 2007 for deployments onsouthern elephant seals Mirounga leonina is used hereas a working example to illustrate the data collection,abstraction and compression routines carried out on-board a CTD-SRDL. Variants of this basic programhave been developed since then, but this represents themost generally used protocol for CTD-SRDLs.To illustrate the problem the protocol tries to solve,
consider this challenge: about 100 kB of information arecollected each day at 1-4 sec intervals. No more than 1kB is likely to be received by the ground station. There-fore, data on the parameters of interest need to be fittedinto several messages, of fixed size, that are not inter-dependent. These messages are required by the CLS-Argos to be of fixed size and no acknowledgement ofsafe receipt is returned to the CTD-SRDL. Although wepresent here a generalized version of the software proto-col, it is one that illustrates the principles, strategies andtrade-offs that form the common backbone of thesoftware.
Hardware componentsThe tag consists of a set of sensors, a microcontroller(programmed mainly in C), a real-time clock, and datastorage, linked to a transmitter and antenna to send theinformation to a satellite. A primary lithium cell to pro-vides operating energy (Fig. 1). The microcontrollermanages the overall operation of the tag including thesensors’ operation and duty cycle, collection of data, anddata compression, selection and analysis. Monitoring allof these is critical to making the best use of its battery.The standard sensors measure pressure, the temperatureand conductivity of seawater. A wet-dry sensor acts as asurface detector to establish when to attempt to transmit[22] (Fig. 1). Variants have included other sensors formeasuring environmental variables, such as swimmingspeed, fluorescence, and oxygen.
Software systemsThe software design for CTD-SRDLs strives to overcomea set of constraints imposed primarily by three compo-nents of the system: 1) the hardware: constrained by size
and limited energy of the battery; 2) the communicationsystem: constrained by limited availability and band-width of the satellite system used to relay data to theground station; and 3) the behaviour of marine animals:adds constraints to other elements by brief and infre-quent surfacing, together with extended periods at sea.Details of the interaction of these three factors can befound in Table 2 (also Fig. 2). Aspects of the collectionand compression routines for the behavioural and hydro-graphic data have already been described in [21, 23] and[22], respectively. These are presented succinctly inTables 3 and 4.
Protocol overview and rationaleThe tag can be activated prior to deployment by simulat-ing submergence (allowing a current to flow betweenthe two copper lugs in the front of the tag). Otherwise,the tag is activated automatically after deployment assoon as the wet-dry sensor is submerged, and does notswitch off until it runs out of energy. The basic samplingregime generally occurs at a 4 sec interval and consumeslittle energy, but some sensors, such as conductivity, anddepth to a certain extent, cannot be operated continu-ously and are switched on when needed according to spe-cific parameters (Fig. 4, Additional file 1: Supplementarymaterial S4).The protocol overview is as follows. First, temperature,
pressure and wet/dry sensors are sampled at maximumtemporal resolution (i.e., every 4 sec, or every 0.5 sec ifwithin 6 m of the surface), and at maximum precision.Functional models of behaviour are used to structure

Fig. 2 A diagram of the relationship and trade-offs between the rateof data collection (sampling rate) and transmission rate over thelifetime of a CTD-SRDL. The role of the pre-deployment configurationstage of the protocol is to bring this balance as close to optimal aspossible (for details see Additional file 1: Supplementary material S1)
Table 4 Data collection by hydrographic sensors
For a summary of CTD data collection please see the Supplementarymaterial: Temperature and salinity cast records.
i. Pressure (Depth) and Temperature
The nominal accuracy of the pressure transducer is approximately20 m for the entire range of temperature and pressure it is designed tosample (from 0 m to 2000 m and from -40 to +80 °C). In practice thetemperature range is much less than these limits, and it has been foundthat the error in surface pressure following a deep dive can be about0.5-1.5 m rather than zero. To minimize the pressure measurement erroras much as possible, the instrument updates the zero-offset, wheneverthe wet/dry sensor reads “dry”. The exact value of the zero-offset willvary according to the hydrographic conditions, which is why theinstrument is programmed to update this value whenever the sensorreads “dry”. The pressure reading is deliberately shifted away fromzero to avoid interference from electrical noise generated by the tag.
Depth within a dive is calculated as follows: 1) pressure is collected,2) the zero-offset is subtracted from the pressure measurement, 3) theresulting value is converted to depth, and 4) pressure is rounded to thenearest dbar (or nearest 2 for deep diving species) for the purpose ofconstructing a temperature vs depth or salinity vs depth profile. Theresulting depth measurements are processed by the instrument at itsinternal resolution of 10 cm for behavioural samples such as the diveshape buffer.
Upcasts performed by the current generation of CTD-SRDLs yield 17values each for temperature and conductivity. Temperature is collectedat a resolution of 0.001 K within a valid range of -3 to 40 °C (seeSupplementary material: Temperature and salinity cast records).
The minimum and maximum temperature within an upcast are sentwith high precision, and each of the 17 temperature values is expressedas a percentage of the range (0 = Tmin, 100 = Tmax), in units of 1/1000.The resolution of the temperature measurements will be 0.001 K if thetemperature range of the profile is less than 1 K, or (Tmax-Tmin)/1000 ifthe range is greater than 1 K. For CTD-SRDLs accuracy of thetemperature measurement is at least 0.01 K.
ii. Salinity
Salinity is treated in the same way as temperature (see Supplementarymaterial: Temperature and salinity cast records). Conductivity andtemperature are used to calculate salinity, then conductivity is discarded.
Photopoulou et al. Animal Biotelemetry (2015) 3:21 Page 4 of 10
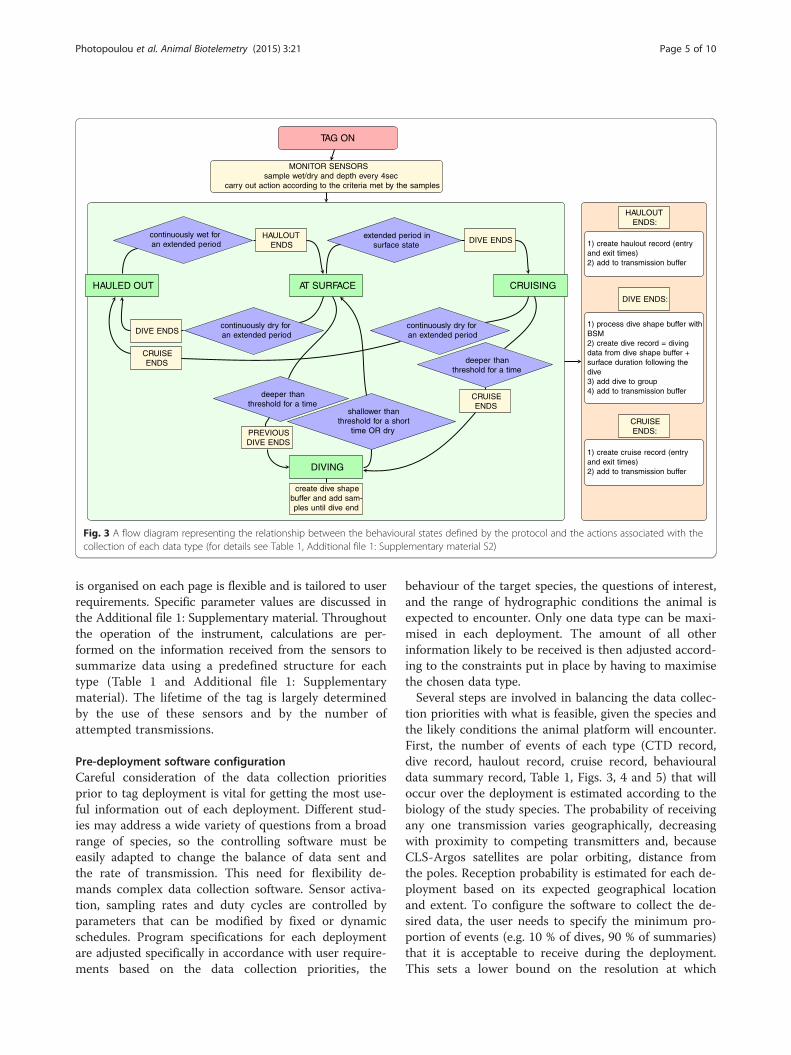
the data in a biologically intuitive way. Standard behav-ioural categories are “diving”, “hauled out” and “at thesurface” (Table 1 and Fig. 3 for overview, Additional file 1:Supplementary material S2 for details). Data selection andcompaction techniques are applied to each data type to re-duce the physical memory required to store the data [23](Table 3). A memory store of appropriate size is created,according to the deployment’s data collection priorities, tohold the data for later transmission. The tag continually
Table 3 Data abstraction with the broken-stick model
The broken-stick model (BSM) [26, 28] is a piecewise linear approximationmethod, used here to represent time-depth dive and hydrographcprofiles with a smaller number of points than their full resolution. This hasbeen used as the abstraction algorithm on-board SRDLs for dive data andhydrographic data on CLS-Argos tags from 2007 onwards.
The number of iterations of the algorithm that are carried out on boardthe tag can be adjusted. The principle of the algorithm is to use linesegments to approximate a shape, adding points to the piece-wiselinear representation where it differs most from the original shape.
In the case of dive profiles, the differences between the BSM diveprofile and the original profile recorded by the tag are measuredvertically, i.e. metres. At each iteration of the algorithm, the point in theoriginal profile with the biggest vertical distance from the abstractedprofile is identified and added to the abstracted profile. This process isrepeated until the desired number of points is reached [23]. The depthpoints chosen by the BSM are stored at the tag’s internal resolution of10 cm and the time resolution (4 sec or multiples) is known implicitlysince it is linked to dive duration.
For CTD upcasts, which consist of fixed points as well as points chosenby the BSM, the first iteration of the algorithm is taken as the piecewiselinear profile made up of the deepest point, the surface point and theintermediate fixed depth points.
Salinity is stored at a resolution of 0.001 within a valid range of 10 to 50psu. Only minimum and maximum salinity within an upcast are sentand each of the 17 salinity values is expressed as a percentage of therange (0 = Smin, 100 = Smax), in units of 1/250. Minimum and maximumsalinities are sent with resolution 0.02 psu, which will limit the resolutionof the salinity measurements when the salinity range of the profile isless than 5 psu. If the range is greater than 5 psu the resolution is(Smax-Smin)/250.
Additional information on the post processed accuracy of the CTD datacan be found in [10] and at [25].
monitors the timing (when) and frequency (how many at-tempts) of data transmission to control energy costs andreach its targeted lifetime. Due to unpredictability in thebehaviour of the tagged animals, transmission is to somedegree opportunistic. A number of transmission targetscan be set during pre-deployment configuration. The tagmonitors progress towards the next target and adjusts anhourly transmission quota accordingly (Table 2).Data are organised into separate data templates called
“pages”, each of which must fit into the data spaceallowed for a single transmission. The way the information
TAG ON
MONITOR SENSORSsample wet/dry and depth every 4sec
carry out action according to the criteria met by the samples
AT SURFACEHAULED OUT
DIVING
CRUISING
HAULOUTENDS
continuously wet foran extended period
DIVE ENDScontinuously dry foran extended period
DIVE ENDSextended period in
surface state
continuously dry foran extended period
CRUISEENDS deeper than
threshold for a time
CRUISEENDS
deeper thanthreshold for a time
PREVIOUSDIVE ENDS
shallower thanthreshold for a short
time OR dry
create dive shapebuffer and add sam-ples until dive end
HAULOUTENDS:
1) create haulout record (entryand exit times)2) add to transmission buffer
DIVE ENDS:
1) process dive shape buffer withBSM2) create dive record = divingdata from dive shape buffer +surface duration following thedive3) add dive to group4) add to transmission buffer
CRUISEENDS:
1) create cruise record (entryand exit times)2) add to transmission buffer
Fig. 3 A flow diagram representing the relationship between the behavioural states defined by the protocol and the actions associated with thecollection of each data type (for details see Table 1, Additional file 1: Supplementary material S2)
Photopoulou et al. Animal Biotelemetry (2015) 3:21 Page 5 of 10
is organised on each page is flexible and is tailored to userrequirements. Specific parameter values are discussed inthe Additional file 1: Supplementary material. Throughoutthe operation of the instrument, calculations are per-formed on the information received from the sensors tosummarize data using a predefined structure for eachtype (Table 1 and Additional file 1: Supplementarymaterial). The lifetime of the tag is largely determinedby the use of these sensors and by the number ofattempted transmissions.
Pre-deployment software configurationCareful consideration of the data collection prioritiesprior to tag deployment is vital for getting the most use-ful information out of each deployment. Different stud-ies may address a wide variety of questions from a broadrange of species, so the controlling software must beeasily adapted to change the balance of data sent andthe rate of transmission. This need for flexibility de-mands complex data collection software. Sensor activa-tion, sampling rates and duty cycles are controlled byparameters that can be modified by fixed or dynamicschedules. Program specifications for each deploymentare adjusted specifically in accordance with user require-ments based on the data collection priorities, the
behaviour of the target species, the questions of interest,and the range of hydrographic conditions the animal isexpected to encounter. Only one data type can be maxi-mised in each deployment. The amount of all otherinformation likely to be received is then adjusted accord-ing to the constraints put in place by having to maximisethe chosen data type.Several steps are involved in balancing the data collec-
tion priorities with what is feasible, given the species andthe likely conditions the animal platform will encounter.First, the number of events of each type (CTD record,dive record, haulout record, cruise record, behaviouraldata summary record, Table 1, Figs. 3, 4 and 5) that willoccur over the deployment is estimated according to thebiology of the study species. The probability of receivingany one transmission varies geographically, decreasingwith proximity to competing transmitters and, becauseCLS-Argos satellites are polar orbiting, distance fromthe poles. Reception probability is estimated for each de-ployment based on its expected geographical locationand extent. To configure the software to collect the de-sired data, the user needs to specify the minimum pro-portion of events (e.g. 10 % of dives, 90 % of summaries)that it is acceptable to receive during the deployment.This sets a lower bound on the resolution at which

TAG ON
MONITOR SENSORSsample wet/dry anddepth every 4sec
is the depth threshold for aCTD cast met for thecurrent 6hr period?
1 000 m in hour 1600 m in hour 2300 m in hour 3100 m in hour 450 m in hour 525 m in hour 6
has a CTD cast beencollected during thecurrent 6hr period?
is the current depthgreater than the depth ofthe stored CTD cast by
20% or more?
continue normalsensor monitoring
CTD PROFILE
monitor change in depthuntil 10% shallower thandeepest point in dive
start sampling CTD every1 sec on the way up
process fixed and BSMpoints and add totransmission buffer
TRANSMISSION BUFFER
yes
no
no
yes
yes
no
Fig. 4 A flow diagram representing the collection of CTD data (for details see Table 4, Additional file 1: Supplementary material S4)
Photopoulou et al. Animal Biotelemetry (2015) 3:21 Page 6 of 10
different data types will be collected. It is then possible todecide which quantity to maximise (e.g. number of CTDprofiles expected to be received). Next, template pages arecreated for the dive, summary, and CTD data types, speci-fying the number of bits needed to achieve the requiredresolution. The required resolution of each data type isbased on the study’s priorities, which dictate the proportion
extended dryperiod?AT SURFACE
extended period ofwet but no diving?
CRUISING
HAULED OUT
save exit and entry timestogether with other
summary data (480 bytes)
T
nono
yes
yes
noyes
Fig. 5 A flow diagram representing the passage of a given data parcel thronot met, no actions are carried out
of all transmissions that should be devoted to each datatype. Each page may contain several data items within themaximum of 247 bits available for a single transmission.The proportion of transmissions assigned to each templateand the CTD sampling rate are modified such that the tar-get quantity is maximised and other data types each achievethe minimum number of receptions. Note that changing
TAG ON
sample wet/dry anddepth every 4sec
wet and at depth? DIVING
create dive shape bufferand add samples
once complete: diveis sent for pro-cessing by BSM
add dive to group(30 000 bytes)
does depth meet the criteria forrecording a CTD profile?
CTD PROFILE
sample CTD every 1sec on ascent
process fixed and BSMpoints (5 000 bytes)
RANSMISSION BUFFER
yes
yes
ugh the protocol. If the criteria for a collection of a CTD profile are

Table 5 Dive records
Dive records resulting from most telemetry tags using the CLS-Argossystem will almost always be incomplete, i.e. have some missing dives,locations and CTD upcasts. This is exacerbated by the lack ofacknowledgement when transmitted information is received, or“handshake” between the platform and the satellite. This lack ofhandshake creates the need for a stochastic transmission strategyof the information accumulated in the transmission buffer.
The proportion of dive data that is lost will depend on a number offactors, including the geographic region in which the instrumentedanimal operates (e.g. polar regions have better coverage by Argossatellites than equatorial regions because they are polar orbiting), theanimal’s diving ecology, how long the animal spends at the surfacewhere transmission is possible, and the frequency with which thattransmission window occurs.
For elephant seals, there are two main reasons why data are lost. Firstly,as for all species, there will be periods during deployment whenconditions for satellite transmission are poor, and secondly, there maybe periods when data accumulate at a higher rate than the tag cantransmit them, for example periods of high diving activity that exceedthe size (in terms of time) of the transmission buffer. Southern elephantseals are a species that spend very little time at the surface (meansurface time 2.18 min ± 2.74 standard deviation, range 0.05-9.48 min,n = 187 832 dives, SMRU-IG unpublished data), providing a narrowwindow for transmission. The consequences of elephant seal surfacingbehaviour on the number of messages sent and the quality of thelocations are shown in Fig. 3 of [22]. The transmission buffer in CTD-SRDLs designed for deployment on southern elephant seals is madelarge enough to hold many days worth of dives, to minimize theproportion of information lost during low Argos coverage, and to avoiddata return being biased in favour of data collected during high Argoscoverage (Table 2). In addition, as mentioned above, stored data areselected randomly from the transmission buffer. Information remains inthe transmission buffer either until its “sell-by” date expires or itbecomes displaced by newer information being added to the buffer.
Photopoulou et al. Animal Biotelemetry (2015) 3:21 Page 7 of 10
the CTD sampling rate affects the energy available fortransmissions and hence the expected number of dataitems received. The sampling rate is tuned until an optimalbalance between sampling and transmission is achieved.Sometimes there is no satisfactory solution to the
trade-off between the CTD sensors’ sampling rate andthe expected number of data items received, e.g. if bat-tery capacity is inadequate (for long deployments), orthe additive effect of the animal's surfacing behaviourand CLS-Argos transmission frequency restrictions donot allow enough transmissions (for short deployments).In these cases, the constraint on the number of recep-tions can be relaxed to reduce the required batterypower, or two CLS-Argos transmitter id’s can be used toincrease transmission frequency.An important assumption is made with regard to data
relay by CTD-SRDLs; namely that all pages are equallylikely to be transmitted and received and that there is nospatial or temporal bias in the type of data that aretransmitted and subsequently received. Spatial and tem-poral bias can arise when one type of behaviour is car-ried out intensively (for example, if a long bout of divingis common prior to a long surface period), and whensatellite coverage is particularly good or bad, in one areaor for a time. Data are held in memory “buffers” to tryto make this assumption approximately valid (Tables 2and 5, Additional file 1: Supplementary material S1). Theuse of memory buffers makes the received data more rep-resentative of behaviour across the whole range of spatialand temporal locations visited during a deployment.
Software procedures during deploymentDuring operation, the information received from thetag’s sensors triggers processes that extract andsummarize data appropriately for each data type (Table 1,Fig. 3 and Additional file 1: Supplementary material S2,S3 and S4), and regulate the transmission scheduling ofthe tag, so as to take account of remaining battery power(Table 2). The behavioural model, parameterised appro-priately for the study species (for parameter values rou-tinely used for elephant seals see Table 1, Fig. 3; alsoAdditional file 1: Supplementary material S2), is used topartition behaviour into three mutually exclusive and ex-haustive states of haulout, dive, and surfacing behaviour.Behaviour is summarised over blocks of time, typically 4or 6 hrs, to allow diurnal patterns to emerge. The sum-mary statistics for each time block represent the entiretyof the data recorded during that period, not a statisticalsample. A subset of dive records is transmitted with thesummaries, providing a more detailed representation ofbehaviour in relation to environmental information,within the context of the summary information. The re-ceived dive records are a subset because not all recordsthat are collected and transmitted are received. It is
assumed that the dives in the transmission buffer providean unbiased sample of dives, from which dives are missingat random (Table 5, Additional file 1: Supplementarymaterial S3).When dives and hydrographic profiles are collected
the raw data are submitted for further processing usinga broken-stick model (BSM) [23, 26] (Table 3, Fig. 3).For dives, four iterations of the algorithm are carried outresulting in six times and six depths, including two sur-face points at the beginning and the end of the dive(Table 5, Additional file 1: Supplementary material S3).For hydrographic data, oceanographic requirements can,in some cases, determine specific depths at whichtemperature and salinity points must be collected, other-wise data are processed by BSM the same way as XBTcasts[22, 26] (Additional file 1: Supplementary material S4). Allnumeric samples are coded as a proportion of each vari-able’s range and stored together with the minimum andmaximum values. Digitising information in this way re-duces the memory required to store the data records andallows them to be fitted as closely as possible into the pre-scribed message size for transmission.After compression, related data types are grouped into
pages according to the page templates (e.g., dives arestored in groups of three) and stored in the transmission

Photopoulou et al. Animal Biotelemetry (2015) 3:21 Page 8 of 10
buffer (Additional file 1: Supplementary material S1). Inaddition, nine bits of error checking code are interleavedin each page to allow most errors in received transmis-sion to be detected. Each page must fit into the bit limits(239 + 9 = 248 bits) of a single CLS-Argos message.Pages of data are drawn from the buffer for transmissionin proportion to the desired likelihood of reception spe-cified in the pre-deployment configuration. This is ne-cessary because there is no two-way communication toindicate whether a given page of data has been success-fully received by the satellite.
Avoiding transmission biasAn additional technique is used to avoid transmissionsbeing biased towards periods of better satellite coverageor changes in the animal’s behaviour that favour trans-mission. Typically, five different pages are produced andstored in the transmission buffer, ready for transmissionby CLS-Argos. Two types of page (labelled here: 1a and1b) contain detailed information about dives, one pagecontains the summary data (2) including behavioural in-formation regarding any haulouts and cruises for onesummary period, and the two last pages each containpart of a CTD profile (3 and 4) because the hydro-graphic data are spread over two separate messages(fixed points and broken-stick points, when applicable).Pages are selected for transmission in a prescribed se-quence according to their type (for example: 1a 1b 2 3 43 4) in order to achieve the correct proportion of eachtype of information as described above. The sequence ofselection repeats indefinitely, cycling through the infor-mation in the transmission buffer.When it is time for a transmission, the page template
is applied to the next unexpired item in the appropriatecircular buffer. Sending pages more often increases theirprobability of reception. An item may remain in the buf-fer for many of these cycles before being discarded whenit reaches its “sell-by” date (e.g. each summary messageis transmitted 40 times on average to achieve a 95 %probability of being received, for more detail seeAdditional file 1: Supplementary material S1). The inde-pendence of the insertion process (as the data are col-lected and processed) and the extraction process (as thedata are selected from the buffer and transmitted) ensuresthat the likelihood of data being received is not biased bythe animal’s behaviour at the time of transmissions. Theeffect is that of randomizing the information in the bufferso that each data item is equally likely to be received.
ConclusionsThe CTD-SRDL is an animal telemetry device whosehardware and software have been developed over thecourse of more than two decades. Its soft- and hardwaresystems are purpose-built for the remote collection of
data on the biology of marine animals and their environ-ment, and this is the first time they have been holisticallyreviewed. The evolution of the instrument is on-going,driven both by biological and oceanographic questions.The field of animal telemetry has expanded dramaticallysince the first prototype predecessor of a CTD-SRDLwas deployed and transmission technologies have diver-sified substantially. Nonetheless, the CTD-SRDL is stillthe most commonly used instrument for collecting in-formation about widely ranging species in high latitudeareas. Almost 500 000 CTD and 5 million dive profilesrespectively, have been collected to date by CTD-SRDLssince 2003 (SMRU-IG unpublished data, June 2015).These CTD profiles are not only numerous but they arealso of global importance. They have contributed sub-stantially to the World Ocean Database [29] by provid-ing hydrographic information from areas never directlysurveyed [16, 24] and now comprise 70 % of all oceano-graphic profiles ever collected south of 60 °S, with in-creasing contribution in the Arctic [19]. At the poles,the CLS-Argos system continues to be the most effectivesatellite transmission platform for animal data, particu-larly when a) the animals do not spend long enough pe-riods at the surface or hauled out to allow the use of theIridium communications system, or b) when they do nothaul out in areas that allow the use of other transmissiontechnologies such as GSM. The species that have beeninstrumented with CTD-SRDLs most often includesouthern and northern elephant seals (M. leonina andM. angustirostris), Weddell seals (Leptonychotes weddel-lii), grey seals (Halichoerus grypus), hooded seals (Cysto-phora cristata) and several species of sea turtle.The outlook on future development of CTD-SRDLs,
similarly to other animal telemetry devices, includes re-ducing the size and increasing the battery life of the de-vice. Neither of these is a trivial challenge. Reduction insize is severely limited by the size of the conductivityand temperature sensors, while making the tag more en-ergy efficient depends on how much energy the sensorsare using as well as the overall energy availability pro-vided by the battery. The addition of novel sensors, suchas oxygen and pH, which would deliver highly desirableand previously unobserved datasets, is most often atodds with reducing the size and energy requirements ofthe device. These sorts of developments are constantlybeing researched but involve implicit challenges imposedby the existing framework of limited memory and energyas well as stringent bandwidth constraints.The trade-off between precision and bias, highlighted
above, is equally relevant here as it is in other applica-tions of optimisation. Maximising timing and frequencyof data transmission is important, but not if the most in-formative bits of data (i.e., precision) are lost in theprocess. The key objective for this protocol is to collect

Photopoulou et al. Animal Biotelemetry (2015) 3:21 Page 9 of 10
the most relevant data while dealing with the sometimesstrict constraints of technology and animal behaviour. Thedynamic modification of the transmission rates on-boardtelemetry devices, either due to extrinsic or intrinsic factorsaffecting transmission could result in bias. The use of mem-ory buffers, in the case of CTD-SRDLs, is intended toameliorate this but may, as a consequence, mask the degreeof intensity of behaviours, which is in turn important infor-mation regarding the animal platform. Due to multifacetedobjectives and trade-offs, the usefulness of any device forthe remote collection of animal observations will only be asgood as the overlap between the capabilities of the device,the specific behaviour of the animals and the scientificquestions sought to be answered using the resulting data.We hope that this review will promote appropriate usage ofboth historical CTD-SRDL data and data that continue tobe collected, as well as contribute to the on-going develop-ment of animal telemetry devices.
Additional file
Additional file 1: Supplementary material.
AbbreviationsBSM: Broken-stick model; CTD-SRDL: Conductivity-Temperature-DepthSatellite Relay Data Logger; CTD: Conductivity-Temperature-Depth;SMRU-IG: Sea Mammal Research Unit Instrumentation Group; SMRU:Sea Mammal Research Unit; XBT: Expendable bathythermograph.
Competing interestsThe authors declare that they have no competing interests.
Authors’ contributionsPL, MAF and BM are responsible for the conceptual development of theprotocol for CTD-SRDLs. PL designed and implemented the protocol presentedin this paper as software on-board CTD-SRDLs. TP collated and structuredthe information and wrote the manuscript. JM revised the manuscript forintellectual content and provided substantial editorial help while draftingthe manuscript. All authors read and approved the final manuscript.
Authors’ informationTP carried out her PhD thesis at SMRU, University of St Andrews 2008-2012 entitled“Diving and depth use in seals: inferences from telemetry data using regression andrandom walk movement models”, and is now a postdoctoral research fellow at theCentre for Statistics in Ecology, Environment and Conservation, Department ofStatistical Sciences, University of Cape Town. JM (previously part of SMRU, Universityof St Andrews) is Professor of Spatial and Population Ecology in the Institute ofBiodiversity Animal Health and Comparative Medicine at the University of Glasgow.BM is a Senior Research Scientist at SMRU, University of St Andrews. MAF is aProfessor at SMRU, University of St Andrews. PL is Head of Instrument Developmentat SMRU-IG, University of St Andrews.
AcknowledgmentsThe authors wish to thank Lars Boehme, Steve McPhail, Nora Hanson andDebbie Russell for valuable contributions to early versions of the manuscript.
Author details1Centre for Statistics in Ecology, Environment and Conservation, Departmentof Statistical Sciences, University of Cape Town, Rondebosch 7701, CapeTown, South Africa. 2Sea Mammal Research Unit, Scottish Oceans Institute,University of St Andrews, St Andrews, Scotland KY16 8LB, UK. 3Institute ofBiodiversity, Animal Health and Comparative Medicine, Graham Kerr BuildingUniversity of Glasgow, Glasgow, Scotland G12 8QQ, UK.
Received: 12 January 2015 Accepted: 17 June 2015
References1. McConnell B, Chambers C, Fedak MA. Foraging ecology of southern
elephant seals in relation to the bathymetry and productivity of theSouthern Ocean. Antarct Sci. 1992;4:393–8.
2. Lydersen C, Nøst O, Lovell P, McConnell B, Gammelsrød T, Hunter C, et al.Salinity and temperature structure of a freezing Arctic fjord—monitored bywhite whales (Delphinapterus leucas). Geophys Res Lett. 2002;29:2119.
3. Hooker SK, Boyd IL. Salinity sensors on seals: use of marine predators tocarry CTD data loggers. Deep Sea Res Part I Oceanogr Res Pap.2003;50:927–39.
4. Biuw M, Boehme L, Guinet C, Hindell M, Costa D, Charrassin J-B, et al.Variations in behavior and condition of a Southern Ocean top predator in relationto in situ oceanographic conditions. Proc Natl Acad Sci U S A. 2007;104:13705–10.
5. Charrassin J-B, Hindell M, Rintoul SR, Roquet F, Sokolov S, Biuw M, et al.Southern Ocean frontal structure and sea-ice formation rates revealed byelephant seals. Proc Natl Acad Sci U S A. 2008;105:11634–9.
6. Fedak M. Marine animals as platforms for oceanographic sampling: a “ win/win ” situation for biology and operational oceanography. Mem Natl InstPolar Res Spec Issue. 2004;133–147.
7. Biuw M, Nøst O, Stien A, Zhou Q, Lydersen C, Kovacs K. Effects ofhydrographic variability on the spatial, seasonal and diel diving patterns ofsouthern elephant seals in the eastern Weddell Sea. PLoS One. 2010;5:1–14.
8. Heerah K, Andrews-Goff V, Williams G, Sultan E, Hindell M, Patterson T, et al.Ecology of Weddell seals during winter: Influence of environmentalparameters on their foraging behaviour. Deep Sea Res Part II Top StudOceanogr. 2013;88–89:23–33.
9. Padman L, Costa DP, Bolmer ST, Goebel ME, Huckstadt L, Jenkins A, et al.Seals map bathymetry of the Antarctic continental shelf. Geophys Res Lett.2010;37:1–5.
10. Roquet F, Charrassin J-B, Marchand S, Boehme L, Fedak M, Reverdin G, et al.Delayed-Mode Calibration of Hydrographic Data Obtained from Animal-BorneSatellite Relay Data Loggers. J Atmos Ocean Technol. 2011;28:787–801.
11. Meredith MP, Nicholls KW, Renfrew IA, Boehme L, Biuw M, Fedak M.Seasonal evolution of the upper-ocean adjacent to the South OrkneyIslands, Southern Ocean: Results from a “lazy biological mooring.”. Deep SeaRes Part II Top Stud Oceanogr. 2011;58:1569–79.
12. Arthun M, Nicholls KW, Makinson K, Fedak MA, Boehme L. Seasonal inflowof warm water onto the southern Weddell Sea continental shelf, Antarctica.Geophys Res Lett. 2012;39:n/a.
13. Nicholls KW, Boehme L, Biuw M, Fedak MA. Wintertime ocean conditionsover the southern Weddell Sea continental shelf, Antarctica. Geophys ResLett. 2008;35, L21605.
14. Costa D, Klinck JM, Hofmann EE, Dinniman MS, Burns JM. Upper oceanvariability in west Antarctic Peninsula continental shelf waters as measuredusing instrumented seals. Deep Sea Res Part II Top Stud Oceanogr.2008;55:323–37.
15. Årthun M, Nicholls KW, Boehme L. Wintertime Water Mass Modification nearan Antarctic Ice Front. J Phys Oceanogr. 2013;43:359–65.
16. Roquet F, Wunsch C, Forget G, Heimbach P, Guinet C, Reverdin G, et al. Estimatesof the Southern Ocean general circulation improved by animal-borne instruments.Geophys Res Lett. 2013;40:6176–80.
17. Boehme L, Meredith M, Thorpe SE, Biuw M, Fedak MA. Antarctic CircumpolarCurrent frontal system in the South Atlantic: Monitoring using merged Argoand animal-borne sensor data. J Geophys Res. 2008;113, C09012.
18. Boehme L, Thorpe SE, Biuw M, Fedak MA, Meredith M. Monitoring DrakePassage with elephant seals: Frontal structures and snapshots of transport.Limnol Oceanogr. 2008;53:2350–60.
19. Fedak MA. The impact of animal platforms on polar ocean observation.Deep-Sea Res II Top Stud Oceanogr. 2013;7–13.
20. Fedak MA, Lovell P, Grant S. Two approaches to compressing andinterpreting time-depth information as collected by time-depth recordersand satellite-linked data recorders. Mar Mammal Sci. 2001;17:94–110.
21. Fedak MA, Lovell P, McConnell B, Hunter C. Overcoming the constraints oflong range radio telemetry from animals: getting more useful data fromsmaller packages. Integr Comp Biol. 2002;42:3–10.
22. Boehme L, Lovell P, Biuw M, Roquet F, Nicholson J, Thorpe SE, et al.Technical Note: Animal-borne CTD-Satellite Relay Data Loggers for real-timeoceanographic data collection. Ocean Sci Discuss. 2009;6:1261–87.

Photopoulou et al. Animal Biotelemetry (2015) 3:21 Page 10 of 10
23. Photopoulou T, Lovell P, Fedak MA, Thomas L, Matthiopoulos J. Efficientabstracting of dive profiles using a broken-stick model. Methods Ecol Evol.2015;6:278–88.
24. Roquet F, Williams G, Hindell MA, Harcourt R, McMahon C, Guinet C, et al. ASouthern Indian Ocean database of hydrographic profiles obtained withinstrumented elephant seals. Sci Data. 2014;1:140028.
25. Marine Mammals Exploring the Oceans Pole to Pole [http://www.meop.net/]26. Rual P. For a better XBT bathy-message on board quality control, plus a
new data reduction method. In: Picaut J, Lukas R, Delcroix T, editors.Western Pacific International Meeting and Workshop on Toga Coare. NewCaledonia: Noumea; 1989. p. 823–33.
27. Argos User’s Manual [http://www.argos-system.org/web/en/381-supportand-help.php]
28. Toms J, Lesperance M. Piecewise regression: a tool for identifying ecologicalthresholds. Ecology. 2003;84:2034–41.
29. World Ocean Database [https://www.nodc.noaa.gov/OC5/WOD/pr_wod.html]
Submit your next manuscript to BioMed Centraland take full advantage of:
• Convenient online submission
• Thorough peer review
• No space constraints or color figure charges
• Immediate publication on acceptance
• Inclusion in PubMed, CAS, Scopus and Google Scholar
• Research which is freely available for redistribution
Submit your manuscript at www.biomedcentral.com/submit