TalentLMS Gamification Knowledgebase: Our Features on Gamification
i
The Gamification of Physics Education: A Controlled Study of the
Effect on Motivation of First Year Life Science Students
by
Jordan Rose
A thesis
presented to
The University of Guelph
In partial fulfilment of requirements
for the degree of
Master of Science
in
Physics
Guelph, Ontario, Canada
©Jordan Rose, September, 2015

ii
Abstract
The Gamification of Physics Education: A Controlled Study of the
Effect on Motivation of First Year Life Science Students
Jordan Rose
University of Guelph, 2015
Advisor:
Martin Williams
This work evaluated the potential of the gamification of on-line undergraduate physics content
as a mechanism to enhance student learning and improve motivation. The main objective of
the study was to determine whether extrinsic motivation indicators commonly used in video
games are predictive of academic success. Life Science students taking an introductory physics
course were tested using gamified multiple choice quizzes against a control group. Gamified
quiz scores, motivation, engagement, attitudinal data and final grades were compared using
standard statistical techniques. Student motivation was quantified through student
participation beyond the requirements of the course. The results showed that gaming
techniques were significantly correlated to student motivation and engagement outside of the
classroom. However, no significant improvement of course grades was expected or found due
to the design of the study. The attitudinal survey data demonstrated a strong correlation
between student’s attitudes to the quizzes and their group placement.

iii
Table of Contents
1 General Introduction: .............................................................................................................. 1
2 Previous Research.................................................................................................................... 4
2.1 Technologies in Physics Education Research ................................................................... 4
2.1.1 Personal Electronic Response System: ..................................................................... 4
2.1.2 Virtual Learning Environment: .................................................................................. 5
2.1.3 Digital Simulations .................................................................................................... 6
2.2 Rewards and Motivation .................................................................................................. 6
2.3 Psychology and Video Games ........................................................................................ 11
2.4 Gamification as a Learning Tool ..................................................................................... 12
3 Methods and Materials ......................................................................................................... 14
3.1 The Quizzes: ................................................................................................................... 14
3.2 Platforms: ....................................................................................................................... 18
3.3 Design: ............................................................................................................................ 20
3.4 Distribution:.................................................................................................................... 23
3.5 Data Collection: .............................................................................................................. 24
3.6 Analytic Tools: ................................................................................................................ 25
4 Results and Discussion: .......................................................................................................... 28
4.1 Introduction.................................................................................................................... 28
4.2 Motivation and Engagement Measurements: ............................................................... 29
4.3 Motivation and Engagement Measurements Discussion .............................................. 35
4.4 The Missing Star Result and Discussion ......................................................................... 36
4.5 Attitudinal Surveys: ........................................................................................................ 38
4.6 Attitudinal Survey Discussion ......................................................................................... 46
4.7 Course Grades ................................................................................................................ 47
4.8 Course Grades Discussion: ............................................................................................. 50
4.9 Future Work and Limitations: ........................................................................................ 51
4.10 Criticisms ........................................................................................................................ 52
4.11 Conclusions..................................................................................................................... 53
5 Bibliography ........................................................................................................................... 55
6 Appendix A – Quiz Platforms ................................................................................................. 58

iv
7 Appendix B – Attitudinal Survey ............................................................................................ 71
Table of Figures
Comparison of the Three Platforms ............................................................................................. 20
GOPE Quiz Completion Comparison Between Gamified and List-style........................................ 29
Average Number of Attempts To Achieve Passing Threshold, Gamified vs List-style .................. 30
Average Number of Attempts After Achieving Passing Threshold, Gamified vs List-style ........... 31
Percentage of Students Who Achieved a Perfect Score, Gamified vs List-style ........................... 32
Percentage of Students Who Attempted After Reaching Passing Threshold Until Achieving a
Perfect Score, Gamified vs List-style ..................................................................................... 33
Breakdown of Students Who Achived a Perfect Score, Gamified vs List-style Pre-test 1 ............ 33
Breakdown of Students Who Achived a Perfect Score, Gamified vs List-style Pre-test 2 ............ 34
Breakdown of Students Who Achived a Perfect Score, Gamified vs List-style Pre-test 3 ............ 34
Breakdown of Students Who Achived a Perfect Score, Gamified vs List-style Pre-test 4 ............ 35
Percentage of Students Who Made Attempts After Achieving a Perfect Score, Gamified vs List-
style ........................................................................................................................................ 37
Positive Response Rate to Attitudinal Survey Statement “I liked the format of the pre-tests”,
List-style vs Gamified vs Courselink ....................................................................................... 39
Positive Response Rate to Attitudinal Survey Statement “I found working through the pre-test
to be an enjoyable exercise”, List-style vs Gamified vs Courselink ....................................... 40
Positive Response Rate to Attitudinal Survey Statement “I found the pre-tests to be engaging”,
List-style vs Gamified vs Courselink ....................................................................................... 41
Positive Response Rate to Attitudinal Survey Statement “I found the questions on the pre-test
to be very challenging”, List-style vs Gamified vs Courselink ............................................... 42
Positive Response Rate to Attitudinal Survey Statement “I found that the pre-tests helped
prepare me for the quizzes”, List-style vs Gamified vs Courselink ....................................... 43
Positive Response Rate to Attitudinal Survey Statement “I felt motivated to do well on the pre-
test”, List-style vs Gamified vs Courselink ............................................................................. 44
Positive Response Rate to Attitudinal Survey Statement “I would like to see elements of gaming
used as a teaching tool in more of my classes”, List-style vs Gamified vs Courselink .......... 45
Positive Response Rate to Attitudinal Survey Statement “I would like to see elements of gaming
used as a teaching tool in more of my classes”, Gamers vs Non Gamers vs Neutral ........... 46
Average Grades for Quizroom Tests, Gamified vs List-style vs Courselink .................................. 48
Number of Attempts in Quizroom, Gamified vs List-style vs Courselink ..................................... 49
Final Exam Averages ..................................................................................................................... 50
Gamified Platform Home Screen .................................................................................................. 58
Gamified Platform Question ......................................................................................................... 59
Gamified Platform Positive Instant Feedback .............................................................................. 60
Gamified Platform, Showing Increase in Points and Visualisation of Progress Bar ..................... 61
Gamified Platform, Negative Feedback ........................................................................................ 62
Gamified Platform, Alternate Positive Feedback ......................................................................... 63

v
Gamified Platform, Badge 1 .......................................................................................................... 64
Gamified Platform, Badge 2 .......................................................................................................... 65
Gamified Platform, Badge 3 .......................................................................................................... 66
Gamified Platform, Badge 4 .......................................................................................................... 67
Llist-style Platform ........................................................................................................................ 68
Courselink Quiz Front Page ........................................................................................................... 69
Courselink Quiz ............................................................................................................................. 70

1
General Introduction:
There has been an increasing demand on instructors, from both students
and universities, to increase the availability of online learning to students. Students who
have grown up with the internet are used to information being readily accessible to them
and tend to expect material from their classes to likewise be readily accessible online,
while the scalability of online resources allows for departments to cut costs. While
previous studies have focused on the pedagogical benefits of online learning, with
mixed reviews, the authors are unaware of literature explicitly focusing on methods of
motivating students to put more time and effort into their education outside of the
classroom, a critical aspect of the learning process [1] [2]. Traditional student
assignments and online quizzes assess only the final result of the learning exercise,
rather than the learning process. Because the learning process is not being rewarded or
assessed, students have very little motivation to take part in learning beyond the
acquisition of grades. A recent National Survey of Student Engagement reported that
nearly two thirds of American university students spend 15 hours or less per week
engaged in learning outside lectures, significantly less than instructors typically expect
of them [3] [4]. This is due in part to an increase in the number of students who are
working jobs during the school term in recent years, reducing the amount of hours
available for course work [5]. With this reduced time, students may choose only to
engage in activities that are directly related to their final grades and ignore any
additional efforts to enhance learning. The benefit of completing tasks related to final
grades is much clearer than tasks which make no such contribution. Thus, making the

2
benefit of enhanced learning tasks more obvious, students may choose to take on more
of these tasks. Continuous, immediate and guided feedback that rewards
improvement, rather than the end result, is pivotal in motivating and encouraging
students to improve their study skills [6].
One method of providing immediate and guided feedback is to use elements
from video games, called gamification. Video games are designed to provide the user
with constant feedback in a large variety of ways. A few gaming elements that can be
used to provide feedback in education are stories, leaderboards, achievements,
experience points, difficulty levels, leveling up, and streaks. Gamification through
simulation-games in cooperative environments has been shown to significantly increase
self-efficacy, knowledge and retention when compared to more traditional training
sessions [7]. In an educational setting, the positive benefits have been exceedingly
difficult to quantify. The literature of gamification in educational settings is largely
descriptive, short term studies often lacking control groups [8].
The purpose of the present study is to provide quantitative evidence for the
motivational effects that gamification can have in a first year physics class. My
hypothesis was that the introduction of gamification in the first year physics class will
result in higher levels of motivation and present an overall more enjoyable experience to
students. The thesis will begin with an overview of the previous literature that lends
evidence to the benefit of gamification in Chapter 2. This section will begin by outlining
the various technologies being used in physics classrooms today. This will be followed
by psychology research on the effect rewards have on motivation, as gamification is
largely built on rewarding users, as well as other psychological models that apply to

3
video games. Finally the section will end with some previous research that has been
done on gamification prior to this thesis.
The structure of the study will be laid out in Chapter 3. A thorough description of
the gamification process will be provided, followed by the study design including a
comparison of the quiz types, the distribution of the quizzes, and selection of
participants. The section will finish with a description as to what methods will be used
for quantifying the results.
Results of the study will be summarized in Chapter 4. It will begin with data on
the effort demonstrated by the students, followed by their attitudinal surveys and finally
their grades. These results will be interpreted, and suggestions for further
improvements will be discussed.
4
Previous Research
Technologies in Physics Education Research
Only fifty years ago there was very little in the way of options when it came to
teaching a physics class. To reach a large group of students it was required to have a
lecturer with a chalkboard in order that the students were able to see the material.
Demonstrations could be used by the instructor to supplement these lectures, but as
technology was developed and became less expensive, more options became available
to allow every student to add input or guide their own learning with a personal device.
However, as it takes time to envision and implement new ways of teaching which places
additional restrictions on the pace at which new technologies become incorporated.
Additionally, new techniques and technologies are often met with resistance. Only in
recent years has a number of new ways to engage students emerged and become wide
spread in use. A few methods will be outlined in this section.
Personal Electronic Response System:
Personal electronic response systems, the most common of which is a clicker,
are perhaps the most commonly used technology in the modern physics classroom.
Clickers are small, hand-held devices that are given to every student in a class.
Students are able to answer multiple choice questions on the device itself and their
responses are sent, via computer, to the instructor instantly. This gives the instructor
instant feedback on the understanding of the material by the students. The value of
clickers is that they hold students accountable for their answers, while keeping those
answers anonymous to their peers, as described in a report on how to effectively use
clickers by Wieman and Perkins [9]. They argue the technology is best used in
conjunction with other educational techniques, such as “think, pair, share”.

5
“Think, pair, share” is a teaching technique that begins by presenting the class
with a multiple choice question and giving students a small amount of time to answer
the question independently. It is at this stage a clicker can first be used to enhance the
process. Requiring students to answer the question with a clicker forces the students to
commit to their response, as well as give the instructor information on the initial
perceptions of the students. After the assigned time has passed, each student will
share and discuss their answer with a partner, forcing them to verbalize their
understanding. Instructors are able to circulate around the room and listen to these
conversations. The instructor then either asks a sample of the students to share their
answers with the rest of the class or has students once again respond using clickers.
Once again, clickers allow for the instructor to get a feel for the overall understanding of
the room after the exercise. These tools give the instructor a clear idea as to the level
of understanding of the students within the classroom as well as the common
conceptual problems encountered by the students who arrive at an incorrect response.
Virtual Learning Environment:
As an effective way of reaching a large number of students, Virtual Learning
Environments (VLE) are very common to nearly all courses in the modern age.
Common examples of VLE that are used in higher education include Desire2Learn,
Blackboard, WebCT, Locus LearningSpace, and COSE. Assignments, marks, lecture
notes, and textbooks are displayed online and accessible to students. This also allows
for instructors to communicate to all their students easily and effectively by posting
notices into the VLE. In a study of one particular VLE that included quizzes, collections
of problems and exercises, lecture notes and java applets, Martín-Blas and Serrano-
6
Fernández found that the feature most used by students posted was lecture notes, and
overall the students responded positively to the program [10].
Digital Simulations
Digital simulations bridge the gap between the purely abstract mathematical
models and the hands-on physics laboratories and demonstrations. Through
simulations, such as PhET, MyPhysicsLab and Physlet, you can overlay simplified
models on top of a real life example, and give students the means of adjusting the
variables and looking at the result [11] [12] [13]. In a real laboratory, it is often difficult to
isolate the concept you wish to teach. For example, it is very difficult to remove all
friction from a lab designed to demonstrate the concept of torque. In simulations, this is
not a problem as one can purposefully exclude any concepts not vital to the main
concept. This allows for instructors to design simulations that force students to question
their own assumptions as to how the laws of physics operate. In a report on
technologies in physics education, Krusberg recommended that students be required
predict the result of the simulations so that misconceptions can be challenged [14].
When students arrive in the physics classroom, they are not blank slates as instructors
might mistakenly assume, but instead come in with preconceptions that influence how
they interpret lessons. Krusberg explained that by requiring students to make
predictions for a simulation, they are forced to explicitly acknowledge these
preconceptions and confront them in cases where their predications did not come to
fruition.
Rewards and Motivation
Many early studies reported negative effects of extrinsic motivators on subjects,
one such effect being a decrease in intrinsic motivation [15] [16]. One explanation for
7
this outcome was that a reward was given too much importance for a task that did not
require learning, known as the “overjustification effect” [16]. This effect tends to persist
even after extrinsic rewards are removed, thus superfluous rewards are seen as
undermining to intrinsic interests [17].
However, there are criticisms to several of these results. First, many of these
results are for activities that are already intrinsically motivating. Extrinsic motivation
cannot negatively affect intrinsic motivation if there is no intrinsic motivation to begin
with. On the other hand, several of these studies acknowledge that for situations that
generate low intrinsic motivation, extrinsic rewards can be useful [17].
Harackiewicz investigated the overjustification effect, and examined the effects of
rewards on performance and intrinsic motivation [16]. Subjects that were given rewards
for demonstrating competency (performance-contingent rewards) exhibited a larger
decrease in motivation than subjects who were given rewards for simply completing the
task (task-contingent rewards). This effect was observed regardless of whether
positive feedback was given with the reward or not.
In another approach, Nolen attempted to find differences in performances and
beliefs between students motivated by learning for its own sake (task-oriented) and
students motivated by performing better than others to demonstrate superior ability
(ego-oriented) rather than discussing extrinsic and intrinsic motivations [18]. She
defined surface-level study techniques to refer to memorization of basic material within
a field, compared to deep-processing study techniques that make connections within
the material. She found that task-oriented students, instead of using surface-level
strategies, used study strategies that resulted in deep-processing. This result persisted

8
even when all students knew the value of deep-processing strategies over surface-level
strategies. Lepper connected Nolen’s work on task- and ego-orientation back to
intrinsic and extrinsic motivation and agreed that students who are intrinsically
motivated tend to approach studying and schooling with more effective and effortful
strategies than those who are extrinsically motivated [17]. He also pointed out that
many of the studies and conclusions formed around the effect of extrinsic rewards on
intrinsic motivation assume that subjects are intrinsically motivated to begin with. For
activities that are typically less intrinsically motivating, external rewards can be
demanded to achieve learning gains. For such a situation where extrinsic rewards can
be helpful, a “fading” strategy, where the rewards diminish over time, is suggested so
that as the students gain confidence with the activity, the rewards gradually decrease.
To better quantify studies on motivation, Harter developed a self-report scale that
helped to determine whether a student was motivated more by intrinsic or extrinsic
factors [15]. The survey separated different aspects of learning into five categories,
each of which could be ranked independently on whether the student was more
motivated intrinsically or extrinsically:
a) Learning motivated by curiosity versus learning in order to please the teacher
b) Incentive to work for one’s own satisfaction versus working to please the
teacher and get good grades
c) Preference for challenging work versus preference for easy work
d) Desire to work independently versus dependence on the teacher for help
e) Internal criteria for success or failure versus external criteria.

9
Harter found that each of the categories were completely independent, with many
students motivated intrinsically in some while extrinsically in others. Lepper, Iyengar
and Corpus criticized Harter’s scale’s treatment (and subsequent variations of it) of
intrinsic and extrinsic motivation as being two opposite elements on the same spectrum
[19]. Instead, they saw students capable of being motivated both intrinsically and
extrinsically simultaneously in each category. This would imply that the results of many
of the studies that showed extrinsic rewards as leading to diminished intrinsic
motivations were partially affected by how these factors are measured. By altering
Harter’s scale to separately measure intrinsic and extrinsic motivation, they found that
these two factors can be thought of as orthogonal parameters, both being found
simultaneously in each student. They went on to suggest that both intrinsic and
extrinsic motivations are important, and a student who is only motivated in one of these
ways may be imbalanced. It is both important to seek out activities that are inherently
enjoyable, while still being aware of the extrinsic consequences of the activities.
Eisenberger and Armeli developed several experiments that demonstrated the
effect of external rewards on creativity [20]. Children who were rewarded with five cents
for creative drawings continued to demonstrate higher levels of creativity compared to
children who received no reward, even after the former groups stopped receiving
rewards. In contrast, lower levels of creativity resulted when children were rewarded for
completing the task rather than for their creativity. In a second experiment by
Eisenberger and Armeli fifth and sixth grade students were either instructed to suggest
typical or unusual uses for everyday objects. In this experiment, students were either
given five cents or no reward for a correct answer. The students were then given a
10
booklet with 32 circles, the first of which had a “smiley” face. The students were then
given the choice to either replicate the smiley face or create an original image. All
students were rewarded for each drawing, regardless of whether it was a copy or
original. Both creativity and intrinsic motivation were shown to decrease when any
attempt in the activity was rewarded, but they increased when only creativity was
rewarded. This is important to consider when deciding to make use of extrinsic
rewards.
Eisenberger, Rhoades and Cameron provide alternate psychological
frameworks that suggest extrinsic rewards would increase intrinsic motivation [21].
They present the argument that extrinsic rewards based on performance gives the
subject information regarding their environment, which gives them an enhanced feeling
of control. By offering external rewards to encourage an action, “the potential recipient
can, if he or she so wishes, decline the reward and not act as requested. Thus,
performance-contingent reward might increase self-determination rather than reducing
it.” This framework was tested in a series of experiments. The results of the study
found that task enjoyment and intrinsic motivation increased when extrinsic rewards
were present. Although rewards made no difference in the subject’s self-competence,
feedback affected it positively. A difference could be found between groups when
comparing the type of feedback received. When given absolute feedback, knowledge
that the subject reached a set goal, they perceived themselves less competent than
subjects who were told, through normative feedback, as they were told they had
performed better than 80% of their peers.

11
The Zeigarnik effect describes how incomplete or interrupted tasks results in
higher retention rates for the task. Zeigarnik gave 20 small, simple tasks to subjects
such as listing words that begin with a particular letter [22]. Half of the tasks were then
interrupted and not given an opportunity for completion. When asked to recall as many
of the tasks as possible, a higher rate of retention was measured for the incomplete
tasks compared to the completed ones.
Psychology and Video Games
Psychology literature on the topic of video games has a strong focus on the link
between video games and violent behaviour, as well as video game addiction [23] [24]
[25] [26] [27]. King, Delfabbro and Griffiths note that few studies have looked into the
features of video games that lead to addiction [28]. To fill this gap in the literature, they
surveyed a total of 421 video game players and linked the frequency the participants
played video games, with various game features that were classified under five
categories: social features, manipulation and control features, narrative and identify
features, reward and punishment features, and presentation features. They found that
players rated “reward and punishment” features, such as leveling up and fast loading
times as some of the most enjoyable aspects of video games. Players at high risk of
addiction tended to rate more time consuming tasks, such as getting 100% in the game
or finding rare items, as more important than more casual gamers.
Millar and Navarick studied the effectiveness of video games as rewards used to
promote a desired behaviour in a subject, known as a positive reinforcer [29]. They
observed that subjects showed preference for immediate, short play sessions rather
12
than delayed, longer play sessions. This impulsive style of decision making is a trait
typically found in intrinsically motivating activities used for positive reinforcement.
Ryan, Rigby and Przybylski conducted four studies that showed that autonomy,
competence and relatedness all independently predict enjoyment and future play of
video games [30]. They also found that gamers who display competence and autonomy
while playing showed positive outcomes such as increased vitality (observed energy
and alertness), self-esteem and positive mood.
Gamification as a Learning Tool
Traci Sitzmann conducted a meta-analysis that analyzed the overall
effectiveness of computer-based simulation games [7]. Sitzmann set out to determine
the effects that simulation learning had on various training outcomes: three affective
(i.e., motivation, trainee attitudes and self-efficacy), one behaviour (i.e., effort), two
cognitive (i.e., declarative knowledge and retention), and two skill-based (i.e.,
procedural knowledge and transfer). Sitzmann found only one study that compared the
motivation of simulation game trainees to that of more traditional methods of training, as
well as only two studies comparing effort levels and three comparing trainee attitudes.
Due to the small sample sizes, the effect of simulation games on these criteria was not
conclusive due to insufficient sample sizes. This shows that there is a strong need for
more research to be done on how gamification affects motivation, which is the focus of
this thesis.
The meta-analysis found strong evidence that self-efficacy (a trainee’s
confidence that he or she can perform the learned task), declarative knowledge (names

13
and facts), procedural knowledge (steps and processes) and retention were improved
with simulation games compared to more traditional learning techniques. The
entertainment value of the game did not have an effect on the amount the trainees
learned.
In another meta-analysis, Ke found that of 65 game effectiveness studies,
34 of them reported significant positive effects compared to the control group, 17 of
them found mixed results, 12 found no difference and only one found conventional
instruction more effective [8]. However, Ke noted that the majority of the studies were
not longitudinal, and quite often the study only observed effects of subjects for a
maximum of two hours. There is a specific need for long-term studies to properly
determine the benefits of game-based learning. This is a second gap in the literature
that this thesis attempts to address.
In a study by Tüzün, Yilmaz-Soylu, Karakuş, İnal and Kizilkaya, it was found that
students who participated in game-based learning in a geography class showed
statistically significant higher intrinsic motivations [31]. Students who participated in
game based-learning were observed to have a decrease extrinsic motivation and were
more independent compared to the control group. As an unexpected consequence,
teachers found that their role changed from lecturer to guide, as students were
controlling their own learning.

14
Methods and Materials
This section will begin by giving a detailed description of the gamified quizzes
used in this study and how they differ from more traditional quizzes. This will be
followed by a description of the online platforms used to access these quizzes and how
they were distributed to students. Once this groundwork is in place, the design of the
study will be discussed, followed by the analytical tools used to interpret the data.
This section will reference quizzes, tests and pre-tests, which are defined in the
following paragraphs. The term “Test” will be used specifically for describing the
examinations students wrote in the quizroom, which will be described in detail in the
design section of this chapter. The term “Pre-test” will be used specifically for describing
examinations students wrote online as a prerequisite for the tests, and were the focus of
the study.
For the purpose of this thesis, the term “quiz” will be used when describing the
abstract topic of quizzes, rather than any particular application. For example, “quiz” will
be used when discussing similarities and differences between the different methods of
testing.
The Quizzes:
There were two styles of quizzes used in this study, the first of which was list-
style quizzes. List-style quizzes were the more traditional style of quiz in which students
were presented with a list of multiple-choice questions to answer. Students had access
to all the questions simultaneously and were able to answer questions in any order they
wish. Students were also able to change their answers as many times as they desired
before they submitted their quiz for grading. The grades for list-style quizzes were
15
calculated by the number of marks the student received divided by the total marks
available.
The second style of quiz used in this study was gamified quizzes. These quizzes
contained the same questions but were vastly different in delivery compared to list style
quizzes. With gamified quizzes, students were given questions one at a time and upon
submitting their answer they were immediately graded and given the next question.
While this removes students’ ability to change their responses, it gives them the benefit
of receiving immediate feedback. A correct response gave the student points. The
number of points a student received for a correct response was based upon the
following formula:
𝐾 ∗𝑐 − 1 + 𝑛
𝑐∗ 𝑁
Where c and K were constants that were adjusted for each quiz,
n is the number of correct responses answered consecutively,
N is the number of correct responses total so far.
Based on this formula, N increased, and hence the number of points awarded to the
student increased, each time the student correctly answered a question. Additionally,
the points would scale as the number of consecutive correct responses, n, increased.
This awarded more points to students who were able answer questions consistently.
The constant c was adjusted based on the number of questions in order to adjust the
strength of the consecutive bonus effect. If the strength of the bonus was too large, the
gamified quiz did not compare well against the list-style quiz, but if it was too small then
the gaming element became negligible. The constant K was adjusted for each quiz to
normalize the number of points so that the number of points amongst all the quizzes

16
was approximately the same, despite varying quiz lengths. While K could have been
adjusted to make the total available points exactly the same across quizzes, it is more
customary in video games to have scoring systems that end in 0 or 5, so K was
adjusted to maintain this practice. In order to pass the quiz, students were required to
receive a certain number of points, determined to be approximately of equal difficulty to
the list-style quizzes. Details on how the approximate difficulty and the gamified
passing threshold were determined will be discussed in the design section of this
chapter. Students taking the gamified quizzes could also earn up to three stars for each
quiz depending on the number of points received.
A number of formulas were generated and considered for this quiz before
deciding on the formula above. In order to determine which formula would be used, a
number of parameters such as passing threshold score, maximum score, the
percentage of students who fail the quiz despite answering a minimum of 60% of the
questions correct, the percentage of students who pass despite answering fewer than
60% of the questions correct, and skew. The threshold score was the number of points
a student would require to pass the quiz, and the maximum score was the maximum
number of points available. If these numbers had a range in order of magnitude too
high, it would be impossible to display a progress bar on the screen, and so a smaller
spread was desirable. If too many students who answer 60% of the questions correct
fail, or too many who answer less than 60% of the questions correct pass, then the
gamified quiz would not be comparable to a list-style quiz, and so formulas that
produced a higher rate of these were eliminated. The dependence of the formulas on
both consecutive number of correct responses and total number of correct responses
17
causes students to receive a greater number of points for getting streaks near the end
of the quiz compared to streaks earlier in the quiz. A large skew would punish students
who received easier questions in the start of the quiz compared to the end, and so a
formula with a smaller skew was desired. The chosen formula met the various criteria
most effectively.
Since the gamified quiz administered questions one at a time, this created some
significant differences in how students could approach each quiz. The most significant
difference in the approach was that students were unable to change an answer once
submitted. If a student realized how to approach a question after choosing an answer,
this would help the student for a list-style quiz, but not a gamified style quiz.
In the second iteration of the gamified quiz, additional gamified elements were
added. These modifications included a leaderboard, an achievement system, gamified
graphical updates and a more detailed test summary. The leaderboard allowed
students to choose to display their scores for other students to see. The achievement
system gave students an extra motivational tool allowing graphical acknowledgement
for accomplishing certain tasks such as accumulating three stars in every quiz or
completing all the quizzes within a stipulated time frame, as can be seen in Appendix A –
Quiz Platforms. The graphical update introduced a progress bar during quizzes that
updated as students received points, allowing them to see their progress in passing the
quiz and achieving stars. Finally, the detailed test summary provided feedback by
allowing students to compare their response to the correct response. The detailed test
summary was added to both the gamified and the list-style quizzes.

18
Overall, the gamified features used in this study were bonus streaks, points,
instant feedback, achievements, leaderboards, and stars. Table 1 shows a summary of
the differences between the gamified and list-style quizzes.
List-Style Gamified
All questions available simultaneously Questions are given one question at a
time
A correct response gives a student a mark A correct response gives a student points
The value of a question is fixed The points received for a correct response
depends on streaks
Final grade presented as
Number of correct
responses/Total Number of questions
Final grade presented as
Total score
A passing mark is 60% A passing mark is set to be of equivalent
difficulty to 60%
Table 1
Platforms:
There were two platforms where quizzes were written, the first of which was
courselink, the Virtual Learning Environment used at the University of Guelph.
courselink was used to provide students with their grades, course material, and online
testing material. The only style of quiz available to students through courselink was list-

19
style quizzes. On courselink, each quiz was weighted a total of 100 marks. While not
all questions were given the same weight within a single quiz, the variation between
questions was small.
The second platform was the Gamification of Physics Education (GOPE)
website, TheGope.com, which was developed by Boom Digital Media group specifically
for this study [32]. Boom Digital Media group produced the platform based on
specifications given to them. Ongoing communication between the parties continued
until all were satisfied with the results. The design of TheGope.com included an
improved graphical interface compared to courselink, and also provided more advanced
statistics on user information to use for analysis. As the courselink quizzes do not
provide enough data to make the necessary comparisons with the gamified group, we
decided to design a List-based quiz in the GOPE platform as well. Therefore
TheGope.com had both a gamified and a list-style version. Students who were placed
in the gamified group would see the gamified quiz after logging in and could not access
the list-style quizzes, and vice versa. In total, there were two list-style groups, one from
courselink and one from TheGope.com, and one gamified group, exclusively on
TheGope.com. Figure 1 summarizes the three groups that existed in this study.

20
Figure 1: Comparison of the Three Platforms
All students in the course had access to courselink, and students who were
placed in either of TheGope.com groups could still write quizzes on courselink, as there
was no measure available to prevent this.
Design:
This study involved students in a first year undergraduate life sciences class to
test the benefits of gamification in education. Students in the course were required to
write five tests throughout the term. These tests were all taken in a room known as the
“quizroom”. The quizroom was a physical space designed to administer tests to a large
number of students in succession. Students entered the quizroom and headed to the
front desk where they were processed and given a test. Each student would then have
20 minutes to write the test, after which they would sit next to a TA who would mark
their test immediately in front of the student. The quizroom was typically open during
two or three shifts each week day, most shifts being three hours long. Students were
able to show up at the quizroom during any shift and make an attempt at the test.
Courselink
Course Website
Already Established
Old Graphics
List-Style Quizzes
Control Group
List-Style
TheGope.com
Developed for This Study
New, Updated Graphics
List-Style Quizzes
Control Group
Gamified
TheGope.com
Developed for This Study
New, Updated Graphics
Gamified Quizzes
Test Group

21
These tests were marked out of 10, and students were placed in three categories based
on their scoring. If a student received a mark between 0 and 3.5, inclusive, the student
received no marks towards their final grade. If a student received between 4 and 7.5,
the student received 2% towards their final grade. If a student received between 8 and
10 the student would receive 10% towards their final grade. A student could attempt a
test on the same concept three times, and the grades from each attempt were
cumulative with a maximum possible 10%.
In order to make an attempt in the quizroom, students were required to write a
pre-test. There were a total of four pre-tests throughout the term; a fifth test required an
online lab rather than a pre-test for entry into the quizroom. The pre-test did not count
towards the student’s final grade, but students were required to achieve a minimum of
60% on the pre-test in order to enter the quiz room. Prior to this study, these pre-tests
were written by students on the course website via courselink. Students who
participated in the study were assigned to one of three groups. The first group
continued to write the pre-test on courselink, and henceforth will be referred to as the
courselink group. The second group was required to write their pre-test on The GOPE,
the gaming platform designed for this study, but were still given classical list-style
quizzes and will be referred to as the list-style group. The final group were required to
write their pre-tests on The GOPE and were given the full gamified quiz, and will be
referred to as the gamified group.
Since the gamified pre-tests used points rather than marks, an alternate means
of determining the threshold for passing was determined. In order to determine the
threshold score, a combinatorics approach was used; the number of ways a student can

22
achieve 60% or greater in a list-style quiz was counted. The possible scores in a
gamified quiz were listed from highest to lowest, and the threshold score was
determined so that there were an equal number of passing pre-tests as with the list-
style pre-tests. This allowed for a highly comparable level of difficulty between the two
quizzes. In addition, a small number of students could occasionally pass with less than
60% of the questions answered correctly, as well as occasionally not pass with more
than 60%.
Since the passing requirement for both groups were not identical, I will use the
term “passing threshold” to refer to either a gamified user reaching the required number
of points, or a list-style user reaching 60%. A perfect score will likewise refer to either
the maximum available points a gamified user can receive, or 100% grade from a list-
style user.
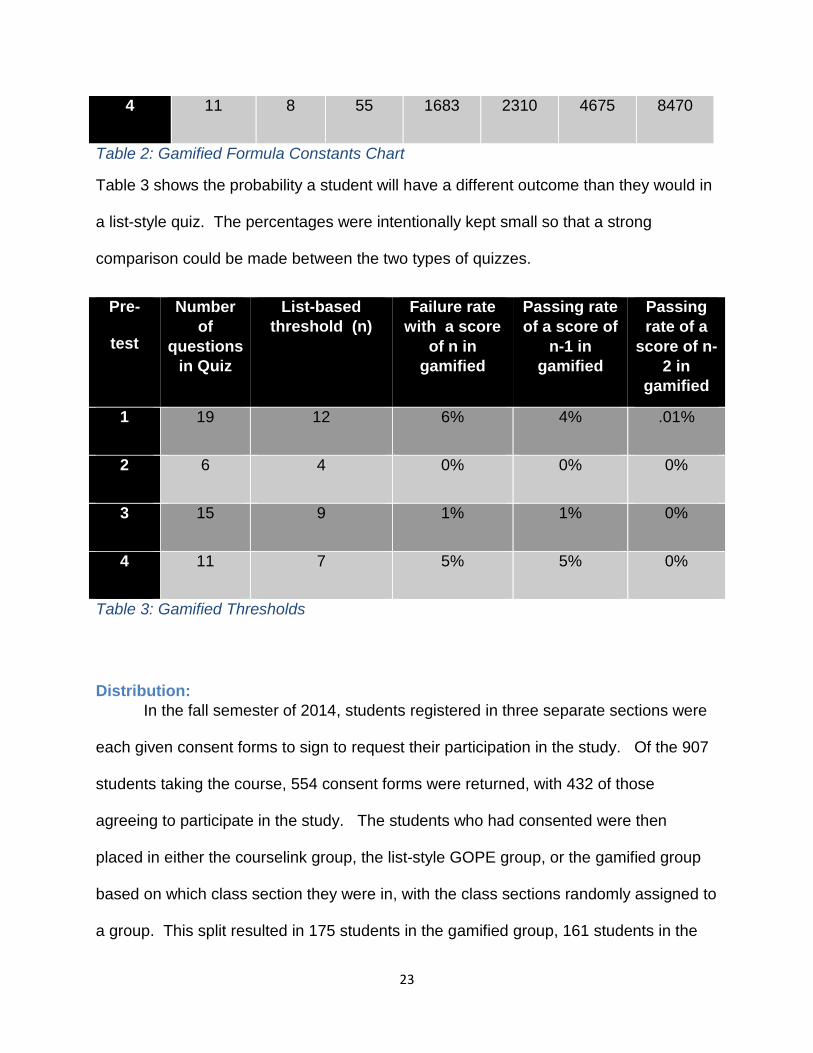
Table 2 summarizes the number of questions in each gamified pre-test, the
values to which the constants were set, the number of points required to pass, and to
receive one, two and three stars.
Pre-test Number
of
Question
s
c K Points
To Pass
Points
Needed
for One
Star
Points
Needed
for Two
Stars
Points
Needed
for
Three
Stars
1 19 10 20 1656 2382 4402 8360
2 6 2 150 1650 2100 4200 8400
3 15 5 25 1245 2075 3705 8600
23
4 11 8 55 1683 2310 4675 8470
Table 2: Gamified Formula Constants Chart
Table 3 shows the probability a student will have a different outcome than they would in
a list-style quiz. The percentages were intentionally kept small so that a strong
comparison could be made between the two types of quizzes.
Pre-
test
Number
of
questions
in Quiz
List-based
threshold (n)
Failure rate
with a score
of n in
gamified
Passing rate
of a score of
n-1 in
gamified
Passing
rate of a
score of n-
2 in
gamified
1 19 12 6% 4% .01%
2 6 4 0% 0% 0%
3 15 9 1% 1% 0%
4 11 7 5% 5% 0%
Table 3: Gamified Thresholds
Distribution:
In the fall semester of 2014, students registered in three separate sections were
each given consent forms to sign to request their participation in the study. Of the 907
students taking the course, 554 consent forms were returned, with 432 of those
agreeing to participate in the study. The students who had consented were then
placed in either the courselink group, the list-style GOPE group, or the gamified group
based on which class section they were in, with the class sections randomly assigned to
a group. This split resulted in 175 students in the gamified group, 161 students in the

24
list-style GOPE group, and 95 students in the courselink group. In this semester, 79%
of students were in their first semester, 3% of students were in their second semester,
and 17% of students were in their second year or above.
In the winter semester of 2015, students in two separate sections were given
consent forms. Of the 511 students taking the course, 204 consent forms were returned
with 159 students agree to participate in the study. The students who consented were
split into the three groups randomly using a random number generator. As the
courselink group provided less information for comparison, a greater weighting was
placed on the GOPE groups. This resulted in 61 students in the gamified group, 62
students in the list-style GOPE group, and 37 students in the courselink group. In this
semester, 3% of students were in their first semester, 70% of students were in their
second semester, and 27% of students were in their second year or above.
Data Collection:
Students who used the GOPE platform had a variety of data elements recorded.
Every time a student clicked the mouse on the interface, a record of what they clicked
and the date and time of the click was recorded. Additionally the correct responses for
each marked pre-test were recorded, as well as the marks or points associated with
each question. Finally, the total score of the pre-tests for each pre-test a student
attempted was recorded. This level of detailed information was not available for
students who used courselink, and so only the final grade for their pre-tests was used.
For all students, their mark on their tests, as well as the number of attempts in the quiz
room was recorded. Students’ exam marks as well as final grades were collected.

25
Additionally, a five-point Likert scale survey was distributed to all students who
participated in the study. The questions in the survey can be seen in Appendix B –
Attitudinal Survey. The survey had two major sections: gaming history and pre-test
preferences. The gaming history section asked students whether they considered
themselves to be a gamer, how often they played games, whether they use games as a
social outlet, as well as whether they find games to be engaging and relaxing. In the
pre-test preferences section, students were asked whether they found their pre-tests to
be challenging, engaging, motivating, enjoyable, helpful in preparing for the test, and
finally if they would like to see more gamification in the curriculum.
Analytic Tools:
The gamified platform used both extrinsic (e.g. stars) and intrinsic rewards (e.g.
engaging interface) to help with motivation, but this study did not use tools to
differentiate between intrinsic and extrinsic motivation. As a result, only the students’
overall motivation was measured. Motivation was measured in a few different ways, the
first being a comparison of the number of attempts students made after reaching the
passing threshold for their pre-tests. Since students were required to reach the passing
threshold for their pre-tests in order to write the test, all students were motivated to do
well on the pre-tests initially. However, once a student reached the passing threshold
for the pre-test, no additional motivation was provided to them in the context of course
work. While students were able to retake the pre-tests as many times as they liked, a
higher mark on the pre-test did not directly benefit their final grade in any way. Hence,
any additional attempts made by a student after reaching the passing threshold of the
pre-tests were indicative of the motivation a student had. The average number of
attempts made by students in each group was compared. Since the majority of

26
students were expected to not make any additional attempts, the sample distribution
would not be normalized and so a Mann-Whitney statistical test was used to test for
significance.
The second measure of motivation investigated was the percentage of students
who made an attempt after reaching the passing threshold and then achieved a perfect
score. As stated before, all students were motivated to do well on their pre-test in order
to achieve a passing grade. During this initial stage of higher motivation, it may have
happened that a student achieved a perfect score on their pre-tests. However, if a
student who passed their pre-test without a perfect score were to then return to the pre-
test and continued to make attempts until a perfect score was achieved, motivation
beyond the academic expectations would be demonstrated. Hence, the percentage of
students who continued to make attempts until a perfect score was achieved was
compared among the groups. Since this measure of motivation only looked at the
proportion of students in each group who completed this condition, a Pearson Chi-
Squared test was used to find statistical significance.
The survey responses were compared among the three groups in order to
determine student perceptions of the pre-tests. For the surveys, as the data is not
normalized, a Mann-Whitney test was used to test for significance between the groups.
In order to determine if the gamified groups performed better than the control
groups in the course, multiple factors were examined. A comparison of the average
mark for each quizroom test was made between the three groups. Since there are only
a discrete number of possible grades, as well as the fact that the tests are designed to
encourage 10/10's, the distribution was not normal. As a result, a Mann-Whitney test

27
was used to determine significance in the result. As most students end up with a 10/10
on their test, another factor to compare the student's abilities were the number of
attempts the students required in order to achieve their grade. Therefore, the average
number of attempts for each group was compared, and a Mann-Whitney test was used
to determine significance.
Final exam marks were also used to see if the pre-tests had an overall effect on
the student's final grade. Since there was no means available to prevent students from
writing their pre-tests on courselink, many students in the gamified and list-style groups
wrote some or all of their pre-tests on courselink. In order to compare final exam marks,
students were split into a total of five groups for comparison. Students who wrote all of
their pre-tests on The GOPE were separated into a group called Full Gamified or Full
List-style, while those who wrote one to three pre-tests on The GOPE were separated
into a group called Partial Gamified or Partial List-style. These four groups were then
compared to students in the courselink group.
28
Results and Discussion:
Section Introduction
This chapter is split into three major sections: Motivation and Engagement
Measurements, Attitudinal Surveys and Course grades. In each section the results will
be followed by a discussion in which a higher level of interpretation will take place.
In the Motivation and Engagement Measurements section the various tools used
to determine students’ level of motivation are examined. Several methods of
measurement were used including the number of attempts made after reaching the
passing threshold and the percentage of students who worked towards a perfect grade.
The second section in this chapter, Attitudinal Survey, looks at the responses
from students who gave feedback regarding their experience with the pre-tests
throughout the term. Students in the three experimental groups ranked their
experiences on a 5-point Likert based on how parameters such as how motivating,
engaging and challenging they found the pre-tests to be. The results of the surveys are
compared among the three groups.
The final section looks at the grades of the students in each group. Test marks
and exams were compared, as well as the number of attempts students made in the
quizroom.
Along with all the results will be P – values which are used to determine whether
a result is statistically significant. A result was considered significant when P < 0.05. All
the P-values will be given to three decimal places.

29
Motivation and Engagement Measurements:
Data collected from students placed in our three test groups were analysed to
ascertain motivation and engagement levels within the various groupings. As there was
no means for stopping students who were placed in the two GOPE groups from
completing their quizzes on courselink, not all participants in these groups completed
the pre-tests that were asked of them. Of the 236 students in the gamified group and
the 223 students in the list-style group, Figure 2 summarizes pre-test completion rates
for the GOPE administered pre-tests, with the total number of participating students on
the y-axis. All data presented in this section only count those participants who followed
through in their own group.
Figure 2: GOPE Quiz Completion Comparison Between Gamified and List-style
One aspect that was examined was the number of attempts that were required
before passing the pre-test. As seen in Figure 3, students in the list-style group
required, on average, fewer attempts in order to pass a pre-test than those in the
gamified group. While this trend is apparent for all four quizzes, the difference is only
0
20
40
60
80
100
120
140
Pre-test 1 Pre-test 2 Pre-test 3 Pre-test 4
Tota
l Nu
mb
er
of
Par
tici
pat
ing
Stu
de
nts
Gamified
List-Style

30
statistically significant for the third and fourth pre-tests (P = .739, .618, .000, .011,
respectively).
Figure 3: Average Number of Attempts To Achieve Passing Threshold, Gamified vs List-style
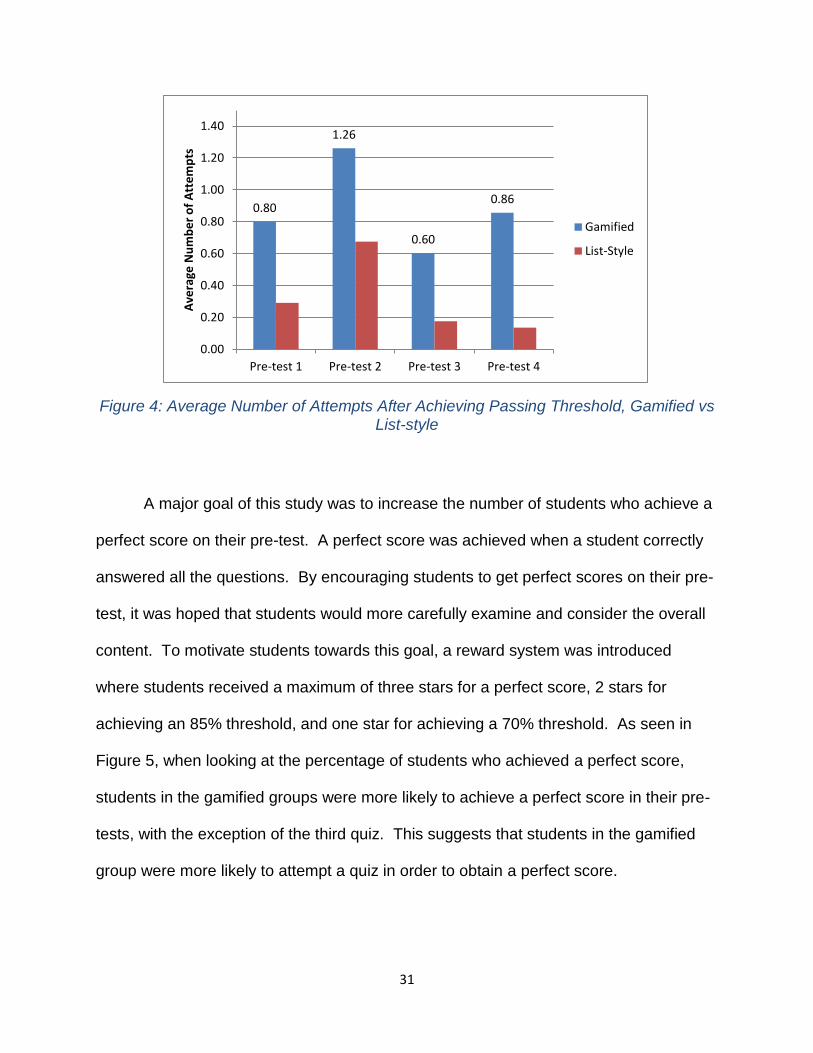
As a measure of motivation, the number of attempts made after a student had
already achieved the passing threshold on the pre-test was compared between the two
GOPE groups for each pre-test. The results for the two groups are shown in Figure 4.
The average number of attempts after passing is significantly greater in the gamified
group compared to the list-style group by a factor of 175% (P = .124), 84% (P = .045),
242% (P = .024), and 526% (P = .015) for the four pre-tests respectively. These results
suggest that students in the gamified group were much more likely to further attempt a
quiz after already achieving the passing threshold.
0
0.2
0.4
0.6
0.8
1
1.2
1.4
1.6
1.8
2
Pre-test 1 Pre-test 2 Pre-test 3 Pre-test 4
Ave
rage
Nu
mb
er
of
Att
em
pts
Gamified
List-Style
31
Figure 4: Average Number of Attempts After Achieving Passing Threshold, Gamified vs List-style
A major goal of this study was to increase the number of students who achieve a
perfect score on their pre-test. A perfect score was achieved when a student correctly
answered all the questions. By encouraging students to get perfect scores on their pre-
test, it was hoped that students would more carefully examine and consider the overall
content. To motivate students towards this goal, a reward system was introduced
where students received a maximum of three stars for a perfect score, 2 stars for
achieving an 85% threshold, and one star for achieving a 70% threshold. As seen in
Figure 5, when looking at the percentage of students who achieved a perfect score,
students in the gamified groups were more likely to achieve a perfect score in their pre-
tests, with the exception of the third quiz. This suggests that students in the gamified
group were more likely to attempt a quiz in order to obtain a perfect score.
0.80
1.26
0.60
0.86
0.00
0.20
0.40
0.60
0.80
1.00
1.20
1.40
Pre-test 1 Pre-test 2 Pre-test 3 Pre-test 4
Ave
rage
Nu
mb
er
of
Att
em
pts
Gamified
List-Style

32
Figure 5: Percentage of Students Who Achieved a Perfect Score, Gamified vs List-style
Of more interest is the proportion of students who achieved a perfect score after
achieving the passing threshold, rather than on their passing attempt. The percentage
of students in each group who made attempts towards achieving a perfect score after
obtaining a passing grade was compared between the two GOPE groups for each pre-
test. A direct comparison can be seen in Figure 6. The percentage of students who
met this criterion was significantly greater in the gamified pre-test groups compared to
the list-style group. The differences between the two groups for the four pre-tests were
respectfully 6.85% (P = .027), 6.08% (P =.144), 11.5% (P =.001) and 9.94% (p =.004).
This shows that students in the gamified pre-test group consistently scored a higher
number of perfect scores after achieving the passing threshold per pre-test than their
counterparts in the list-style.
In order to understand how students in either group approached achieving a
perfect score in their respective pre-tests, a breakdown by pre-test is presented in
Figure 7-Figure 10.
0%
5%
10%
15%
20%
25%
30%
35%
40%
Pre-test 1 Pre-test 2 Pre-test 3 Pre-test 4
Pe
rce
nta
ge o
f St
ud
en
ts
Gamified
List-Style

33
Figure 6: Percentage of Students Who Attempted After Reaching Passing Threshold Until Achieving a Perfect Score, Gamified vs List-style
Figure 7: Breakdown of Students Who Achived a Perfect Score, Gamified vs List-style Pre-test 1
8%
14%
13%11%
1%
8%
1% 1%
0%
5%
10%
15%
20%
25%
Pre-test 1 Pre-test 2 Pre-test 3 Pre-test 4
Pe
rce
nta
ge o
f St
ud
en
ts
Gamified
List-Style
0%
5%
10%
15%
20%
25%
30%
35%
40%
Gamified List-Style
Pe
rce
nta
ge o
f St
ud
en
ts
Perfect Score AfterPassing Attempt
Perfect Score On PassingAttempt

34
Figure 8: Breakdown of Students Who Achived a Perfect Score, Gamified vs List-style Pre-test 2
Figure 9: Breakdown of Students Who Achived a Perfect Score, Gamified vs List-style Pre-test 3
0%
5%
10%
15%
20%
25%
30%
35%
40%
Gamified List-Style
Pe
rce
nta
ge o
f St
ud
en
ts
Perfect Score AfterPassing Attempt
Perfect Score On PassingAttempt
0%
5%
10%
15%
20%
25%
30%
35%
40%
Gamified List-Style
Pe
rce
nta
ge o
f St
ud
en
ts
Perfect Score AfterPassing Attempt
Perfect Score On PassingAttempt

35
Figure 10: Breakdown of Students Who Achived a Perfect Score, Gamified vs List-style Pre-test 4
Motivation and Engagement Measurements Discussion
Students in the list-style group required, on average, fewer attempts to pass the
pre-test than students in the gamified group, suggesting that the gamified quiz may
have been more difficult. This discrepancy can be explained as a result of small
advantages the list-style group had over the gamified group. For example, students
taking list-style pre-tests had more time to reconsider earlier questions as their answers
were not finalized until the entire quiz was done, while gamified pre-tests required
students to finalize their answer after every question. A second example was that
students were able to see multiple questions simultaneously, which gave students an
opportunity to deduce patterns and use a problem solving approach to find solutions to
groups of questions within the same topic.
Despite the small disadvantages, there are several indications to suggest that the
gamified pre-test provided students with a higher level of motivation compared to the
control groups. Since students who wrote the pre-tests only required a passing grade to
0%
5%
10%
15%
20%
25%
30%
35%
40%
Gamified List-Style
Pe
rce
nta
ge o
f St
ud
en
ts
Perfect Score AfterPassing Attempt
Perfect Score On PassingAttempt

36
enter the quizroom and the actual score on the pre-test was not used to determine the
students’ final grades, there was little incentive for the students to attempt to improve
upon their pre-test scores. The gamified pre-tests did not contain any additional,
school-related benefits to students compared to the control groups such as bonus
grades, extra content, or any preferable treatment due to their placement. Despite any
direct, school-related benefits, the gamified group made more attempts overall in every
pre-test. In particular, students in this group were more likely to make additional
attempts after passing their pre-test. This demonstrated that students were motivated
to use the gamified pre-tests beyond its intended use of acquiring access into the quiz
room.
What was even more enlightening was the percentage of gamified students that
would continue to make attempts after reaching the passing threshold until a perfect
score was achieved. Since the pre-test is a requirement to take the full test in the
quizroom, all students are motivated to do well on the pre-test to achieve the passing
threshold. However, students in the gamified group would receive three stars for a
perfect pre-test score and this would be displayed on their home screen profile on the
GOPE platform. The results were that on average over 10% of gamified students
demonstrated additional effort to achieve a perfect score, despite not being a course
requirement. This provides support for the hypothesis that gamification is an effective
tool to improve motivation in students.
The Missing Star Result and Discussion
Although unplanned, an additional result displaying student motivation was
observed. The formula used to determine the number of points a student receives for a

37
correct response in gamified pre-test 4 contained an unintentional error that resulted in
students being unable to receive a third star, which was the reward for a perfect score.
Students were still able to pass the pre-test, but a perfect score would grant a student
two stars rather than three. Due to this error it was observed that 12% of students in
the gamified group continued the activity even after getting a perfect score on their pre-
test. As can be seen in Figure 11, this result was not observed in any of the other pre-
tests, nor was it observed in the control group. This indicates that the stars were likely
an effective means of motivation; i.e. when students fail to receive their reward they
continue to work towards the goal in order to receive it.
Figure 11: Percentage of Students Who Made Attempts After Achieving a Perfect Score, Gamified vs List-style
The missing star result can likely be explained by making reference to the Zeigarnik
effect [22]. The Zeigarnik effect describes how people will have a higher rate of thoughts
and increased retention of tasks that are left incomplete than those that are completed.
Because the task of gathering the stars was left incomplete, it left a stronger impression
0%
5%
10%
15%
20%
25%
Pre-test 1 Pre-test 2 Pre-test 3 Pre-test 4
Pe
rce
nta
ge o
f St
ud
en
ts
Gamified
List-Style

38
on the students than had been seen in earlier pre-tets. Students are motivated to
complete the task of gathering stars in order to avoid this effect. This supports the
hypothesis that gaming elements such as stars are a contributing factor to the increased
motivation observed in gamified students in this study. While it is not recommended to
intentionally attempt to replicate this result, as it was most likely highly frustrating for
students to not receive a promised reward, this result showed the impact such gamified
elements have on motivation.
Attitudinal Surveys:
Participants in this study were asked to fill out a 5-minute online attitudinal survey
so that perceptions of the pre-tests in each group could be quantified. These surveys
used a 5-point Likert Scale with a “1” being “Strongly Agree” and a “5” being “Strongly
Disagree”. In these results, a lower numeric value represents a higher level of
agreement. In order to compare the responses between the groups, an average of the
responses was taken in each group and a Mann-Whitney test was used to determine
whether the results were statistically significant. The P-values will be shown with three
decimal places and significance will be assumed when P < 0.05. To help visualize the
differences between groups, a graph is included with each survey question. The graphs
show the percentage of students who gave a positive response (a “1” or a “2”) for each
question.
In order to ensure that students properly read the survey rather than just answer
the questions randomly, the following statement was included in the survey: “This

39
statement is used to discard the survey of people who are not reading the questions. To
preserve your answers, please choose “Disagree” (option 4)”. Students that did not
follow these instructions were not counted in the survey. Of the 591 students who
consented to the study, 374 (63% of total participants) filled out the survey at the end of
the term, and of these students 361 (61% of total participants) were included in the data
analysis.
In order to gauge whether the students liked the quiz format they were assigned,
they were given the statement “I liked the format of the pre-tests:”. The average
response from the gamified group was 2.14 compared to 2.53 from the list-style group
(P = .000), and 2.56 from the courselink group (P = .000). A graph showing the
percentage of positive responses from each group is displayed in Figure 12. This data
provides evidence that suggests that students prefer gamified quizzes to more
traditional quizzes.
Figure 12: Positive Response Rate to Attitudinal Survey Statement “I liked the format of the pre-tests”, List-style vs Gamified vs Courselink
0%
10%
20%
30%
40%
50%
60%
70%
80%
90%
100%
List-Style Gamified Courselink
Pe
rce
nta
ge o
f P
osi
tive
Re
spo
nce
s

40
Although tests are rarely described as enjoyable, one expectation of gamification
is to increase the enjoyment in students. To determine if this was successful, the
statement “I found working through the pre-test to be an enjoyable exercise:” was given
to students. The average response from the gamified group was 2.90 compared to 3.37
from the list-style group (P =.001), and 3.52 from the courselink group (P = .000). A
graph showing the percentage of positive responses from each group is displayed in
Figure 13. This data provides evidence that suggests that students find gamified pre-
tests significantly more enjoyable than traditional pre-tests.
Figure 13: Positive Response Rate to Attitudinal Survey Statement “I found working
through the pre-test to be an enjoyable exercise”, List-style vs Gamified vs Courselink
Another major expectation of gamification was that there would be an increase in
engagement from students. To determine if this was successful, the statement “I found
the pre-tests to be engaging:” was given to students. The average response from the
gamified group was 2.43 compared to 3.17 from the list-style group (P = .000), and 3.28
0%
5%
10%
15%
20%
25%
30%
35%
40%
45%
50%
List-Style Gamified Courselink
Pe
rce
nta
ge o
f P
osi
tive
Re
spo
nse
s

41
from the courselink group (P = .000). A graph showing the percentage of positive
responses from each group is displayed in Figure 14. This data provides evidence that
students found themselves more engaged in the material while they were using the
gamified quizzes than students in the control groups.
Figure 14: Positive Response Rate to Attitudinal Survey Statement “I found the pre-tests to be engaging”, List-style vs Gamified vs Courselink
While the questions in the pre-tests were identical between the groups, it was
important to determine whether the quiz type varied the student perceptions of the
difficulty. To answer this question, the statement “I found the questions on the pre-test
very challenging:” was included in the survey. The average response from the gamified
group was 3.54 compared to 3.67 from the list-style group, and 3.66 from the courselink
group with no significance found between the three groups (P = .177, .161,
respectively). A graph showing the percentage of positive responses from each group
is displayed in Figure 15. This shows that changing the style of quiz had very little effect
as to perceptions of difficulty.
0%
10%
20%
30%
40%
50%
60%
70%
80%
90%
100%
List-Style Gamified Courselink
Pe
rce
nta
ge o
f P
osi
tive
Re
spo
nse
s

42
Figure 15: Positive Response Rate to Attitudinal Survey Statement “I found the questions on the pre-test to be very challenging”, List-style vs Gamified vs Courselink
The intent of the pre-tests was to prevent students from attempting their test
without a first glance at the material, rather than to fully prepare students for the test.
Despite this, it was important to determine if student perceptions of how much the pre-
test prepared them varied between the groups. To answer this question, the statement
“I found that the pre-tests helped prepare me for the quizzes:” was included in the
survey. The average response from the gamified group was 2.30 compared to 2.38
from the list-style group, and 2.46 from the courselink group with no significance found
between the three groups (P = .881, .281, respectively). A graph showing the
percentage of positive responses from each group is displayed in Figure 16. This
shows that changing the style of the pre-test had very little effect as to the perceptions
of how well the pre-test prepared students.
0%
5%
10%
15%
20%
25%
List-Style Gamified Courselink
Pe
rce
tnag
e o
f P
osi
tive
Re
spo
nse
s

43
Figure 16: Positive Response Rate to Attitudinal Survey Statement “I found that the pre-tests helped prepare me for the quizzes”, List-style vs Gamified vs Courselink
A major goal of this study was to increase student motivation in their effort
outside the classroom. In order determine student perceptions of their own motivation,
the statement “I felt motivated to do well on the pre-test:” was included in the survey.
The average response from the gamified group was 2.14 compared to 2.33 from the list-
style group. Although this difference was not found to be significant (P = 0.066), a
significance was found (P = 0.009) when the gamified group was compared to the
courselink group, which had an average of 2.45. A graph showing the percentage of
positive responses from each group is displayed in Figure 17. This provided evidence
that there is some increase in motivation for students taking gamified pre-tests.
However, because there was nothing in the statement to differentiate motivation for
doing well before passing and after passing, this survey question did not properly
measure the intended parameter.
0%
10%
20%
30%
40%
50%
60%
70%
80%
90%
100%
List-Style Gamified Courselink
Pe
rce
nta
ge o
f P
osi
tive
Re
spo
nse
s

44
Figure 17: Positive Response Rate to Attitudinal Survey Statement “I felt motivated to do well on the pre-test”, List-style vs Gamified vs Courselink
One final way to measure student perceptions of gamified content is to ask if they
would like to see more gamification in the future, and so the statement “I would like to
see elements of gaming used as a teaching tool in more of my classes:” was included in
the survey. The average response from the gamified group was 2.16 compared to 2.68
from the list-style group (P = .000), and 2.59 from the courselink group (P = .000). A
graph showing the percentage of positive responses from each group is displayed in
Figure 18. This data suggests that students who experience gamification are more
likely to want to see more.
Students were also given the statement “I would consider myself to be a gamer:”.
When students are separated into groups based on their self-designation as a gamer
(strongly agree or agree) or a non-gamer (strongly disagree or disagree), the response
to the statement “I would like to see elements of gaming used as a teaching tool in more
of my classes:” shows different distributions between the groups, as seen in Figure 19.
0%
10%
20%
30%
40%
50%
60%
70%
80%
90%
100%
List-Style Gamified Courselink
Pe
rce
nta
ge o
f P
osi
tive
Re
spo
nse
s

45
For the gamers, the average response from the gamified group was 1.94, compared to
2.13 from the list-style group and 2.00 from the courselink group, with no significance
found between the three groups (P = .346, .499, respectively). For the non-gamers, the
average response from the gamified group was 2.23, compared to 3.02 from the list-
style group (P = .000), and 2.93 from the courselink group (P =.000). This presents
data that suggests that those who are inexperienced with video games do not have any
desire to see gamification enter the curriculum until they are exposed to it, at which
point they would like to see more.
One possible issue with this question is that students who were not in the
gamified group were not given an explanation as to what elements of gaming as a
teaching tool might look like. This meant that students outside of the gamified group
were less informed. The observed results may be a result of this bias.
Figure 18: Positive Response Rate to Attitudinal Survey Statement “I would like to see elements of gaming used as a teaching tool in more of my classes”, List-style vs
Gamified vs Courselink
0%
10%
20%
30%
40%
50%
60%
70%
80%
90%
100%
List-Style Gamified Courselink
Pe
rce
nta
ge o
f P
osi
tive
Re
spo
nse
s

46
Figure 19: Positive Response Rate to Attitudinal Survey Statement “I would like to see elements of gaming used as a teaching tool in more of my classes”, Gamers vs Non
Gamers vs Neutral
Attitudinal Survey Discussion
Students did not find the pre-tests to be particularly challenging in any of the
groups, and all three groups found the pre-tests equally helpful in preparation.
However, statistically significant increases were found in students’ self-reporting of
engagement and enjoyment and were more likely to report liking the format of their pre-
tests. These results are important as finding ways to increase student enjoyment in
their work can be a significant step in maintaining student morale. These survey results
give an overall impression of how the type of quiz affects student experiences. By
improving engagement and enjoyment, it is hoped that students will continue to show
higher levels of motivation.
Another important result found from the student surveys was the response to the
question “I would like to see elements of gaming used as a teaching tool in more of my
classes”. While there is a significance increase in students wanting to see elements of
gaming in students who were in the gamified group, this effect is even more pronounced
0%
10%
20%
30%
40%
50%
60%
70%
80%
90%
100%
Gamers Non-Gamers Neutral
Pe
rce
nta
ge o
f P
osi
tive
Re
spo
nse
s
List-Style
Gamified
Courselink
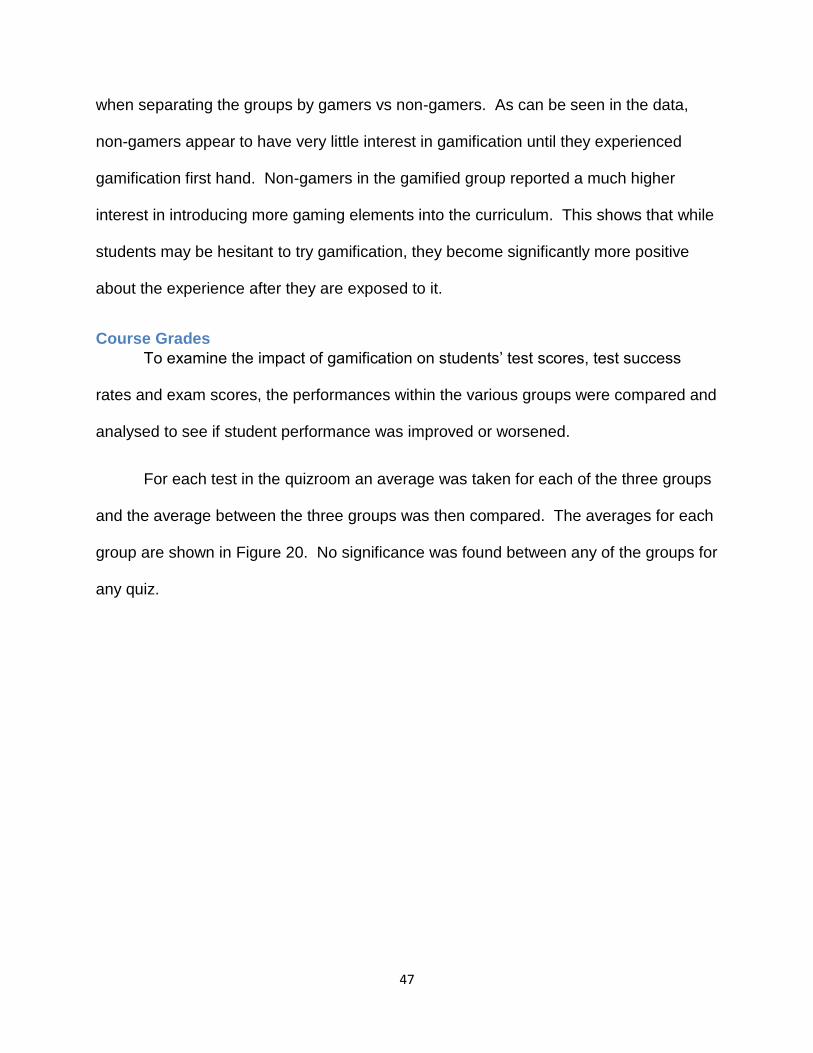
47
when separating the groups by gamers vs non-gamers. As can be seen in the data,
non-gamers appear to have very little interest in gamification until they experienced
gamification first hand. Non-gamers in the gamified group reported a much higher
interest in introducing more gaming elements into the curriculum. This shows that while
students may be hesitant to try gamification, they become significantly more positive
about the experience after they are exposed to it.
Course Grades
To examine the impact of gamification on students’ test scores, test success
rates and exam scores, the performances within the various groups were compared and
analysed to see if student performance was improved or worsened.
For each test in the quizroom an average was taken for each of the three groups
and the average between the three groups was then compared. The averages for each
group are shown in Figure 20. No significance was found between any of the groups for
any quiz.

48
Figure 20: Average Grades for Quizroom Tests, Gamified vs List-style vs Courselink
In addition, the number of attempts students made in the quiz room was
compared. A stronger student would require fewer attempts as they are able to pass
the quiz on their first try. The averages for each group are shown in Figure 21. While
no significance was found between the gamified and list-style for any of the four
quizzes, significance was found between the gamified and courselink groups for quizzes
2 and 3. This is likely an effect of students who were in the gamified group using
Courselink for their pre-tests instead of their assigned pre-tests, resulting in a small
selection bias.
9.2 9.2 9.1 9.29.29.6
9.1
9.5
8.79.1
8.89.2
0
1
2
3
4
5
6
7
8
9
10
Test 1 Test 2 Test 3 Test 4
Ave
rage
Qu
izro
om
Mar
k
Gamified
List-Style
Courselink

49
Figure 21: Number of Attempts in Quizroom, Gamified vs List-style vs Courselink
The final exam marks were looked at in five groups: full gamified, full list-style,
courselink, partial gamified and partial list-style. The full gamified and list-style groups
were students who used the GOPE platform for all four quizzes, while the partial groups
used the platform at least once but did not follow through for all four quizzes. Students
who were placed in the gamified or list-style but only did quizzes on courselink are not
counted in any of these groups. The marks for each of these groups can be seen in
Figure 22. While no significance is found between the full gamified and the full list-style
groups, or the full gamified and the partial gamified groups, there was significance found
in the difference between the full gamified and the courselink group.
1.81.6 1.6
1.61.7 1.6 1.7
1.4
1.9 1.81.9
1.5
0
0.5
1
1.5
2
2.5
Pre-test 1 Pre-test 2 Pre-test 3 Pre-test 4
Ave
rage
Nu
mb
er
of
Att
em
pts
in
Qu
izro
om Gamified
List-Style
Courselink

50
Figure 22: Final Exam Averages
Course Grades Discussion:
No significant change in marks was found between any of the groups, although
this result was not surprising. These pre-tests were introduced to ensure students
would not make attempts in the quizroom without having even glanced at the course
material, which would be a waste of time for both the students and the teaching
assistants that marked the tests. For this reason, the pre-tests were a necessary but
not sufficient criterion to write a test in most instances. The pre-tests used in this study
were unchanged, and hence maintained a lower level of difficulty compared to the tests.
Since the pre-tests were not designed to prepare students for the tests, the
material of the tests in the quizroom, as well as the final exam had a significantly higher
level of difficulty. This meant that regardless of how many times a student attempted a
pre-test or how well they understood the questions they would not be necessarily
adequately prepared to write the test or final exam. As such, the design of the study did
not promote higher grades, but rather served as a controlled experiment to test for
increased motivation.
0
5
10
15
20
Full Gamified Full List-Style CourselinkGroup
PartialGamified
Partial ListStyle
Ave
rage
Exa
m M
ark

51
Future Work and Limitations:
There were a few issues this study faced that if fixed may have provided even
stronger results. The first and most prevalent issue was that, since Courselink was the
Virtual Learning Environment for the course, there was no way to prevent students who
were assigned to the GOPE platform from also using Courselink. This meant a number
of students who were assigned to either the gamified or list-style groups on GOPE
ended up using Courselink instead. This lead to a few problems, one being that it
created a selection bias. It is probable that students who did not follow through with the
group they were assigned were less reliable overall than other students. This would
imply the GOPE platforms had a higher density of more reliable students, while those
who were assigned to the Courselink platform were a truly randomized assortment of
students. The gamified and list-style groups did not have significantly different grades
or number of attempts in the quiz room, suggesting that these two groups had a much
more similar student population compared to the courselink group. A priority for future
studies would be to prevent students from using platforms outside of their designation in
order to remove this selection bias.
Another improvement for future iterations of this study would be to increase the
difficulty of the pre-tests to ascertain whether the benefits of gamification are still
observed. Since the difficulty of the pre-tests were much lower than that of the actual
tests throughout the course, the pre-tests did not properly prepare students regardless
of the number of attempts. By increasing the difficulty it is hoped that the pre-test would
become a better predictor of performance on tests. However, it is possible that by
increasing the difficulty of the pre-tests, students would begin to feel more discouraged

52
by the quizzes, and the enjoyment found from the gamified elements would not be
enough to ensure future researchers will observe the same results as found in this
study. Additional gamified elements may be required to achieve the same level of
success.
Criticisms
Since the fall 2014 Gamification study assigned students to groups by class
section, rather than randomizing the students, a selection bias may have been
introduced. Students in the course did not know about this study before signing up for
the course. However, students were able to choose which time slot for the course they
preferred, which could be a source of selection bias. This could imply students in the
gamified section were more motivated than students in the list-style to begin with. In
addition, students using the GOPE platform had the opportunity to write the Courselink
pre-tests instead, adding a second possible element of selection bias. Having said that,
there is evidence to suggest the bias introduced for these reasons was negligible. The
grades as well as the number of quizroom attempts between the two GOPE groups
were consistently very close suggesting that the two groups contain a similar make up
of students.
Although there were several indicators found that showed an increase in student
motivation, the survey results for the question regarding motivation seem to contradict
this finding. However, in the question “I felt motivated to do well on the pre-test”, it does
not specify the cause of the motivation. All students are required to pass these pre-
tests, and hence are motivated to do well on the pre-tests to that extent. A future

53
survey should distinguish between being motivated to do well on the pre-test, and
feeling motivated to achieve perfect on the pre-test. While this was added to the
second survey for the 2015 Winter term, the N was much lower for that run.
Conclusions
This study compared students taking a gamified quiz to students taking more
traditional, list-style quizzes. All participating students were enrolled in a first-year
University Physics for Life Sciences course. The gamified quizzes made use of a
number of elements found in video games such as points, streaks, progress bars,
leaderboards and stars. The quizzes were compared on various measures of
motivation, on attitudinal surveys and grades.
Strong evidence was found to support the hypothesis that students taking gamified
quizzes have higher levels of motivation than students taking more traditional quizzes.
Students who used the gamified quizzes made a higher number of attempts beyond the
minimum requirements and were more likely to pursue perfect scores. Up to three stars
were rewarded to students in the gamified quizzes based on their score, with the third
star received when a student achieved a perfect score. When the third star was
withheld, students would continue making attempts after achieving a perfect score.
In addition to these findings, responses to attitudinal surveys demonstrated higher
levels of enjoyment and engagement from the pre-tests. Students also reported liking
the format of the gamified quiz at a higher rate than the list-style groups. Overall, there

54
is strong evidence to support the hypothesis that gamification results in higher levels of
motivation, and presents an overall more enjoyable experience to students.

55
References
[1] R. M. Bernard and P. C. Abrami, "How Does Distance Education Compare Instruction? A Meta-
Analysis of the Empirical Literature," Review of Educational Research , vol. 74, no. 3, pp. 379-439,
2004.
[2] I. E. Allen and J. Seaman, "Growing By Degrees: Online Education in the United States," Sloan-C,
Wellesley , 2005.
[3] National Survey of Student Engagement (NSSE), "Promoting Engagement for All Students: The
Imperative to Look Within," Bloomington: Indiana Center for Postsecondary Research, 2008.
[Online]. Available:
http://nsse.indiana.edu/NSSE_2008_Results/docs/withhold/NSSE2008_Results_revised_11-14-
2008.pdf. [Accessed 6 August 2015].
[4] F. S. o. S. E. (FSSE), "2008 Comparing NSSE and FSSE Results: Student and Faculty Expectations,"
Bloomington: Indiana Center for Postsecondary Research, 2008. [Online]. Available:
http://fsse.indiana.edu/html/sampleAnalyses.cfm. [Accessed 6 August 2015].
[5] P. L. W., "Understanding the Working College Student," American Association of University
Professors, August 2010. [Online]. Available: http://www.aaup.org/article/understanding-working-
college-student#.VcOhIvlVhHz. [Accessed 6 August 2015].
[6] G. M. Brosvic and M. L. Epstein, "The Role of Feedback During Academic Testing: The Delay
Rentention Effect Revisited," The Psychological Record, vol. 53, pp. 553-548, 2003.
[7] T. Sitzmann, "A Meta-Analytic Examination of the Instructional Effectiveness of Computer-Based
Simulation Games," Personnel Psychology, no. 64, pp. 469-528, 2011.
[8] F. Ke, Handbook of Research on Effective Electronic Gaming in Education, New Mexico: IGI Global,
2009.
[9] C. Wieman and K. Perkins, "Transforming Physics Education," Physics Today, vol. 58, no. 11, p. 36,
2005.
[10] T. Martín-Blas and A. Serrano-Fernández, "The role of new technologies in the learning process:
Moodle as a teaching tool in Physics," Computers and Education, vol. 52, pp. 35-44, 2009.
[11] PhET Interactive Simulations, University of Colorado, [Online]. Available:
https://phet.colorado.edu/en/simulations/category/physics. [Accessed 6 August 2015].
[12] E. Neumann, "Physics Simulations," April 2001. [Online]. Available: http://www.myphysicslab.com/.

56
[Accessed 6 August 2015].
[13] A. Duffy, "Physics Simulations," [Online]. Available: http://physics.bu.edu/~duffy/classroom.html.
[Accessed 6 August 2015].
[14] Z. A. C. Krusberg, "Emerging Technologies in Physics Education," Journal of Science Education and
Technologies , vol. 16, no. 5, pp. 401-411, 2007.
[15] S. Harter, "A New Self-Report Scale of Intrinsic Versus Extrinsic Orientation in the Classroom:
Motivational and Informational Components," Developmental Psychology, vol. 17, no. 3, pp. 300-
312, 1981.
[16] J. M. Harackiewicz, "The effects of Reward Contingency and Performance Feedback on Intrinsic
Motivation," Jornal of Personality and Social Psychology, vol. 37, no. 8, pp. 1352-1363, 1979.
[17] M. R. Lepper, "Motivational Considerations in the Study of Instruction," Cognition and Instruction,
vol. 5, no. 4, pp. 289-309, 1988.
[18] S. B. Nolen, "Reasons for Studying: Motivational Orientations and Study Strategies," Cognition and
Instruction, vol. 5, no. 4, pp. 269-287, 1988.
[19] M. R. Lepper, J. H. Corpus and S. S. Iyengar, "Intrinsic and Extrinsic Motivational Orientations in the
Classroom: Age Differences and Academic Correlates," Journal of Educational Psychology, vol. 97,
no. 2, pp. 184-196, 2005.
[20] R. Eisenberger and S. Armeli, "Can Salient Reward Increase Creative Performance Without Reducing
Intrinsic Creative Interest," Journal of Personality and Social Psychology, vol. 72, no. 3, pp. 652-663,
1997.
[21] R. Eisenberger, L. Rhoades and J. Cameron, "Does Pay for Performance Increase or Decrease
Perceived Self-Determination and Intrinsic Motivation?," Journal of Personality and Social
Psychology, vol. 77, no. 5, pp. 1026-1040, 1999.
[22] N. Schiffman and S. Greist-Bousquet, "The effect of task interuption and closure on perceived
duration," Bulletin of the Psychonomic Society, vol. 30, no. 1, pp. 9-11, 1992.
[23] C. A. Anderson and B. J. Bushman, "Effects of Violent Video Games On Aggressive Behaviour,
Aggressive Cognition, Aggressive Affect, Physiological Arousal, and Prosocial Behaviour: A Meta-
Analytic Review of Science Literature," Psychological Science, vol. 12, no. 5, pp. 353-359, 2001.
[24] B. D. Bartholow and C. A. Anderson, "Effects of Violent Video Games on Aggressive Behaviour:
Potential Sex Differences," Journal of Experimental Social Psychology, vol. 38, no. 3, pp. 283-290,
2002.

57
[25] S. L. Smith, K. Lachlan and R. Tamborini, "Popular Video Games: Quantifying the Presentation of
Violence and Its Context," Journal of Broadcasting and Electronic Media, vol. 47, no. 1, pp. 58-76,
2003.
[26] S. Fisher, "Identifying Video Game Addiction in Children and Adolescents," Addictive Behaviours,
vol. 19, no. 5, pp. 545-553, 1994.
[27] D. H. Han, J. W. Hwang and P. F. Renshaw, "Bupropian Sustained Release Treatment Decreases
Craving for Video Games and Cue-Induced Brain Activity in Patients With Internet Video Game
Addiction," American Psychological Association, vol. 18, no. 4, pp. 297-304, 2010.
[28] D. L. King, P. H. Delfabbro and M. D. Griffiths, "The Role of Structural Characteristics in Problematic
Video Game Play: An Empirical Study," International Journal of Mental Health and Addicition, vol. 9,
no. 3, pp. 320-333, 2011.
[29] A. Millar and D. J. Navarick, "Self-Control and Choice in Humans: Effects of Video Game Playing as a
Positive Reinforcer," Learning and Motivation, vol. 15, pp. 203-218, 1984.
[30] R. M. Ryan, C. S. Rigby and A. Przybylski, "The Motivational Pull of Video Games: A Self-
Determination Theory Approach," Motivation and Emotion, vol. 30, pp. 347-363, 2006.
[31] H. Tüzün, M. Yilmaz-Soylu, T. Karakuş, Y. İnal and G. Kizilkaya, "The effects of computer games on
primary school students' achievement and motivation in geography learning," Computers and
Education, vol. 52, pp. 68-77, 2009.
[32] "The GOPE," Boom Digital Media Group, [Online]. Available: TheGope.com.
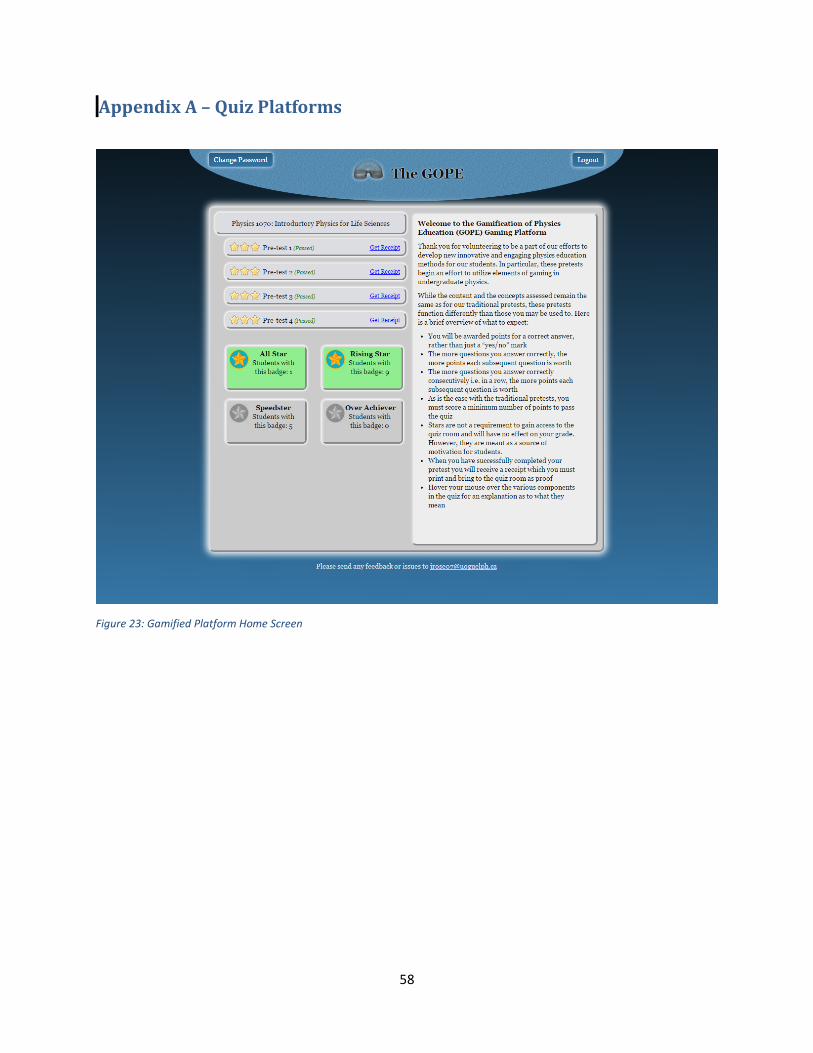
58
Appendix A – Quiz Platforms
Figure 23: Gamified Platform Home Screen

59
Figure 24: Gamified Platform Question

60
Figure 25: Gamified Platform Positive Instant Feedback

61
Figure 26: Gamified Platform, Showing Increase in Points and Visualisation of Progress Bar

62
Figure 27: Gamified Platform, Negative Feedback

63
Figure 28: Gamified Platform, Alternate Positive Feedback
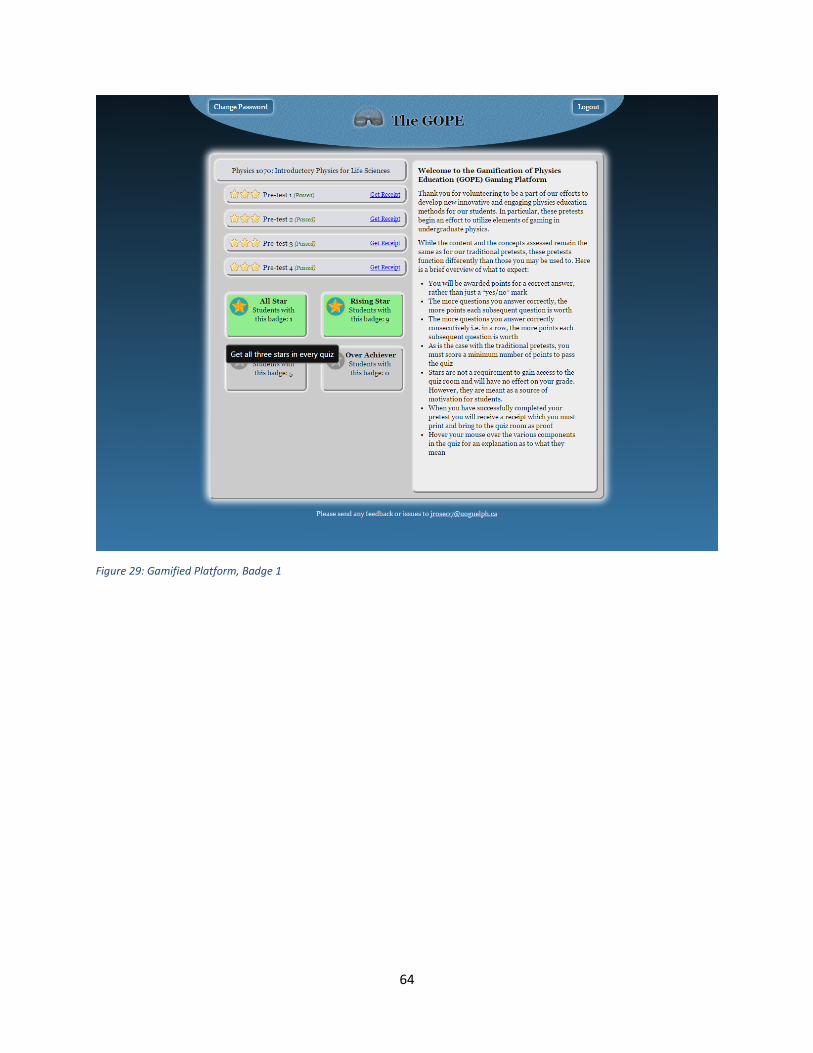
64
Figure 29: Gamified Platform, Badge 1

65
Figure 30: Gamified Platform, Badge 2

66
Figure 31:Gamified Platform, Badge 3

67
Figure 32: Gamified Platform, Badge 4

68
Figure 33:Llist-style Platform

69
Figure 34: Courselink Quiz Front Page

70
Figure 35: Courselink Quiz
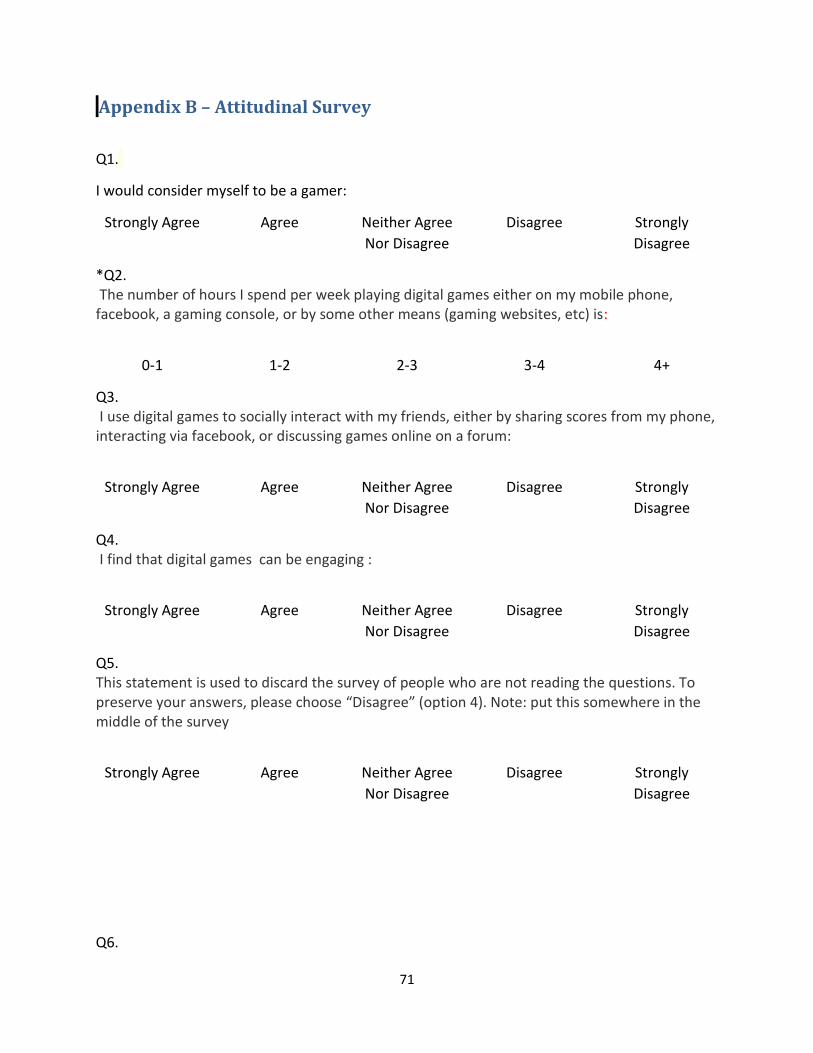
71
Appendix B – Attitudinal Survey
Q1.
I would consider myself to be a gamer:
Strongly Agree Agree Neither Agree
Nor Disagree
Disagree Strongly
Disagree
*Q2. The number of hours I spend per week playing digital games either on my mobile phone, facebook, a gaming console, or by some other means (gaming websites, etc) is:
0-1 1-2 2-3 3-4 4+
Q3. I use digital games to socially interact with my friends, either by sharing scores from my phone, interacting via facebook, or discussing games online on a forum:
Strongly Agree Agree Neither Agree
Nor Disagree
Disagree Strongly
Disagree
Q4. I find that digital games can be engaging :
Strongly Agree Agree Neither Agree
Nor Disagree
Disagree Strongly
Disagree
Q5. This statement is used to discard the survey of people who are not reading the questions. To preserve your answers, please choose “Disagree” (option 4). Note: put this somewhere in the middle of the survey
Strongly Agree Agree Neither Agree
Nor Disagree
Disagree Strongly
Disagree
Q6.

72
I find playing digital games relaxing: Strongly Agree Agree Neither Agree
Nor Disagree
Disagree Strongly
Disagree
Q7.
I am in the following lecture slot:
11:30 AM-12:20 PM,
Mondays, Wednesdays and
Fridays
2:30-3:20 PM, Mondays,
Wednesdays and Fridays
7:00PM-9:50 PM Thursdays
Q8. I wrote my pre-tests on:
courselink The Gope I did some quizzes on courselink
and some quizzes on The Gope
Q9. I found the questions on the pre-tests very challenging:
Strongly Agree Agree Neither Agree
Nor Disagree
Disagree Strongly
Disagree
Q10. I found the pre-tests to be engaging:
Strongly Agree Agree Neither Agree
Nor Disagree
Disagree Strongly
Disagree
Q11. I felt motivated to do well on the pre-test:
Strongly Agree Agree Neither Agree
Nor Disagree
Disagree Strongly
Disagree
Q13. I found working through the pre-test to be an enjoyable exercise:
Strongly Agree Agree Neither Agree
Nor Disagree
Disagree Strongly
Disagree
**Q14. I felt motivated to get a perfect mark on the pre-test

73
Strongly Agree Agree Neither Agree
Nor Disagree
Disagree Strongly
Disagree
Q15. I liked the format of way the pre-tests:
Strongly Agree Agree Neither Agree
Nor Disagree
Disagree Strongly
Disagree
Q16.
I would like to see elements of gaming used as a teaching tool in more of my classes :
Strongly Agree Agree Neither Agree
Nor Disagree
Disagree Strongly
Disagree
*The fall 2014 version of this question lacked the 0-1 option, but was added for the winter 2015 version
of the survey
** Was not present in the fall 2014 version of the survey


![[Solutions] Introduction to Plasma Physics and Controlled Fusion Plasma Physics](https://static.fdocuments.us/doc/165x107/55cf9d44550346d033ace210/solutions-introduction-to-plasma-physics-and-controlled-fusion-plasma-physics.jpg)