The G-Meter - Michigan State University€¦ · The G-Meter consists of a microcontroller (MCU), an...
41
1 | Page Team Members Karl Anderson Timothy Carroll Shuhan Chen Corey Fox Eric-John Kohler Dan Svoboda Team Facilitator Dr. Hayder Radha Electrical and Computer Engineering Professor Michigan State University Team Sponsor Greg Hoshal Instrumented Sensor Technology ________________________________________________ The G-Meter Michigan State University College of Engineering & Instrumented Sensor Technology Final Report April 24 th , 2013 ECE480 Design Team 4
Transcript of The G-Meter - Michigan State University€¦ · The G-Meter consists of a microcontroller (MCU), an...

1 | P a g e
Team Members
Karl Anderson
Timothy Carroll
Shuhan Chen
Corey Fox
Eric-John Kohler
Dan Svoboda
Team Facilitator
Dr. Hayder Radha
Electrical and Computer Engineering Professor
Michigan State University
Team Sponsor
Greg Hoshal
Instrumented Sensor Technology
________________________________________________
The G-Meter
Michigan State University
College of Engineering
&
Instrumented
Sensor Technology
Final Report April 24
th, 2013
ECE480 Design Team 4
2 | P a g e
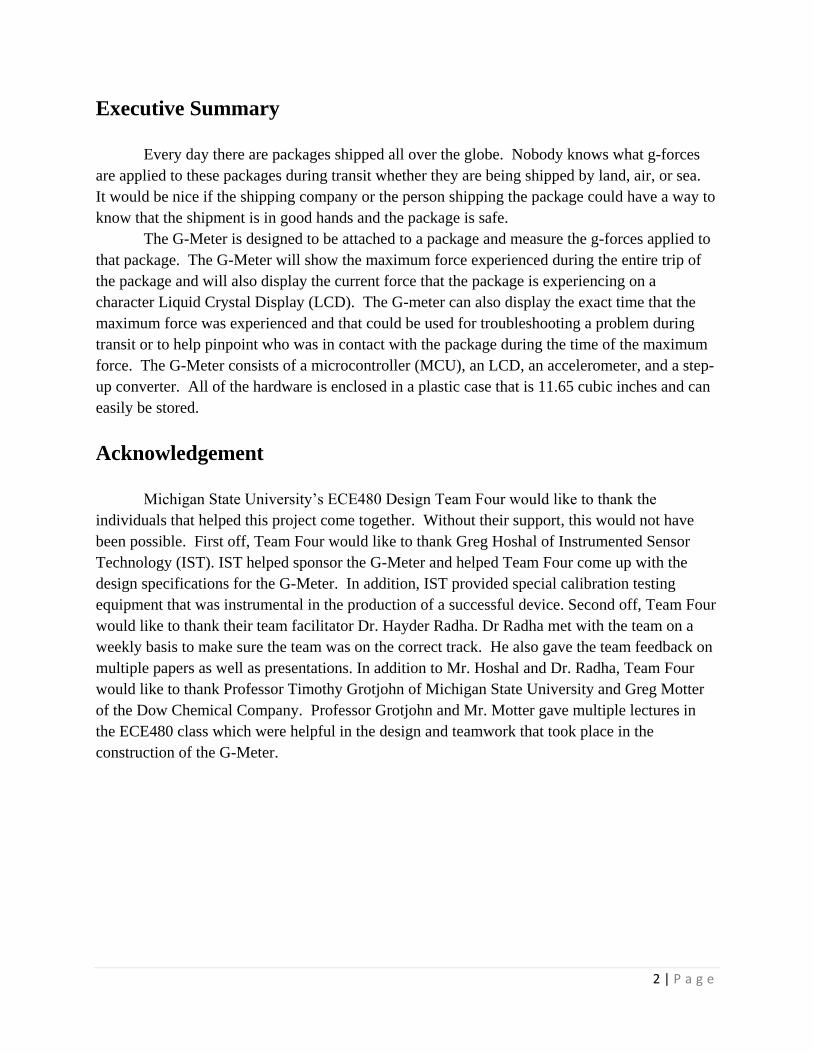
Executive Summary
Every day there are packages shipped all over the globe. Nobody knows what g-forces
are applied to these packages during transit whether they are being shipped by land, air, or sea.
It would be nice if the shipping company or the person shipping the package could have a way to
know that the shipment is in good hands and the package is safe.
The G-Meter is designed to be attached to a package and measure the g-forces applied to
that package. The G-Meter will show the maximum force experienced during the entire trip of
the package and will also display the current force that the package is experiencing on a
character Liquid Crystal Display (LCD). The G-meter can also display the exact time that the
maximum force was experienced and that could be used for troubleshooting a problem during
transit or to help pinpoint who was in contact with the package during the time of the maximum
force. The G-Meter consists of a microcontroller (MCU), an LCD, an accelerometer, and a step-
up converter. All of the hardware is enclosed in a plastic case that is 11.65 cubic inches and can
easily be stored.
Acknowledgement
Michigan State University’s ECE480 Design Team Four would like to thank the
individuals that helped this project come together. Without their support, this would not have
been possible. First off, Team Four would like to thank Greg Hoshal of Instrumented Sensor
Technology (IST). IST helped sponsor the G-Meter and helped Team Four come up with the
design specifications for the G-Meter. In addition, IST provided special calibration testing
equipment that was instrumental in the production of a successful device. Second off, Team Four
would like to thank their team facilitator Dr. Hayder Radha. Dr Radha met with the team on a
weekly basis to make sure the team was on the correct track. He also gave the team feedback on
multiple papers as well as presentations. In addition to Mr. Hoshal and Dr. Radha, Team Four
would like to thank Professor Timothy Grotjohn of Michigan State University and Greg Motter
of the Dow Chemical Company. Professor Grotjohn and Mr. Motter gave multiple lectures in
the ECE480 class which were helpful in the design and teamwork that took place in the
construction of the G-Meter.
3 | P a g e
Table of Contents
Executive Summary ...................................................................................................................... 2
Acknowledgement ........................................................................................................................ 2
Chapter 1: Overview ..................................................................................................................... 5
1.1 | Introduction ............................................................................................................... 5
1.2 | Background ............................................................................................................... 5
Chapter 2: Concept to Solution ..................................................................................................... 6
2.1 | FAST Diagram .......................................................................................................... 6
2.2 | House of Quality ....................................................................................................... 7
2.3 | Conceptual Designs ................................................................................................... 9
2.3.1 | Accelerometer ............................................................................................ 9
2.3.2 | LCD ............................................................................................................ 9
2.3.3 | MCU ........................................................................................................... 9
2.3.4 | Status LEDs ................................................................................................ 9
2.3.5 | Real Time Clock (RTC) .......................................................................... 10
2.3.6 | Voltage Regulator .................................................................................... 10
2.4 | Ranking of Conceptual Designs .............................................................................. 10
2.5 | Proposed Design Solution ....................................................................................... 11
2.6 | Budget ..................................................................................................................... 11
2.7 | Project Schedule: Gantt Chart ................................................................................ 12
Chapter 3: Work Performed ....................................................................................................... 13
3.1 | Hardware ................................................................................................................. 13
3.2 | Hardware Design and Implementation.................................................................... 14
3.2.1 | LT1073-5 ................................................................................................. 14
3.2.1.1 | Design ....................................................................................... 14
3.2.1.2 | Implementation ......................................................................... 14
3.2.2 | Bandwidth Filters ..................................................................................... 16
3.2.2.1 | Design ....................................................................................... 16
3.2.2.2 | Implementation ......................................................................... 17
3.3 | Software .................................................................................................................. 18
3.4 | Software Implementation ........................................................................................ 18
3.4.1 | Accelerometer .......................................................................................... 18
3.4.2 | Liquid Crystal Display (LCD) ................................................................. 19
3.4.2.1 | Software Setup .......................................................................... 21
3.4.2.2 | Entering 4 Bit Mode .................................................................. 21
3.4.2.3 | Other Important Initialization ................................................... 21
3.4.2.4 | Sending Strings to be Displayed ............................................... 21
3.4.2.5 | Building in Appropriate Delays ................................................ 22
3.4.3 | Clock System ........................................................................................... 22
4 | P a g e
Chapter 4: Design Evaluation ..................................................................................................... 23
4.1 | Battery Life Evaluation ........................................................................................... 23
4.2 | G-Meter Accuracy ................................................................................................... 24
4.3 | Filter Accuracy ........................................................................................................ 25
4.4 | Software Evaluation ................................................................................................ 27
Chapter 5: Conclusion................................................................................................................. 28
5.1 | Conclusion .............................................................................................................. 28
5.2 | Design Enhancement ............................................................................................... 28
5.2.1 | Design Enhancement Utilized .................................................................. 28
5.2.2 | Additional Enhancements ....................................................................... 29
Appendix 1: Team Responsibilities ............................................................................................ 30
Appendix 2: References .............................................................................................................. 35
Appendix 3: Detailed Technical Attachments ............................................................................ 36
5 | P a g e
Chapter 1: Overview
1.1: Introduction
Often times, when shipping items worldwide, shipping containers can get bumped and
thrown around carelessly. This can sometimes lead to damaged products. To monitor the
movement of these shipping containers, the G-Meter was designed. The overall goal of the G-
Meter is to sense a g-force and then output that g-force reading to a LCD. The G-Meter was
designed to monitor the linear acceleration of the device in the horizontal axis. Once the G-Meter
experiences a g-force, the G-Meter will then display the value of the g-force on its LCD.
The G-Meter will work in two separate modes. The first is a “Real Time” mode which
will update the LCD every five seconds with the maximum g-force value that is experienced
over that five second interval. Within this mode, the G-Meter will also calculate and display the
Root Mean Square (RMS) value over the same five second interval. In addition, the G-Meter will
have a “freeze” button which will allow the user to hold the current g-force reading on the LCD.
The second mode is the “Peak/Hold” mode. In this mode, the G-Meter will store the maximum
value that is experienced over the time duration that the G-Meter is active. Similar to the “Real
Time” mode, the RMS value will also be displayed on the LCD. In addition, the G-Meter will
store the exact date and time when the maximum g-force value was recorded. Included in the
“Peak/Hold” mode is a reset button which will allow the user to reset the current maximum g-
force reading. By using the G-Meter, users will know exactly how many g-forces their shipping
container experienced while their container was being transported.
1.2: Background
There were multiple initial ideas for the components that would be used to construct the
G-Meter. The heart of the G-Meter is the accelerometer, since that is the component that is
sensing the g-forces. Accelerometers are designed in two forms, analog and digital. Typical
accelerometers are designed to work in three-axes, but since the G-Meter is to work in a single-
axis, a three-axis accelerometer would be unnecessary. After doing much research, the team
opted to purchase both an analog and digital accelerometer. Due to excessive factory lead time,
the digital accelerometer would not be able to arrive before the project needed to be completed.
This resulted in the analog accelerometer being used to construct the G-Meter.
To fit the necessary specifications for all of the components used in the G-Meter, a step-
up converter would need to be used. A step-up converter would allow the initial three volts of the
two AA batteries to be stepped up to five volts. This was necessary is powering the analog
accelerometer as well as the LCD. By using a step-up converter each component in the G-Meter
could have a supply of three volts (pre-step-up converter) or five volts (post-step-up converter).
Based on the availability of products on the market that applied to the G-Meter, the use of
a step-up converter was a logical solution.
6 | P a g e
The final design concepts for the G-Meter were designed to fit in an encasement that is
approximately 12 cubic inches. This would allow for the G-Meter to be a sleek device that could
be attached to shipping containers which would then sense the g-forces experienced by the G-
Meter, as well as the shipping container.
Chapter 2: Concept to Solution
2.1: FAST Diagram
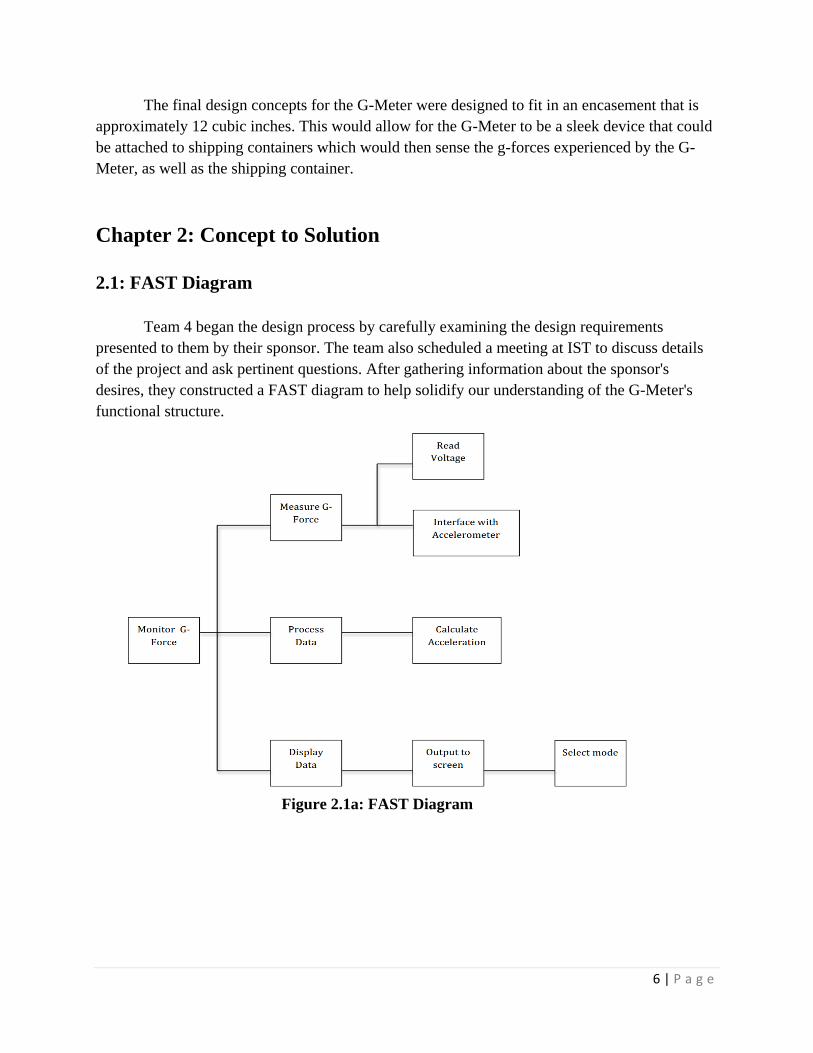
Team 4 began the design process by carefully examining the design requirements
presented to them by their sponsor. The team also scheduled a meeting at IST to discuss details
of the project and ask pertinent questions. After gathering information about the sponsor's
desires, they constructed a FAST diagram to help solidify our understanding of the G-Meter's
functional structure.
Figure 2.1a: FAST Diagram
7 | P a g e
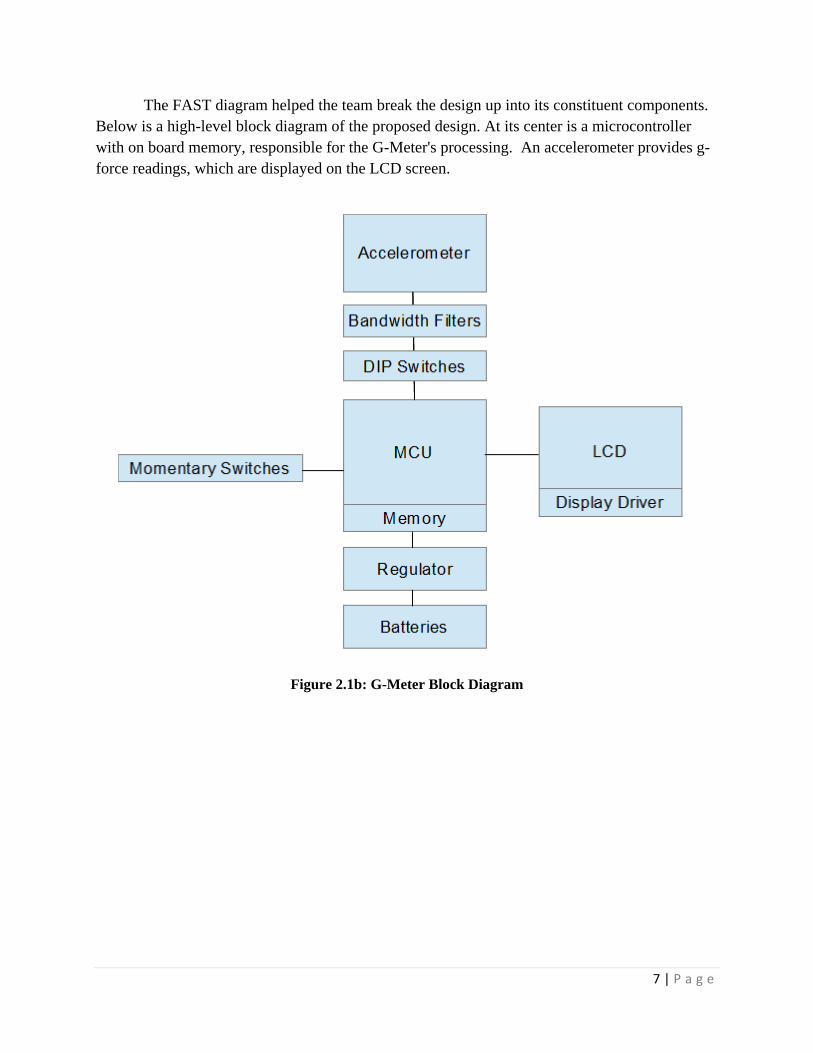
The FAST diagram helped the team break the design up into its constituent components.
Below is a high-level block diagram of the proposed design. At its center is a microcontroller
with on board memory, responsible for the G-Meter's processing. An accelerometer provides g-
force readings, which are displayed on the LCD screen.
Figure 2.1b: G-Meter Block Diagram
8 | P a g e
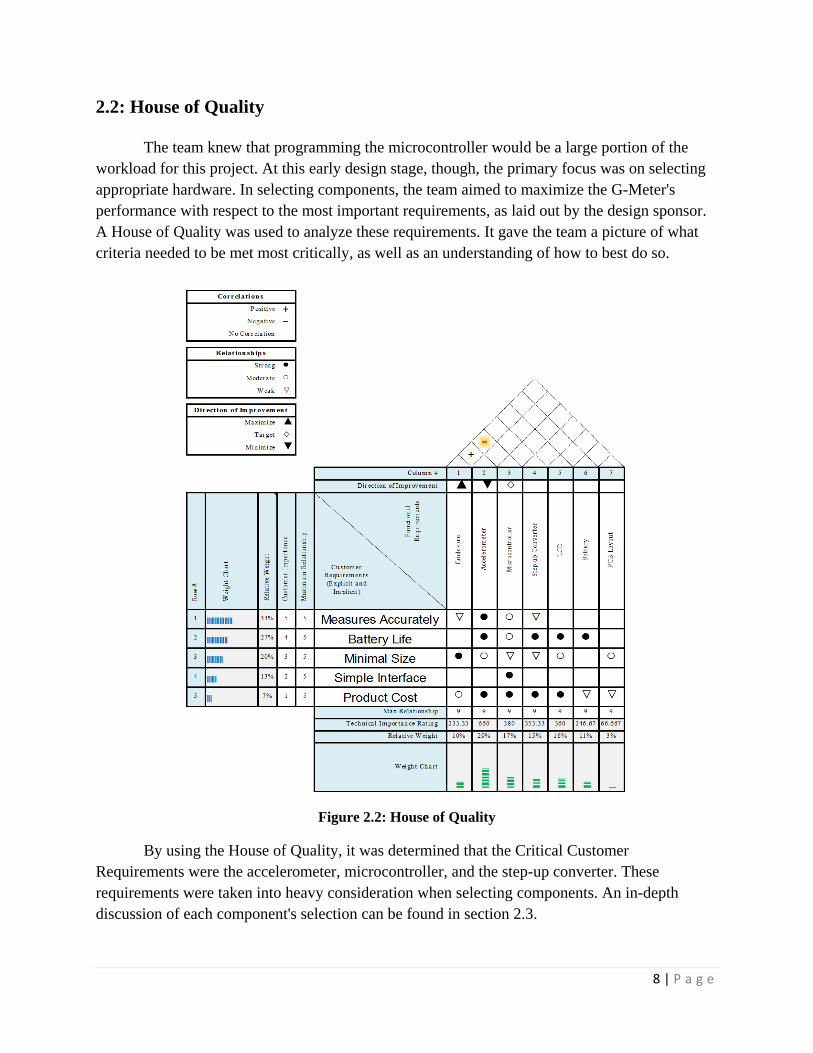
2.2: House of Quality
The team knew that programming the microcontroller would be a large portion of the
workload for this project. At this early design stage, though, the primary focus was on selecting
appropriate hardware. In selecting components, the team aimed to maximize the G-Meter's
performance with respect to the most important requirements, as laid out by the design sponsor.
A House of Quality was used to analyze these requirements. It gave the team a picture of what
criteria needed to be met most critically, as well as an understanding of how to best do so.
Figure 2.2: House of Quality
By using the House of Quality, it was determined that the Critical Customer
Requirements were the accelerometer, microcontroller, and the step-up converter. These
requirements were taken into heavy consideration when selecting components. An in-depth
discussion of each component's selection can be found in section 2.3.
9 | P a g e
2.3: Conceptual Designs
2.3.1: Accelerometer
Digital vs. Analog output
Analog communication between the accelerometer and MCU requires use of an
Analog to Digital Converter (ADC), either within the MCU or on an external IC. The
resolution of the acceleration readings will be limited by the number of digits the ADC
can produce.
Digital communication does not require an ADC equipped MCU. It may,
however, require additional code running on the MCU to interpret the signals coming
from the accelerometer (ex. I2C).
Single-axis vs. Triple-axis
While the specifications only call for one axis of measurement, it may be
advantageous to use a triple-axis model and disregard the two unneeded axes. Although
single-axis models are hypothetically cheaper, they tend to only be available in
restrictively large quantities. Using a triple-axis model will allow more choices on other
important specifications like sensitivity, voltage level, and sampling frequency.
2.3.2: LCD
Size: 16x2, 8x2, etc.
Multi-character LCD displays are available in a variety of sizes. A larger model
will allow display of all necessary information at the same time. A smaller model may
require scrolling to do so, but will also allow the end product to be more compact.
Display Voltage: 3.3V vs. 5V
While 3.3V models are available, they are more expensive. This will weigh into our final
selection.
2.3.3: MCU
Several microcontrollers will be considered for the final design. Important
specifications include voltage (preferably 3V), amount of memory available for Peak
Hold mode, and cost.
2.3.4: Status Light Emitting Diodes (LED)
The potential design may either include or omit the status LED’s. According to
the sponsor, instead of indicating power and mode with LED’s, this information can
instead by indicated on the LCD. This will consume valuable screen real estate,
especially if a smaller LCD is selected.
10 | P a g e
2.3.5: Real Time Clock (RTC)
A real time clock IC running on a small watch battery would keep time for the
device, even when the batteries are turned off. The design requirements do not specify
whether time needs to be maintained when the device is off, so this feature may be
omitted to reduce cost in the final design. Additionally, all potential MCUs have
timekeeping functionality when turned on.
2.3.6: Voltage Regulator
3.3V vs. 5V – Depends on voltage requirements of other components. It may not
be necessary at all if MCU has appropriate on board voltage regulation.
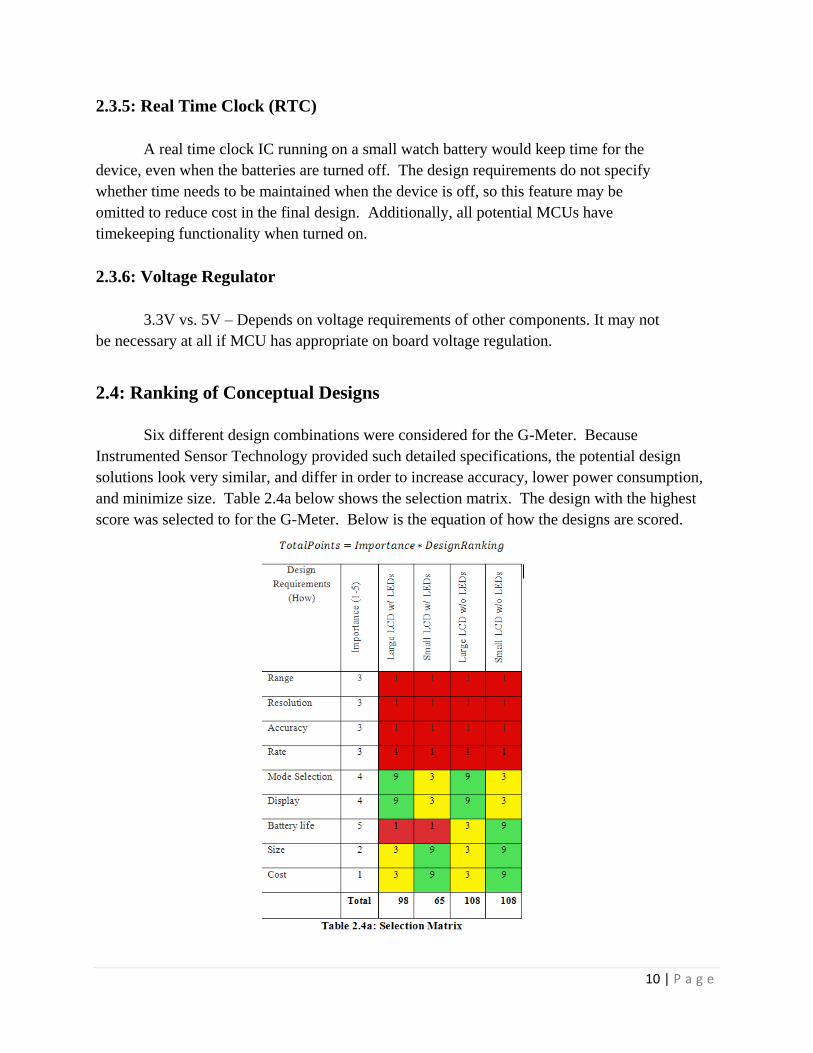
2.4: Ranking of Conceptual Designs
Six different design combinations were considered for the G-Meter. Because
Instrumented Sensor Technology provided such detailed specifications, the potential design
solutions look very similar, and differ in order to increase accuracy, lower power consumption,
and minimize size. Table 2.4a below shows the selection matrix. The design with the highest
score was selected to for the G-Meter. Below is the equation of how the designs are scored.
11 | P a g e
2.5: Proposed Design Solution
The proposed design consisted of the most feasible solution for each of the above
components. The microcontroller selected was the Texas Instrument (TI) MSP430G2553.
It’s10-bit ADC provided more than enough resolution when used with the selected accelerometer,
a Freescale MMA Analog. We opted for the smaller 8x2 LCD to allow the device to fit into a
smaller case.
In hindsight, a digital accelerometer may have been a better choice, since it provides a
simpler way of acquiring data. We originally picked an analog model because the datasheet said
it consumed less power, but the ADC had to be turned on in the MCU, which used additional
power. A digital accelerometer would have likely reduced power and been easier to use, but as
stated earlier, an applicable digital accelerometer was not available.
The design was first implemented using a TI MSP430 Launchpad
(microcontroller development board) and solder-less protoboard. Power came from a
power supply during early stages, in order to save on battery cost. With a concrete
understanding of the interface between the different hardware components, our group
was able to develop different hardware modules separately on three protoboards. One
contained the accelerometer and LCD screen, one contained the bandwidth filters, and
one contained the power converter. The boards were successfully wired together to
create a working prototype.
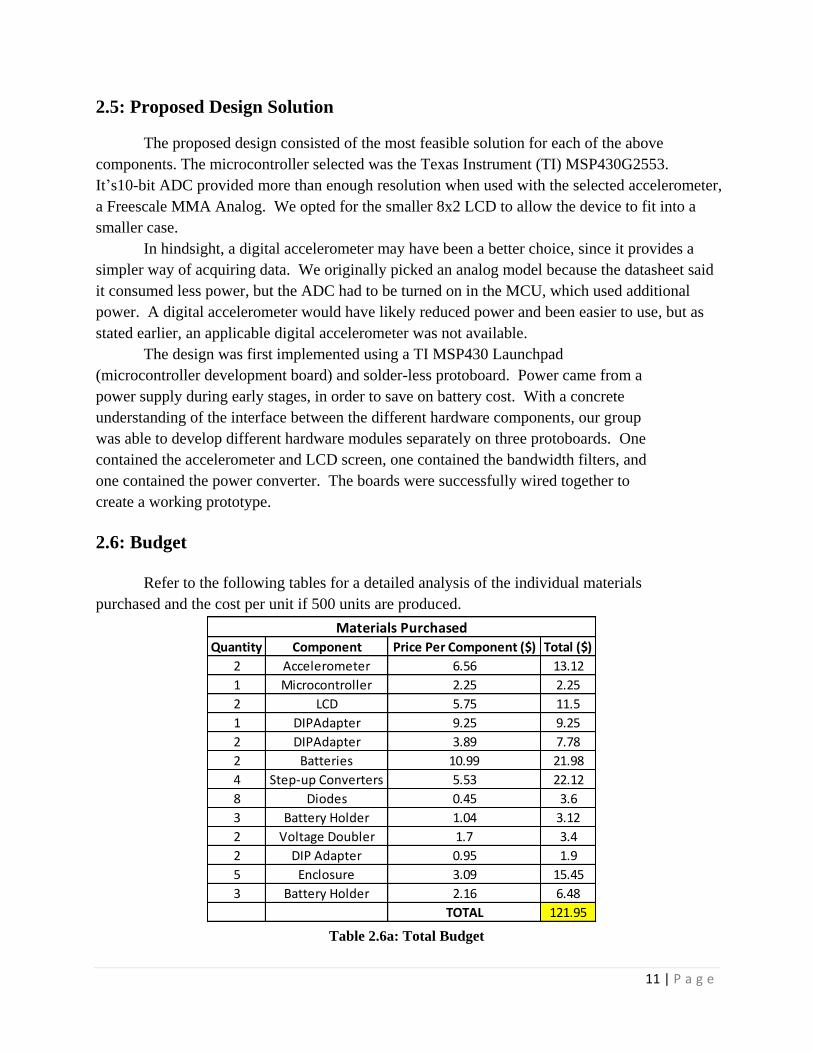
2.6: Budget
Refer to the following tables for a detailed analysis of the individual materials
purchased and the cost per unit if 500 units are produced.
Table 2.6a: Total Budget
Quantity Component Price Per Component ($) Total ($)
2 Accelerometer 6.56 13.12
1 Microcontroller 2.25 2.25
2 LCD 5.75 11.5
1 DIPAdapter 9.25 9.25
2 DIPAdapter 3.89 7.78
2 Batteries 10.99 21.98
4 Step-up Converters 5.53 22.12
8 Diodes 0.45 3.6
3 Battery Holder 1.04 3.12
2 Voltage Doubler 1.7 3.4
2 DIP Adapter 0.95 1.9
5 Enclosure 3.09 15.45
3 Battery Holder 2.16 6.48
TOTAL 121.95
Materials Purchased
12 | P a g e
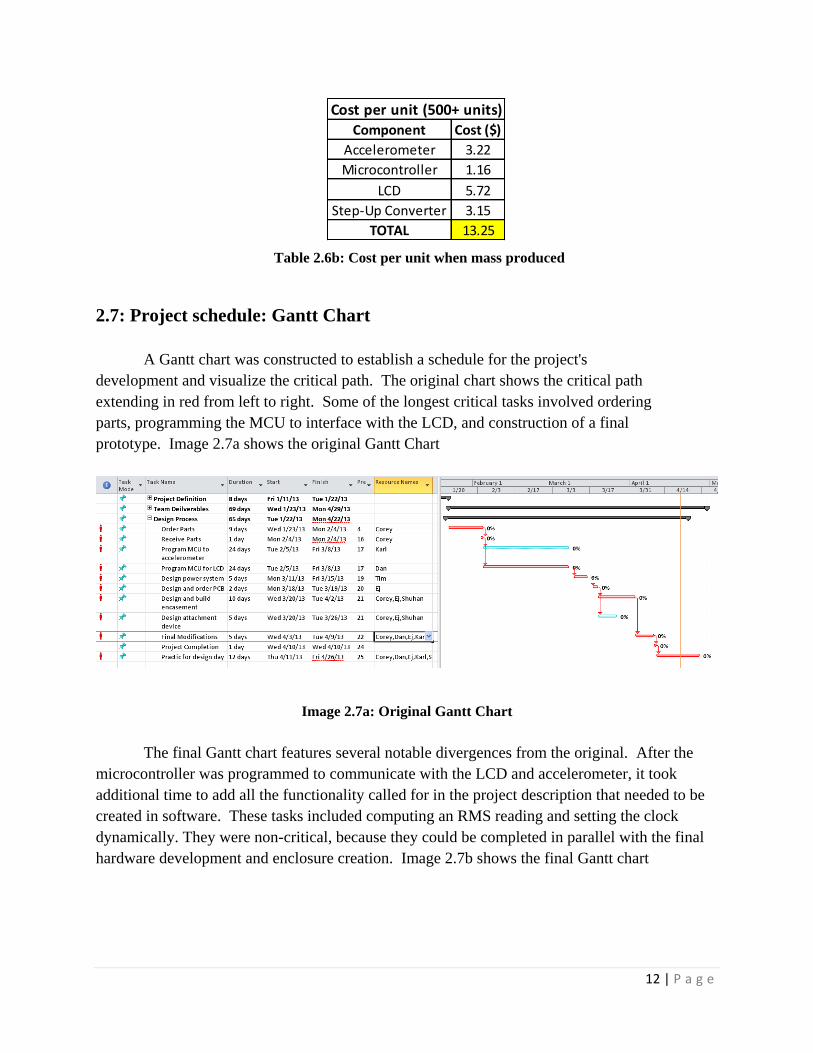
2.7: Project schedule: Gantt Chart
A Gantt chart was constructed to establish a schedule for the project's
development and visualize the critical path. The original chart shows the critical path
extending in red from left to right. Some of the longest critical tasks involved ordering
parts, programming the MCU to interface with the LCD, and construction of a final
prototype. Image 2.7a shows the original Gantt Chart
Image 2.7a: Original Gantt Chart
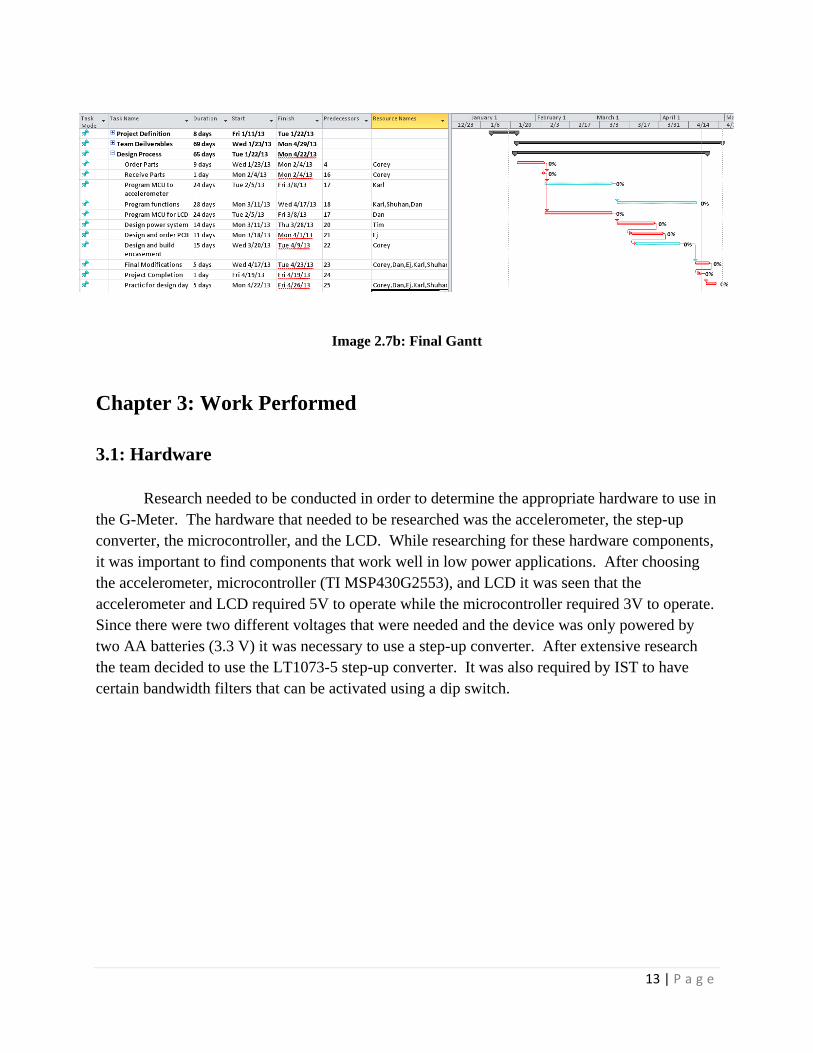
The final Gantt chart features several notable divergences from the original. After the
microcontroller was programmed to communicate with the LCD and accelerometer, it took
additional time to add all the functionality called for in the project description that needed to be
created in software. These tasks included computing an RMS reading and setting the clock
dynamically. They were non-critical, because they could be completed in parallel with the final
hardware development and enclosure creation. Image 2.7b shows the final Gantt chart
Table 2.6b: Cost per unit when mass produced
Component Cost ($)
Accelerometer 3.22
Microcontroller 1.16
LCD 5.72
Step-Up Converter 3.15
TOTAL 13.25
Cost per unit (500+ units)
13 | P a g e
Image 2.7b: Final Gantt
Chapter 3: Work Performed
3.1: Hardware
Research needed to be conducted in order to determine the appropriate hardware to use in
the G-Meter. The hardware that needed to be researched was the accelerometer, the step-up
converter, the microcontroller, and the LCD. While researching for these hardware components,
it was important to find components that work well in low power applications. After choosing
the accelerometer, microcontroller (TI MSP430G2553), and LCD it was seen that the
accelerometer and LCD required 5V to operate while the microcontroller required 3V to operate.
Since there were two different voltages that were needed and the device was only powered by
two AA batteries (3.3 V) it was necessary to use a step-up converter. After extensive research
the team decided to use the LT1073-5 step-up converter. It was also required by IST to have
certain bandwidth filters that can be activated using a dip switch.
14 | P a g e
3.2: Hardware Design and Implementation
Construction of the G-Meter consisted of assembling the LT1073-5 step-up converter and
building the required bandwidth filters.
3.2.1: LT1073-5
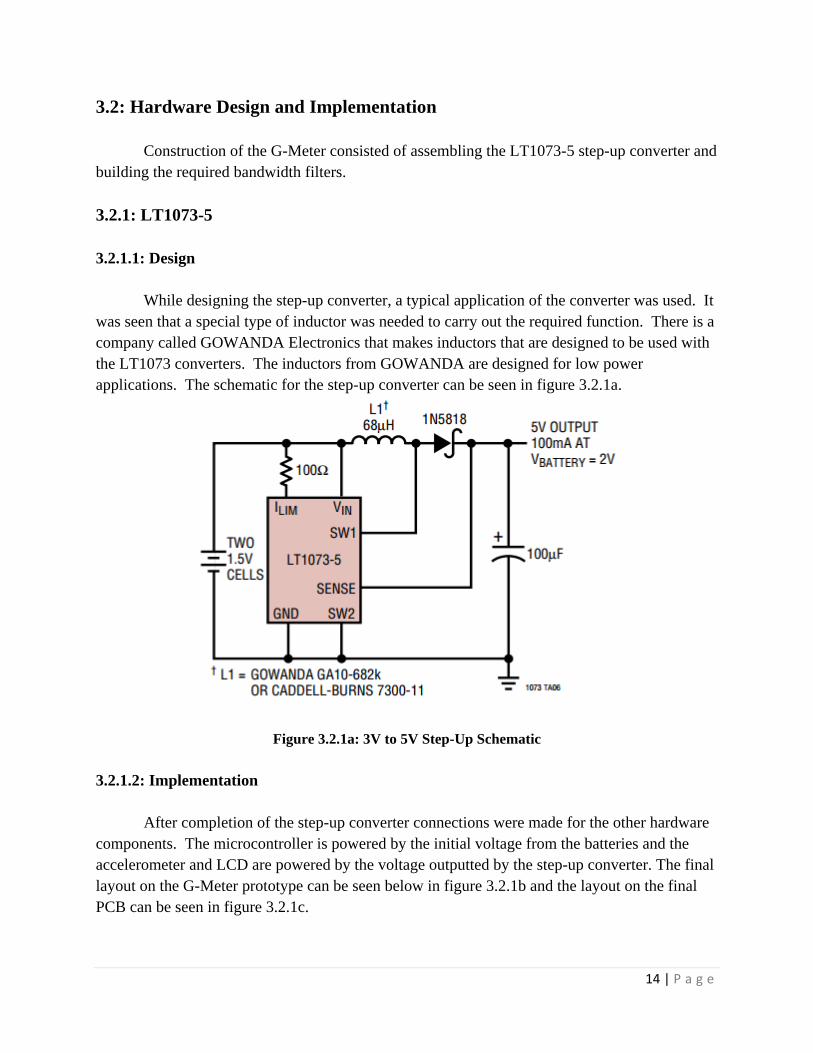
3.2.1.1: Design
While designing the step-up converter, a typical application of the converter was used. It
was seen that a special type of inductor was needed to carry out the required function. There is a
company called GOWANDA Electronics that makes inductors that are designed to be used with
the LT1073 converters. The inductors from GOWANDA are designed for low power
applications. The schematic for the step-up converter can be seen in figure 3.2.1a.
Figure 3.2.1a: 3V to 5V Step-Up Schematic
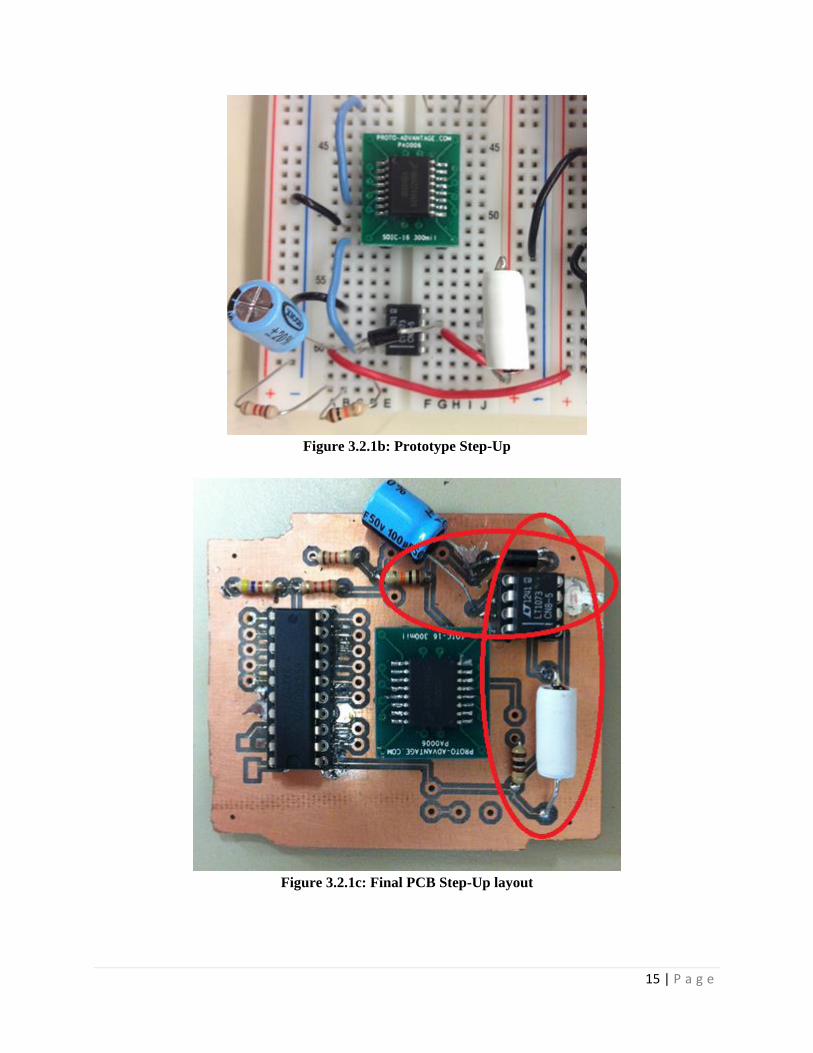
3.2.1.2: Implementation
After completion of the step-up converter connections were made for the other hardware
components. The microcontroller is powered by the initial voltage from the batteries and the
accelerometer and LCD are powered by the voltage outputted by the step-up converter. The final
layout on the G-Meter prototype can be seen below in figure 3.2.1b and the layout on the final
PCB can be seen in figure 3.2.1c.
15 | P a g e
Figure 3.2.1b: Prototype Step-Up
Figure 3.2.1c: Final PCB Step-Up layout
16 | P a g e
3.2.2: Bandwidth Filters
3.2.2.1: Design
Instrumented Sensor Technologies specified that the G-Meter include a DIP switch
selectable bandwidth filter that would filter out certain frequencies from the accelerometer. The
desired bandwidths are 15 Hz, 30 Hz, 50 Hz, 100 Hz, 200 Hz, and 500 Hz. Designing this aspect
of the G-Meter was relatively trivial. To save space and cost, one capacitor was chosen to
receive signal from each of the six resistors. A 1 μF capacitor was chosen because it was readily
available, and it is an easy number to work with. With the cutoff frequency and the capacitor
chosen, a resistor value was easily calculated by using equation 3.2.2 below for a low pass filter.
Equation 3.2.2:
Table 3.2.2 below shows the resistors used for each bandwidth and their corresponding
switch on the DIP switch, as well as the other switches on the DIP switch. There are eight
switches on the DIP switch. Six of them are used for the filters, and two are used for on off
switches for the whole G-Meter, and for the screen. This is useful because the G-Meter will be
able to conserve battery power when the screen is off. It is recommended that the screen be shut
off using the DIP switch whenever the user is not looking at it.
Function Bandwidth Dip switch Resistance
Screen Voltage 8
Filter 500 Hz 7 270 Ω
Filter 200 Hz 6 820 Ω
Filter 100 Hz 5 1.5 KΩ
Filter 50 Hz 4 3.3 KΩ
Filter 30 Hz 3 5.5 KΩ
Filter 15 Hz 2 10 KΩ
G-Meter Voltage 1
Table 3.2.2: DIP Switch Functions
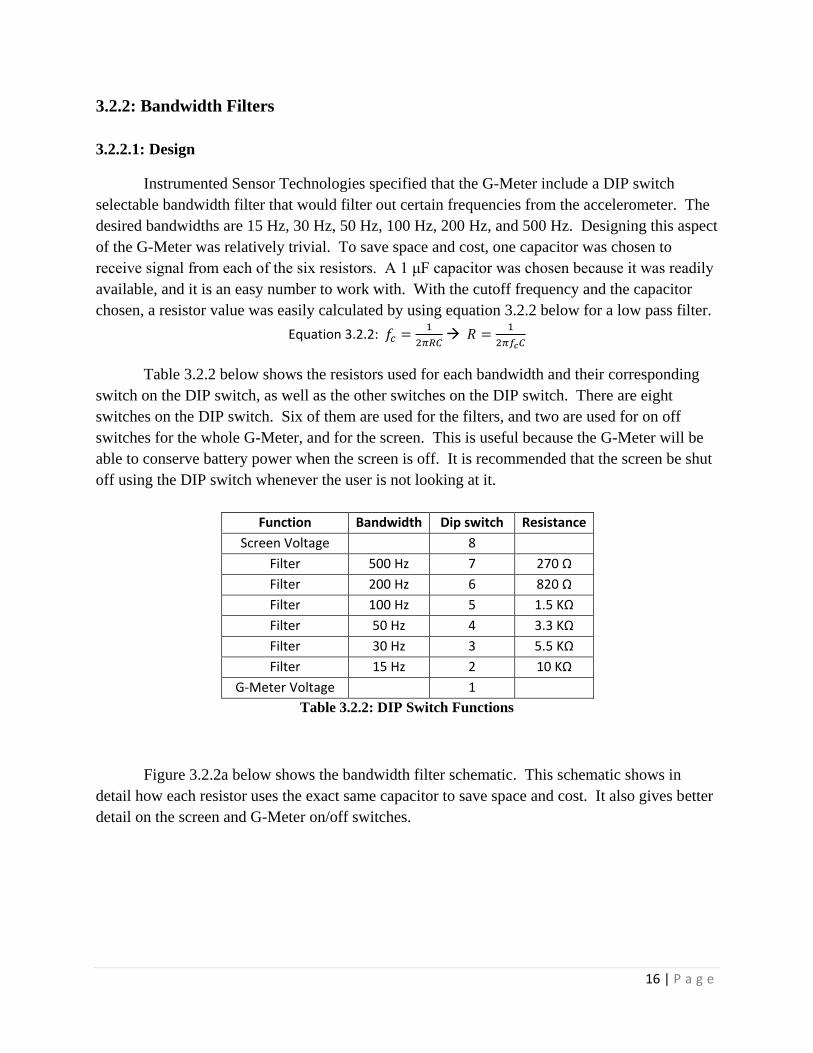
Figure 3.2.2a below shows the bandwidth filter schematic. This schematic shows in
detail how each resistor uses the exact same capacitor to save space and cost. It also gives better
detail on the screen and G-Meter on/off switches.
17 | P a g e
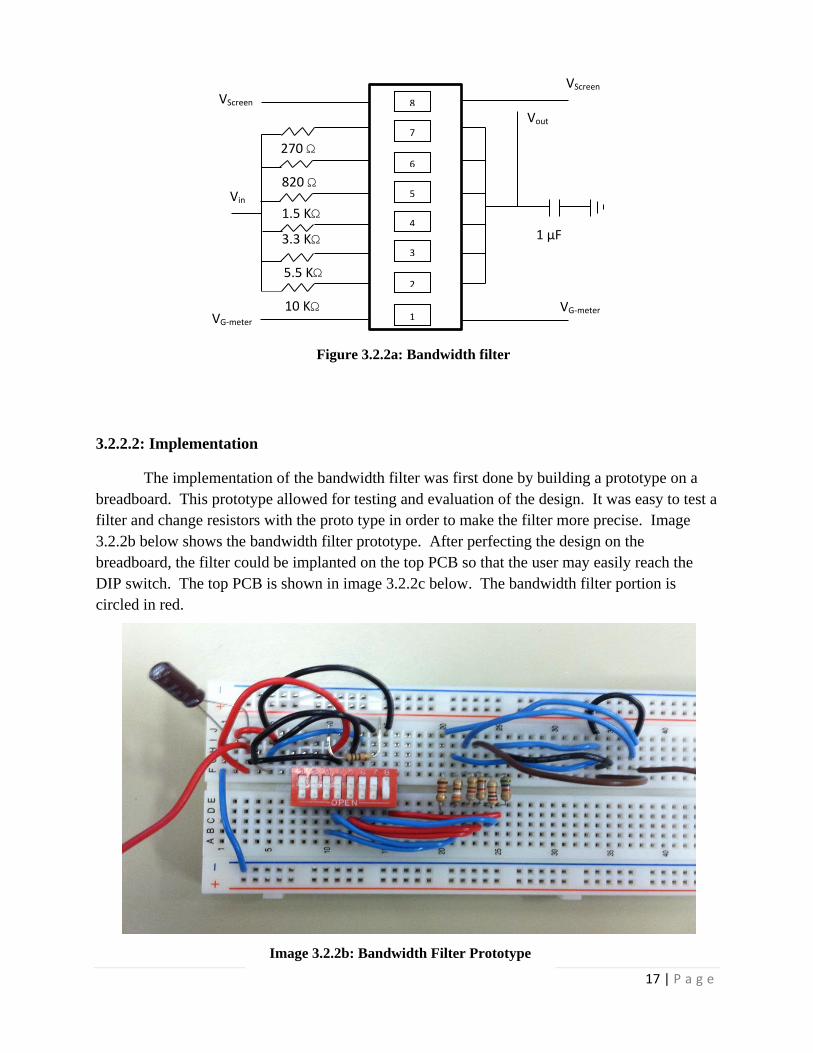
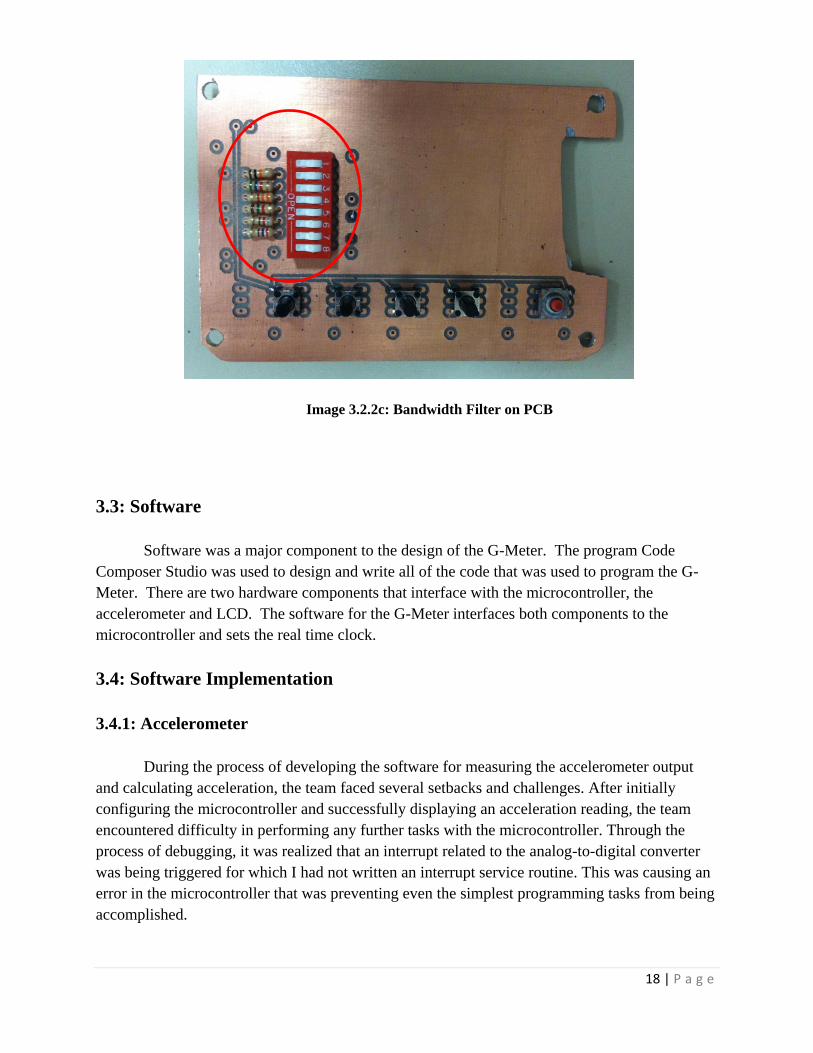
3.2.2.2: Implementation
The implementation of the bandwidth filter was first done by building a prototype on a
breadboard. This prototype allowed for testing and evaluation of the design. It was easy to test a
filter and change resistors with the proto type in order to make the filter more precise. Image
3.2.2b below shows the bandwidth filter prototype. After perfecting the design on the
breadboard, the filter could be implanted on the top PCB so that the user may easily reach the
DIP switch. The top PCB is shown in image 3.2.2c below. The bandwidth filter portion is
circled in red.
Vin
5.5 KΩ
10 KΩ
3.3 KΩ
1.5 KΩ
820 Ω
270 Ω
Vout
1 μF
Figure 3.2.2a: Bandwidth filter
VG-meter
VScreen
VG-meter
VScreen
8
7
6
5
4
3
2
1
Image 3.2.2b: Bandwidth Filter Prototype
18 | P a g e
3.3: Software
Software was a major component to the design of the G-Meter. The program Code
Composer Studio was used to design and write all of the code that was used to program the G-
Meter. There are two hardware components that interface with the microcontroller, the
accelerometer and LCD. The software for the G-Meter interfaces both components to the
microcontroller and sets the real time clock.
3.4: Software Implementation
3.4.1: Accelerometer
During the process of developing the software for measuring the accelerometer output
and calculating acceleration, the team faced several setbacks and challenges. After initially
configuring the microcontroller and successfully displaying an acceleration reading, the team
encountered difficulty in performing any further tasks with the microcontroller. Through the
process of debugging, it was realized that an interrupt related to the analog-to-digital converter
was being triggered for which I had not written an interrupt service routine. This was causing an
error in the microcontroller that was preventing even the simplest programming tasks from being
accomplished.
Image 3.2.2c: Bandwidth Filter on PCB
19 | P a g e
After discovering and correcting this problem, the team began the task of writing the
code necessary to store peak acceleration values. It was quickly discovered that large spikes of
noise in the accelerometer output were being stored as peak acceleration values even when the
G-Meter had not experienced any acceleration. The solution was to average several successive
samples together to minimize the effect of single spikes of noise. The team had to balance the
need for averaging with the need to measure the accelerometer output at an adequate rate. The
team chose a number of samples to average 40 samples taken at a rate of 32.768 kHz. This
provided averages at a rate of 819.2 Hz. This rate was determined to be adequate for measuring
acceleration events and provided more reasonable peak acceleration values.
Another challenge in developing the G-Meter software involved the type of variables and
math operations that the MSP430 microcontroller was capable of. The acceleration was initially
calculated and stored as a floating point decimal variable. It was soon discovered that these types
of variables and the math operations necessary to use them in computations required a significant
portion of the memory of the microcontroller and were relatively slow and inefficient. Also,
some operations such as multiplication and taking square roots, used to compute RMS
acceleration, were unreliable and caused errors or glitches in the program. As a result, all
variables were converted to integers. The acceleration values were multiplied by 1000 during
calculation to preserve the significant digits of the value. This greatly reduced the size of the
program and allowed the RMS calculations to be performed reliably.
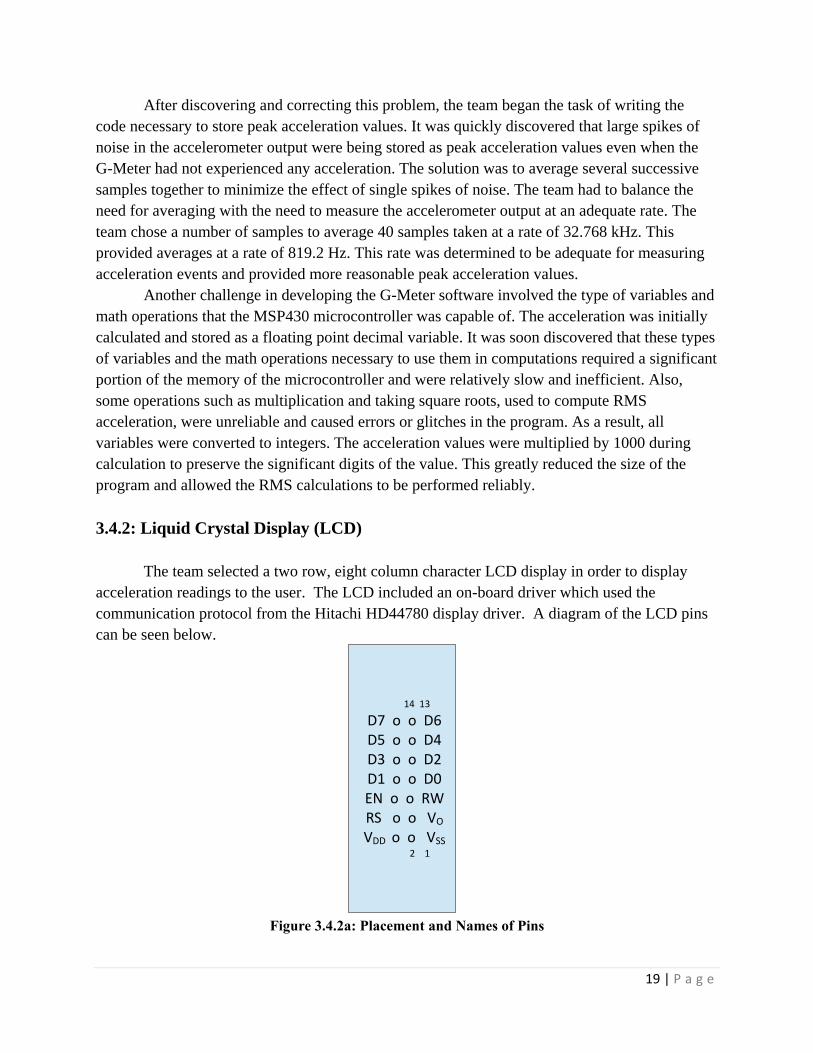
3.4.2: Liquid Crystal Display (LCD)
The team selected a two row, eight column character LCD display in order to display
acceleration readings to the user. The LCD included an on-board driver which used the
communication protocol from the Hitachi HD44780 display driver. A diagram of the LCD pins
can be seen below.
Figure 3.4.2a: Placement and Names of Pins
14 13
D7 o o D6 D5 o o D4 D3 o o D2 D1 o o D0 EN o o RW RS o o VO
VDD o o VSS
2 1
20 | P a g e
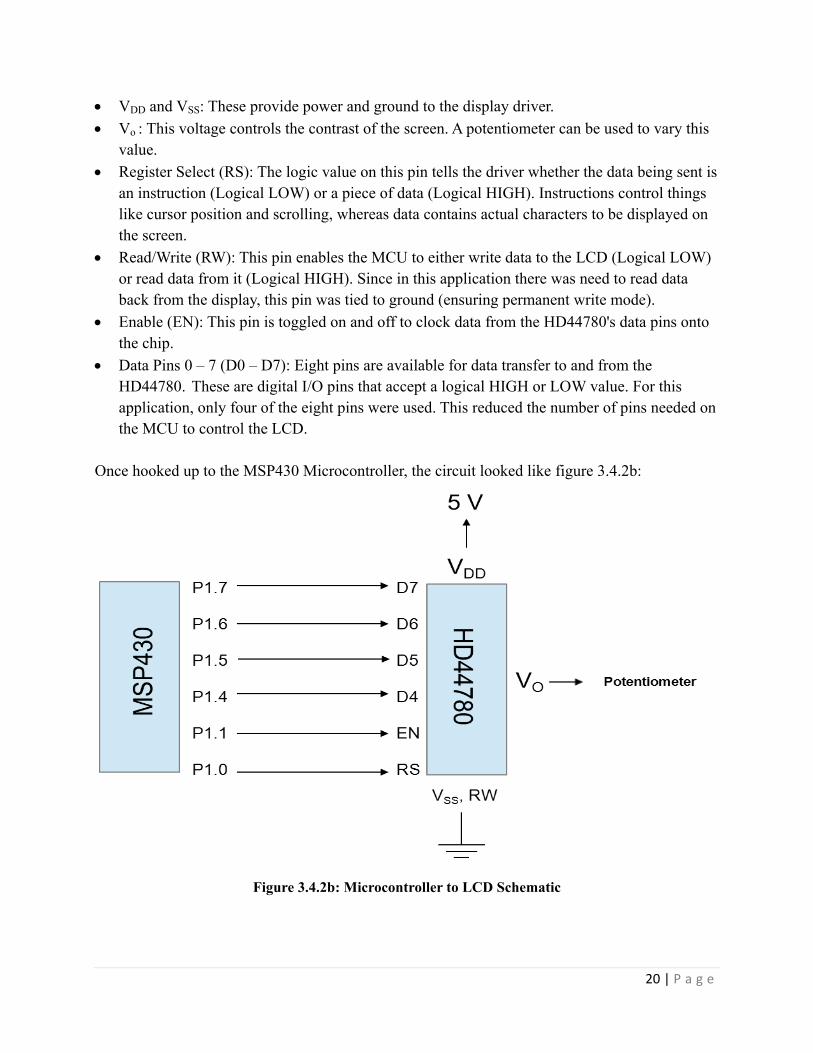
VDD and VSS: These provide power and ground to the display driver.
Vo : This voltage controls the contrast of the screen. A potentiometer can be used to vary this
value.
Register Select (RS): The logic value on this pin tells the driver whether the data being sent is
an instruction (Logical LOW) or a piece of data (Logical HIGH). Instructions control things
like cursor position and scrolling, whereas data contains actual characters to be displayed on
the screen.
Read/Write (RW): This pin enables the MCU to either write data to the LCD (Logical LOW)
or read data from it (Logical HIGH). Since in this application there was need to read data
back from the display, this pin was tied to ground (ensuring permanent write mode).
Enable (EN): This pin is toggled on and off to clock data from the HD44780's data pins onto
the chip.
Data Pins 0 – 7 (D0 – D7): Eight pins are available for data transfer to and from the
HD44780. These are digital I/O pins that accept a logical HIGH or LOW value. For this
application, only four of the eight pins were used. This reduced the number of pins needed on
the MCU to control the LCD.
Once hooked up to the MSP430 Microcontroller, the circuit looked like figure 3.4.2b:
Figure 3.4.2b: Microcontroller to LCD Schematic
21 | P a g e
3.4.2.1: Software Setup
The remainder of the configuration was performed by code running on the MCU. This code is
responsible for setting the HD44780 to 4-bit mode, initializing several important display
parameters, sending data when the screen needs to be updated, and waiting for appropriate
intervals between digital switching events, to ensure that transient behaviors are not
inadvertently clocked in as (false) data.
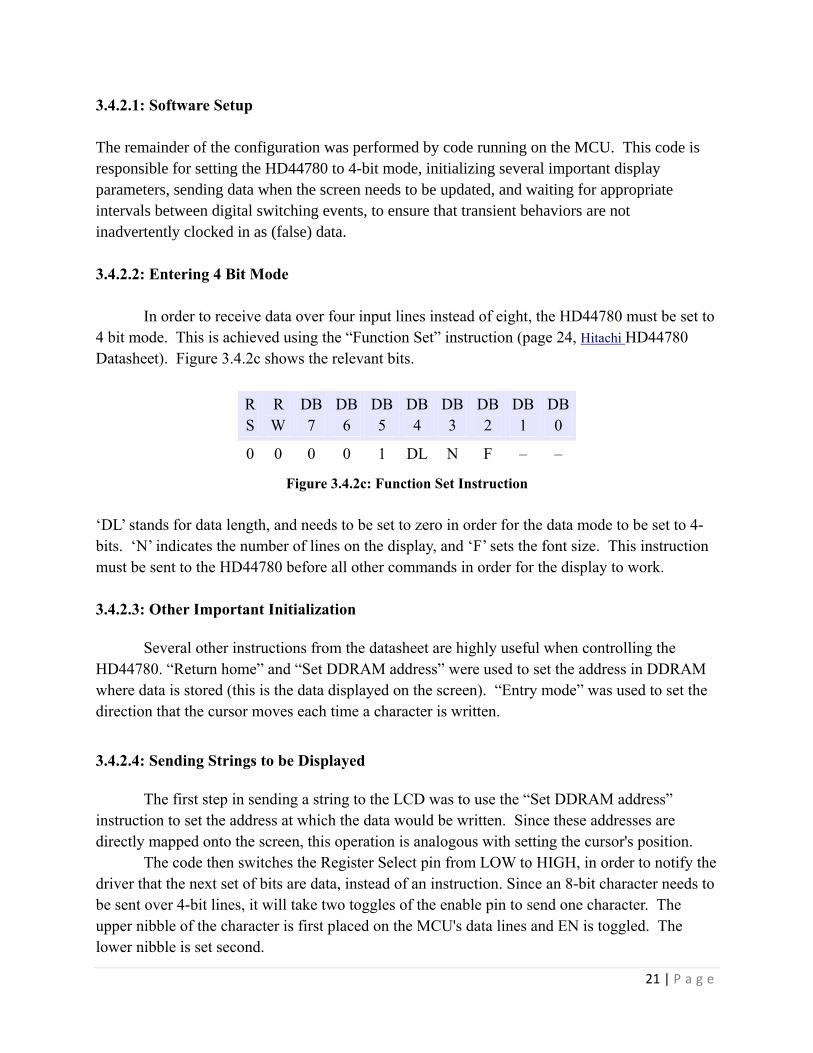
3.4.2.2: Entering 4 Bit Mode
In order to receive data over four input lines instead of eight, the HD44780 must be set to
4 bit mode. This is achieved using the “Function Set” instruction (page 24, Hitachi HD44780
Datasheet). Figure 3.4.2c shows the relevant bits.
R
S
R
W
DB
7
DB
6
DB
5
DB
4
DB
3
DB
2
DB
1
DB
0
0 0 0 0 1 DL N F – –
Figure 3.4.2c: Function Set Instruction
‘DL’ stands for data length, and needs to be set to zero in order for the data mode to be set to 4-
bits. ‘N’ indicates the number of lines on the display, and ‘F’ sets the font size. This instruction
must be sent to the HD44780 before all other commands in order for the display to work.
3.4.2.3: Other Important Initialization
Several other instructions from the datasheet are highly useful when controlling the
HD44780. “Return home” and “Set DDRAM address” were used to set the address in DDRAM
where data is stored (this is the data displayed on the screen). “Entry mode” was used to set the
direction that the cursor moves each time a character is written.
3.4.2.4: Sending Strings to be Displayed
The first step in sending a string to the LCD was to use the “Set DDRAM address”
instruction to set the address at which the data would be written. Since these addresses are
directly mapped onto the screen, this operation is analogous with setting the cursor's position.
The code then switches the Register Select pin from LOW to HIGH, in order to notify the
driver that the next set of bits are data, instead of an instruction. Since an 8-bit character needs to
be sent over 4-bit lines, it will take two toggles of the enable pin to send one character. The
upper nibble of the character is first placed on the MCU's data lines and EN is toggled. The
lower nibble is set second.
22 | P a g e
3.4.2.5: Building in Appropriate Delays
After sending an instruction or a piece of data, the MCU can monitor data bit-7, which
acts as a busy flag. This flag switches from 1 to 0 once internal calculation has finished and the
HD44780 is ready to receive more data/instructions. While this feature is useful when the screen
needs to be updated as quickly as possible, it also requires an additional interrupt on the MCU to
detect the falling edge.
Since ultra-fast screen refresh was not required, it was much easier to include an
appropriate delay between instructions/data, instead of monitoring the busy flag for a falling
edge. Worst-case delay times are given in the datasheet. By programming the MCU to wait
longer than these worst-case times when a command is sent, this ensured that the next write
operation would not take place prematurely.
3.4.3: Clock System
Initially, the team thought that a steady clock signal could be derived from the MSP430's
internal digitally controlled oscillator (DCO). Research indicated that this oscillator's frequency
is highly variable with changes in chip temperature and supply voltage. Instead, a 32.768 kHz
external crystal oscillator was used as a clock source. Conveniently, this frequency is 2^15, so it
was evenly divided to generate interrupts at a frequency of 1 Hz.
On each clock interrupt, the time and date must be updated. The brunt of this task was
handled by a convenient real time clock (RTC) library provided by TI. This library takes care of
the complicated leap-year and daylight savings time details and provides time set functions to the
programmer. The code that I wrote calls a function in the TI library to increment the clock each
second.
A method of setting the time manually was also developed and programmed. The
buttons, normally used to zero, calibrate and freeze the g-readings, take on alternate meanings
when the device is in time set mode. Because the screen is so small, the user can set year,
month, day, hour, minute, and second separately.
23 | P a g e
Chapter 4: Design Evaluation
Three different aspects of the G-meter with “Peak/Hold” needed to be tested to prove that
this design was a success. They were battery life, filter accuracy, and G-Meter accuracy.
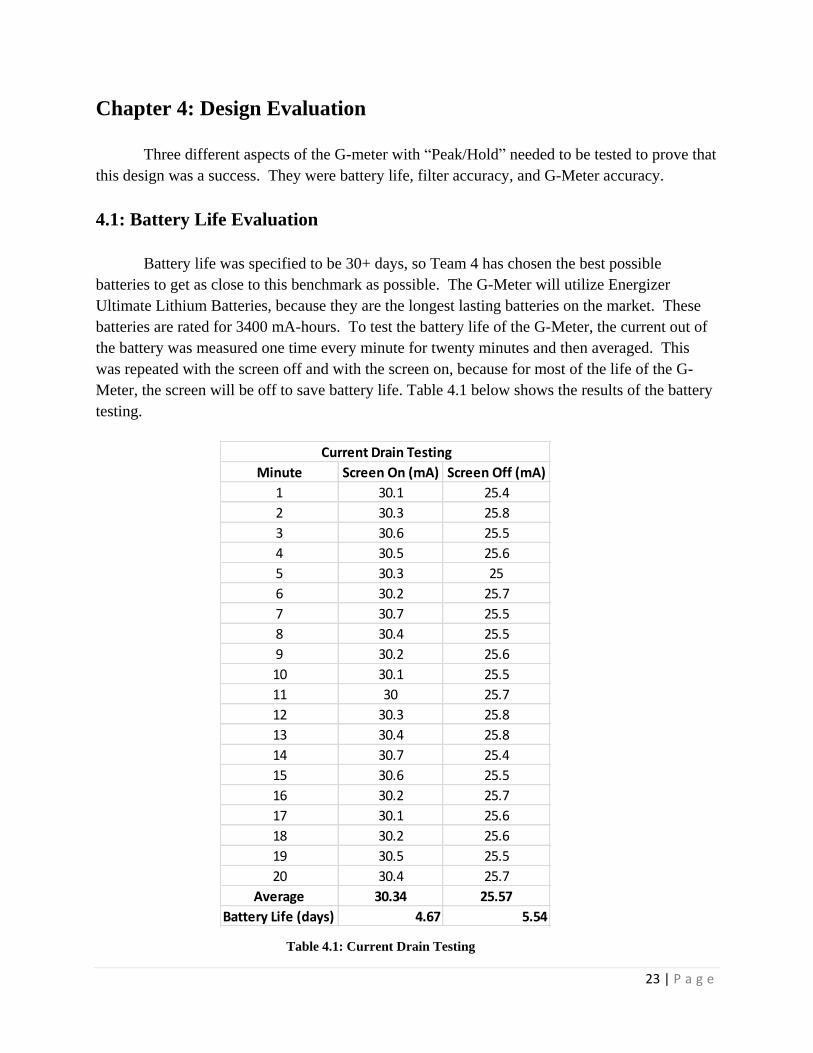
4.1: Battery Life Evaluation
Battery life was specified to be 30+ days, so Team 4 has chosen the best possible
batteries to get as close to this benchmark as possible. The G-Meter will utilize Energizer
Ultimate Lithium Batteries, because they are the longest lasting batteries on the market. These
batteries are rated for 3400 mA-hours. To test the battery life of the G-Meter, the current out of
the battery was measured one time every minute for twenty minutes and then averaged. This
was repeated with the screen off and with the screen on, because for most of the life of the G-
Meter, the screen will be off to save battery life. Table 4.1 below shows the results of the battery
testing.
Table 4.1: Current Drain Testing
Current Drain Testing
Minute Screen On (mA) Screen Off (mA)
1 30.1 25.4
2 30.3 25.8
3 30.6 25.5
4 30.5 25.6
5 30.3 25
6 30.2 25.7
7 30.7 25.5
8 30.4 25.5
9 30.2 25.6
10 30.1 25.5
11 30 25.7
12 30.3 25.8
13 30.4 25.8
14 30.7 25.4
15 30.6 25.5
16 30.2 25.7
17 30.1 25.6
18 30.2 25.6
19 30.5 25.5
20 30.4 25.7
Average 30.34 25.57
Battery Life (days) 4.67 5.54
24 | P a g e
This data reveals that the G-Meter can only stay alive on two AA batteries for a
maximum of 5.54 days, which is well short of the specification of 30 days. There are a number
of reasons for this. For the G-Meter to stay on for 30 days, it would need to consume 5.5 mA.
This, however, is unrealistic. The LCD alone uses 5 mA, and the screen that is used on the G-
Meter is as efficient of a screen as are available. Another reason that the battery life is so low is
that some components, such as the microcontroller and the accelerometer, are using much more
current than their data sheets claim they use. This is because of the capacitive load on the
accelerometer and the analog to digital conversion that happens in the microcontroller. A digital
accelerometer would take away much of the current consumption problem that the team is
currently having. This, however, was not an option for the team at the beginning of the semester.
While researching parts on every electronics website, there was only one accelerometer within
the specified range of g-forces that was currently stocked, and that is the one that is used in the
G-Meter. With more time to wait for components to arrive, this G-Meter could have had a
longer battery life, but it still would have not reached 30 days.
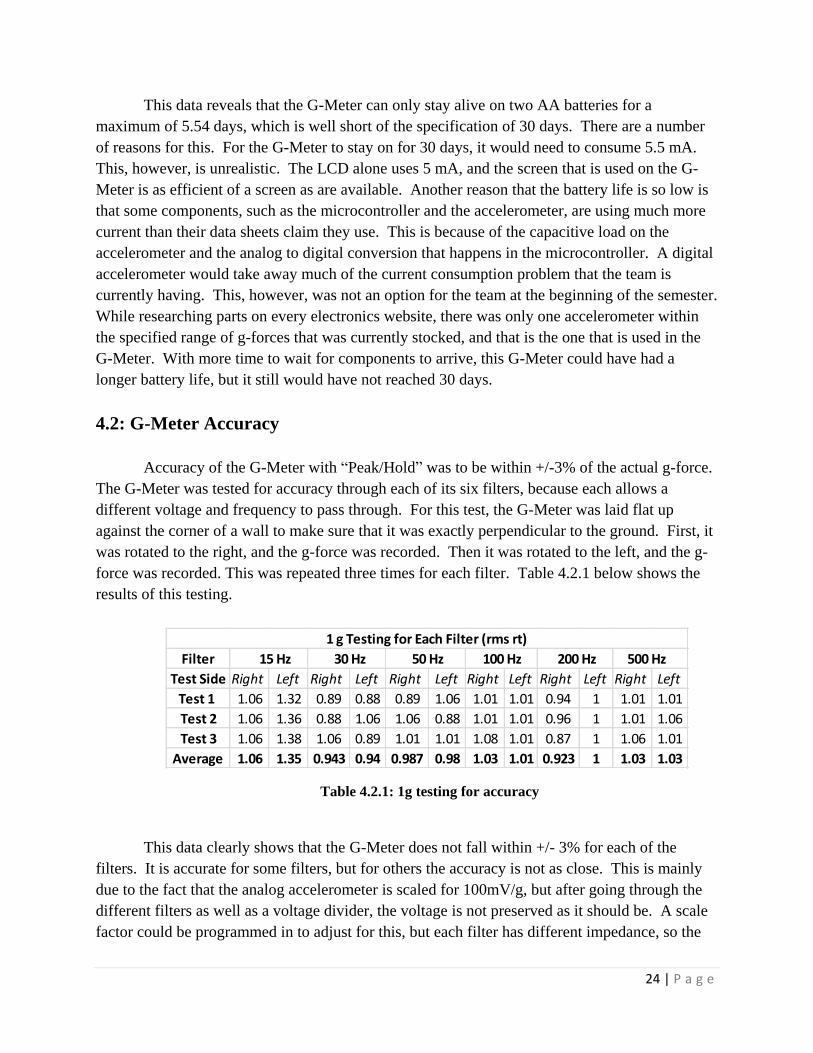
4.2: G-Meter Accuracy
Accuracy of the G-Meter with “Peak/Hold” was to be within +/-3% of the actual g-force.
The G-Meter was tested for accuracy through each of its six filters, because each allows a
different voltage and frequency to pass through. For this test, the G-Meter was laid flat up
against the corner of a wall to make sure that it was exactly perpendicular to the ground. First, it
was rotated to the right, and the g-force was recorded. Then it was rotated to the left, and the g-
force was recorded. This was repeated three times for each filter. Table 4.2.1 below shows the
results of this testing.
This data clearly shows that the G-Meter does not fall within +/- 3% for each of the
filters. It is accurate for some filters, but for others the accuracy is not as close. This is mainly
due to the fact that the analog accelerometer is scaled for 100mV/g, but after going through the
different filters as well as a voltage divider, the voltage is not preserved as it should be. A scale
factor could be programmed in to adjust for this, but each filter has different impedance, so the
Table 4.2.1: 1g testing for accuracy
Filter 15 Hz 30 Hz 50 Hz 100 Hz 200 Hz 500 Hz
Test Side Right Left Right Left Right Left Right Left Right Left Right Left
Test 1 1.06 1.32 0.89 0.88 0.89 1.06 1.01 1.01 0.94 1 1.01 1.01
Test 2 1.06 1.36 0.88 1.06 1.06 0.88 1.01 1.01 0.96 1 1.01 1.06
Test 3 1.06 1.38 1.06 0.89 1.01 1.01 1.08 1.01 0.87 1 1.06 1.01
Average 1.06 1.35 0.943 0.94 0.987 0.98 1.03 1.01 0.923 1 1.03 1.03
1 g Testing for Each Filter (rms rt)
25 | P a g e
scale factor would not work for each filter. This could have been easily avoided if team 4 was
able to purchase a digital accelerometer without waiting 17-30 weeks. This is because the digital
signal from a digital accelerometer would not be affected by the losses in the lines. The signal
could be sent directly to the microcontroller where it could be filtered digitally, which would
save us power, and improve accuracy.
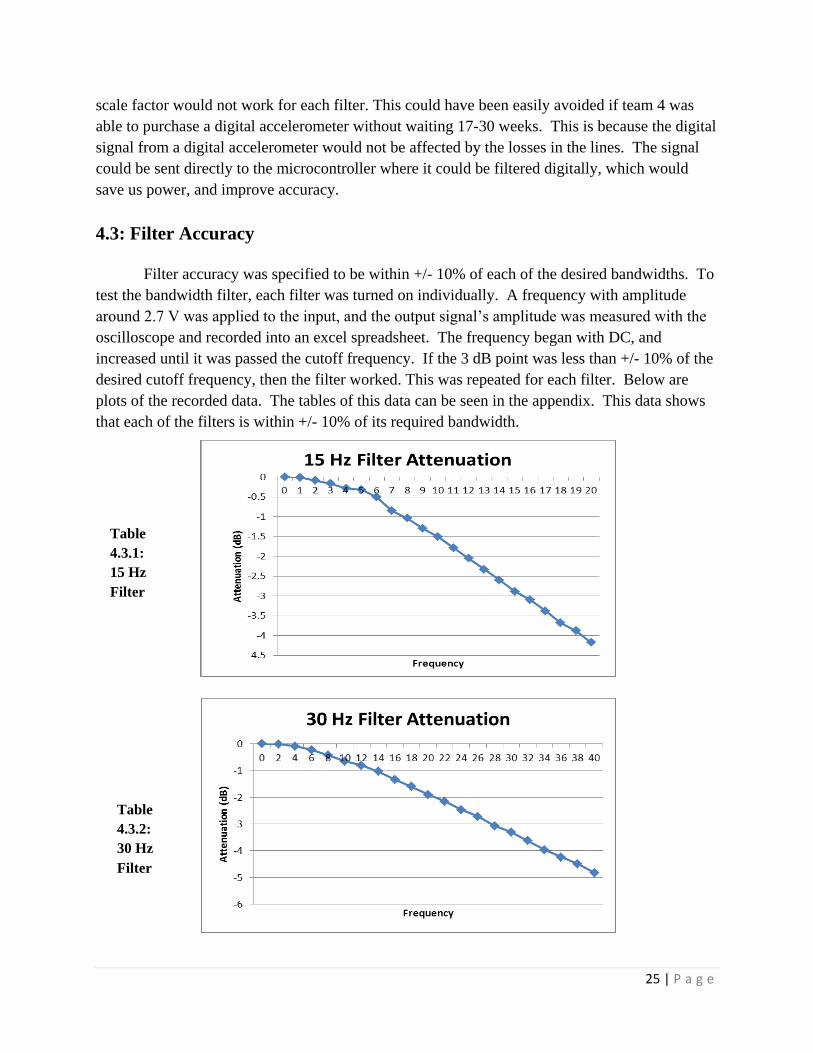
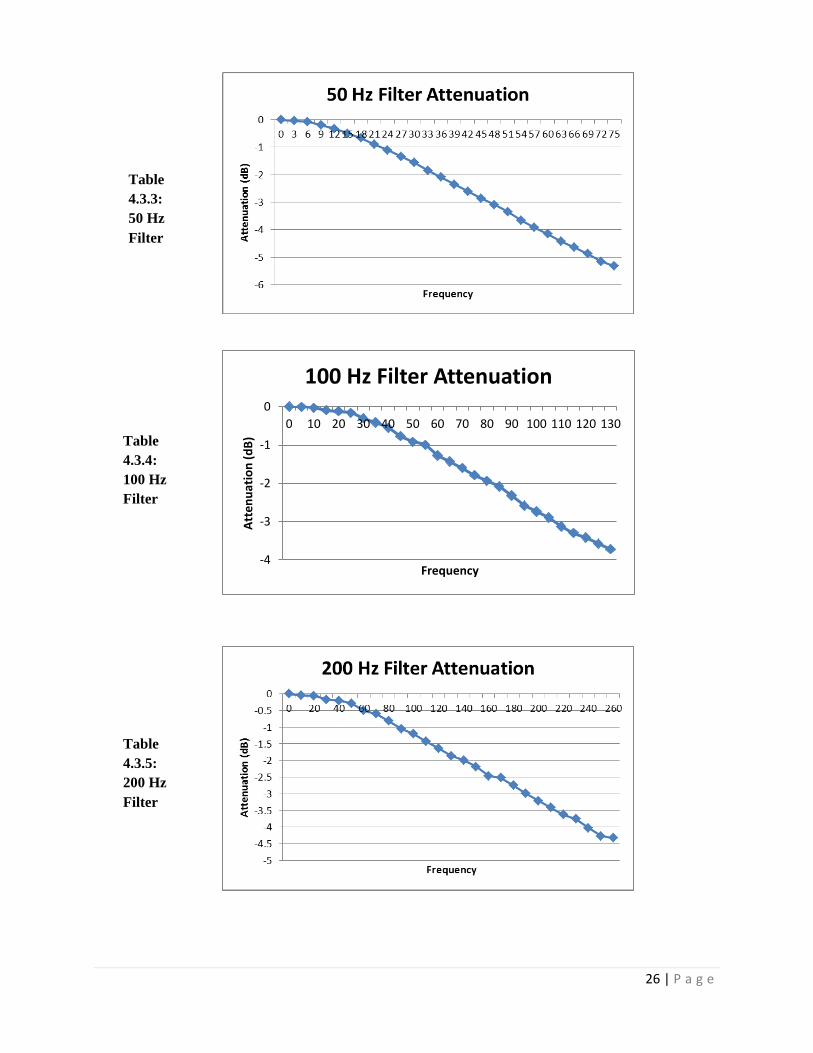
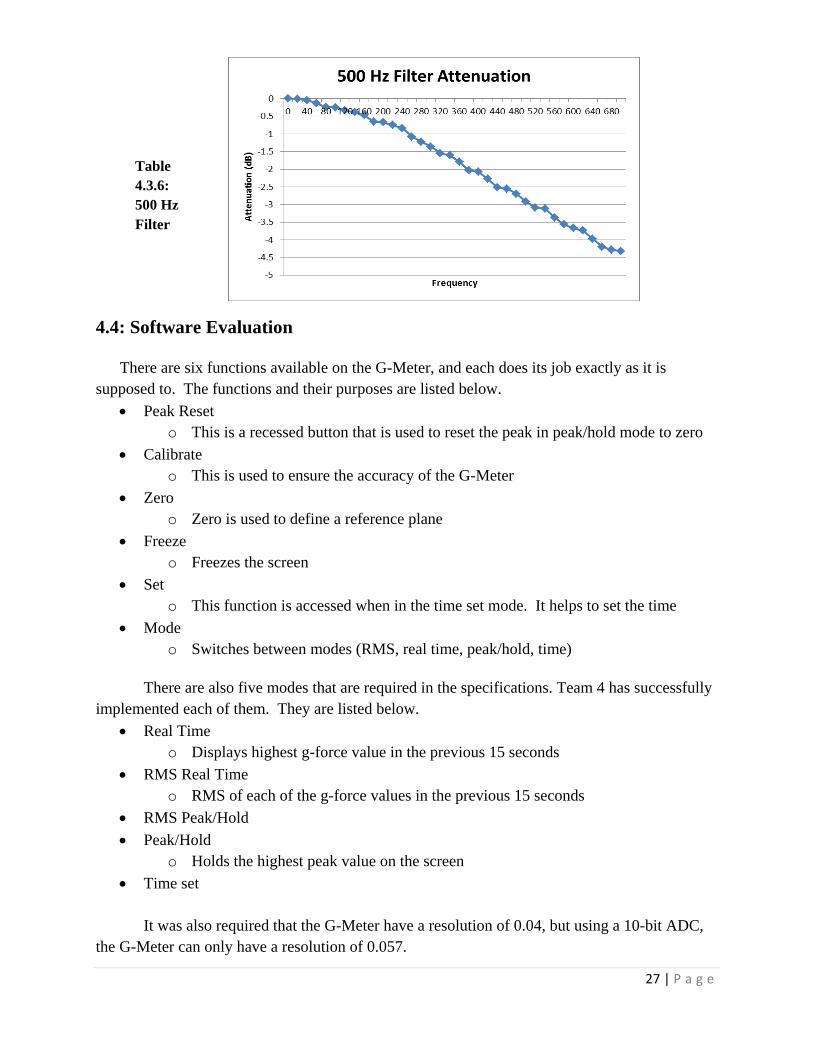
4.3: Filter Accuracy
Filter accuracy was specified to be within +/- 10% of each of the desired bandwidths. To
test the bandwidth filter, each filter was turned on individually. A frequency with amplitude
around 2.7 V was applied to the input, and the output signal’s amplitude was measured with the
oscilloscope and recorded into an excel spreadsheet. The frequency began with DC, and
increased until it was passed the cutoff frequency. If the 3 dB point was less than +/- 10% of the
desired cutoff frequency, then the filter worked. This was repeated for each filter. Below are
plots of the recorded data. The tables of this data can be seen in the appendix. This data shows
that each of the filters is within +/- 10% of its required bandwidth.
Table
4.3.1:
15 Hz
Filter
Table
4.3.2:
30 Hz
Filter
26 | P a g e
Table
4.3.3:
50 Hz
Filter
Table
4.3.5:
200 Hz
Filter
-4
-3
-2
-1
0
0 10 20 30 40 50 60 70 80 90 100 110 120 130
Att
en
uat
ion
(d
B)
Frequency
100 Hz Filter Attenuation
Table
4.3.4:
100 Hz
Filter
27 | P a g e
4.4: Software Evaluation
There are six functions available on the G-Meter, and each does its job exactly as it is
supposed to. The functions and their purposes are listed below.
Peak Reset
o This is a recessed button that is used to reset the peak in peak/hold mode to zero
Calibrate
o This is used to ensure the accuracy of the G-Meter
Zero
o Zero is used to define a reference plane
Freeze
o Freezes the screen
Set
o This function is accessed when in the time set mode. It helps to set the time
Mode
o Switches between modes (RMS, real time, peak/hold, time)
There are also five modes that are required in the specifications. Team 4 has successfully
implemented each of them. They are listed below.
Real Time
o Displays highest g-force value in the previous 15 seconds
RMS Real Time
o RMS of each of the g-force values in the previous 15 seconds
RMS Peak/Hold
Peak/Hold
o Holds the highest peak value on the screen
Time set
It was also required that the G-Meter have a resolution of 0.04, but using a 10-bit ADC,
the G-Meter can only have a resolution of 0.057.
Table
4.3.6:
500 Hz
Filter
28 | P a g e
Chapter 5: Conclusion
5.1: Conclusion
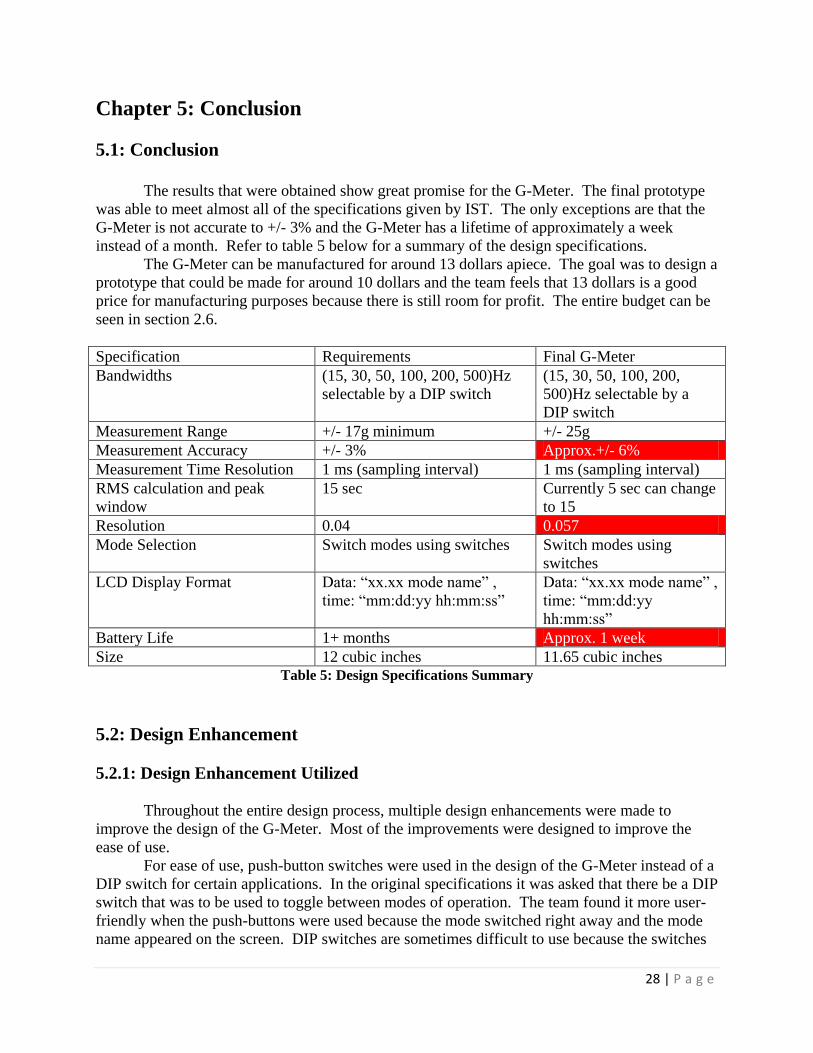
The results that were obtained show great promise for the G-Meter. The final prototype
was able to meet almost all of the specifications given by IST. The only exceptions are that the
G-Meter is not accurate to +/- 3% and the G-Meter has a lifetime of approximately a week
instead of a month. Refer to table 5 below for a summary of the design specifications.
The G-Meter can be manufactured for around 13 dollars apiece. The goal was to design a
prototype that could be made for around 10 dollars and the team feels that 13 dollars is a good
price for manufacturing purposes because there is still room for profit. The entire budget can be
seen in section 2.6.
Specification Requirements Final G-Meter
Bandwidths (15, 30, 50, 100, 200, 500)Hz
selectable by a DIP switch
(15, 30, 50, 100, 200,
500)Hz selectable by a
DIP switch
Measurement Range +/- 17g minimum +/- 25g
Measurement Accuracy +/- 3% Approx.+/- 6%
Measurement Time Resolution 1 ms (sampling interval) 1 ms (sampling interval)
RMS calculation and peak
window
15 sec Currently 5 sec can change
to 15
Resolution 0.04 0.057
Mode Selection Switch modes using switches Switch modes using
switches
LCD Display Format Data: “xx.xx mode name” ,
time: “mm:dd:yy hh:mm:ss”
Data: “xx.xx mode name” ,
time: “mm:dd:yy
hh:mm:ss”
Battery Life 1+ months Approx. 1 week
Size 12 cubic inches 11.65 cubic inches Table 5: Design Specifications Summary
5.2: Design Enhancement
5.2.1: Design Enhancement Utilized
Throughout the entire design process, multiple design enhancements were made to
improve the design of the G-Meter. Most of the improvements were designed to improve the
ease of use.
For ease of use, push-button switches were used in the design of the G-Meter instead of a
DIP switch for certain applications. In the original specifications it was asked that there be a DIP
switch that was to be used to toggle between modes of operation. The team found it more user-
friendly when the push-buttons were used because the mode switched right away and the mode
name appeared on the screen. DIP switches are sometimes difficult to use because the switches
29 | P a g e
are fairly small and it is too easy to accidentally hit multiple switches at the same time. The team
also decided that it was easier to incorporate a function for the user to manually set the time of
the G-Meter without having to reprogram the microcontroller. Using the buttons already on the
final G-Meter the user can change the time on the G-Meter much like the way that a person can
change the time on a digital watch. The G-Meter also has a reset button similar to the reset
button that can be seen on a TI-83 calculator. The reset button can only be pushed using a pen or
other thin tipped object so it cannot be accidently pushed. Lastly, the structure of the G-Meter is
equipped with flaps that can easily be attached to the container that is being measured.
5.2.2: Additional Enhancements
This section will cover some additional enhancements that could be made to improve the
G-Meter but were unable to be executed due to time constraints.
One additional enhancement would be the use of surface mount components instead of
through-hole components. This enhancement would minimize the size of the G-Meter making it
even more portable than it already is. This enhancement could also help the battery life because
the surface mount components would produce smaller current loops and there would be less
solder which could reduce the energy lost to heat.
Another additional enhancement would be to use a digital accelerometer instead of an
analog accelerometer. The digital accelerometer would not need to use the analog to digital
converter in the microcontroller and that would save memory space on the microcontroller. The
saved space on the microcontroller would reduce the power consumed by the device and could
add more time on the battery life. The digital accelerometer also requires less current to operate
and that would also help extend the battery life.
An MSP430 equipped with a 12-bit analog-to-digital converter would provide higher
resolution measurements of the output of an analog accelerometer. This would allow the G-
Meter to provide more accurate acceleration measurements without requiring any extra hardware
or software development.
Lastly, a 3D printer could have been used to create the encasement. If designed correctly
the casing should be able to hold the accelerometer steady to help with the accuracy of the
device. In the current G-Meter the case holds the accelerometer at a slight angle which can
worsen the accuracy of the G-Meter by a few percentage points.
30 | P a g e
Appendix 1: Team Responsibilities
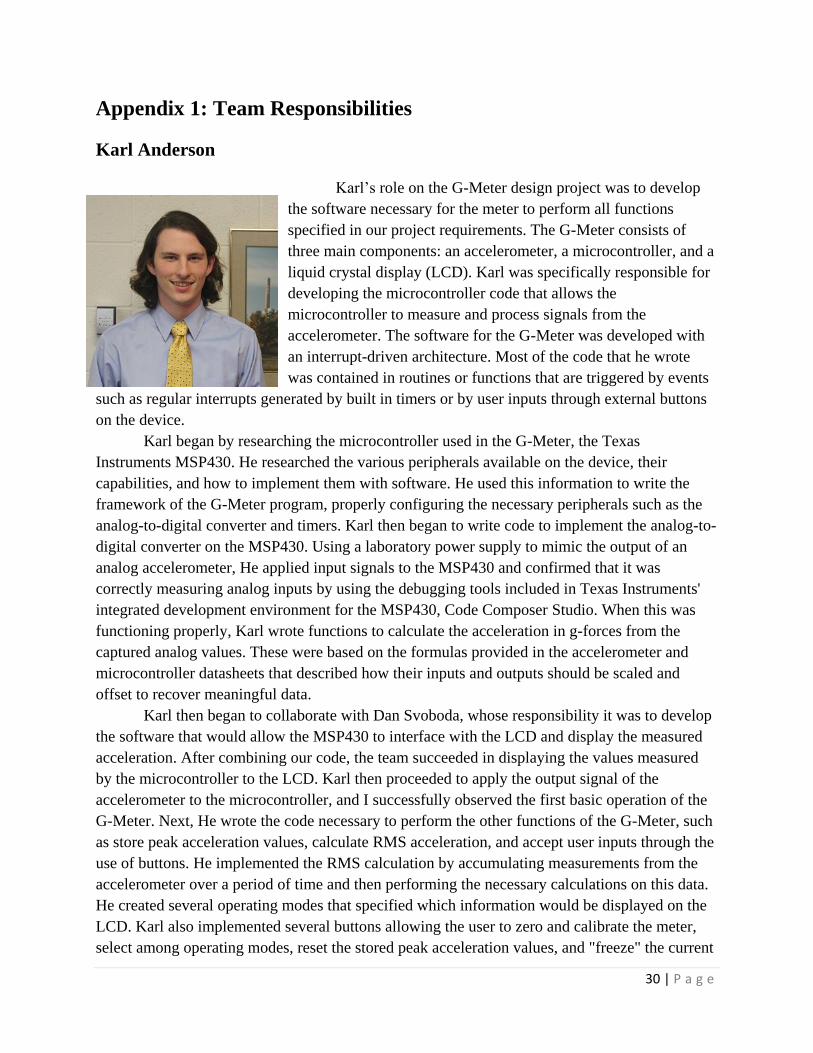
Karl Anderson
Karl’s role on the G-Meter design project was to develop
the software necessary for the meter to perform all functions
specified in our project requirements. The G-Meter consists of
three main components: an accelerometer, a microcontroller, and a
liquid crystal display (LCD). Karl was specifically responsible for
developing the microcontroller code that allows the
microcontroller to measure and process signals from the
accelerometer. The software for the G-Meter was developed with
an interrupt-driven architecture. Most of the code that he wrote
was contained in routines or functions that are triggered by events
such as regular interrupts generated by built in timers or by user inputs through external buttons
on the device.
Karl began by researching the microcontroller used in the G-Meter, the Texas
Instruments MSP430. He researched the various peripherals available on the device, their
capabilities, and how to implement them with software. He used this information to write the
framework of the G-Meter program, properly configuring the necessary peripherals such as the
analog-to-digital converter and timers. Karl then began to write code to implement the analog-to-
digital converter on the MSP430. Using a laboratory power supply to mimic the output of an
analog accelerometer, He applied input signals to the MSP430 and confirmed that it was
correctly measuring analog inputs by using the debugging tools included in Texas Instruments'
integrated development environment for the MSP430, Code Composer Studio. When this was
functioning properly, Karl wrote functions to calculate the acceleration in g-forces from the
captured analog values. These were based on the formulas provided in the accelerometer and
microcontroller datasheets that described how their inputs and outputs should be scaled and
offset to recover meaningful data.
Karl then began to collaborate with Dan Svoboda, whose responsibility it was to develop
the software that would allow the MSP430 to interface with the LCD and display the measured
acceleration. After combining our code, the team succeeded in displaying the values measured
by the microcontroller to the LCD. Karl then proceeded to apply the output signal of the
accelerometer to the microcontroller, and I successfully observed the first basic operation of the
G-Meter. Next, He wrote the code necessary to perform the other functions of the G-Meter, such
as store peak acceleration values, calculate RMS acceleration, and accept user inputs through the
use of buttons. He implemented the RMS calculation by accumulating measurements from the
accelerometer over a period of time and then performing the necessary calculations on this data.
He created several operating modes that specified which information would be displayed on the
LCD. Karl also implemented several buttons allowing the user to zero and calibrate the meter,
select among operating modes, reset the stored peak acceleration values, and "freeze" the current

31 | P a g e
contents of the LCD to the display. During this portion of the project Karl collaborated with
Shuhan Chen to consolidate and streamline the existing code to make it run more efficiently and
use less memory on the MSP430 microcontroller.
As the G-Meter was nearing its completion, Karl again collaborated with Dan Svoboda to
combine the software that each of them had written into the final system. Dan had developed a
real time clock system that was used to time the software interrupts and generate a clock to store
the time and date that acceleration events occurred. The two worked together to integrate these
functionalities into the final device.
Timothy Carroll
Timothy Carroll’s technical job was Power Specialist.
The Power Specialist job was to design and build the step-up
converter and the battery layout of the G-Meter.
After researching different types of step-up converters,
Timothy decided to use the LT1073-5 step-up converter. The
LT1073-5 was chosen because it only consumes very little
current and has a built in gain setting resistor on the chip. Since
there is a size requirement for the G-Meter it is important to
make the step-up converter as small as possible. Timothy used a
built in step-up converter that can be found on the LT1073
datasheet to build the step-up converter. He chose this design
because there are only three outer components that need to be used a 68µH inductor, a 1N5818
zener diode, and a 100µF capacitor. Since there were only three external parts, it was easier to
design the step-up converter to take up a minimal amount of space.
While selecting the battery layout there were very few options to choose from. Timothy
researched different casings and set-ups for AA batteries and decided on a design with a door
that should protect the batteries and be used as part of the final casing for the G-Meter.
Timothy also took part in other aspects in the designing and building of the G-Meter.
While building the final prototype he soldered connections from the main printed circuit board
(PCB) to the display screen. He also took part in troubleshooting the prototype. While
assembling the final prototype there were problems with the step-up converter and it took hours
of trouble shooting to solve. The problem was that the output node lost its connection to the rest
of the board so another board was designed to withstand the “clutter” to that one node. He also
helped in researching technical documentation for components that were used such as the
accelerometer. Lastly, he helped in the design and assembly of the casing for the final G-Meter
prototype.
32 | P a g e
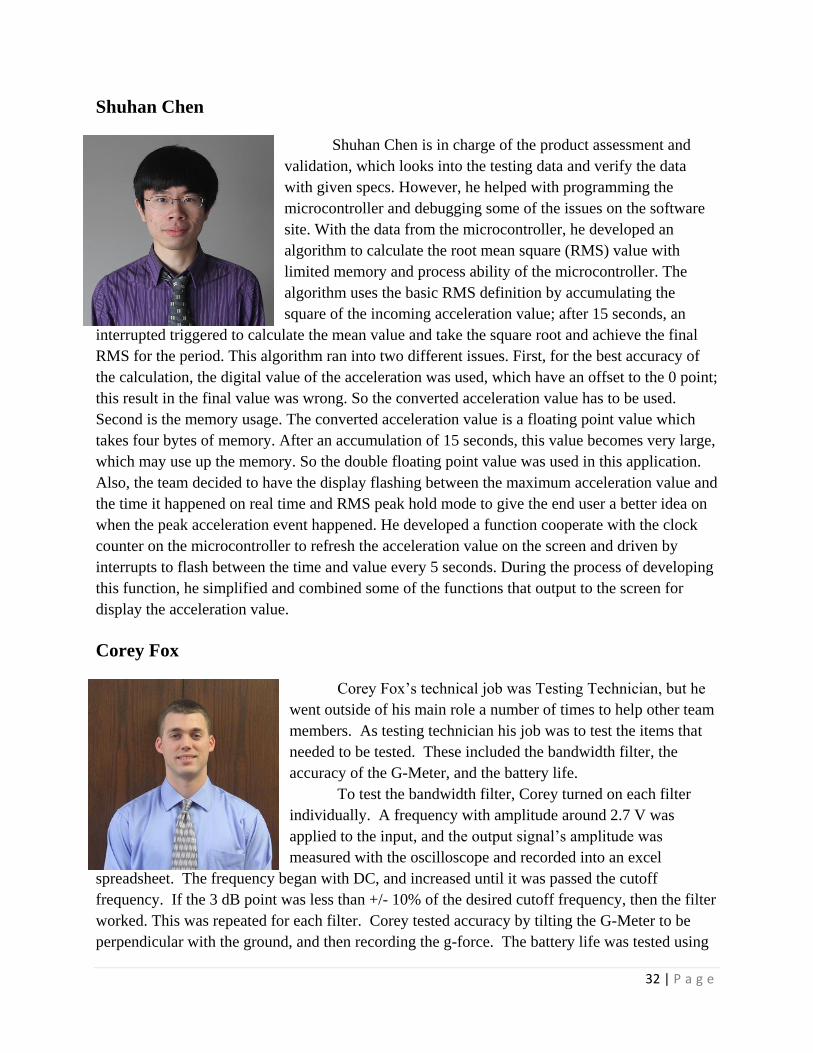
Shuhan Chen
Shuhan Chen is in charge of the product assessment and
validation, which looks into the testing data and verify the data
with given specs. However, he helped with programming the
microcontroller and debugging some of the issues on the software
site. With the data from the microcontroller, he developed an
algorithm to calculate the root mean square (RMS) value with
limited memory and process ability of the microcontroller. The
algorithm uses the basic RMS definition by accumulating the
square of the incoming acceleration value; after 15 seconds, an
interrupted triggered to calculate the mean value and take the square root and achieve the final
RMS for the period. This algorithm ran into two different issues. First, for the best accuracy of
the calculation, the digital value of the acceleration was used, which have an offset to the 0 point;
this result in the final value was wrong. So the converted acceleration value has to be used.
Second is the memory usage. The converted acceleration value is a floating point value which
takes four bytes of memory. After an accumulation of 15 seconds, this value becomes very large,
which may use up the memory. So the double floating point value was used in this application.
Also, the team decided to have the display flashing between the maximum acceleration value and
the time it happened on real time and RMS peak hold mode to give the end user a better idea on
when the peak acceleration event happened. He developed a function cooperate with the clock
counter on the microcontroller to refresh the acceleration value on the screen and driven by
interrupts to flash between the time and value every 5 seconds. During the process of developing
this function, he simplified and combined some of the functions that output to the screen for
display the acceleration value.
Corey Fox
Corey Fox’s technical job was Testing Technician, but he
went outside of his main role a number of times to help other team
members. As testing technician his job was to test the items that
needed to be tested. These included the bandwidth filter, the
accuracy of the G-Meter, and the battery life.
To test the bandwidth filter, Corey turned on each filter
individually. A frequency with amplitude around 2.7 V was
applied to the input, and the output signal’s amplitude was
measured with the oscilloscope and recorded into an excel
spreadsheet. The frequency began with DC, and increased until it was passed the cutoff
frequency. If the 3 dB point was less than +/- 10% of the desired cutoff frequency, then the filter
worked. This was repeated for each filter. Corey tested accuracy by tilting the G-Meter to be
perpendicular with the ground, and then recording the g-force. The battery life was tested using
33 | P a g e
an amp meter that was across the power on switch. The testing was done with the screen being
off. This is because for approximately 99% of the batteries life, the screen will be off to save
battery life.
Corey also took part in many aspects of the project that were outside of his job
description. The first was that he designed and built the bandwidth filter. This was a simple
task, yet it was a technical one. Another technical task that Corey took was the soldering
together of the whole circuit. This was challenging because there was very little room to work
in. The size constraints for our project forced us to design a very compact circuit that was
difficult to work with.
Other smaller tasks that Corey took part in were helping EJ in the design of the PCB by
giving his input and suggesting improvements when previous designs failed. He also designed
and constructed the project enclosure. This was a large undertaking, and three designs had to be
built before the final design was a success. Some of the difficulties in this included drilling out
the holes for the screen and DIP switch, measuring the exact locations of each of the holes, and
providing a good and attractive way to access the batteries.
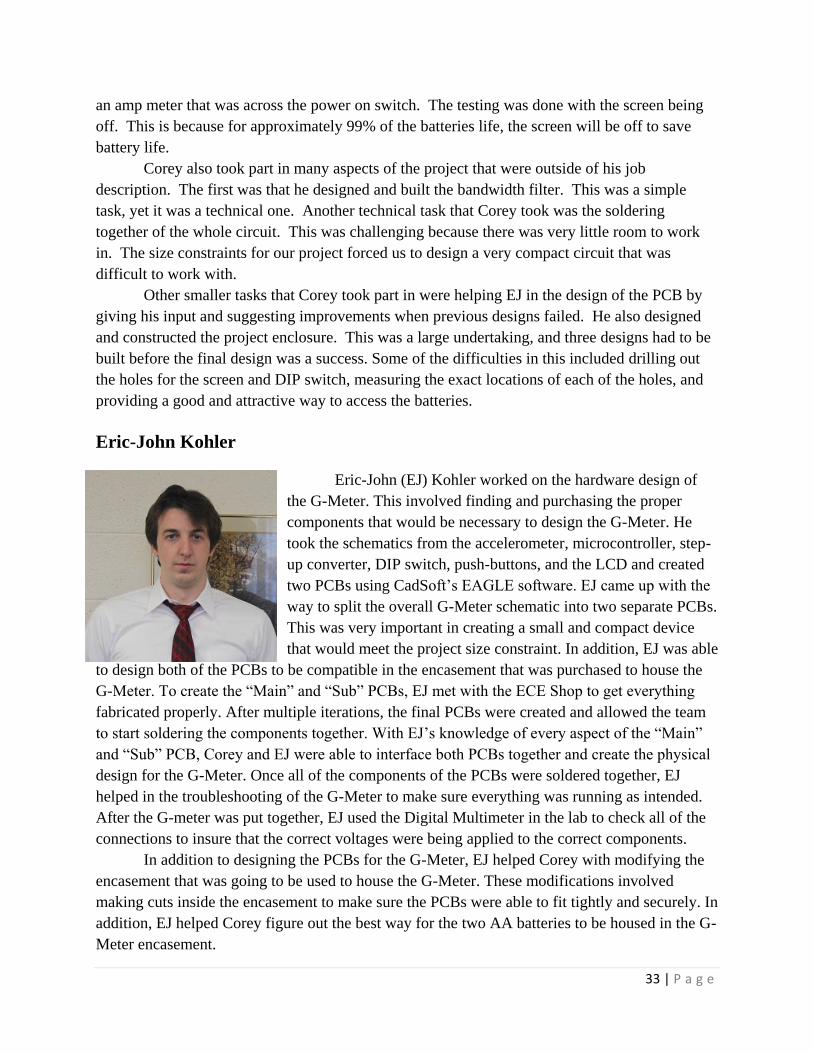
Eric-John Kohler
Eric-John (EJ) Kohler worked on the hardware design of
the G-Meter. This involved finding and purchasing the proper
components that would be necessary to design the G-Meter. He
took the schematics from the accelerometer, microcontroller, step-
up converter, DIP switch, push-buttons, and the LCD and created
two PCBs using CadSoft’s EAGLE software. EJ came up with the
way to split the overall G-Meter schematic into two separate PCBs.
This was very important in creating a small and compact device
that would meet the project size constraint. In addition, EJ was able
to design both of the PCBs to be compatible in the encasement that was purchased to house the
G-Meter. To create the “Main” and “Sub” PCBs, EJ met with the ECE Shop to get everything
fabricated properly. After multiple iterations, the final PCBs were created and allowed the team
to start soldering the components together. With EJ’s knowledge of every aspect of the “Main”
and “Sub” PCB, Corey and EJ were able to interface both PCBs together and create the physical
design for the G-Meter. Once all of the components of the PCBs were soldered together, EJ
helped in the troubleshooting of the G-Meter to make sure everything was running as intended.
After the G-meter was put together, EJ used the Digital Multimeter in the lab to check all of the
connections to insure that the correct voltages were being applied to the correct components.
In addition to designing the PCBs for the G-Meter, EJ helped Corey with modifying the
encasement that was going to be used to house the G-Meter. These modifications involved
making cuts inside the encasement to make sure the PCBs were able to fit tightly and securely. In
addition, EJ helped Corey figure out the best way for the two AA batteries to be housed in the G-
Meter encasement.

34 | P a g e
Dan Svoboda
Dan was responsible for design and development of the
LCD interface and clock system. Our team selected a 2 row, 8
column character LCD display in order to display acceleration
readings to the user. The LCD included an on-board driver which
used the communication protocol from the Hitachi HD44780
display driver. Dan read datasheets for the LCD and driver and
figured out how to correctly hook up the LCD to the
microcontroller.
Dan developed software in C to run on the microcontroller
that sent data to the screen. This code was used to configure the display on startup and to update
it periodically. Dan was responsible for setting the HD44780 to 4 bit mode, initializing several
important display parameters, sending data when the screen needs to be updated, and waiting for
appropriate intervals between digital switching events, to ensure that transient behaviors are not
inadvertently clocked in as (false) data.
The concept of writing programs that use less power was new to me at the onset of the G-Meter
design project. Dan read a large number of documents published by Texas Instruments detailing
how to best minimize the power consumed by the MSP430 microcontroller. TI's software
development tool (Code Composer Studio) also includes well-commented example code that
utilizes the power saving functionality, and reading through the code also enriched my
understanding of low power programming.
Dan was also responsible for coding the real time clock used in the G-Meter. Initially, he
thought that a steady clock signal could be derived from the MSP430's internal digitally
controlled oscillator (DCO). Research indicated that this oscillator's frequency is highly variable
with changes in chip temperature and supply voltage. Instead, he added a 32.768 kHz external
crystal oscillator to the Launchpad development board to be used as a clock source. Dan
programmed the MSP430 to increment the time and date on each one second interrupt. He
measured the accuracy of the clock over a long period of time and determined that it should drift
less than a minute over a one month period of continuous operation.
Dan implemented a simple method of setting the time, using the buttons that were already
present for acceleration calibration. The buttons, normally used to set the zero point, the 1 G
point and freeze the g readings, were programmed to take on alternate meanings when the device
is in time set mode. Because the screen is so small, the user can set year, month, day, hour,
minute, and second separately.
35 | P a g e
Appendix 2: References
HD44780U (LCD-II). N.p.: HITACHI, n.d. PDF.
LCD MODULE SPECIFICATION. N.p.: Microtips Technology, n.d. PDF.
Low-g Accelerometer. N.p.: Freescale Semiconductor, n.d. PDF.
"LT1073 Datasheet Pdf." LT1073 Datasheet Pdf - Micropower DC-DC Converter Adjustable
and Fixed 5V, 12V - Linear Technology. Linear Technology Corporation, n.d. Web. 1
Apr. 2013.
"Mouser Electronics - Electronic Components Distributor." Mouser Electronics - Electronic
Components Distributor. N.p., n.d. Web. 24 Apr. 2013.
"MSP430G2553 (ACTIVE) MSP430G2x53, MSP430G2x13 Mixed Signal Microcontroller."
MSP430 Ultra-Low Power 16-bit MCUs. Texas Instruments, n.d. Web. 24 Apr. 2013
36 | P a g e
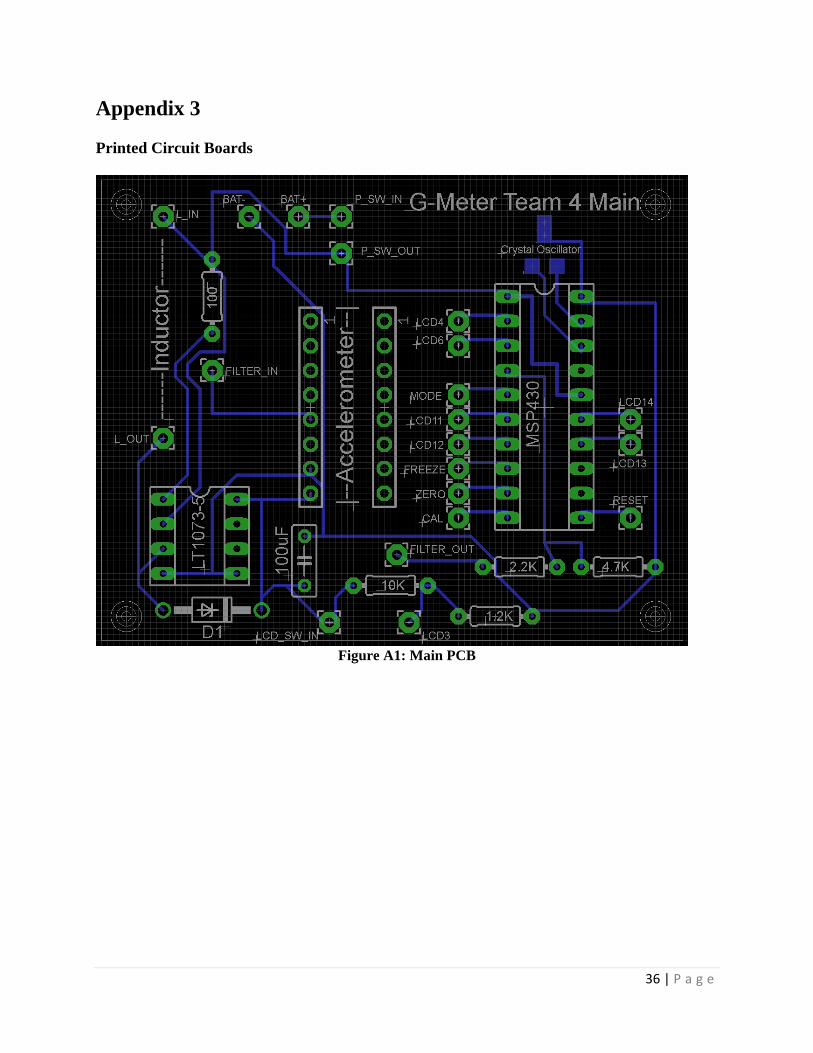
Appendix 3
Printed Circuit Boards
Figure A1: Main PCB
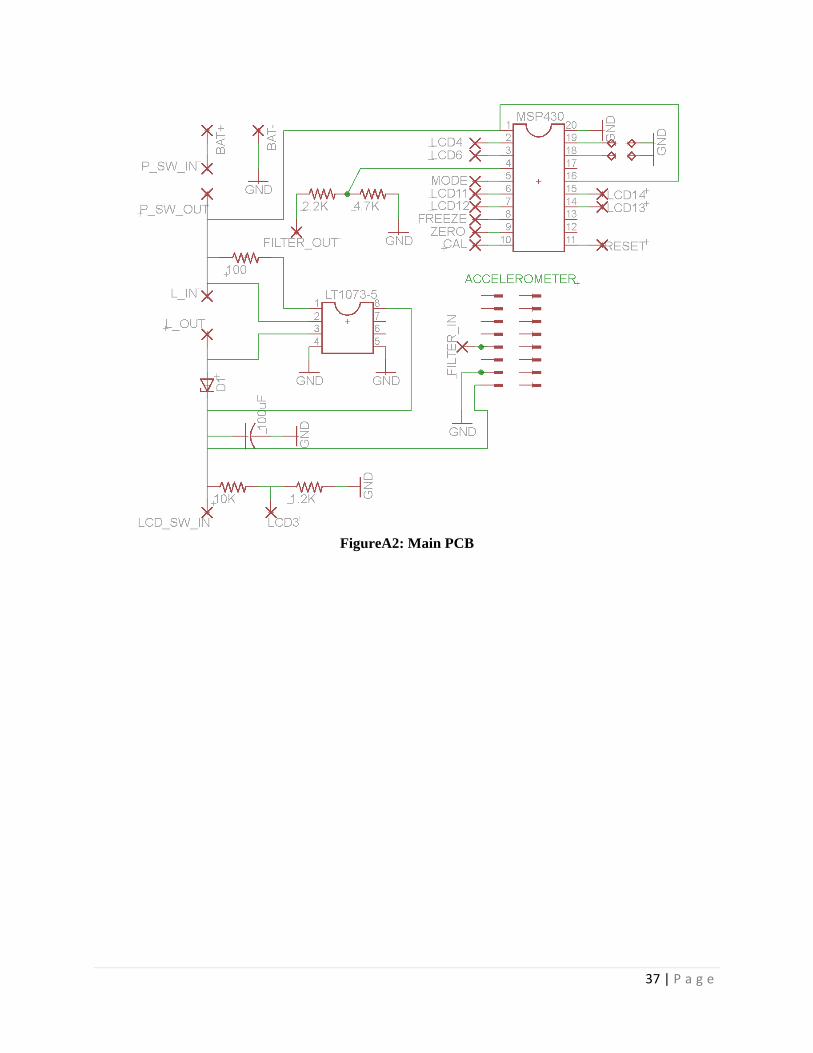
37 | P a g e
FigureA2: Main PCB
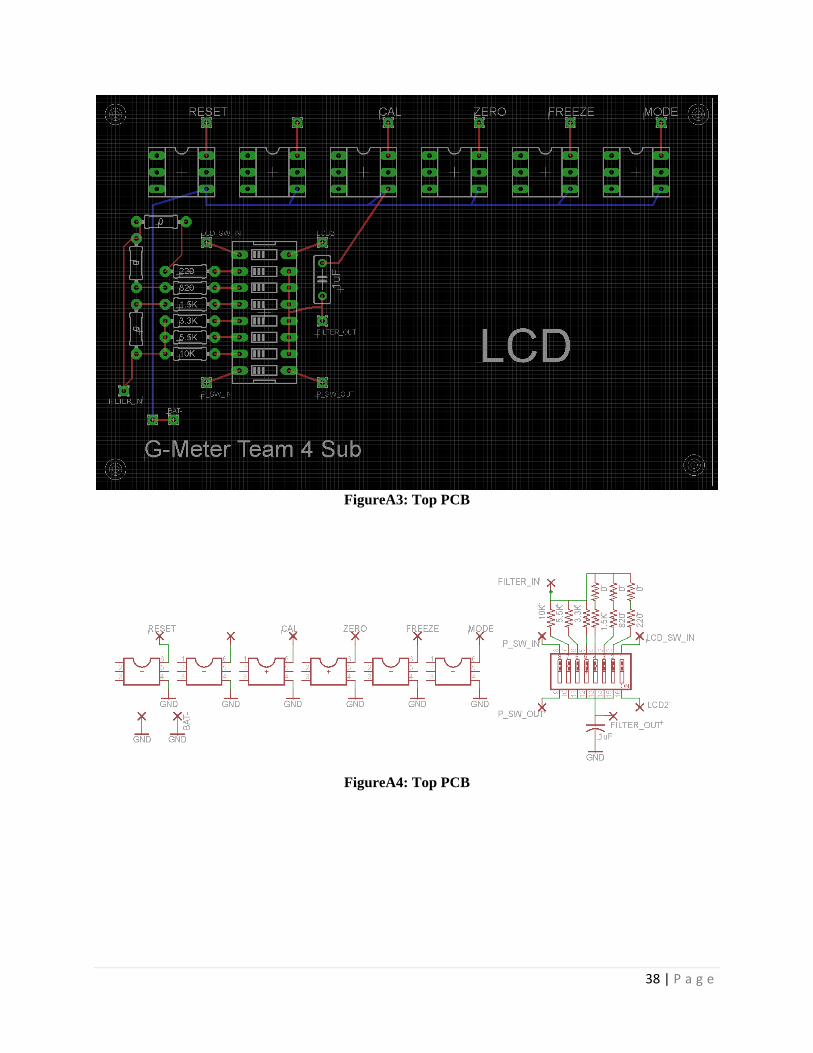
38 | P a g e
FigureA3: Top PCB
FigureA4: Top PCB

39 | P a g e
Code
ALL CODE CAN BE
FOUND ON CD
VERSION OF THIS
DOCUMENT
40 | P a g e
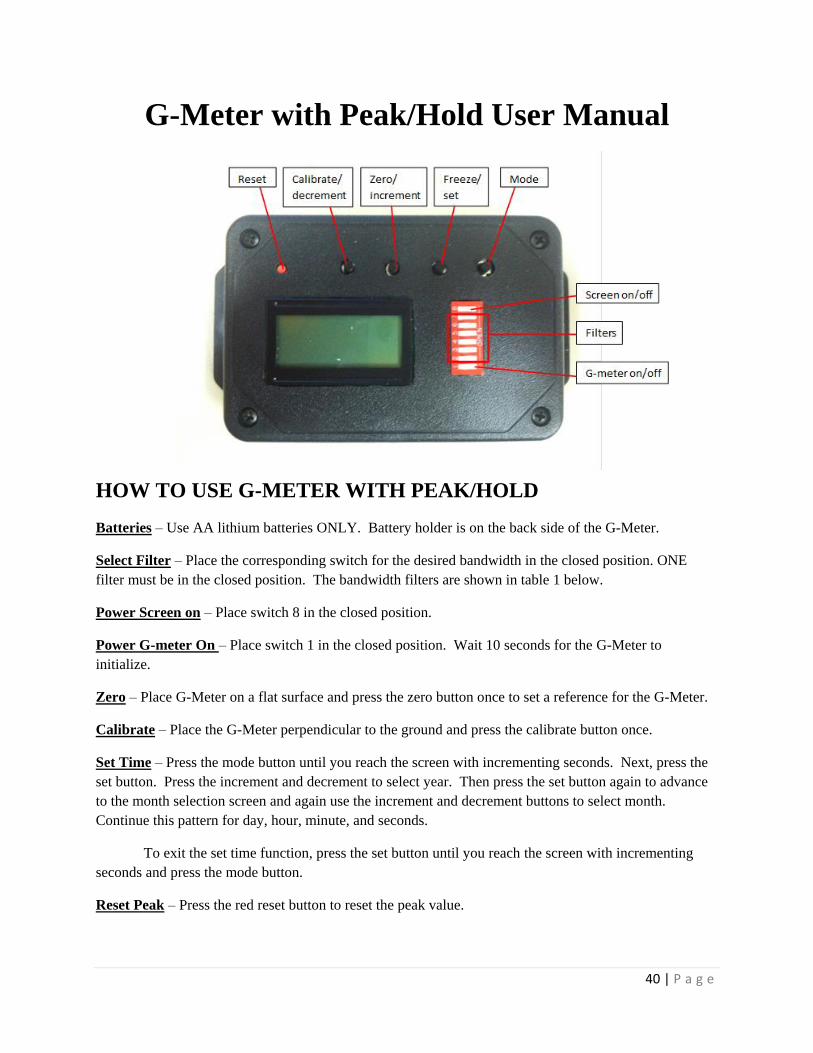
G-Meter with Peak/Hold User Manual
HOW TO USE G-METER WITH PEAK/HOLD
Batteries – Use AA lithium batteries ONLY. Battery holder is on the back side of the G-Meter.
Select Filter – Place the corresponding switch for the desired bandwidth in the closed position. ONE
filter must be in the closed position. The bandwidth filters are shown in table 1 below.
Power Screen on – Place switch 8 in the closed position.
Power G-meter On – Place switch 1 in the closed position. Wait 10 seconds for the G-Meter to
initialize.
Zero – Place G-Meter on a flat surface and press the zero button once to set a reference for the G-Meter.
Calibrate – Place the G-Meter perpendicular to the ground and press the calibrate button once.
Set Time – Press the mode button until you reach the screen with incrementing seconds. Next, press the
set button. Press the increment and decrement to select year. Then press the set button again to advance
to the month selection screen and again use the increment and decrement buttons to select month.
Continue this pattern for day, hour, minute, and seconds.
To exit the set time function, press the set button until you reach the screen with incrementing
seconds and press the mode button.
Reset Peak – Press the red reset button to reset the peak value.
41 | P a g e
Buttons
Reset – Resets the value in peak/hold mode to zero.
Calibrate/decrement – Place G-Meter perpendicular and press the calibrate button to the ground to
calibrate the G-Meter. This increases accuracy. This button is used to decrement while in time set mode.
Zero/increment – Place the G-Meter on a level surface and press this button to set the current value as
zero. This button is used to increment in time set mode.
Freeze/set – Press to hold the current screen until the button is pressed again. This button is used to
rotate between years/months/days/hours/minutes/seconds in time set mode.
Mode – Press to toggle through modes. The modes are listed below.
Real time
RMS real time
RMS Peak/hold
Peak/hold
Time set
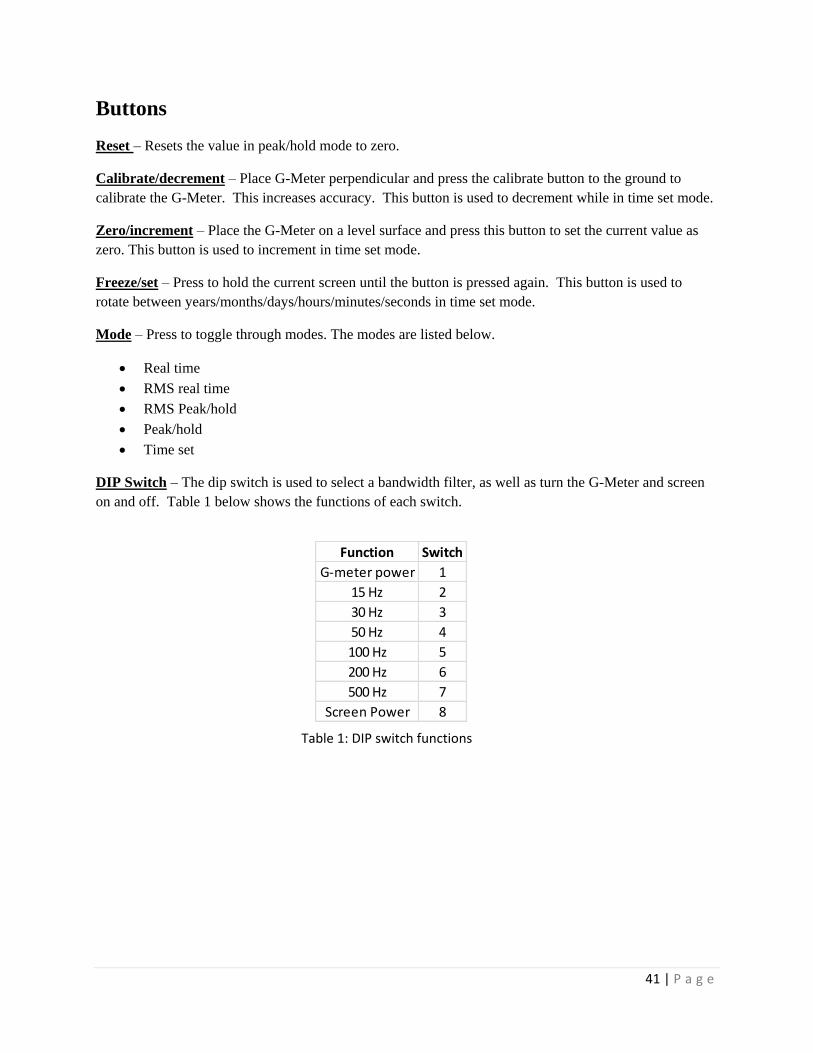
DIP Switch – The dip switch is used to select a bandwidth filter, as well as turn the G-Meter and screen
on and off. Table 1 below shows the functions of each switch.
Function Switch
G-meter power 1
15 Hz 2
30 Hz 3
50 Hz 4
100 Hz 5
200 Hz 6
500 Hz 7
Screen Power 8
Table 1: DIP switch functions