
The Future Prospects of the Turkish Energy Policy · The Future Prospects of the Turkish Energy ......
21
The Future Prospects of the Turkish Energy Policy Dr. Yurdakul Yiğitgüden Consultant, (Former Co - ordinator of OSCE Economic and Environment Activities, Organization for Security and Co - operation in Europe) 10. South East Europe Energy Dialogue Metropol Palace Hotel Belgrade, 13 - 14 June 2017
Transcript of The Future Prospects of the Turkish Energy Policy · The Future Prospects of the Turkish Energy ......

The Future Prospects of the Turkish Energy Policy
Dr. Yurdakul YiğitgüdenConsultant, (Former Co-ordinator of OSCE Economic and Environment
Activities, Organization for Security and Co-operation in Europe)
10. South East Europe Energy DialogueMetropol Palace Hotel Belgrade, 13-14 June 2017

The Future Prospects of the Turkish Energy Policy Turkish Economy
Primary Energy Demand of Turkey
Turkish Energy Strategy towards 2023
Sectoral Breakdown: Electricity
Sectoral Breakdown: Nat. Gas & Lignit
Sectoral Breakdown: Renewables
Sectoral Breakdown: Nuclear
Critical Evaluation of the Turkish Energy Strategy and Conclusions

Turkish Economy
Population: 79,8 Millionen
GDP(Bill USD): 859.0(2015), 857.3 (2016)
GDP growth(%): 6.1(2015), 2.9(2016)
Per capita income(USD): 10.743 (2016),
6. largest economy in Europe
17. largest economy of the world
Trade volume (Bill USD): 400(2014), 351(2015), 345(2016)
Consumer price index: 8,17(2014), 8,81(2015), 8,53 (2016)

Primary Energy Mix of Turkey(2015: 129.2 Mil. toe)Source:MENR
26,2%
6,9%30,7%
5,9%30,3%
N. Gas
Hydro+Wind+Solar
Oil
Coal
Others

Turkish Energy Strategy towards 2023
Utilization of indigenous and renewable energy resources
Diversification of energy supplying countries
Reduction of energy intensity by 20%
Introduction of nuclear energy into the energy mix

Sectoral Breakdown: Electricity SectorDemand increase 1980-1999: ~8,5; 2000-2009: ~5,1
Yıl Kurulu GüçMW
Artış %
TüketimGWh
Artış %
2005 38.844 5,5 160,794 7,2
2010 48.590 8,5 209,494 7,9
2014 69.520 4,4 257.220 4,4
2015 73.147 5,2 265.724 3,3
2016 78.497 7,3 278.346 4,8
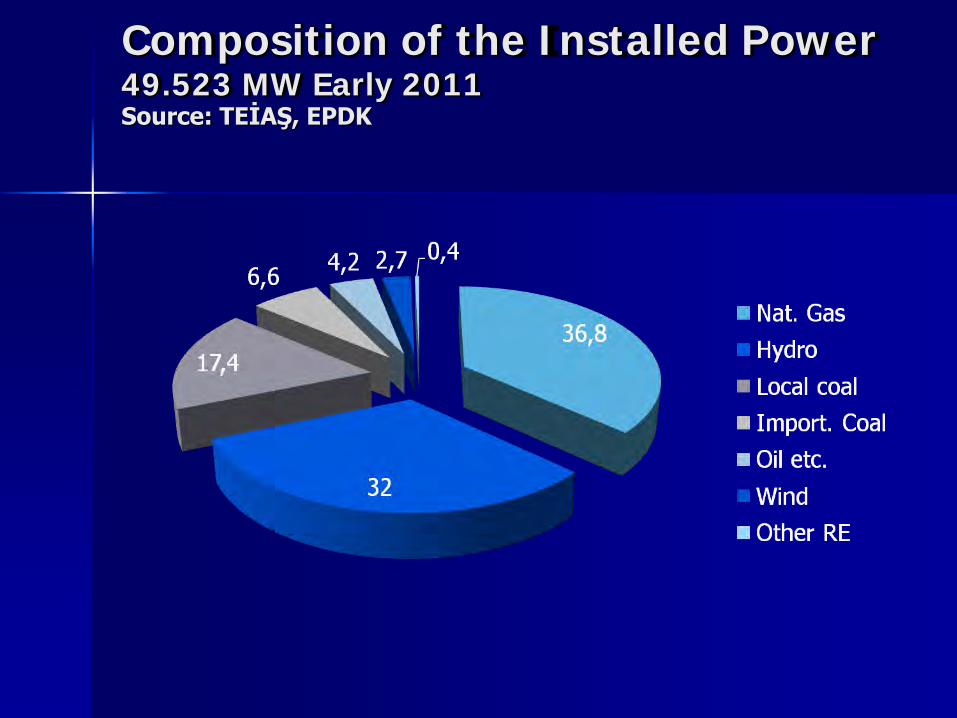
Composition of the Installed Power 49.523 MW Early 2011 Source: TEİAŞ, EPDK

Composition of the Installed Power 78.497 MW End of 2016 Source: TEİAŞ, EPDK
33,3
34
12,5
9,5
0,67,3
2,8
Nat. Gas
Hydro
Local coal
Import. Coal
Oil etc.
Wind
Other RE

Breakdown of Electricity Generation by Resources
2010: 210,2 TWh (Source:TEİAŞ, EPDK)
2016:273,4 TWhNat.Gas: 32,1%Hydro: 24,6%Wind+Solar+ Geothermal: 7,8%Coal: 33,8%
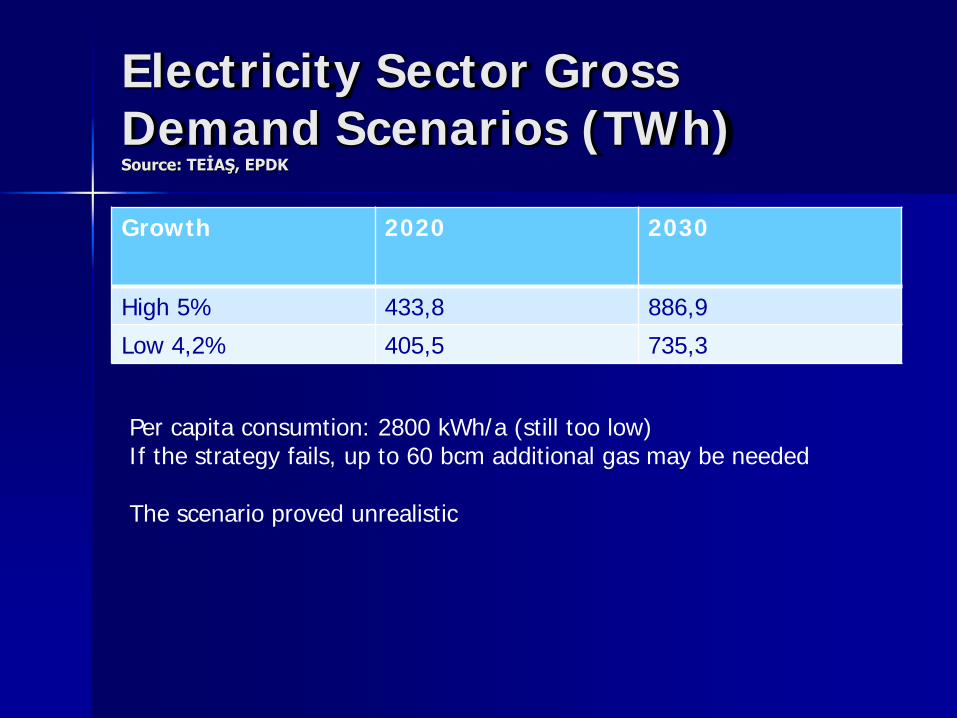
Electricity Sector Gross Demand Scenarios (TWh)Source: TEİAŞ, EPDK
Growth 2020 2030
High 5% 433,8 886,9
Low 4,2% 405,5 735,3
Per capita consumtion: 2800 kWh/a (still too low)If the strategy fails, up to 60 bcm additional gas may be needed
The scenario proved unrealistic
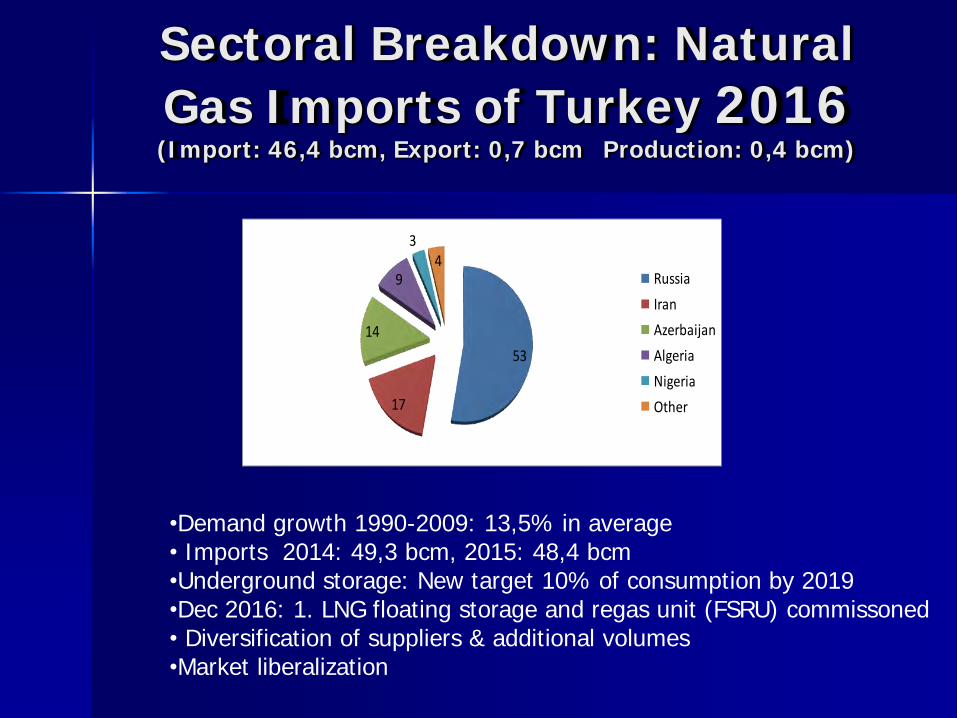
Sectoral Breakdown: Natural
Gas Imports of Turkey 2016(Import: 46,4 bcm, Export: 0,7 bcm Production: 0,4 bcm)
53
17
14
9
34
Russia
Iran
Azerbaijan
Algeria
Nigeria
Other
•Demand growth 1990-2009: 13,5% in average• Imports 2014: 49,3 bcm, 2015: 48,4 bcm•Underground storage: New target 10% of consumption by 2019•Dec 2016: 1. LNG floating storage and regas unit (FSRU) commissoned• Diversification of suppliers & additional volumes•Market liberalization

Sectoral Breakdown: Lignit(Source: ETKB, Thousend t/year)
120 milyar TWh/a electricity generation potential , utilization until 2023
2010: 8079 MW installed capacity(37% in operation
2016: 9055 MW installed capacity
11,5 bill t rezerve
Support for the private sector needed
An “Afşin-Elbistan basin low” needed

Sectoral Breakdown: HydroSource:ETKB, EPDK
140 TWh/a potentialEarly2011: 15.835 MW installed capacity(37% in operation)End of 2016: 26.681 MW installed capacity2023: 100% utilization targetStrong NGO opposition

Sectoral Breakdown: Wind2007: 27 MW2008: 433 MW2009: 800 MW2010: 1.329 MW2011: 1.729 MW2012: 2.2612013: 2.760 MW2014: 3630 MW2015: 4365 MW2016: 5751 MW
2023: 20.000 MW ?
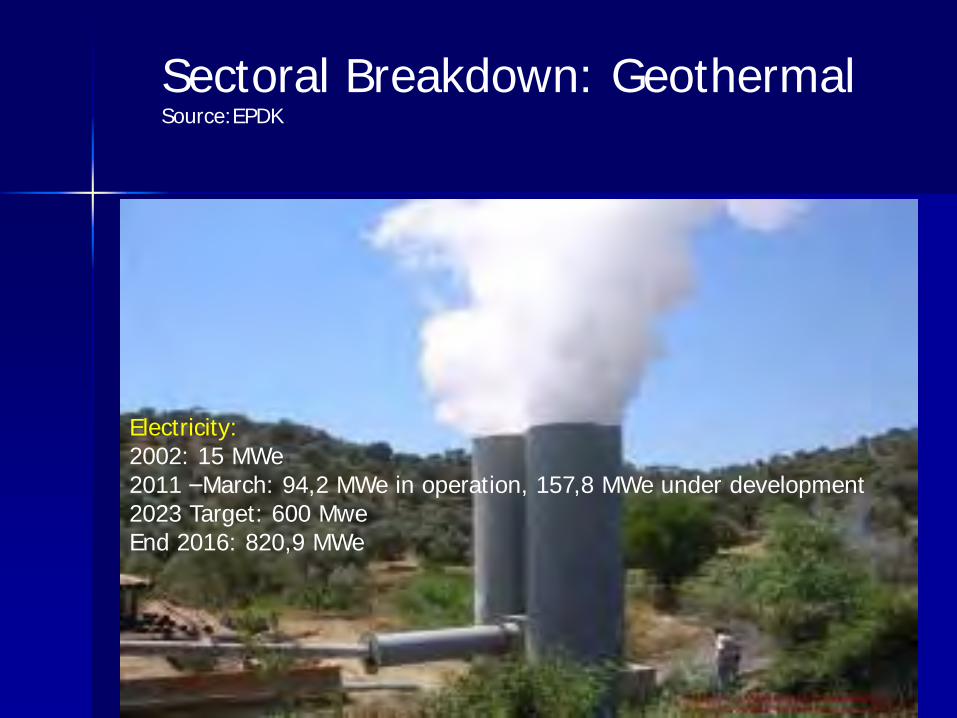
Sectoral Breakdown: GeothermalSource:EPDK
Electricity:2002: 15 MWe2011 –March: 94,2 MWe in operation, 157,8 MWe under development2023 Target: 600 MweEnd 2016: 820,9 MWe
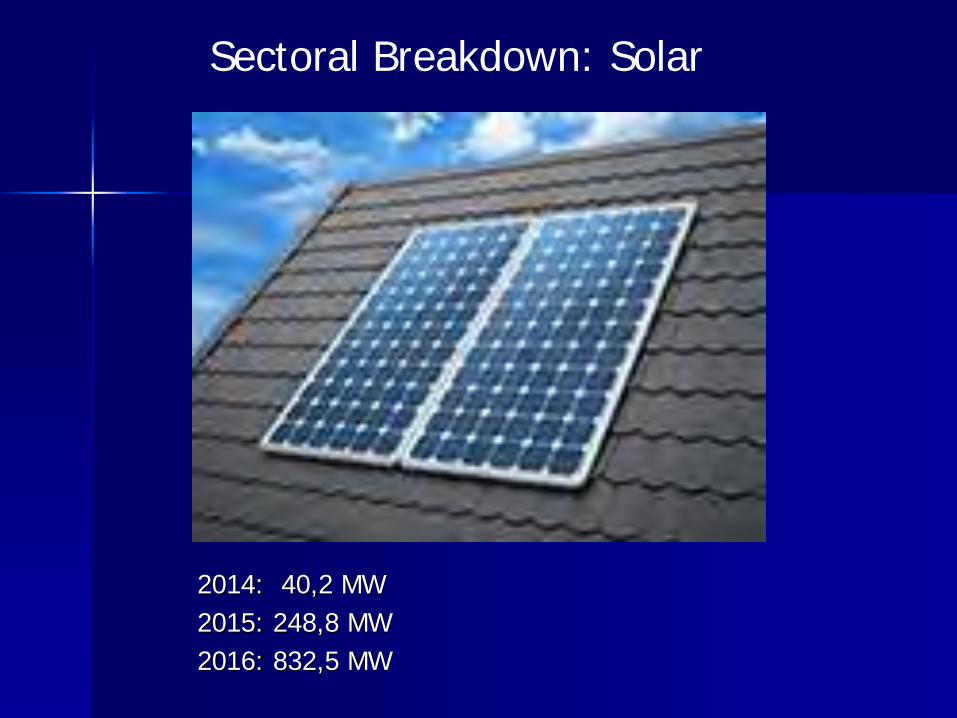
2014: 40,2 MW
2015: 248,8 MW
2016: 832,5 MW
Sectoral Breakdown: Solar
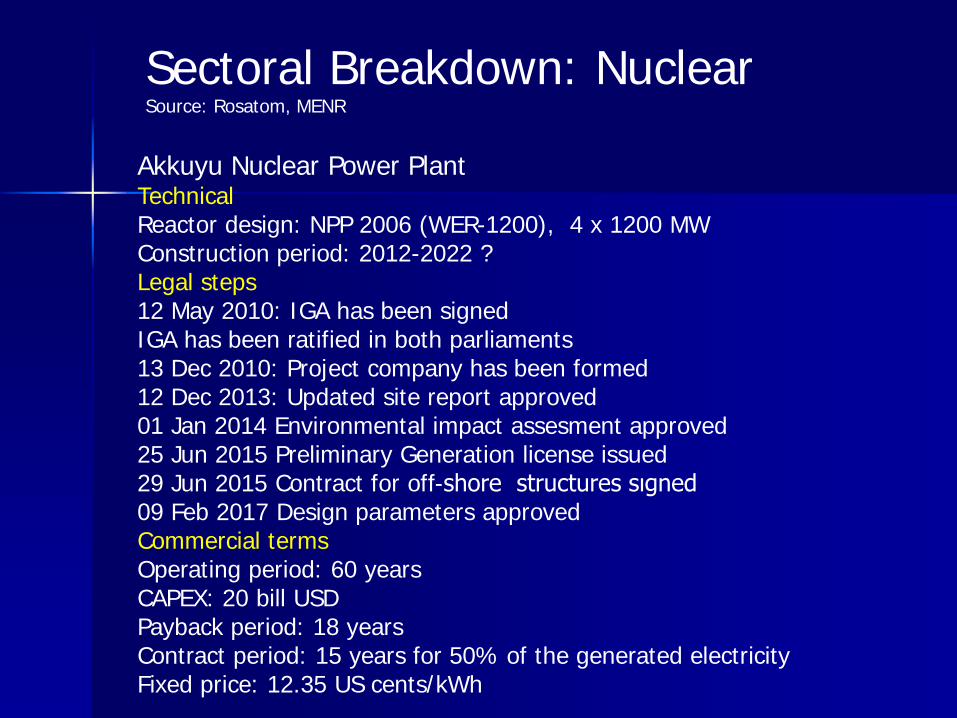
Sectoral Breakdown: NuclearSource: Rosatom, MENR
Akkuyu Nuclear Power PlantTechnicalReactor design: NPP 2006 (WER-1200), 4 x 1200 MWConstruction period: 2012-2022 ?Legal steps12 May 2010: IGA has been signedIGA has been ratified in both parliaments13 Dec 2010: Project company has been formed12 Dec 2013: Updated site report approved01 Jan 2014 Environmental impact assesment approved25 Jun 2015 Preliminary Generation license issued29 Jun 2015 Contract for off-shore structures sıgned09 Feb 2017 Design parameters approvedCommercial termsOperating period: 60 yearsCAPEX: 20 bill USDPayback period: 18 yearsContract period: 15 years for 50% of the generated electricityFixed price: 12.35 US cents/kWh

Sectoral Breakdown: NuclearSource: MENR
Sinop Nuclear Power Plant Project
Reactor Design: ATMEA-1 (4x1120 )Installed capacity: 4480 MWOperational period: 60 yearsCAPEX: 20 bill US $Project sponsors: Mitsubishi Heavy Ind, Itochu, Engie, EÜAŞOct 2013: IGA agreement with Japan signedProject site review to be ready Dec 2017Feasibility studies to be ready Mar 2018Construction start: 2023 ?
Iğneada (?) Nuclear Power Plant Project
Reactor Design: 2 x AP 1000, 2 x CAP 1400Project sponsors: SNPTC, Westinghouse

Critical Evaluation of the Turkish Energy Strategy towards 2023
My conclusions from 2011:Lignit: utilization of 120 TWh/a generation capacity (13.000 MW additional) until 2023 is not realistic; up to 4.000 MW may be realizedHydro: utilization of 140 TWh/a generation capacity (~40-45.000 MW) until 2023 is not realistic; up to 110 TWh/a in total may be utilizedWind: 20.000 MW until 2023 is not realistic; up to 15.000 MW may be realizedNuclear: 5% of the electricity generation from nuclear in 2020 is not realistic; up to 3% may be realizedEnergy Efficiency: Legislation in place, but incentives are not sufficient
Turkey will need additional gas supplies to meet the demand in 2023.
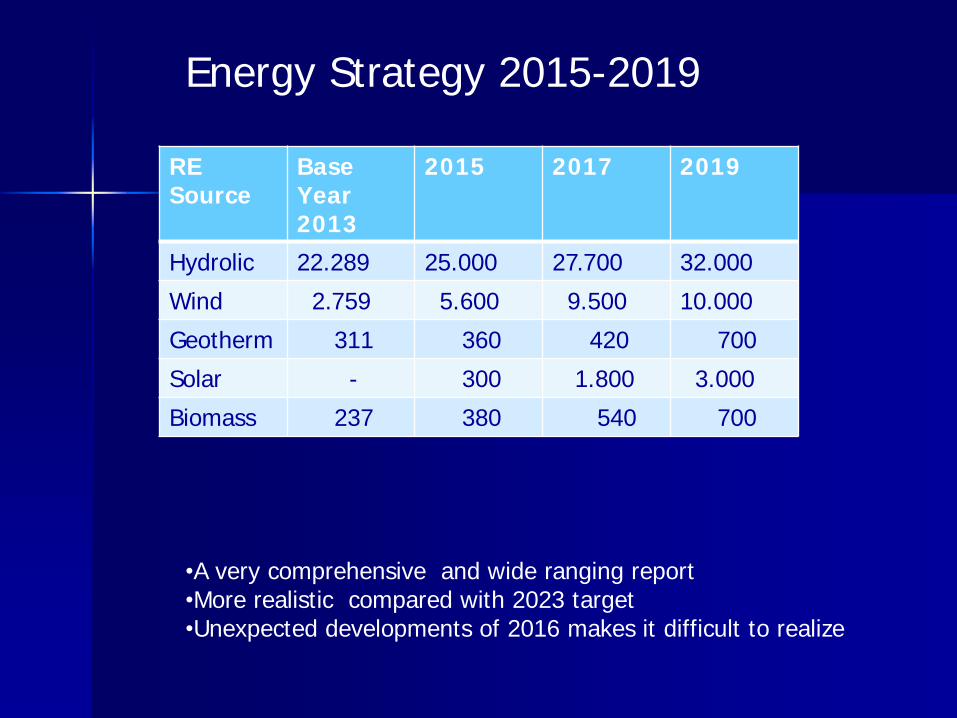
Energy Strategy 2015-2019
RE Source
Base Year 2013
2015 2017 2019
Hydrolic 22.289 25.000 27.700 32.000
Wind 2.759 5.600 9.500 10.000
Geotherm 311 360 420 700
Solar - 300 1.800 3.000
Biomass 237 380 540 700
•A very comprehensive and wide ranging report •More realistic compared with 2023 target•Unexpected developments of 2016 makes it difficult to realize