THE FUTURE OF WATER IN SAN ANTONIO: AN EVALUATION OF …
54
Hudock 1 THE FUTURE OF WATER IN SAN ANTONIO: AN EVALUATION OF WAYS TO MEET DEMAND BY 2070 Mathias Hudock TC 660H Plan II Honors Program The University of Texas at Austin 4/15/2019 __________________________________________ Katherine Lieberknecht School of Architecture Supervising Professor __________________________________________ David Spence School of Law Second Reader
Transcript of THE FUTURE OF WATER IN SAN ANTONIO: AN EVALUATION OF …

Hudock 1
THE FUTURE OF WATER IN SAN ANTONIO: AN EVALUATION OF WAYS
TO MEET DEMAND BY 2070
Mathias Hudock
TC 660H
Plan II Honors Program
The University of Texas at Austin
4/15/2019
__________________________________________
Katherine Lieberknecht
School of Architecture
Supervising Professor
__________________________________________
David Spence
School of Law
Second Reader

Hudock 2
ABSTRACT
Author: Mathias Hudock
Title: The Future of Water in San Antonio: An Evaluation of Ways to Meet Demand by 2070
Supervising Professors: Katherine Lieberknecht, David Spence
As climate change progresses, the city of San Antonio, Texas is likely to face increasing
stress on its water supplies. While the city’s water utility, the San Antonio Water System, has
planned several projects to bolster the city’s supplies, these are unlikely to be enough in the face
of San Antonio’s growing population and the future reduction of the Edwards Aquifer’s
recharge. As such, this article evaluates three additional options for meeting San Antonio’s
projected 2070 water demand according to their cost-efficiency, additional benefits and
drawbacks, and likeliness of gaining public acceptance. Making San Antonio’s drought-period
water restrictions permanent would only satisfy a fraction of the future water deficit, while either
city-wide rainwater harvesting or a new reservoir project would more than compensate for the
deficit. A reservoir project would be a far more cost-efficient option, while city-wide rainwater
harvesting would provide flood mitigation, avoid disrupting riparian habitat, and would be more
likely to be accepted by the residents of San Antonio, particularly in light of the earlier failed
Applewhite Dam and Reservoir Project. As such, city-wide rainwater harvesting was evaluated
as the most viable option, with a reservoir still being possible if San Antonio’s leaders could
successfully convince the public of its utility.

Hudock 3
Acknowledgements
I would like to thank my thesis supervisor, Dr. Katherine Lieberknecht, and my second-
reader, Dr. David Spence, for providing invaluable guidance in the process of researching this
thesis. In pointing out potential sources, aspects to explore, and ways to improve the thesis itself,
I could not have completed this project without them. I would also like to thank Karen Guz,
Conservation Director for the San Antonio Water System, for providing me access to reports and
information on water in San Antonio.

Hudock 4
Table of Contents
Introduction
Future Water Issues: 5
San Antonio’s Water Supply: 6-7
Future Supplies and Demand: 7-13
Purpose of this Paper: 14
Chapter 1: Permanent Water-Use Restrictions
Background: 15-16
Calculations: 17-18
Advantages and Disadvantages: 18-19
Mental Health Impacts: 19-23
Xeriscaping: 23-24
Compliance: 24-25
Conclusion: 25
Chapter 2: Rainwater Harvesting:
Background: 26-27
Calculations: 27-28
Drawbacks and Costs: 28-32
Public Acceptance: 32-34
Conclusion: 34
Chapter 3: Reservoirs
Background: 35-36
Cost-Benefit Comparison: 36-37
Primary Issues: 37-39
Public Messaging and the Applewhite Reservoir Project: 40-42
Conclusion: 42
Summary and Conclusions:
Future Demand: 43-44
Permanent Water-Use Restrictions: 44
Rainwater Harvesting: 45-46
Reservoirs: 46-47
Conclusion 47-48

Hudock 5
Introduction
Future Water Issues:
The Intergovernmental Panel on Climate Change (IPCC) has predicted that climate
change will have devastating consequences for much of the life on Earth. Among these
consequences are a number of incoming water-related issues, including increased flooding, more
frequent and severe droughts, and diminished water supplies (IPCC, 2014, pp. 1443-1444).
These problems are likely to be further exacerbated by increased water demand due to population
growth (IPCC, 2014, pp. 1456-1457) and expansion of impermeable cover due to urbanization
(IPCC, 2014, pp. 1471). These issues will be especially prominent in rapidly growing urban
areas, such as the major cities of the State of Texas, which are already prone to droughts, floods,
and water stress, making them particularly susceptible to the effects of climate change (Banner et
al., 2010, pp. 2).
As it is, the Texas drought of 2011 inflicted approximately $9 billion worth of
agricultural and fire-related damage in a single year (Nielsen-Gammon, 2012, pp. 94-95),
exceeding the severity of the previous record drought of the 1950s. Moreover, several droughts
of similar or greater severity and longer duration have occurred within the past millennium, one
of which affected most of North America (Banner et al., 2010, pp. 5). Even these droughts
occurred without the aid of anthropogenic climate change, and climate models indicate that
extreme droughts of that variety will become more common (Banner et al., 2010, pp. 9).
Altogether, without careful planning, the citizens of Texas will find their State increasingly
wracked by “serious social, economic, and environmental consequences” (Banner et al, 2010, pp.
2).

Hudock 6
San Antonio’s Water Supply:
Among the major water-stressed cities of Texas is San Antonio. Originally built around
the San Antonio River, the city of San Antonio has long since become dependent on the
limestone-based Edwards Aquifer beneath it. Until the late 19th century, the Edwards Aquifer
was only tapped via its springs, but artesian wells for irrigation started being drilled in 1884, and
by the 1950s, the Edwards Aquifer had become the primary water supply for San Antonio
(Griffin, 2010, pp. 79). The primary reasons for San Antonio’s reliance on the Edwards Aquifer
were the aquifer’s high water quality and high water quantity (Griffin, 2010, pp. 79). Being
contained underground, within an aquifer, the water is protected from many pollutants that
would normally affect surface waters, and the sheer size of the Edwards Aquifer has allowed it to
service an entire city.
However, the record drought of the 1950s and San Antonio’s rapid population growth
made it apparent that the Edwards Aquifer was not an unlimited supply of water (Blanchard-
Boehm et al., 2008, pp. 296). From Ronald C. Griffin’s book Water Policy in Texas: Response to
the Rise of Scarcity (2010):
Until the drought of record (1947– 1957), the aquifer was so prolific, and
consumption so minimal, that pumping from wells appears to have made little
difference in spring discharge. Today, however, many of the springs, such as San
Antonio Springs, rarely flow unless a flood event fills the aquifer. (pp. 79)
This reduction in spring flow can have significant consequences for the eight threatened
and endangered species reliant on it (U.S. Global Change Research Program, 2018); moreover,
according to Griffin (2010), increased pumping may increase the risk of saltwater encroachment:
The possibility of saline water encroachment has been a concern since the latter
years of the drought of record in the 1950s, when residents reported that some
freshwater wells on the southern edge of the aquifer experienced an intrusion of
highly mineralized water. The bad-water line exists in close proximity to both
Comal and San Marcos Springs where endangered aquatic species reside. The
Hudock 7
potential intrusion of saline water into the springs or groundwater wells during a
prolonged drought could have dire consequences for the survival of spring-
dependent biota and for groundwater users. (pp. 83)
To make matters worse, Griffin (2010) points out that recent concerns over spring-flow
and aquifer levels have been occurring during a period of relatively high aquifer recharge:
Since the 1960s, the Edwards Aquifer region generally has been in a wet
cycle…This period of generally high recharge, during which withdrawals from
the aquifer have reached their highest levels, eventually will be supplanted by an
extended period of moderate to low recharge. In fact, the patterns of rainfall
during the 1990s and 2000s have shown similarities in that record high, or near
record high, recharge years preceded significantly dry years, providing high
aquifer levels at the onset of drought. Also, each period was followed by a very
high recharge year that allowed water levels in the aquifer to recover rapidly and
rebound to above-average levels. Much of the population growth in the Edwards
Aquifer region has occurred during the wet cycle that has characterized the last
three decades, and the populace has been generally accustomed to a water surplus.
During this same wet period, the Texas legislature has increased the maximum
amount of water that can be pumped from the aquifer (pp. 85).
In other words, San Antonio is currently facing water stress, reduced spring-flows, and
periodic droughts despite the fact that the region is actually experiencing a wet period; this
indicates that conditions may become extreme as climate change inevitably ends the wet period
and strains water supplies even further than they were prior to the wet period. Consequently, the
city of San Antonio has made multiple attempts to diversify its water sources. While the city
failed to complete surface-water projects such as the Applewhite Dam and Reservoir project, San
Antonio ultimately succeeded in instituting water conservation initiatives and developing new
sources of water, such as a recently-finished desalination plant that enables the city to exploit
brackish groundwater from the Carrizo-Wilcox Aquifer and elsewhere in Bexar county (San
Antonio Water System, 2017, pp. 11).

Hudock 8
Future Supplies and Demand:
Even so, San Antonio’s water supplies will continue to be stressed in the future. By 2070
(the furthest into the future that the San Antonio Water System’s planning extends), the city of
San Antonio’s population will likely have almost doubled (San Antonio Water System, 2017, pp.
26), and growth in the future will account for an increase in water demand of 27.1% (San
Antonio Water System, 2017, pp. 38), and this is assuming that the San Antonio Water System
succeeds in lowering water use per capita to target levels. If the target of 88 gallons per capita
per day (a reduction of 29 gallons per capita per day from the current 117 gallons per capita per
day) is not met by 2070, water demand may increase by as much as 70.8% from population
growth alone (San Antonio Water System, 2017, pp. 38).
In all fairness, the San Antonio Water System has made substantial gains in water use
reductions in the past; in 1982, San Antonio used 225 gallons per capita per day, about twice the
current figure (San Antonio Water System, 2017, pp. 28). This large reduction has been the
result of the San Antonio Water System’s structure of water-conservation education and
incentives, encouraging the use of drought-resistant vegetation in yards, efficient irrigation
systems, low-flow water fixtures indoors, frequent repairs for water leaks, water-management
technology for commercial landscapes, and requiring the owners of large landscapes to perform
annual Irrigation Checkup analyses (San Antonio Water System, 2017, pp. 29-35). Still, the San
Antonio Water System admits that future water-use patterns can be difficult to predict (San
Antonio Water System. 2017, pp. 29), and climate change threatens to introduce additional
water-supply stresses beyond flat increases due to population growth. As such, the San Antonio
Water System has drafted plans to develop and exploit additional water sources in the future
(San Antonio Water System, 2017, pp. 49).

Hudock 9
The San Antonio Water System’s mid-term plan is to expand the capacity of their
H2Oaks desalination plant; as it is, the facility is capable of treating a total 30 million gallons of
water per day, though it currently produces only 12 million gallons per day, and the San Antonio
Water System plans to expand the facility to double its treatment capacity to 60 million gallons
per day (San Antonio Water System, 2017, pp. 49-50). In addition to other sources, the plant
treats brackish water from the Carrizo-Wilcox Aquifer (San Antonio Water System, 2017, pp.
49-50), a quartz sand-based aquifer (in contrast to the limestone structure of the Edwards
Aquifer) that stretches across Texas (Telfeyan et al., 2015, pp. 66). The Carrizo-Wilcox Aquifer
also serves as a source of freshwater, with the exploitation of its brackish water being a more
recent development.
According to their 2017 Water Management Plan, the desalination plant was constructed
with the possibility of future expansion in mind, and management of the facility has yielded
insights into the Carrizo-Wilcox Aquifer and how best to treat its water. As such, the San
Antonio Water System is confident in its ability to double the facility’s treatment capacity by
2040 (San Antonio Water System, 2017, pp. 50), but this expanded production alone is not
predicted to be sufficient to meet San Antonio’s future water needs. As a result, the San Antonio
Water System has planned to make further expansions to its water projects that will require
purchasing water from the Carrizo/Simsboro Aquifer, tapping brackish water sources outside of
Bexar County and sourcing even more brackish groundwater from the Carrizo-Wilcox Aquifer
(San Antonio Water System, 2017, pp. 42-52).
By 2025, a pipeline carrying water from Burleson County will deliver up to 50,000 acre-
feet of water per year (San Antonio Water System, 2017, pp. 42). The pumping of that water will
be handled by Vista Ridge LLC (San Antonio Water System, 2017, pp. 42), a water

Hudock 10
infrastructure company. Between 2041 and 2070, the San Antonio Water System plans to put
the 60 million gallons of water per day capacity of the desalination plant to greater use (San
Antonio Water System, 2017, pp. 51-52). In order to gain access to more brackish groundwater
from the Carrizo-Wilcox Aquifer, the aquifer will be tapped at other properties near the H2Oaks
desalination plant, thus providing almost another 19 million gallons of water per day (San
Antonio Water System, 2017, pp. 51). The San Antonio Water System’s second approach to
developing additional water sources will be to drill wells outside of the county, which may prove
difficult in terms of gaining the requisite permits; regardless, the San Antonio Water System
assumes for the purposes of its planning reports that it will be successful in providing eight
million gallons of water per day from sources outside of Bexar County (San Antonio Water
System, 2017, pp. 51).
Regarding the impacts of climate change on the city’s water supply, the San Antonio
Water System is fairly optimistic. In the 13th chapter of their 2017 Water Management Plan, the
following is said on San Antonio’s resilience to climate change:
SAWS supplies are relatively resilient to changing climatic conditions, due in part
to an already diverse water portfolio. Many water utilities across the country are
analyzing how reductions in snowpack and rising sea levels might impact them.
SAWS is not directly affected by those phenomena. The majority of municipal
water supplies delivered in the U.S. are from surface water, and those utilities are
having to mitigate against increasing evaporation. Less than 10 percent of SAWS’
supply portfolio comes from surface water. In fact, SAWS built the largest
groundwater-based Aquifer Storage & Recovery system in the country over 10
years ago, which has a storage capacity almost the size of Medina Lake, but
without the risk of evaporative loss…The Edwards Aquifer remains a reliable
resource for agriculture, water supply, and the environment for south central
Texas, now and into the future. (pp. 58-59)
The report goes on to say that increased severity and frequency in future droughts and
floods is likely to result in San Antonio’s water supply being “relatively mitigated…but every
water utility will face operational challenges associated with changes in climatic conditions.”

Hudock 11
(San Antonio Water System, 2017, pp. 60). The chapter makes no mention of precisely how
much water San Antonio is projected to lose, nor figures for future declines in precipitation or
aquifer recharge, only assurances that San Antonio will be able to weather future problems
caused by climate change. In contrast to the San Antonio Water System’s confidence in the
resilience of the Edwards Aquifer, the U.S. Global Change Research Program’s Fourth National
Climate Assessment claims that “Key characteristics of the Edwards Aquifer, such as relative
shallowness and karst features, make it vulnerable to the impacts of both climate variability and
climate change.” (U.S. Global Change Research Program, 2018, pp. 1002) In the interest of
preparing for the worst-case scenario, it would likely be best for San Antonio to consider the
perspective of the National Climate Assessment and other projections of climate change impacts
on the city’s water supply.
As pointed out in Climate Change Impacts on Texas Water: A White Paper Assessment of
the Past, Present and Future and Recommendations for Action (Banner et al, 2010): “The future
of Texas’ water supplies is difficult to predict with confidence because of the large number of
factors that influence precipitation and water storage,” (pp. 3) and “The high variability and
uncertainty in the precipitation forecasts for Texas over the 21st century…suggest that climate
change impacts on water availability would be difficult to project.” (pp. 10) This apparent
difficulty in determining the exact future effects of climate change on water supplies may be why
exact figures are omitted from the San Antonio Water System’s 2017 Water Management Plan,
but it is reasonable to assume that water supplies will decline and that new water projects must
account for such declines. Fortunately, while projections of this variety are rare, there are a few
projections available that quantitatively describe the future effects of climate change on the
Edwards Aquifer’s water.

Hudock 12
Effects of Climatic Change on a Water Dependent Regional Economy: A Study of the
Texas Edwards Aquifer is a 2001 article written as a contribution to an early National Climate
Assessment (Chen et al., 2001, pp. 397). Although the article’s data is almost two decades old,
specific climate change projections for the Edwards Aquifer’s recharge otherwise do not seem to
exist; consequently, this thesis will use the article for determining future declines in San
Antonio’s water resources. Chen et al. used climate data from the U.S. Global Change Research
Program, which in turn was based on two global climate models (GCM), the Canadian Climate
Center (CCC) Model and the Hadley Climate Center (HCC) Model (Chen et al., 2001, pp. 398).
Chen et al. specifically selected “The results from the CCC and HAD models for the GCM grid
cell in which the EA region climate falls…” (Chen et al., 2001, pp. 398) Suffice to say, given
that the article’s data is based on a single grid cell on a global climate model, the results are
unlikely to be especially accurate, but again, this appears to be the most precise data available for
the Edwards Aquifer.
Based on global climate model data, Chen et al. estimated that the Edwards Aquifer
would experience a reduction in recharge of 31.96% to 48.86% by the year 2090, depending on
whether it will be a drought, normal, or wet year (Chen et al., 2001, 400). For the purposes of
this thesis, 2070 is being used as the benchmark year, so a 30% reduction in recharge will be
assumed for the Edwards Aquifer. Acre-feet will be used as the unit of volume for all
calculations, as it is a standard unit for measuring large quantities of water. In particular, water
production rate will be given in terms of acre-feet per year.
Knowing the Edwards Aquifer’s future recharge reduction, the projected water
production from future water projects, current production, and future demand projections, the net
water deficit or surplus for 2070 can be estimated. The San Antonio Water System plans to

Hudock 13
maintain pumping levels from the Edwards Aquifer at 281,000 acre-feet per year through the
mid-term (San Antonio Water System, 2017, 49), though the Edwards Aquifer’s reduced
recharge will ultimately require this rate to adjusted in order to maintain spring flows and
prevent the aquifer from being depleted; a 30% reduction in the pumping rate yields 196,700
acre-feet per year from the Edwards Aquifer. The Vista Ridge pipeline will add 50,000 acre-feet
per year to amount, giving 246,700 acre-feet per year. By 2070, the H2Oaks desalination plant
should produce about 54,604 acre-feet per year (converted from the million gallons per day
figure), bringing water production up to 301,304 acre-feet per year. This total falls short of the
324,000 acre-feet per year that the city is projected to consume by 2070 (San Antonio Water
System, 2017, pp. 38), giving a total water deficit of 22,696 acre-feet per year.
On top of this deficit, water production may be further reduced in the future. As
mentioned previously, springs connected to the Edwards Aquifer have faced significantly
reduced flows that may threaten already endangered species. In the interest of increasing spring
flows, total pumping from the Edwards Aquifer (including from outside of San Antonio) would
need to be reduced by about 150,000 acre-feet per year (Griffin, 2012, pp. 81-93). Given that San
Antonio is responsible for roughly half of the current pumping from the Edwards Aquifer, the
city alone would theoretically be responsible for 75,000 acre-feet per year, which would increase
San Antonio’s water deficit to almost 100,000 acre-feet per year.

Hudock 14
Table 1: 2070 Water Projections Summary
Planned Water Production 385,604 acre-feet/year
Planned Water Production
(adjusted for reduced aquifer recharge) 301,304 acre-feet/year
Planned Water Production
(adjusted for spring-flow restoration) 226,304 acre-feet/year
Projected Water Demand 324,00 acre-feet/year
Water Deficit 22,696 acre-feet/year
Water Deficit
(adjusted for spring-flow restoration) 97,696 acre-feet/year
Purpose of this Paper:
Based on the above calculations, it is evident that San Antonio may face a water crisis in
the future. Moreover, Texas may continue to become drier well-past 2070, depending on the
efficacy of environmental measures taken by that time. As such, San Antonio will likely need
even more water projects in order to meet demand and perhaps increase spring flows. The
remainder of this thesis will be dedicated to evaluating three possible means of increasing San
Antonio’s water supply according to each method’s cost, water savings/production, and
additional ramifications or benefits. These methods include: implementing year-round water
restrictions of the variety that are normally used in response to droughts; subsidizing rainfall
collection systems for houses across the city, a measure taken by a number of water-stressed
cities outside of the United States; and developing sources of surface water, in the manner of the
failed Applewhite Dam and Reservoir Project. One or more of these methods will be
recommended as a means to counter San Antonio’s future water deficit, depending on which
have the lowest cost-to-water-production ratio, acceptable side-effects or benefits, and the
difficulty of convincing the public to accept them.
Hudock 15
Chapter 1: Permanent Water-Use Restrictions
Background
The San Antonio Water System has placed restrictions on landscape irrigation at various
points in the past few decades (San Antonio Water System, 2017, Appendix) as a means of
combating the drought conditions that intermittently strike San Antonio. Specifically, these
measures restrict the frequency and times during which irrigations systems or sprinklers may be
used to water landscapes, though irrigation with hand-held hoses remains unrestricted (“Drought
Restrictions”, n.d.). There are four levels of watering restrictions, in order of increasing severity,
with stages one and two being the most commonly used.
The San Antonio Water System website lists each water restriction stage on its website
(“Drought Restrictions”, n.d.); the conditions of each stage are listed in Table 1. Permanent water
restrictions have not yet been implemented, but permanent Stage 1 water restrictions have been
considered as long-term water conservation measure, and the idea has previously been supported
by “…various community and elected leaders for a range of policy reasons.” (San Antonio Water
System, 2017, pp. 37) This possibility raises the question of just how much water San Antonio
could save by implementing permanent water restrictions; while Stage 1 restrictions have
generally been implemented for relatively brief periods of time and thus have generated limited
data, Stage 2 water restrictions have typically lasted longer, and more data has been collected on
them (San Antonio Water System, 2017, Appendix). As a result, the San Antonio Water System
has been able to calculate the amount of water that year-round Stage 2 water restrictions would
save outside of drought conditions (San Antonio Water System, 2017, Appendix).

Hudock 16
Table 2: San Antonio Drought Restrictions (“Drought Restrictions”, n.d.)
Stages Trigger Restrictions
Stage 1 Aquifer Level at 660 ft. Outdoor commercial fountains require an
exemption to operate; landscape irrigation is
only allowed once per week, on a day
designated according to one's home address,
and only between 12:00 am-11:00 am or
7:00pm-12:00 am, though hand and drip
irrigation are still allowed; leaks must be
repaired; water cannot be allowed "to run off
into a gutter, ditch, or drain"; private
swimming pools must be covered when they
are not in use; "Washing impervious
cover...is prohibited."; outside of commercial
car-washing facilities, cars may only be
washed once per week on Saturday or
Sunday; "Operators of golf courses, athletic
fields and parks must submit a conservation
plan to SAWS." and "...may not irrigate
between the hours of 11 a.m. and 7 p.m.";
portions of golf courses that are not played
on are subject to the previously-mentioned
landscape irrigation restrictions.
Stage 2 Aquifer Level at 650 ft. Includes all of the stipulations of Stage 1
restrictions; landscape irrigation is further
limited to 7 am-11 am or 7 pm -11 pm; drip
or bucket irrigation is allowed on any day,
but limited to the aforementioned hours;
"Hotels, motels and other lodging must offer
and clearly notify guests of a "linen/towel
change on request only" program."

Hudock 17
Stage 3 Aquifer Level at 640 ft. Includes all of the stipulations of Stage 1 and
2 restrictions; landscape irrigation is further
limited to once every other week, and may
be prohibited by the city on any particular
week; drip irrigation is limited to Mondays,
Wednesdays, and Fridays; "Operators of golf
courses, athletic fields and parks must reduce
watering per city ordinance."; "Hotels,
motels and other lodging must limit
linen/towel changes to once every three
nights..."
Stage 4 City Unable to Meet
Demand
Includes all of the stipulations of Stage 1, 2,
and 3 restrictions; a drought surcharge is
added onto landscape irrigation; the city
council may implement additional
restrictions.
Calculations
The San Antonio Water System’s general strategy in calculating water savings from
Stage 2 restrictions was to first calculate daily pumping per capita values for time frames when
Stage 2 water restrictions were in effect, develop a model based on the results, and then compare
the pumping rates projected by the model to actual pumping for periods when water restrictions
were not in place (San Antonio Water System, 2017, Appendix). The Stage 2 restricted model
included several variables, such as how many of the past 10 days exceeded 90 degrees
Fahrenheit, days since the last significant precipitation event, evapotranspiration, dollars charged
by residential water meters, and precipitation in the last 50 days (San Antonio Water System,
2017, Appendix). This model fit well with actual pumping rates for periods with Stage 2 water
restrictions, and comparison with actual pumping for periods without water restrictions indicated
that year-round Stage 2 water restrictions would yield average water savings of 1.25% in non-
drought years (San Antonio Water System, 2017, Appendix). However, no water savings would

Hudock 18
occur during drought years, likely because parts of those years would already be under Stage 2
restrictions and because residents tend to continue saving water outside of those restricted
periods (San Antonio Water System, 2017, Appendix).
Assuming that water savings from Stage 2 restrictions remain the same in the next 50
years, the water savings from year-round Stage 2 restrictions would be 1.25% of the 324,000
acre-feet per year projected water demand for 2070, or 4,050 acre-feet per year. This would
compensate for approximate 17.8% of the projected water deficit of 22,696 acre-feet per year,
bringing it down to 18,646 acre-feet per year. In theory, Stage 3 water restrictions would roughly
double these savings, as Stage 3 restrictions halve the allowed frequency of residential landscape
irrigation and place other restrictions on hotels, parks, golf courses, and athletic fields (“Drought
Restrictions”, n.d.), yielding savings of roughly 8,100 acre-feet per year, or 35.6% of the
projected deficit.
Advantages and Disadvantages
The primary advantage of this approach to water conservation, and likely the reason for
its popularity among decision-makers, is that there is no direct cost involved. While large-scale
water projects such as desalination plants, pumping from new locations, or the two approaches
that will be evaluated later on require substantial funds that may otherwise go to other municipal
services, year-round water restrictions would remove a significant fraction of the projected water
deficit for 2070 without digging into San Antonio’s budget. Moreover, year-round water
restrictions would reduce peak demand and thus reduce strain on water distribution systems.
However, this approach also has a few drawbacks. First, according to the previous
calculations, the water savings from this approach would be insufficient to balance out the
projected water deficit, meaning that one of other measures evaluated in this paper would have to
Hudock 19
be taken anyway. Second, the calculated savings are only for non-drought years, as water
restrictions would be in place during drought periods anyway, and as climate change increases
the frequency and severity of droughts in Texas (Banner et al., 2010, pp. 9) (IPCC, 2014, pp.
1443-1444), the benefits of year-round restrictions will dwindle, as larger lengths of time would
have water restrictions regardless of a permanent policy. Third, as the San Antonio Water
System works to promote xeriscaping, more efficient irrigation systems, and other water-
conservation measures among consumers, water restrictions may become less relevant and less
effective. In addition to these problems, year-round water restrictions may pose a slight mental-
health risk to the residents of San Antonio.
Mental Health Impacts
Urbanization continues to bring more people to cities across the world (Kondo et al.,
2018, pp. 1), and as more of the world’s population finds itself away from the countryside,
researchers have become interested in how urban “green spaces” may affect mental health. While
results have varied across different studies, greenery does appear to have a positive effect,
though the magnitude and nature of this effect is debated (Kondo et al., 2018) (Astell-Burt et al.,
2013) (de Vries et al., 2013) (Gubbels et al., 2016). For example, one study found that urban
green spaces grant inconsistent benefits to residents in areas of low socioeconomic status
(Gubbels et al., 2016), another found that green spaces primarily improve mental health by
reducing stress and aiding social cohesion (de Vries et al., 2013), a third found that green spaces
play a vital role in encouraging older people to exercise and improved their mental health
(Astell-Burt et al., 2013), a fourth found that green spaces were associated with significantly
lower rates of multiple mental disorders (Beyer et al., 2014), and a fifth “…found consistent
negative association between urban green space exposure and mortality, heart rate, and violence,

Hudock 20
and positive association with attention, mood, and physical activity” and no association between
stress and green spaces (Kondo et al., 2018, pp. 1).
In the first study, “The impact of greenery on physical activity and mental health of
adolescent and adult residents of deprived neighborhoods: A longitudinal study”, online
questionnaires were sent to adolescents and adults in twenty impoverished Dutch districts
(Gubbels et al., 2016, pp. 154). 994 adolescents and 727 adults responded, answering questions
about the greenery in their neighborhoods, their levels of physical activity, if they experienced
certain symptoms of depression, perceptions of the green spaces around them, and demographic
and socioeconomic characteristics (Gubbels et al., 2016, pp. 154-155). Statistical analysis of the
resulting data indicated that greenery encouraged better-educated adolescents and adults to
exercise more and reduced depressive symptoms in adults, though these effects were relatively
small and inconsistent, with less-educated adolescents deriving few benefits from the greenery
(Gubbels et al., 2016, pp. 158-159).
In the second study, “Streetscape greenery and health: Stress, social cohesion and
physical activity as mediators”, eighty neighborhoods across four Dutch cities were assessed by
the researchers in terms of the quantity and quality of greenery in each neighborhood (de Vries et
al., 2013, pp. 27-28). Next, questionnaires were mailed to 8000 randomly selected residents, out
of which 1641 answered (de Vries et al., 2013, pp. 28). The questionnaire included questions
about residents’ perceived health and indicators of health, indicators of stress, indicators of social
cohesion, indicators of physical activity, and socioeconomic and demographic characteristics (de
Vries et al., 2013, pp. 28). Statistical analysis indicated that higher quantity and quality of
greenery in neighborhoods was associated with greater social cohesion, lower stress, and more
physical activity, which, in turn, were associated with improved health; social cohesion appeared

Hudock 21
to be the primary contributing factor to improvements in mental health (de Vries et al., 2013, pp.
29-31).
The third study, “Mental health benefits of neighbourhood green space are stronger
among physically active adults in middle-to-older age: Evidence from 260,061 Australians”, first
gathered data from 260,061 participants in the 45 and Up Study, a study examining
psychological distress among Australian in New South Wales between 45 and 106 years old
(Astell-Burt et al., 2013, pp. 602). This was combined with data from the Australian Bureau of
Statistics on land use in “meshblocks”, administrative units containing roughly 100 residents
each, and data on physical activity from the Active Australia Survey (Astell-Burt et al., 2013, pp.
602). Altogether, this data provided information on which areas contained more greenspace, the
psychological condition of residents from these areas, and the degree to which they were
physically active (Astell-Burt et al., 2013, pp. 602). The results indicated that while greener
spaces were associated with lower levels of psychological distress, this was only the case for
individuals who also exercised (Astell-Burt et al., 2013, pp. 602), potentially meaning that older
individuals’ mental health benefits when they are able to exercise in green spaces.
In the fourth study, “Exposure to Neighborhood Green Space and Mental Health:
Evidence from the Survey of the Health of Wisconsin”, analyzed data from 2,476 individuals
who participated in the Survey of the Health of Wisconsin, which includes geocoded information
from “…interviews, physical exams, and biospecimens…” (Beyer et al., 2014, pp. 3456). The
data was analyzed for symptoms of depression, anxiety, and stress (Beyer et al., 2014, pp. 3456),
and Landsat satellite imagery of the associated areas was analyzed using the normalized
difference vegetation index in order to determine the amount of greenery in each census block
(Beyer et al., 2014, pp. 3458). In addition to the satellite analysis, data from the National Land

Hudock 22
Cover database was included as a measure of tree canopy coverage (Beyer et al., 2014, pp.
3459). Statistical analysis of the data indicated that “Neighborhood green space was consistently
associated with lower levels of depression, anxiety and stress, when controlling for all individual
and neighborhood characteristics…”, with greenspace’s association with lower levels of
depression being especially strong (Beyer et al., 2014, pp. 3465).
The final article, “Urban Green Space and Its Impact on Human Health”, is a literature
review of 68 different studies intended to evaluate the relationship between greenspace and
overall health (Kondo et al., 2018, pp. 1-3), as opposed to the previously mentioned studies,
which focused on mental health. The publication dates of the reviewed studies ranged from
1991-2017, and the studies were selected according to methodology, specificity to urban settings,
and use objective measurements of greenspace (Kondo et al., 2018, pp. 2-3). The studies
indicated that greenspaces are associated with some improvements in cardiovascular health,
physical activity, cognitive performance, mood, mitigation of depression, and reductions in
mortality and violence (Kondo et al., 2018, pp. 13-23). On the other hand, greenspaces were not
directly associated with improvements in metabolic health, respiratory health, birth outcomes, or
reductions and cancer (Kondo et al., 2018, pp. 13-20). Moreover, the studies that examined the
relationship between greenspaces help alleviate stress had mixed results (Kondo et al., 2018, pp.
17).
Overall, these studies provide evidence that greenery in urban neighborhoods contributes
to mental health and physical activity. This suggests that implementing long-term watering
restrictions in San Antonio or any other water-stressed city could have a minor but detrimental
effect on the well-being of its residents, as fewer plants would be able to survive in residential
yards and other landscapes with reduced watering. Moreover, Stage 3 watering restrictions

Hudock 23
would even restrict drip irrigation and watering in parks, athletic fields, and golf courses, further
decreasing the quality of available greenspaces. Thus, year-round water restrictions may not be
worth the water savings, and residents of San Antonio may oppose Stage 2 or 3 year-round
watering restrictions out of health or aesthetic concerns. Still, there are ways in which these
health impacts could be minimized.
Xeriscaping
The simplest way to maintain the presence of greenery while still cutting back on
landscape irrigation would be xeriscaping. Xeriscape turf is an alternative to standard landscapes
that often use water-inefficient plants and spray irrigation; Xeriscape instead uses native,
drought-resistant and water-efficient plants alongside more efficient irrigation, mulching, and
other water-conservation measures (Sovocool et al., 2006, pp. 82). The study “An in-depth
investigation of Xeriscape as a water conservation measure” investigated the efficacy of
xeriscaping in Southern Nevada by monitoring water use and expenditures in several hundred
properties, some with turf and some with Xeriscapes (Sovocool et al., 2006, pp. 83-84).
Xeriscaped homes experienced 30-76% water savings and cost annual savings of 54%, in
addition to a reduction in the amount of labor required to maintain the landscapes (Sovocool et
al., 2006, pp. 93).
The San Antonio Water System already offers incentives for residents to xeriscape their
lawns, and this encouragement of xeriscaping is actually part of their long-term water
conservation strategy (San Antonio Water System, 2017, pp. 6 and 31). As such, the use of
Xeriscapes and other water-efficient landscapes will likely become more common and, as the
San Antonio Water System puts it, “…landscape design trends continue to favor Texas natives
and other drought-tolerant plants. As landscapes are less dominated by grass supported by

Hudock 24
irrigation systems, it will be possible to maintain attractive outdoor areas with less water.” (San
Antonio Water System, 2017, pp. 31). Thus, even under year-round watering restrictions,
residents would be able to maintain greenery and would save money in the process; in theory,
this would negate the mental-health consequences of year-round restrictions on watering
landscapes, and, given that hand-watering and drip irrigation are frequently employed in
xeriscaping, residents that switch to Xeriscapes would be largely unaffected by the water
restrictions.
Compliance
The last issue to consider in regards to potential year-round watering restrictions is the
degree to which residents would comply with said restrictions. First, it should be noted that the
1.25% reduction in water demand that would result from Stage 2 water restrictions already takes
into account compliance during drought restrictions, as it was calculated according to the real
reductions in water usage seen with the implementation of watering restrictions during drought
periods (San Antonio Water System, 2017, Appendix). Thus, the primary question is whether or
not this level of compliance will truly be observed year-round and outside of drought conditions.
There is some evidence to suggest that compliance would, in fact, remain at similar levels: as
mentioned in the San Antonio Water System’s 2017 Water Management report:
…no water savings were projected for 2016 conditions…during 2016, SAWS
customers behaved as if they were in Stage 2 drought restrictions in terms of
water use even though they were not… This suppressed demand could be due to
residual effects from being in a multi-year period of watering restrictions… (San
Antonio Water System, 2017, Appendix).
This would indicate that, once used to long-term water restrictions, San Antonio residents
will comply even after drought conditions have ended. This is not a universal behavior across
water-stressed regions in the United States; the study “The effectiveness of water irrigation
Hudock 25
policies for residential turfgrass” measured compliance with watering restrictions in Tampa,
Florida, and concluded that many homeowners defied restrictions or even increased water usage
in order to maintain their lawns (Ozan & Alsharif, 2013, 383-384).
Conclusion
In summary, despite the utility of watering restrictions in mitigating the effects of
droughts, such restrictions would be insufficient to address San Antonio’s projected 2070 water
deficit. Although many of the negative effects of reduced watering could be compensated for
with xeriscaping and compliance with water restrictions is unlikely to be an issue, under ideal
conditions, Stage 3 water restrictions would not even account for half of the deficit. Moreover,
the San Antonio Water System’s continual efforts to promote efficient water use in landscapes,
homes, and businesses mean that much of the potential water savings from year-round water
restrictions would already be accomplished without overt restrictions by 2070. Lastly, as
droughts become increasingly common and increasingly severe in Texas, watering restrictions
will be implemented more frequently anyway as a means to compensate, thus reducing potential
savings from implementing them in non-drought years. Thus, the implementation of permanent
watering restrictions would be a relatively ineffective means of long-term water conservation.

Hudock 26
Chapter 2: Rainwater Harvesting
Background:
Rainwater harvesting is one of the oldest methods of expanding an area’s water supply,
and is becoming increasingly popular as a means to alleviate water stress in urban areas across
the world (Campisano et al., 2017, pp. 196) (Christian Amos et al., 2016, pp. 1) (Domènech &
Saurí, 2011, pp. 598) (Belmeziti et al., 2014, pp. 1782) (Zhang et al., 2012, pp. 3758) (Gurung
and Sharma, 2014, pp. 1). Using incentives or mandatory regulations, cities in countries such as
India, Australia, Kenya, Belgium, Denmark, Jordan, Spain, France, Brazil, and parts of the
United States have promoted or required the installation of rainwater harvesting systems in
homes (Campisano et al., 2017, pp. 196) (Christian Amos et al., 2016, pp. 1) (Domènech &
Saurí, 2011, pp. 598) (Belmeziti et al., 2014, pp. 1782). Texas is no exception; Texas law,
…allows for a state sales tax exemption on rainwater harvesting
equipment…prevents homeowners associations from banning rainwater
harvesting installations…requires rainwater harvesting system technology to be
incorporated into the design of new state buildings and allows financial
institutions to consider making loans for developments using rainwater as the sole
source of water supply. (“Innovative Water Technologies - Rainwater Harvesting |
Texas Water Development Board,” n.d.)
Moreover, Texas law allows cities to exempt rainwater harvesting systems from property
taxes (Texas Water Development Board, 2005, pp. 3) Additional municipal laws further seek to
promote rainwater harvesting in various urban areas of Texas (Krishna, n.d., pp. 1). In San
Antonio, residents who install rainwater collection systems are eligible for rebates, including up
to 50% on the cost of the equipment and its installation (Texas Water Development Board, 2005,
pp. 55). Even so, most homes in San Antonio still lack rainwater harvesting systems, and data on
the number of households with rainwater harvesting systems is unavailable, as many systems are
unregistered. This chapter will examine the implications of mandating the installation of

Hudock 27
rainwater collection systems in San Antonio residences, including probable water savings, cost,
and side-effects.
Calculations:
According to a report by Dr. Hari J. Krishna, a senior engineer at the Texas Water
Development Board during the 2000s, “For every inch of rain, about 600 gallons of water can be
collected from 1,000 sq.ft. of roof area. A typical home with 2000 sq.ft. of roof area in Central
Texas can yield up to 40,000 gallons a year…” (Krishna, n.d., pp. 1) San Antonio’s average
annual rainfall is about 30 inches (Texas Water Development Board, 2005, pp. A9); multiplied
by the 1,200 gallons of water that a 2,000 square-foot roof would yield per inch, yields a value of
36,000 gallons per year per home, or 0.11 acre-feet per year per home. Dividing the 2070
projected water deficit for San Antonio of 22,696 acre-feet per year by 0.11 acre-feet per year
per house indicates that about 206,330 houses in San Antonio would need to be equipped with
rainwater harvesting systems in order to compensate for the deficit, or 909,090 houses in order to
satisfy the deficit and restore spring flows.
As of 2017, San Antonio had 494,260 occupied housing units (U.S. Census Bureau, n.d.);
given the steady increases in the number of housing units over time, this is likely 500,000 or
more in 2019. Given that San Antonio’s population is projected to nearly double by 2070 (San
Antonio Water System, 2017, pp. 26) and that the change in San Antonio’s population over time
appears to be roughly twice the change in occupied housing units over time (U.S. Census
Bureau, n.d.), the number of housing units in San Antonio in 2070 may be approximated as 1.5
times the current number, or about 750,000. This means that equipping 28% of housing units in
San Antonio with rainwater harvesting systems by 2070 would compensate for the projected
water deficit. Moreover, while installing rainwater harvesting systems in all 750,000 housing

Hudock 28
units would not produce sufficient water to allow San Antonio to reduce its share of aquifer
pumping enough to fully restore spring flows, the resulting 82,500 acre-feet per year would
supply most of the 100,000 acre-feet per year required to both overcome the water deficit and
restore spring flows. This would go a long way towards the restoration of the springs and the
conservation of the species that depend on spring flows.
Rainwater harvesting systems have an additional benefit beyond simply increasing water
supplies. The collection of rainwater reduces the amount of precipitation that reaches the ground,
and thus reduces the severity of floods. For example, a group of researchers in China calculated
the amount by which rainwater collections systems could reduce runoff volume in Nanjing as
13.9-57.7%, depending on the amount of rainfall experienced (Zhang et al., 2012, pp. 3765).
Consequently, cities in parts of Japan, South Korea, Thailand, China, and Mexico City have
implemented rainwater harvesting systems to both alleviate water stress and manage urban
flooding (Campisano et al., 2017, pp. 198-200). This utility would also apply to San Antonio and
other cities in Central and Eastern Texas that experience flooding. Moreover, climate change is
likely to increase the severity of flooding in the future (IPCC, 2014, pp. 1443-1444) (Banner et
al., 2010, pp. 2), making rainwater harvesting an especially attractive option.
Drawbacks and Costs:
Rainwater harvesting systems, however, are not without their problems. There are
concerns about the quality of harvested rainwater (Campisano et al., 2017, pp. 200-202) (Gurung
and Sharma, 2014, pp. 26-27), maintenance of rainwater harvesting systems (Gurung & Sharma,
2014, pp. 26-27) (Christian Amos et al., 2016, pp. 7) (Domènech & Saurí, 2011, pp. 605-606),
and the great short-terms costs associated with installing rainwater collections systems on the
scale of an entire city (Campisano et al., 2017, pp. 203-204) (Gurung & Sharma, 2014, pp. 33)

Hudock 29
(Domènech & Saurí, 2011, pp. 607). However, these issues may be alleviated by the treatment of
collected rainwater, delegation of collected rainwater to specific uses, and the long-term cost
savings associated with rainwater harvesting systems.
The article “Urban rainwater harvesting systems: Research, implementation and future
perspectives” provides an overview of multiple topics of interest surrounding rainwater
harvesting systems, including a section on the quality of harvested water (Campisano et al.,
2017, pp. 200). According to the article,
Despite rooftop surfaces being comparatively cleaner than parking lots, sidewalks
and other impervious surfaces, rooftop runoff can contain substantial amounts of
heavy metals and nutrients...Sources of pollutants in rooftop runoff include
precipitation (i.e. wet deposition), atmospheric deposition (i.e. dry deposition) and
materials used in the construction of the roof... numerous…pollutants have been
measured in rainwater due to their presence in the atmosphere. In East Texas,
U.S.A., rainwater concentrations of copper (Cu) and zinc (Zn) exceeded U.S.A.
Environmental Protection Agency (USEPA) freshwater quality standards of 0.013
mg/l and 0.12 mg/l, respectively… (Campisano et al., 2017, pp. 200)
The article also indicates that microbial quality is a major concern:
…inappropriate [roof] design and material selection promote contributions from
avian sources and inhibit cleaning activities, thus resulting in lower microbial
quality of harvested rainwater. The two most detected pathogens…were
Salmonella spp. and Campylobacter spp.” (Campisano et al., 2017, pp. 200-201)
Even so, there are ways to improve the quality of harvested rainwater: “…potential
treatment options for RWH systems include both pre-storage (debris screens and filters and first-
flush diversion) and post-storage measures (post-storage filtration, clariflocculation and
disinfection).” (Campisano et al., 2017, pp. 201) However, treatment systems for harvested
rainwater require frequent maintenance tasks, which “…include cleaning the catchment surface,
gutters and storage tank, cleaning filters, first flush diverters and debris screens, and inspecting
the system for possibly points of entry for mosquitoes and vermin.” (Campisano et al., 2017, pp.
202)

Hudock 30
Given the additional expense and maintenance required to treat harvested rainwater, it
may be easier for owners of rainwater harvesting systems to simply avoid drinking harvested
rainwater and delegate it to other uses. For example, toilets, cold-water laundry, and irrigation
can all use non-potable water (Gurung & Sharma, 2014, pp. 29). The problem with this approach
is that water uses requiring potable water account for about 80% of household water demand
(Gurung & Sharma, 2014, pp. 30). Rainwater harvesting systems reduce municipal water
demand by supplying water for household use that would normally come from the local water
utility, i.e. the San Antonio Water System. If rainwater harvesting systems cannot supply water
for a large portion of household demand, the reduction in municipal demand may not be as high
as previously calculated. In the end, it may be best to leave the decision of whether to install a
treatment system or delegate harvesting rainwater for non-potable uses up to the individual
residents of San Antonio.
Perhaps the largest barrier to the widespread installation of rainwater harvesting systems
is cost; each system can cost thousands of dollars (Krishna, n.d., pp. 1) (Gurung & Sharma,
2014, pp. 33). Estimating an average price would be near impossible, given the many factors that
go into it, such as treatment method, capacity, and material used (Texas Water Development
Board, 2005, pp. 45-51); as such, a price range of $5,000-15,000 per system will be considered.
If 28% of all housing units in San Antonio were to be equipped with rainwater harvesting
systems, the cost would be around $1,031,650,000-3,094,950,000, and if every housing unit was
equipped, the cost would be around $3,750,000,000-11,250,000,000. For comparison, San
Antonio’s municipal budget for 2019 is $2.8 billion dollars (City of San Antonio, n.d.).
Moreover, these estimates do not include the large maintenance costs that would be associated
with operating rainwater harvesting systems across hundreds of thousands of housing units. As

Hudock 31
such, the city would be unable to pay for the installation of rainwater harvesting systems across
San Antonio out of pocket, though providing some rebates may still be doable.
More than likely, the costs of mandatory rainwater harvesting systems would primarily
be borne by San Antonio residents. Given that asking every resident to pay at least $5,000 up
front would be untenable, the best option may be to require all new homes and apartment
buildings to have rainwater harvesting systems installed. As mentioned previously, the number
of housing units in San Antonio is likely to increase by roughly 250,000 between now and 2070,
and equipping all of these new housing units with rainwater harvesting systems would produce
27,500 acre-feet of water per year, which would be more than sufficient to compensate for the
projected water deficit. The costs of installation would then be incorporated into the prices of
new homes and rents of apartments. Given that even $20,000 is a relatively small proportion of a
new house’s price, this would not be an overly burdensome cost increase. Moreover, the savings
from using captured rainwater in place of water from the San Antonio Water System would
eventually offset this increase in cost, though the exact amount of time required for these savings
to surpass the costs is varies by multiple decades and is dependent on several different factors,
including tank size, number of occupants, and change in water prices (Campisano et al., 2017,
pp. 203-204).
One way to further reduce the financial burden of mandatory rainwater harvesting
systems could be the use of communal systems (Gurung & Sharma, 2014). The article
“Communal rainwater tank systems design and economies of scale” performs a cost analysis of
the installation of a rainwater harvesting system for multiple households in Queensland,
Australia (Gurung & Sharma, 2014). The results indicate that, in contrast to their estimated
$12,500 cost per house of a communal system for four houses, a communal rainwater harvesting

Hudock 32
system for around 200 homes would cost approximately $6,200 per house (Gurung & Sharma,
2014, pp. 33), each converted from the Australian dollars used in the article to U.S. dollars. This
cost could be split between each house, and maintenance could, in theory, also be divided up
between the homeowners.
However, coordinating this process across 200 households would be exceedingly
difficult. Even in the case of newly-built houses or apartments, the builders of each housing unit
would need to coordinate with the others to split the costs. Moreover, maintenance costs and
labor would be nearly impossible for 200 homeowners to effectively split, as some people would
inevitably move, neglect their share, or even be unable to contribute. As a result, method would
only be feasible for groups of apartment complexes, with which there would still be significant
difficulty in splitting costs. Thus, individual rainwater collection systems would likely become
the norm, though a degree of cost savings would still be possible, as an individual apartment
complex would be able to supply harvested rainwater for the multiple families living within it
using a single system, with costs being split by additions to rent.
Public Acceptance:
The final challenge to implementing mandatory rainwater harvesting systems would be
convincing the public of its necessity. Increased housing costs and maintenance requirements are
unlikely to be well received, and even the San Antonio Water System, as a water utility, may be
ambivalent towards a measure that would reduce reliance on the purchase of its water. In
addition, Messaging would be even more critical to the acceptance of mandatory rainwater
harvesting than to permanent water restrictions. The first step in understanding how to gain
public acceptance for this measure is to examine its implementation in other places.

Hudock 33
The previously mentioned literature review “Urban rainwater harvesting systems:
Research, implementation and future perspectives” included a section on social barriers to
rainwater harvesting systems: “Historically, challenges to the social acceptance of RWH (and
indeed wider water reuse) have focused on water quality, risk perception and health risk,
including the so-called ‘yuck factor’…as well as financial viability…” (Campisano et al., 2017,
pp. 204) Typical means of overcoming these barriers include risk assessment guidelines,
emphasizing non-potable uses for harvested rainwater, and financial incentives, such as tax relief
and subsidies (Campisano et al., 2017, pp. 204-205). Many of these measures are already in
place across Texas; in addition to the rebates offered by cities such as San Antonio, the Texas
Water Development Board published an online manual for rainwater harvesting systems, which
includes information on subsidies, water quality, cost, and other topics (Texas Water
Development Board, 2005). In the event that San Antonio elects to mandate rainwater harvesting
systems, it could create a new manual based on this one or ask the Texas Water Development
Board to update the old manual before sending out links to residents.
According to the study “A comparative appraisal of the use of rainwater harvesting in
single and multi-family buildings of the Metropolitan Area of Barcelona (Spain): social
experience, drinking water savings and economic costs”, residents approve of rainwater
harvesting systems the most when they understand the environmental benefits (Domènech &
Saurí, 2011, pp. 607). The article further notes,
Rainwater harvesting offers numerous benefits but unless the feeling of ownership
of users and their knowledge about the system increases, the potential of
rainwater harvesting will remain underrated and the risk of system abandonment
may become real. In order to guarantee the proper performance of the systems and
to ensure risk minimisation, it is crucial that the implementation of these policies
is supported by awareness campaigns about the advantages, potential uses and
operation and maintenance requirements of rainwater harvesting. (Domènech &
Saurí, 2011, pp. 607)
Hudock 34
It would thus be crucial for San Antonio to emphasize not only to reassure residents on
water quality and cost issues, but also to inform them of the environmental necessity of rainwater
harvesting. Failure to adequately communicate the reality of San Antonio’s future water
problems has crippled support for water projects in the past (Blanchard-Boehm et al., 2008), so it
is imperative that the city make a greater effort at public messaging should it choose to mandate
rainwater harvesting systems. Moreover, such efforts would likely benefit should the city inform
residents that the use of rainwater harvesting systems can also aid the restoration of spring flows;
similar information promoted the acceptance of rainwater harvesting systems in Barcelona
(Domènech & Saurí, 2011, pp. 607).
Conclusion:
In short, mandatory rainwater harvesting systems have the potential to solve San
Antonio’s future water deficit and even partially restore spring flows. While the costs of
implementation would be high, they could be minimized by only requiring new buildings to
install rainwater harvesting systems, thus incorporating the costs into construction expenses.
However, the efficacy of rainwater harvesting systems is heavily dependent on the willingness of
residents to use and upkeep them, and proper messaging and communication with the public
would thus be essential. Overall, this approach is recommended for use by the city of San
Antonio.

Hudock 35
Chapter 3: Reservoirs
Background:
Reservoir projects have long been a major component of Texas water policy (Griffin,
2010, pp. 2); as of 2015, 3,435 different reservoirs were operating in Texas (Wurbs, 2015, pp.
226). Following this trend, the city of San Antonio sought to alleviate its future supply problems
by approving the Applewhite Dam and Reservoir Project in 1979 (Blanchard-Boehm et al., 2008,
pp. 296). Having known since the 1950s drought that the Edwards Aquifer was not an unlimited
supply of water,
…regional planners and decision makers in south-central Texas favored the
building of a dam and reservoir in southeast San Antonio. The structure’s
reservoir would be fed primarily by the Medina and San Antonio Rivers and
would serve as a source of surface water in addition to present supplies from the
underground aquifer. (Blanchard-Boehm et al., 2008, pp. 296)
Controversy over the project began early on, with landowners such as Edward P. Walsh
protesting the planned acquisition of their land and doubting the efficacy of the proposed
reservoir (Walsh, 1976). Though San Antonio received a state permit for the project in 1982,
“…continued delays blocked construction, and opposition to the project grew stronger.
Throughout the 1980s, legal challenges and questions concerning ‘‘who pays, who controls, and
who benefits’’ continued to plague the project…” (Blanchard-Boehm et al., 2008, pp. 296). Just
as the city was finally ready to begin construction in the early 1990s, “controversy generated by
a watchdog tax group, land owners and environmentalists became the focus of wide coverage by
the print and broadcast media,” (Blanchard-Boehm et al., 2008, pp. 297) and two referendums
were held in 1991 and 1994. In both cases, the proposal was rejected by San Antonio’s citizens,
and the project was officially ended in 1994 (Blanchard-Boehm et al., 2008, pp. 297).

Hudock 36
This chapter seeks to explore the failure of the Applewhite Dam and Reservoir Project;
its cost and potential water production, the precise reasons for its rejection by San Antonio’s
residents, and lessons that can be learned from it in order to complete a new reservoir project.
The Applewhite project is used here as a case study because of its intense controversy, available
information, and how close it came to being built. As a result, there is a great deal to be learned
from examining the difficulties in public communication that lead to its failure, and how
decision-makers need to understand the concerns of the public in order for such projects to
succeed.
Cost-Benefit Comparison:
Based on Applewhite’s budgeted cost and projected water output, reservoir projects
appear to be highly cost-efficient in comparison to large-scale rainwater collection. The project
would have provided approximately 48,000 acre-feet of water per year (Griffin, 1993, pp. 629),
more than twice the projected water deficit for 2070, or even 53,000 acre-feet per year according
to the Army Corps of Engineers (Griffith et al., 1989, pp. 1). The project was budgeted for
$180,000,000 (Blanchard-Boehm, 2008, pp. 293), the equivalent of roughly $400,000,000 today.
Dividing the cost by the water production gives $8,333 per acre-foot for the Applewhite project,
compared to about $88,121 per acre-foot for installing rainwater harvesting systems across San
Antonio. As such, purely from the perspective of cost-efficiency, a reservoir project would
certainly be preferable to city-wide rainwater harvesting.
San Antonio’s leadership also believed that the Applewhite Dam and Reservoir would
have additional benefits beyond water production, and that nearby residents,
…would most likely welcome the increased economic expansion of service and
product-related businesses in this area, as well as, other market, and non-market,
benefits, including: enhanced recreation and scenic beauty attributes from a
human-made lake; flood control measures… (Blanchard-Boehm, 2008, pp. 295)

Hudock 37
The U.S. Army Corps of Engineers noted that the reservoir would have some
environmental benefits, as it would have reduced reliance on the Edwards Aquifer, thus
preserving spring-flows and mitigating saltwater intrusion (Griffith et al., 1989, pp. 1 & 42). As a
result, the project would have indirectly aided the conservation of several endangered species,
including the “San Marcos salamander…Cascade Cavern salamander…Texas blind
salamander…San Marcos gambusia…fountain darter…and Texas wild rice…” (Griffith et al.,
1989, pp. 46). Lastly, the draft environmental impact statement elaborated on the potential for
recreation at the reservoir, including “…fishing, skiing, sailing, picnicking, and camping.”
(Griffith et al., 1989, pp. 51) However, the report also notes that City Water Board had
“…expressed no intention of providing or allowing recreation on the reservoir or its adjacent
lands” (Griffith et al., 1989, pp. 51)
Primary Issues:
Evidently, these positive aspects were not effectively communicated to the public, and
media outlets overwhelmingly focused on the disadvantages of the Applewhite Dam and
Reservoir Project (Blanchard-Boehm, 2008, pp. 297). In addition to concerns that corruption was
involved in the project, a number of environmental and property issues proved to be the downfall
of the project. For one, as noted in the draft environmental impact statement, “Relocation of
about 95 residences, between 3 and 5 cemeteries, and several transportation arteries and utilities
would be required.” (Griffith et al., 1989, pp. 1) As evidenced by Edward P. Walsh’s early
complaints, the acquisition of property for the project was not viewed favorably by citizens in the
area, and moving around utilities and roads would likely have also been highly inconvenient for
nearby residents. Moreover, the area that would have been flooded by the reservoir included
“…approximately 6,500 acres of prime farmland.” (Griffith et al., 1989, pp. 1) As a result, the
Hudock 38
project could have had a negative impact on San Antonio’s future economic output, though it is
also possible that the same area has been or will be urbanized in the future.
Despite the incidental environmental benefits that would have been associated with the
project, many environmental issues would also have been created by the Applewhite reservoir.
From the Army Corps of Engineers’ draft environmental impact statement:
Construction activities…will result in the destruction of terrestrial habitat. It is
highly likely that many terrestrial animals will be killed during these activities.
Survivors must face the challenge of relocation to adjacent habitat – which may
already be at carrying capacity – or survival in unsuitable habitat. Noise and
increased vehicular traffic will disturb various activities (notably mating and
nesting)…
…approximately 2,500 acres of terrestrial habitat will be destroyed…1,400 acres
represent riparian woodland, the habitat type of greatest ecological concern in the
study area. (Griffith et al., 1989, pp. 44)
On the subject of impacts on aquatic ecosystems:
High suspended solids loads can be expect to interfere with aquatic respiration,
bury benthic organisms, and reduce primary production by restricting light
penetration…Suspended solids levels should return to pre-construction levels as
construction eases and the dams are completed.
…approximately 18 miles of riverine habitat will be inundated…An additional
5.2 miles…will be temporarily inundated…conversion of habitat from flowing
water to standing water will adversely impact some organisms…Due to the rise
and fall of water levels, aquatic habitat along the margin and at the upper end of
the reservoir will be variable. Rapid fluctuations in the spring during fish
spawning periods could exert an adverse impact upon populations. (Griffith et al.,
1989, pp. 44-45)
Negative impacts on threatened and endangered species, however, were expected to be
minimal or nonexistent, as the only threatened or endangered species thought to have possibly
used the area were a few migratory bird species, none of which had actually been spotted in the
area (Griffith et al., 1989, pp. 37 & 46). These include the “…brown pelican, peregrine falcon,
bald eagle, and whooping crane…” (Griffith et al., 1989, pp. 37 & 46) Moreover, as of the
Hudock 39
writing of the draft environmental impact statement, there were no known bald eagles within
Bexar County (Griffith et al., 1989, pp. 37).
A plan for mitigating these environmental impacts was presented in Appendix B of the
draft environmental impacts statement. According to the plan, land forming a corridor around
nearby parts of the Medina River and around the perimeter of the reservoir would have been set
aside for wildlife (Griffith et al., 1989, Appendix B). Grazing would not have been allowed, the
area would have been managed by either the Texas Parks and Wildlife Department or the San
Antonio Parks and Recreation Department, and only “low-density recreation” would have been
allowed (Griffith et al., 1989, Appendix B). In terms of acreage, this mitigation plan would have
largely compensated for lost and disrupted habitat within the proposed area of the reservoir
(Griffith et al., 1989, Appendix B), though one might question whether or not the land set aside
would have sufficiently helped preserve local populations of affected species.
To summarize, the negative environmental impacts of the Applewhite Dam and Reservoir
Project would likely not have been critical. Between a mitigation plan to set aside habitat
elsewhere, the lack of endangered or threatened species in the area, and potential benefits for
threatened and endangered species dependent on spring-flows, some might even view the net
environmental impact as being positive. In addition, the project would have been cost-efficient
relative to some other means of increasing San Antonio’s water supplies. However, the process
of relocating residences, acquiring land from reluctant landowners, and moving transportation
routes would likely have been a substantial obstacle to the success of the project. Ultimately, the
primary factor in the project’s rejection was negative media coverage, which was not sufficiently
balanced by communication between the city government and the public (Blanchard-Boehm et
al., 2008).

Hudock 40
Public Messaging and the Applewhite Reservoir Project:
“Communicating future water needs to an at-risk population: lessons learned following
defeat of the Applewhite Dam and Reservoir Project in San Antonio, Texas” by Blanchard-
Boehm et. al is a study examining how authorities failed to adequately warn residents of
potential future water shortages and the consequent need for a water project like the Applewhite
Dam and Reservoir (Blanchard-Boehm et. al, 2008). To this end, researchers interviewed 400
randomly selected San Antonio residents and asked them questions pertaining to their awareness
of upcoming water issues, whether or not they voted either of the referendums that defeated the
Applewhite project, whether their property would have been affected by the project, what their
sources of information regarding the project were, whether or not they felt that the reasons for
the project were effectively communicated to the public, and their demographic characteristics
(Blanchard-Boehm et. al, 2008, pp. 303-304).
The study found that most residents were not well-informed in regards to future water
supply problems:
…almost two-thirds said that they were not aware that the demands for water
usage in the San Antonio region would eventually exceed the recharge capacity of
the aquifer. When asked to assess their own personal use, the majority of our
sample indicated that San Antonio would need to develop additional sources of
drinking water if the city was to enjoy continued sustained growth. Almost 90%
of our sample knew that the Edwards aquifer was subject to contamination by
chemical or biological agents. Thus, it may be that residents are more concerned
about increased risk to the quality of their water, rather than the quantity.
(Blanchard-Boehm et. al, 2008, pp. 306-307)
Similarly, most residents were not well-informed in regards to the Applewhite Dam and
Reservoir Project itself:
…when asked whether they were aware or had knowledge that San Antonio
leaders were promoting the construction of the Applewhite Dam and Reservoir
Project, only half knew anything about the project, despite the heated controversy
appearing frequently in newspapers and debates over the broadcast media.

Hudock 41
Further, of the group that knew about the project, a very low percentage indicated
that they went to the polls and voted in the referendums. (Blanchard-Boehm et. al,
2008, pp. 307)
Moreover, very few of the respondents reported having attended any of the public
meetings organized by the city for informing residents about the specifics of the project
(Blanchard-Boehm et. al, 2008, pp. 307). The article posits that this lack of information was
likely responsible for the low voter turnouts in both referendums, as voters without much
information would have had difficulty deciding whether or not to support the project (Blanchard-
Boehm et. al, 2008, pp. 307). As such, special interest groups were likely the determining factor
in the outcomes of both referendums, rather than the majority of residents (Blanchard-Boehm et.
al, 2008, pp. 307).
In order to ensure residents are informed about future water projects that may impact
them to a similar degree as the Applewhite project would have, Blanchard-Boehm et. al
recommend that city leaders “…make a concerted effort to involve the general public to correctly
gauge their awareness levels, perceptions, and beliefs of the general public regarding city
resources…” (Blanchard-Boehm et. al, 2008, pp. 307) Costs, benefits, and necessity of any such
project must be presented (Blanchard-Boehm et. al, 2008, pp. 307), and this information must be
presented in more than just public meetings, at which attendance is often low. The article
recommends utilizing print and broadcast media to accomplish this, as those were the most
common sources from which residents originally gained information about the Applewhite
project (Blanchard-Boehm et. al, 2008, pp. 308), but with such media on the decline, it is also
important to use email and other internet-based means of communication. Given the previous
failure of the Applewhite Dam and Reservoir Project and the fact that many residents and media
outlets would be quick to draw parallels between it and any future reservoir project, it would be
Hudock 42
absolutely vital for San Antonio to take the initiative in providing information on any new
reservoir project, rather than let old biases and the media dominate discussion of the project.
Conclusion:
Using the case-study of the Applewhite Dam and Reservoir Project, it is clear that
building a new reservoir would be a cost-efficient way for the city of San Antonio to eliminate
its future water deficit and even gain a surplus in supply. Such a project would be likely to cause
some environmental damage, though setting aside and protecting land nearby could help
compensate. By far the most challenging aspect of building a new reservoir would be relocating
and compensating for transportation routes and private property in the area, which would only
fuel public resistance to the project. In light of previous failures, a new reservoir project would
require city leaders to make a strong effort to communicate with the public and ensure residents
fully understand the implications and need for a reservoir; otherwise, history will simply repeat
itself.

Hudock 43
Summary and Conclusions
Future Demand:
Climate change is predicted to worsen water-related issues throughout the world. Areas
that experience high precipitation are likely to experience even more in the future, while regions
with low precipitation are likely to experience more water shortages in the future. Moreover,
precipitation is likely to come in increasingly severe bursts, thus increasing flooding. As a
sprawling urban city with large amounts of impervious cover, a rapidly increasing population,
and a history of severe droughts, flooding is likely to become even more of a problem than it
already is, while the Edwards Aquifer, San Antonio’s primary source of water, will decline.
Assuming that San Antonio’s planned water projects are all completed by 2070, they will
add 104,604 acre-feet per year to San Antonio’s water production. Given that Edwards Aquifer
recharge is likely to decrease by roughly 30%, and assuming that San Antonio will be forced to
reduced pumping by the same proportion in order to avoid depleting the aquifer, 196,700 acre-
feet per year will be available from that source, yielding a total water production of 301,304
acre-feet per year. However, the San Antonio Water System projects that water demand will
increase to 324,000 acre-feet per year by 2070, assuming they meet their goals in promoting
conservation among residents. As such, San Antonio faces a water deficit of 22,696 acre-feet per
year, and perhaps even 100,000 acre-feet per year if San Antonio is required to reduce pumping
from the Edwards Aquifer for the purpose of preserving endangered species dependent on
spring-flows.
In short, the water projects and conservation efforts currently planned are likely
insufficient to meet future demand, and San Antonio will need to implement additional measures

Hudock 44
to compensate. Three potential ways to reduce water demand and/or increase water production
were presented in this paper, each evaluated according to costs, efficacy, and additional impacts.
Permanent Water-Use Restrictions:
The first potential means of reducing water demand in San Antonio would be to
permanently implement existing water-use restrictions, which have been used in the past to
compensate for reduced water supplies during droughts. Such restrictions take the form of limits
on how often landscapes can be irrigated, the operation of outdoor fountains, required covering
of private swimming pools, and limits on washing in hotels and motels.
Overall, permanent implementation of these water restrictions would be an exceedingly
ineffective means of reducing water demand. Out of the 22,696 acre-feet per year water deficit,
permanent stage 3 water restrictions would compensate for 8,100 acre-feet per year at best. This
would come at no direct cost, and convincing San Antonio residents of the necessity of these
measure would likely not be difficult, given their propensity for adhering to restrictions even
after droughts end. However, these water savings would likely be undercut by the promotion of
xeriscaping and reduced irrigation, which are already part of the San Antonio Water System’s
water demand calculations. Moreover, these water savings would not apply during droughts, as
they are already used during droughts, which will be increasingly common due to climate
change. The resulting reduction in plant cover from reduced irrigation could have a minor
negative impact of the mental health of San Antonio’s residents.
As such, permanent water-use restrictions are not recommended as a means of reducing
future water demand, as the savings will likely be minimal and the reduction in convenience,
greenery, and potentially mental health would not be worth it.

Hudock 45
Rainwater Harvesting:
The second potential way to increase San Antonio’s water supplies would be for each
housing unit in the city to collect rainwater. Rainwater harvesting systems are already required in
a number water-stressed cities throughout the world, and many Texas cities, including San
Antonio, offer financial incentives for residents who install rainwater harvesting systems in their
homes.
If roughly 28% of all housing units in San Antonio in 2070 were equipped with rainwater
harvesting systems, the projected water deficit would be entirely solved. Equipping all housing
units with rainwater harvesting systems would produce roughly 82,500 acre-feet per year of
water, which would both solve the water deficit and enable the city to substantially reduce
pumping from the Edwards Aquifer and thus partially restore spring-flows. In addition, rainwater
harvesting systems can reduce the severity of floods, which are likely to become more common
as climate change progresses.
There are, however, a few issues with rainwater harvesting systems. For one, treatment
systems are required for harvested rainwater to be used for more than non-potable tasks, such as
toilets, cold-water laundry, and irrigation. Such treatment systems require regular maintenance,
and not all residents may be willing to expend the necessary effort. Cost is also a major concern,
as installing rainwater harvesting systems on a city-wide scale would require billions of dollars.
Thus, it would be best to incorporate the cost into housing prices by requiring all new homes to
be built with rainwater harvesting systems, which would produce 27,500 acre-feet per year.
Public communication and education will be essential to getting residents on board with these
maintenance tasks and increased housing prices.

Hudock 46
Given the large water production, potential to mitigate floods, and ability to subsume
costs into housing prices, mandatory rainwater harvesting systems are recommended as an option
for meeting San Antonio’s future water and environmental needs.
Reservoirs:
While reservoir have long been a means for cities in Texas to increase their water
supplies, more recent projects in San Antonio have failed. Most notably, the Applewhite Dam
and Reservoir Project was rejected by San Antonio residents in two referendums after years of
unfavorable media coverage. Even so, reservoirs remain a compelling option for solving San
Antonio’s eventual water deficit.
The Applewhite Reservoir would have provided about 48,000 acre-feet per year at a cost
of about $400,000,000 in today’s money, making it relatively cost-effective. In addition, some
recreational, economic, and flood-control benefits may have been derived. Massive
environmental disruption would have occurred at the site, though no threatened or endangered
species depend on the area, and the damage could have been partially compensated for by setting
aside land in nearby areas for conservation.
The primary issue with a new reservoir project would be public communication. The
Applewhite Reservoir was unpopular because it would have relocated many residences,
properties, and roads; media coverage strongly emphasized environmental issues and perceptions
of corruption; and residents were inadequately informed of San Antonio’s future water issues
and the importance of the project.
Due to its relative cost-efficiency, a new reservoir project is recommended as an option
for meeting 2070 water demand in San Antonio. However, it is critical that the city communicate

Hudock 47
with the public about such a project and secure the approval of residents first; otherwise, any
new reservoir will likely meet the same fate as Applewhite.
Conclusion:
Of the options presented, a new reservoir is the most attractive from a cost perspective,
as, compared to mandatory rainwater harvesting systems, it would provide more water for a
fraction of the cost. In terms of ancillary benefits, both methods offer flood control, though city-
wide rainwater harvesting would likely offer more. Minor recreational and economic benefits
may result from a reservoir, while rainwater harvesting may stimulate companies that install and
maintain such systems. Mandatory rainwater harvesting would have two primary advantages
over a new reservoir; first, it would not result in any environmental damage or property
relocation. Second, it would be far easier to implement from a public communication
perspective.
If all new housing buildings are required to have rainwater harvesting systems installed,
housing prices will certainly increase, but only in new homes, and not all residents would be
affected. Moreover, updating building standards for safety or even environmental reasons is not a
new phenomenon, and thus may be more acceptable to residents because of its relative
familiarity. Lastly, mandatory rainwater harvesting would not have the same stigma associated
with it as a new reservoir project would have, thanks to the Applewhite debacle. As such, San
Antonio would not face an uphill media battle in trying to convince San Antonio residents of the
importance of rainwater harvesting.
In short, while both mandatory rainwater harvesting and a new reservoir are viable
options for increasing San Antonio’s water production, rainwater harvesting may be more
practical to implement, and is thus the primary recommended option in this paper.
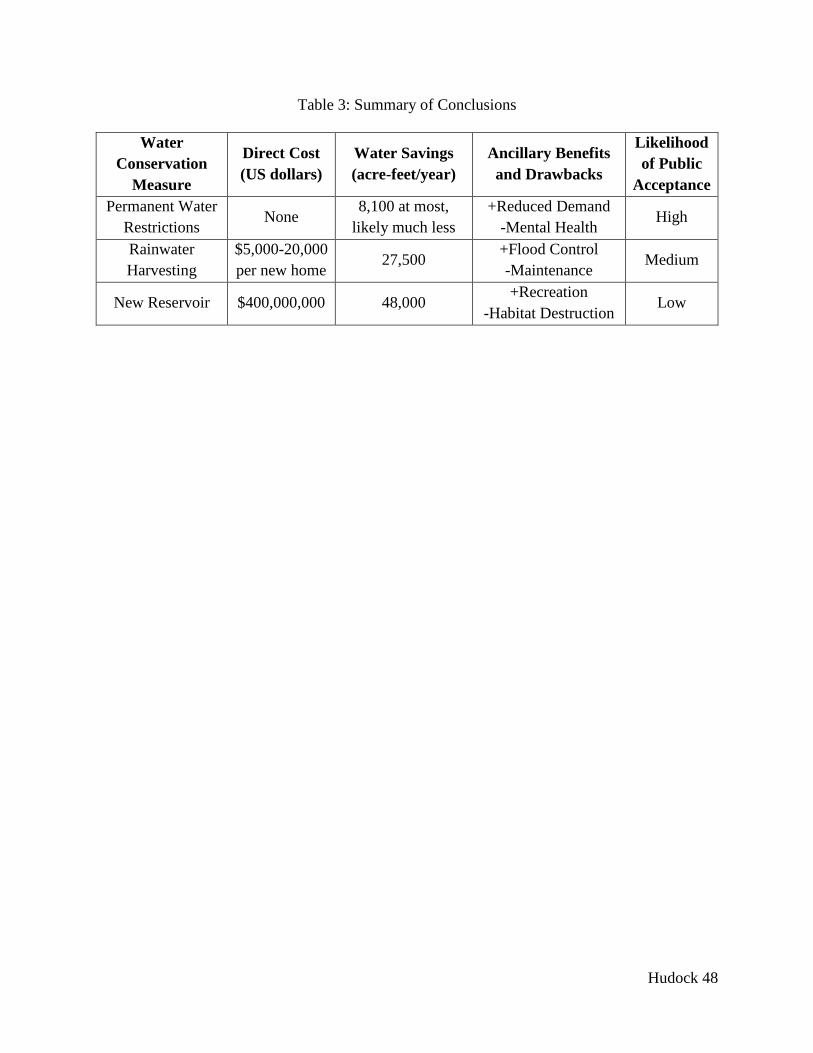
Hudock 48
Table 3: Summary of Conclusions
Water
Conservation
Measure
Direct Cost
(US dollars)
Water Savings
(acre-feet/year)
Ancillary Benefits
and Drawbacks
Likelihood
of Public
Acceptance
Permanent Water
Restrictions None
8,100 at most,
likely much less
+Reduced Demand
-Mental Health High
Rainwater
Harvesting
$5,000-20,000
per new home 27,500
+Flood Control
-Maintenance Medium
New Reservoir $400,000,000 48,000 +Recreation
-Habitat Destruction Low

Hudock 49
Bibliography
Astell-Burt, T., Feng, X., & Kolt, G. S. (2013). Mental health benefits of neighbourhood green space
are stronger among physically active adults in middle-to-older age: Evidence from 260,061
Australians. Preventive Medicine, 57(5), 601–606. https://doi.org/10.1016/j.ypmed.2013.08.017
Banner, J. L., Jackson, C. S., Yang, Z.-L., Hayhoe, K., Woodhouse, C., Gulden, L., … Castell, R.
(2010). Climate Change Impacts on Texas Water A White Paper Assessment of the Past, Present
and Future and Recommendations for Action. Texas Water Journal, 1(1), 1–19.
Belmeziti, A., Coutard, O., & de Gouvello, B. (2014). How much drinking water can be saved by
using rainwater harvesting on a large urban area? Application to Paris agglomeration. Water
Science and Technology, 70(11), 1782–1788. https://doi.org/10.2166/wst.2014.269
Beyer, K. M. M., Kaltenbach, A., Szabo, A., Bogar, S., Nieto, F. J., & Malecki, K. M. (2014).
Exposure to Neighborhood Green Space and Mental Health: Evidence from the Survey of the
Health of Wisconsin. International Journal of Environmental Research and Public Health;
Basel, 11(3), 3453–3472.
Blanchard-Boehm, R. D., Earl, R. A., Wachter, J. H., & Hanford, E. J. (2008). Communicating future
water needs to an at-risk population: lessons learned following defeat of the Applewhite Dam
and Reservoir Project in San Antonio, Texas. Population and Environment, 29(6), 292–312.
https://doi.org/10.1007/s11111-008-0063-z.
Campisano, A., Butler, D., Ward, S., Burns, M. J., Friedler, E., DeBusk, K., … Han, M. (2017).
Urban rainwater harvesting systems: Research, implementation and future perspectives. Water
Research, 115, 195–209. https://doi.org/10.1016/j.watres.2017.02.056
Cepeda, J. C. (2017). Influence of Pacific sea surface temperatures on precipitation in Texas: Data
from Amarillo and San Antonio, 1900-2013. The Texas Journal of Science, 69(1).

Hudock 50
Chen, C.-C., Gillig, D., & McCARL, B. A. (2001). Effects of Climatic Change on a Water Dependent
Regional Economy: A Study of the Texas Edwards Aquifer. Climatic Change, 49(4), 397-409.
Christian Amos, C., Rahman, A., & Mwangi Gathenya, J. (2016). Economic Analysis and Feasibility
of Rainwater Harvesting Systems in Urban and Peri-Urban Environments: A Review of the
Global Situation with a Special Focus on Australia and Kenya. Water, 8(4), 149.
https://doi.org/10.3390/w8040149
City of San Antonio. (n.d.). Current Budget. Retrieved February 26, 2019, from
https://www.sanantonio.gov/Budget/Current-Budget
de Vries, S., van Dillen, S. M. E., Groenewegen, P. P., & Spreeuwenberg, P. (2013). Streetscape
greenery and health: Stress, social cohesion and physical activity as mediators. Social Science &
Medicine, 94, 26–33. https://doi.org/10.1016/j.socscimed.2013.06.030
Domènech, L., & Saurí, D. (2011). A comparative appraisal of the use of rainwater harvesting in
single and multi-family buildings of the Metropolitan Area of Barcelona (Spain): social
experience, drinking water savings and economic costs. Journal of Cleaner Production, 19(6),
598–608. https://doi.org/10.1016/j.jclepro.2010.11.010
Edward P. Walsh. (1976, June 7). Don’t Build Applewhite. The San Antonio Light, pp. 3-D. Retrieved
from Newspaper Archive.
Gelca, R., Hayhoe, K., Scott‐Fleming, I., Crow, C., Dawson, D., & Patiño, R. (2016). Climate–water
quality relationships in Texas reservoirs. Hydrological Processes, 30(1), 12–29.
https://doi.org/10.1002/hyp.10545
Griffin, R. C. (2012). Water Policy in Texas: Responding to the Rise of Scarcity. Washington,
UNITED STATES: Routledge. Retrieved from
http://ebookcentral.proquest.com/lib/utxa/detail.action?docID=605296

Hudock 51
Griffin, R. C., & Chowdhury, M. E. (1993). Evaluating Locally Financed Reservoir: The Case of
Applewhite. Journal of Water Resources Planning and Management, 119(6), 628–644.
https://doi.org/10.1061/(ASCE)0733-9496(1993)119:6(628)
Griffith, R. S., Hathorn, P. M., Scott, Robert F., Shelton, Bobby L., & Tandy, Timothy L. (1989).
Applewhite Dam and Reservoir and Leon Creek Diversion Dam and Lake: Draft Environmental
Impact Statement. Retrieved from http://hdl.handle.net/2027/ien.35556031047707
Gubbels, J. S., Kremers, S. P. J., Droomers, M., Hoefnagels, C., Stronks, K., Hosman, C., & de Vries,
S. (2016). The impact of greenery on physical activity and mental health of adolescent and adult
residents of deprived neighborhoods: A longitudinal study. Health & Place, 40, 153–160.
https://doi.org/10.1016/j.healthplace.2016.06.002
Gurung, T. R., & Sharma, A. (2014). Communal rainwater tank systems design and economies of
scale. Journal of Cleaner Production, 67, 26–36. https://doi.org/10.1016/j.jclepro.2013.12.020
Kondo, M. C., Fluehr, J. M., McKeon, T., & Branas, C. C. (2018). Urban Green Space and Its Impact
on Human Health. International Journal of Environmental Research and Public Health; Basel,
15(3), 445. http://dx.doi.org/10.3390/ijerph15030445
Krishna, H. J. (n.d.). Rainwater Harvesting in Texas. 1–2.
Mikkelsen, P. S., Adeler, O. F., Albrechtsen, H.-J., & Henze, M. (1999). Collected rainfall as a water
source in danish households – what is the potential and what are the costs? Water Science and
Technology, 39(5), 49–56. https://doi.org/10.1016/S0273-1223(99)00086-4
Mullin, M., & Rubado, M. E. (2017). Local Response to Water Crisis: Explaining Variation in Usage
Restrictions During a Texas Drought. Urban Affairs Review, 53(4), 752–774.
https://doi.org/10.1177/1078087416657199
Nielsen-Gammon, J. W. (2012). The 2011 Texas Drought. Texas Water Journal, 3(1), 59–95.

Hudock 52
Ozan, L. A., & Alsharif, K. A. (2013). The effectiveness of water irrigation policies for residential
turfgrass. Land Use Policy, 31, 378–384. https://doi.org/10.1016/j.landusepol.2012.08.001
Romero-Lankao, P., J.B. Smith, D.J. Davidson, N.S. Diffenbaugh, P.L. Kinney, P. Kirshen, P.
Kovacs, and L. Villers Ruiz. (2014). North America. In: Climate Change 2014: Impacts,
Adaptation, and Vulnerability. Part B: Regional Aspects. Contribution of Working Group II to
the Fifth Assessment Report of the Intergovernmental Panel on Climate Change [Barros, V.R.,
C.B. Field, D.J. Dokken, M.D. Mastrandrea, K.J. Mach, T.E. Bilir, M. Chatterjee, K.L. Ebi, Y.O.
Estrada, R.C. Genova, B. Girma, E.S. Kissel, A.N. Levy, S. MacCracken, P.R. Mastrandrea, and
L.L.White (eds.)]. Cambridge University Press, Cambridge, United Kingdom and New York,
NY, USA, 1439-1498.
San Antonio Water System (2017). 2017 Water Management Plan. Retrieved from
http://saws.org/Your_Water/WaterResources/2017_WMP/docs/20171107_SAWS-2017-Water-
Management-Plan.pdf
SAWS: Brackish Groundwater - Desalination. (n.d.). Retrieved September 26, 2018, from
http://www.saws.org/Your_Water/WaterResources/Projects/desal.cfm
SAWS Conservation: Drought Restrictions. (n.d.). Retrieved February 1, 2019, from
http://www.saws.org/conservation/droughtrestrictions/
SAWS Conservation: Seven Steps to Xeriscaping. (n.d.). Retrieved February 8, 2019, from
https://www.saws.org/conservation/Outdoor/sevensteps.cfm
Sovocool, K. A., Morgan, M., & Bennett, D. (2006). An in-depth investigation of Xeriscape as a
water conservation measure. Journal (American Water Works Association), 98(2), 82–93.
Telfeyan, K., Johannesson, K. H., Mohajerin, T. J., & Palmore, C. D. (2015). Vanadium geochemistry
along groundwater flow paths in contrasting aquifers of the United States: Carrizo Sand (Texas)
http://saws.org/Your_Water/WaterResources/2017_WMP/docs/20171107_SAWS-2017-Water-Management-Plan.pdf

Hudock 53
and Oasis Valley (Nevada) aquifers. Chemical Geology, 410, 63–78.
https://doi.org/10.1016/j.chemgeo.2015.05.024
Texas Water Development Board. (2005). The Texas Manual on Rainwater Harvesting. 1–57.
U.S. Global Change Research Program. (2018). Fourth National Climate Assessment. Retrieved
December 7, 2018, from
https://nca2018.globalchange.govhttps://nca2018.globalchange.gov/chapter/23
Venkataraman, K., Tummuri, S., Medina, A., & Perry, J. (2016). 21st century drought outlook for
major climate divisions of Texas based on CMIP5 multimodel ensemble: Implications for water
resource management. Journal of Hydrology, 534, 300–316.
https://doi.org/10.1016/j.jhydrol.2016.01.001
Wurbs, R. A. (2015). Institutional and Hydrologic Water Availability in Texas. Water Resources
Management, 29(2), 217–231. https://doi.org/10.1007/s11269-014-0701-4
Zhang, X., Hu, M., Chen, G., & Xu, Y. (2012). Urban Rainwater Utilization and its Role in
Mitigating Urban Waterlogging Problems—A Case Study in Nanjing, China. Water Resources
Management, 26(13), 3757–3766. https://doi.org/10.1007/s11269-012-0101-6

Hudock 54
Biography
Mathias William Hudock was born in San Antonio, Texas on July 3rd, 1997. After
graduating as valedictorian of his small high school in 2015, Mathias enrolled the University of
Texas at Austin’s Environmental Science and Plan II Honors programs. He graduated in 2019
and will attend the University of Texas at Dallas’ Masters of Science in Geospatial Information
Sciences Program in the fall.