The Future of Spectroscopy - Confex · The Future of Spectroscopy M. Darby Dyar Dept. of Astronomy...
35
The Future of Spectroscopy M. Darby Dyar Dept. of Astronomy Mount Holyoke College Senior Scientist Planetary Science Institute http://www.movie-roulette.com/photos_big/monty-python-and-the-holy-grail-4-1.jpeg The Holy Grail: Accurate Mineralogy Derived from Spectroscopy
Transcript of The Future of Spectroscopy - Confex · The Future of Spectroscopy M. Darby Dyar Dept. of Astronomy...

The Future of Spectroscopy
M. Darby DyarDept. of Astronomy
Mount Holyoke CollegeSenior Scientist
Planetary Science Institute
http://www.movie-roulette.com/photos_big/monty-python-and-the-holy-grail-4-1.jpeg
The Holy Grail: Accurate Mineralogy Derived from Spectroscopy

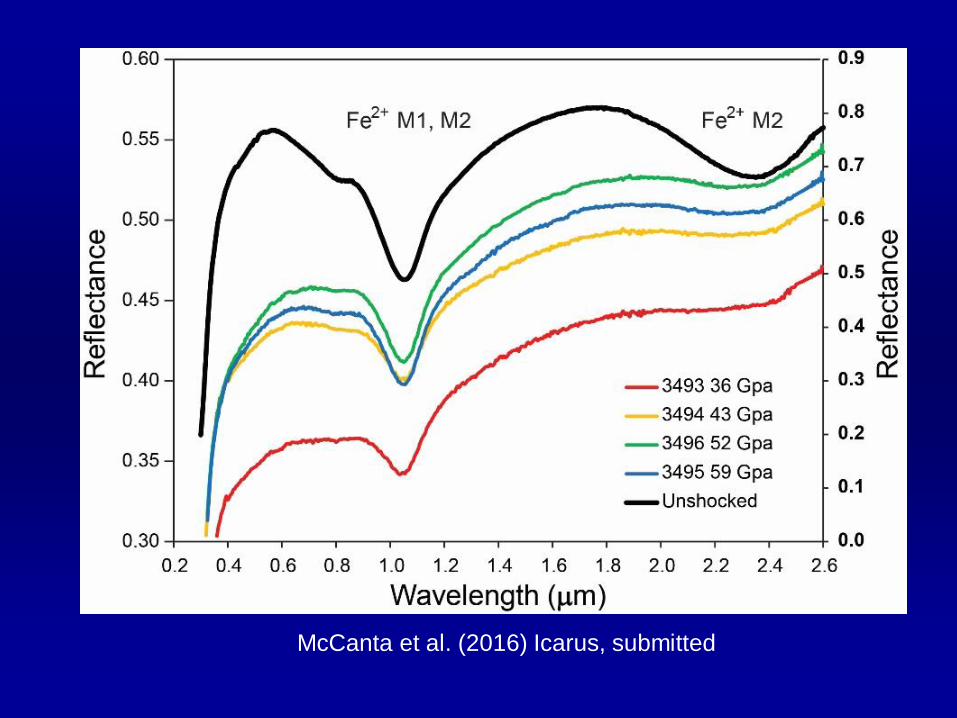
McCanta et al. (2016) Icarus, submitted

Pelkey, S. M., et al. (2007), CRISM multispectral summary products: Parameterizing mineral
diversity on Mars from reflectance, J. Geophys. Res., 112, E08S14, doi:10.1029/2006JE002831.

Klima et al. (2007)
MAPS, 42, 235-253
Tanabe-
Sugano
diagram for
pyroxene

Spectroscopy
+
Machine
Learning
=
Better
Spectroscopy
http://onlinelibrary.wiley.com/journal/10.1002/%28ISSN%291099-128X

Chemometrics is an interdisciplinary field combining experimental design, physical-chemical measurements, multivariate statistical analysis, mathematical modeling, and information technology for extracting useful information from data.
…Journal of Chemometrics

Chemometric Approaches to:
A. Multivariate analysis
B. X-ray absorption spectroscopy
C. Laser-induced breakdown spectroscopy
D. Baseline removal
E. Calibration transfer
F. Data preprocessing

• Shrink regression equation by creating hybrid
channels that are linear combinations of all previous
channels.
• Correlate two matrices described by Y = X b :
• Spectra (X) (p samples × N channels)
• Variable(s) of interest (Y)
• This removes co-linearity because directions in that
new vector space are ortho-normal, avoiding the
problem that inhibits ordinary least-squares
regression.
• PLS analysis thus produces b-coefficients for each
channel that represent the correlation implicit in b.
A. Multivariate Analysis
Most Basic Technique for Multivariate Analysis
Partial Least Squares (PLS)

Most Basic Technique for Multivariate Analysis
Partial Least Squares (PLS)
Each Spectral Channel is an Independent Variable
Prediction Quantities (elements, mineralogy, %Fe3+) are the Dependent Variable(s)
Fe3+
l1 (keV)
l2 (keV)
l3 (keV)
l4 (keV)
l5 (keV)
l6
(keV)l7
(keV)l8
(keV)l9
(keV)l10
(keV) ……ln
(keV)
Sample 1
Sample 2
Sample 3
Sample 4
Sample 5
…
Sample n
A. Multivariate Analysis

B. XAS Example
Example #1:
X-ray Absorption Spectroscopy
1s → nd
1s → (n+1)d
1s → continuum
X-ray Absorption Near-
Edge Structure
(XANES) Extended X-ray
Absorption Fine
Structure (EXAFS)

Using XAS to
measure redox
state of Fe
Bajt et al. (1994):
Centroid of pre-edge
moves with valence state
B. XAS Example

B. XAS Example
Wilke et al. (2001) Am. Min. 86, 714-730, calibration for powders
Fe XANES Data used to Predict %Fe3+
in Powders using XANES Pre-Edge

B. XAS Example
Garnet
XANES
Data

B. XAS Example

B. XAS Example

B. XAS Example
Multivariate
Predictions of Fe3+ in
Silicate Glass and
Garnet

Garnet XAS Data
Amphibole XAS Data
B. XAS Example
Identification of Key
Predictive Channels

Laser-Induced Breakdown Spectroscopy: LIBS
C. LIBS Example

Na lines:
588.9950
589.5924 nm
C. LIBS Example

21
Low Ni
High Ni
LIBS Challenge for Geological Samples: Matrix Effects!
C. LIBS Example

Prediction of SiO2 contents of LIBS standards (1354 samples, 3 plasma
temperatures, Mars conditions) using this single Si I emission line is:
±13.76 wt.% SiO2 C. LIBS Example
Matrix effects
cause non-
linearity in peak
intensities!

Prediction of SiO2 using all channels of this spectrum is: ±4.69 wt.% SiO2
C. LIBS Example

C. LIBS Example

Chemometrics (Machine Learning) gives us
answers to vexing problems…
D. Baseline RemovalThe baseline removal conundrum

Species matching success for Raman spectroscopy comparing optimized
baseline removal methods to no baseline removal (far left) and Custom
BLR (far right) by taxonomic rank (Dana classification number).
D. Baseline Removal

Calibration Transfer
Lab
(Earth)
Mars
E. Cal Trans

Predict lab data with lab data
Predict Mars data with lab data
E. Cal Trans

Visualization of Spectral Preprocessing Steps
Raman Data
F. Spectral Pre-Processing

Protocols Based on Individual Peaks
and Underlying Physical Principles
Insights from
Machine Learning
Machine Learning can
enable fundamental
Insights into spectra
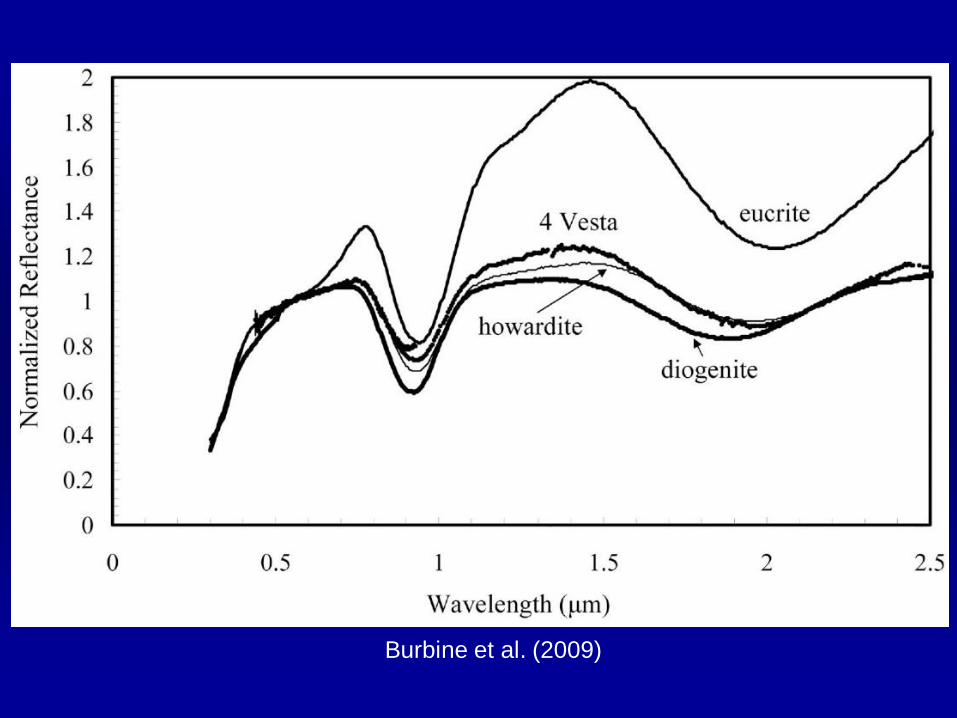
Burbine et al. (2009)

Barriers to Using Machine Learning
1. Too little overlap between planetary and
computer science communities
2. Steep learning curve to understand new methods
3. Reluctance to move on from fundamentals-based
approaches
4. Inadequate and silo-ed spectral databases
5. Ignorance of instrumental differences

Benefits of Using Machine Learning
1. Utilize & evaluate all channels of spectral data
using automated (objective) feature selection
2. Quantifiable error bars for conclusions based
on spectral data
3. Improved instrument design for planetary
exploration
4. Calibration transfer between data sets
5. Ability to integrate data from multiple types of
spectroscopy in a single model
6. Gain new insights into fundamental physical
processes