21st century neural value chains - Heralding the future of ...

THE FUTURE OF GLOBAL VALUE CHAINSBUSINESS AS USUAL
OR "A NEW NORMAL"?
OECD SCIENCE, TECHNOLOGY AND INNOVATIONPOLICY PAPERSJuly 2017 No. 41

THE FUTURE OF GLOBAL VALUE CHAINS: BUSINESS AS USUAL OR “A NEW NORMAL”?
2 OECD SCIENCE, TECHNOLOGY AND INDUSTRY POLICY PAPERS
FOREWORD
This paper was authored by Koen De Backer and Dorothée Flaig of the OECD Secretariat. The Committee on Industry, Innovation and Entrepreneurship (CIIE) approved and declassified the paper on 27 April 2017 as part of its work on “Seizing the Opportunities of GVCs”. Because of the joint work between STI and TAD, the paper has also been discussed at the Working Party of the Trade Committee (WPTC) of 15 June; comments of the WPTC delegates have been taken into account in this version of the paper.
Note to Delegations:
The paper is also available on OLIS under the reference cote: DSTI/CIIE(2017)2
This document, as well as any data and any map included herein, are without prejudice to the status of or sovereignty over any territory, to the delimitation of international frontiers and boundaries and to the name of any territory, city or area.
The statistical data for Israel are supplied by and under the responsibility of the relevant Israeli authorities. The use of such data by the OECD is without prejudice to the status of the Golan Heights, East Jerusalem and Israeli settlements in the West Bank under the terms of international law.
© OECD 2017 You can copy, download or print OECD content for your own use, and you can include excerpts from OECD publications, databases and multimedia products in your own documents, presentations, blogs, websites and teaching materials, provided that suitable acknowledgment of OECD as source and copyright owner is given. All requests for commercial use and translation rights should be submitted to [email protected].

THE FUTURE OF GLOBAL VALUE CHAINS: BUSINESS AS USUAL OR “A NEW NORMAL”?
OECD SCIENCE, TECHNOLOGY AND INDUSTRY POLICY PAPERS 3
ABSTRACT
The rapid growth of global value chains (GVCs) has been an important driver of globalisation during the past decades. But the international fragmentation of production appears to have lost momentum and GVCs seem to have stalled in recent years. The world economy is facing a number of structural shifts that may dramatically change the outlook of GVCs in the coming years. The empirical evidence evaluating the potential impact of these shifts however largely lags behind, which makes these discussions somewhat speculative. By describing how these shifts will likely evolve over the next 10 to 15 years and calculating their effects on global production and trade, the scenarios in this paper offers new - empirically funded - insights on the future of GVCs.

THE FUTURE OF GLOBAL VALUE CHAINS: BUSINESS AS USUAL OR “A NEW NORMAL”?
4 OECD SCIENCE, TECHNOLOGY AND INDUSTRY POLICY PAPERS
TABLE OF CONTENTS
FOREWORD ................................................................................................................................................... 2
ABSTRACT .................................................................................................................................................... 3
EXECUTIVE SUMMARY ............................................................................................................................. 6
THE FUTURE OF GLOBAL VALUE CHAINS: BUSINESS AS USUAL OR “A NEW NORMAL”? ...... 8
1. Introduction .............................................................................................................................................. 8 2. Business as usual: factors that further promote the expansion of GVCs ............................................... 9
2.1.Open trade and investment agreements ............................................................................................ 10 2.2 Digitalisation and ICT: new communication technologies .............................................................. 12 2.3 New (low-cost) producers in manufacturing .................................................................................... 13 2.4 Growing demand in emerging economies ........................................................................................ 13 2.5 Development of services .................................................................................................................. 15 2.6 The role of Multinational Enterprises (MNEs) ................................................................................ 15
3. “A new normal”: factors that will reorient/impede the growth of GVCs .............................................. 16 3.1. Changing cost conditions in emerging economies .......................................................................... 17 3.2. The hidden/extra-costs of international fragmentation .................................................................... 18 3.3 In search of resilience: balancing risk diversification and cost efficiency ....................................... 19 3.4. Digitalisation and ICT: new information technologies ................................................................... 19 3.5 From mass production to mass customisation .................................................................................. 21 3.6 The green and sustainability imperative ........................................................................................... 22
4. Empirical analysis using the OECD’s METRO model .......................................................................... 24 4.1 The rationale of the empirical analysis ............................................................................................. 24 4.2. The OECD’s METRO model and its (dis)advantages for this analysis .......................................... 25 4.3 The interpretation of the results ........................................................................................................ 28
5. Results .................................................................................................................................................... 29 5.1. Scenario 1: trade policy ................................................................................................................... 30 5.2. Scenario 2: new (low-cost) producers in manufacturing ................................................................. 32 5.3. Scenario 3: growing demand in emerging economies ..................................................................... 34 5.4. Scenario 4: rising wage costs .......................................................................................................... 36 5.5. Scenario 5: the digitalisation (IT) of production ............................................................................. 38 5.6 Scenario 6: rising transport costs ...................................................................................................... 40 5.7 A combined scenario: new manufacturers, growing demand in emerging economies, rising wage and transports and the digitalisation (IT) of production ......................................................................... 42
6. Discussion and concluding remarks ....................................................................................................... 44
NOTES .......................................................................................................................................................... 49
REFERENCES .............................................................................................................................................. 53
ANNEX: AGGREGATION OF REGIONS, SECTORS AND FACTORS ................................................. 58

THE FUTURE OF GLOBAL VALUE CHAINS: BUSINESS AS USUAL OR “A NEW NORMAL”?
OECD SCIENCE, TECHNOLOGY AND INDUSTRY POLICY PAPERS 5
Tables
Table 1. Historical evolution of GVC indicators used in this analysis ................................................ 29 Table 2. Summary of simulated shocks and effects............................................................................. 45
Figures
Figure 1. Evolution of regional trade agreements in the world, 1948-2016 .......................................... 11 Figure 2. Diffusion of selected ICT tools and activities in enterprises, 2015 ........................................ 12 Figure 3. Middle-class consumption, 1965-2030 .................................................................................. 14 Figure 4. Foreign affiliates’ production, inward and outward investment, 2000-2014 ......................... 16 Figure 5. Evolution of average wage costs, 2011-2030 (United States = 100)...................................... 17 Figure 6. The confluence of key technologies enabling the industrial digital transformation ............... 20 Figure 7. Simulation results for scenario 1: trade policy ....................................................................... 31 Figure 8. Simulation results for scenario 2: new (low-cost) producers in manufacturing ..................... 33 Figure 9. Simulation results for scenario 3: growing demand in emerging economies ......................... 35 Figure 10. Simulation results for scenario 4: rising wage costs .............................................................. 37 Figure 11. Simulation results for scenario 5: the digitalisation (IT) of production ................................. 39 Figure 12. Simulation results for scenario 6: rising transport costs ......................................................... 41 Figure 13. Simulation results for combined scenario: new (low-cost) producers in manufacturers, growing demand in emerging economies, rising wage and transport costs and digitalisation (IT) of production .................................................................................. 43
Boxes
Box 1. 3D-printing and GVCs ................................................................................................................... 22 Box 2. What with transport costs? ............................................................................................................. 23 Box 3. The OECD METRO model ............................................................................................................ 26

THE FUTURE OF GLOBAL VALUE CHAINS: BUSINESS AS USUAL OR “A NEW NORMAL”?
6 OECD SCIENCE, TECHNOLOGY AND INDUSTRY POLICY PAPERS
EXECUTIVE SUMMARY
It has been argued that the world economy faces a number of structural shifts that may dramatically change – some even refer to ‘seismic’ changes – the outlook of GVCs in the coming years. Because of the importance of GVCs in today’s economy, these changes will also determine the future of globalisation. On the one side, there are factors that have promoted the emergence and growth of GVCs in the past and these are expected to facilitate the future expansion of GVCs; thus, business as usual. New communication technologies (i.e. the “C” in ICT) which allow for the coordination of activities across large distances, the integration of emerging economies because of their low (labour costs) in manufacturing, the growing middle class in emerging economies which gradually changes (consumer) demand and results in fast growing end-markets in these countries, the efficient provision of ‘modern’ services (telecommunications, logistics, business services, etc.) which are the glue that ties GVCs together and the rapid growth of Multinational Enterprises (MNEs) are all major reasons why GVCs have expanded significantly since the 2000s.
Also open trade and investment policies have contributed to the growth of GVCs in the past, but recent (policy) views and stances on the benefits of further liberalisation are so different and uncertain in different parts of the world, that forecasting the direction and impact of future policy developments is difficult for the moment.
On the other side, there are other factors that push for “A new normal” of GVCs; these include old and new factors, i.e. factors which are known to negatively impact GVCs but also emerging factors of which the possible effects on GVCs are less known. These factors are expected to increasingly challenge the organisation of production in longer and complex GVCs and may shape the future evolution of GVCs differently. Strongly rising wage costs in (some) emerging economies and the growing digitalisation of production because of new information technologies (i.e. the “I” in ICT, robotics, automation, artificial intelligence, etc.) are expected to restore the competitiveness of developed economies and discourage further offshoring to emerging economies. In addition, rising transport costs, the hidden and extra-costs of offshoring including the problems in protecting proprietary knowledge and KBC abroad, the growing need to balance cost efficiency with risk diversification which comes at a cost, will make the international dispersion of production more expensive. Also future extra costs arising from policy efforts to internalise the environmental costs of (international) transport may make the international trade of goods and services more costly and thus affect the further offshoring of activities within GVCs.
Discussions on the future of GVCs and globalisation more generally remain somewhat speculative as they lack evidence-based insights. This paper simulates how production and trade within GVCs may look like in 2030 under different scenarios which describe the (most) likely evolution of each of the driving factors in the future. The results indicate that the growing digitalisation of production is most likely the biggest game-changer, reversing the importance and length of GVCs and reorienting global production and trade back towards OECD economies. Reshoring of activities is expected to become increasingly attractive when these activities can be highly automated; the employment impact of reshoring can thus expected to be rather limited.
Rising wage costs in emerging economies will work in the same direction but the results indicate that the impact of this factor will likely to be significantly smaller. It can be expected that activities relocated from high-cost emerging economies will go also to other emerging economies instead of being reshored to OECD economies. Indeed, there are still millions of people in emerging economies ready to leave their agricultural livelihood in the countryside for a job in a manufacturing factory in the city. Nevertheless, it is argued that the traditional model of economic development through industrialisation has come under

THE FUTURE OF GLOBAL VALUE CHAINS: BUSINESS AS USUAL OR “A NEW NORMAL”?
OECD SCIENCE, TECHNOLOGY AND INDUSTRY POLICY PAPERS 7
increasing pressure with (some) developing economies undergoing a process of ‘premature’ desindustrialisation.
Also rising transport costs will depress the international fragmentation of production within GVCs. Transport costs are however not expected to rise dramatically in the near future especially because of the (large) over-supply in maritime transport – which accounts for roughly 80% of international cargo (volume) transport. But even the rather moderate increases in transport costs modelled in this paper show already that GVCs will be affected, also because of the other factors increasing the cost of international trade of goods and services (e.g. the need to balance cost efficency and risk diversification, the hidden and extra costs of offshoring).
The positive impacts on the future growth of GVCs through factors supporting the ”Business as usual” storyline, such as new (low-cost)producers in manufacturing and growing demand in emerging economies, are evaluated to be much smaller. While these factors will further promote the expansion of GVCs towards 2030, their impact will especially be felt in the geographic distribution of global production and trade, rather than in the overall scale of trade. The growing integration of new manufacturers and the growing middle class in emerging economies will further shift the economic centre in South-Eastern direction.
Overall, the impacts of individual factors – “Business as usual” as well as “A new normal” – appear to be rather moderate, particularly when comparing these with the explosive growth of GVCs in the 2000s. But the results further show that it is the confluence of the different structural factors that will affect the future growth of GVCs: international sourcing of intermediates (in percentage of production) and the trade/GDP ratio are estimated to drop to the levels of 2005-2006. At the same time, a structural reallocation of global trade and production is expected to take place towards developed economies, as especially digitalisation will help to restore the competitiveness of these countries.
The estimates presented give a clear indication that the future of GVCs may look quite different from the past but the results should not be interpreted as exact forecasts, but rather scenarios. There are too many uncertainties - now and in the near future - surrounding the global economy that have not been included in the empirical analysis. The current views on trade and investment liberalisation across different countries is a clear illustration of this. Instead of trying to predict the future over the next 10-15 years, this paper provides rather a foresight exercise to get a better understanding of the factors (and their impacts) that are important for the future of GVCs and globalisation more broadly. A number of future directions have been raised for extending and further fine-tuning the analysis, but it is hoped that the results start to inform policy makers about the future of GVCs and globalisation.

THE FUTURE OF GLOBAL VALUE CHAINS: BUSINESS AS USUAL OR “A NEW NORMAL”?
8 OECD SCIENCE, TECHNOLOGY AND INDUSTRY POLICY PAPERS
THE FUTURE OF GLOBAL VALUE CHAINS: BUSINESS AS USUAL OR “A NEW NORMAL”?
KOEN DE BACKER and DOROTHEE FLAIG
1. Introduction
The rapid growth of global value chains (GVCs) has been an important driver of globalisation during the past decades. As it became easier for companies to offshore activities over large distances, production processes have become internationally fragmented with inputs sourced from different countries and products increasingly ‘made in the world’. After their explosive growth during the early 2000s, GVCs have gradually become the backbone of the global economy (Catteneo et al., 2010) and dramatically changed its functioning. Global production nowadays spans a growing number of companies, industries and countries and a number of emerging economies have become economic powerhouses because of GVCs. The large flows of goods, services, capital, people and technology moving across borders within these international production networks have resulted in a growing interconnectedness between countries (OECD, 2013a)1
Since their emergence in the 1980s, GVCs have become longer and more complex. Production stages of a growing number of goods - more traditional products like textiles as well as more technology-intensive products like e.g. electronics - and increasingly also services are spread out across a multiple of locations. This in turn has resulted in growing trade and transport flows over time. The organisation of production in long and complex GVCs to take advantage of optimal location factors for specific stages of production across the globe has shown its advantages for companies in terms of productivity, efficiency, scale economies, etc2.
But the international fragmentation of production appears to have lost momentum and GVCs seem to have stalled in recent years. New research analysing the global trade slowdown shows that the decline in international production fragmentation is one contributing factor to the falling trade-to-GDP ratios in recent years (IMF, 2016, OECD, 2016a, Timmer et al., 2016) 3. A (limited) consolidation of GVCs had already been observed during the economic crisis in 2008/2009, but trade as well as GVC growth picked up again soon thereafter. In contrast, the recent trade and GVC slowdown is argued to stem from more structural determinants suggesting that a new normal of GVCs may be at the horizon. Illustrating this is the growing popularity of the concept of ‘peak trade’ (Tomb and Trivedi, 2017).
Technological progress has traditionally played a key role in shaping the (international) organisation of production. Baldwin (2016) discusses how the rise of certain technologies has revolutionised the global production process and led to different waves of unbundling (the steam revolution for the first unbundling between production and consumption; ICT, in particular communication technology, for the second unbundling of production activities). OECD (2017a) discusses in more detail the technologies underpinning the next industrial/production revolution of the future.
But technology is not the only factor; a number of reasons have been put forward to explain the shifting dynamics in GVCs (Timmer et al., 2016; Standard Chartered, 2015). Rising trade costs and protectionism since the economic crisis have made international production more expensive (Evenett and Fritz, 2015). In addition, localised production - i.e. producing close to the (final) market - has become more attractive in advanced economies - because of digital technologies - as well as in emerging economies since their increased capabilities necessitate fewer imports (OECD, 2016a; Kee and Tang, 2016). Alternatively, others have argued that the fact that GVCs have recently stalled is basically a realignment and normalisation of the previous overshooting in international fragmentation (Harms et al., 2012; Baldwin and Venables, 2013).

THE FUTURE OF GLOBAL VALUE CHAINS: BUSINESS AS USUAL OR “A NEW NORMAL”?
OECD SCIENCE, TECHNOLOGY AND INDUSTRY POLICY PAPERS 9
In addition, the growing complexity of international production networks may have reached its limits and there are indications that companies have started to rethink their sourcing and production strategies. GVCs have exposed companies to large levels of supply risk in the event of adverse shocks; a natural disaster such as the earthquake in the North-East of Japan 2011 has clearly demonstrated the fragilities of complex and long GVCs (OECD, 2013a). Furthermore, the organisation of production activities in GVCs has made companies less agile to respond to changing preferences in consumer demand. Linked to this, consumer awareness for the negative effects of transport flows of intermediates and final products within GVCs is growing.
As the continuous expansion of GVCs may (have) come to an end, concerns about future production, trade and economic growth are rapidly rising in countries. Trade has traditionally been an important driver of productivity and economic growth of economies. One question that is increasingly raised in discussions on (the future of) globalisation, is whether the relationship between trade and GDP growth has been undergoing a structural shift in recent years. It is clear that a slowdown of trade within GVCs will rapidly have consequences for the global economy. Likewise, a new era of GVC dynamics will most likely result in a re-configuration of the international production landscape with significant shifts in competitiveness between regions and countries.
This paper discusses the most important factors that will determine the future of GVCs and thus globalisation in a systematic way. The last years have seen extensive analysis emerging on the historical and current importance of GVCs, but forward-looking research on GVCs – in particular supported by empirical evidence - is much more limited. Policy makers need to better understand these potential future shifts and their impacts the more as the future of globalisation is increasingly debated. While the list of factors may not be exhaustive, we believe that the paper identifies the most important forces that will affect the scope, length and complexity of GVCs in the near future (let’s say the next 10 to 15 years). In doing this, a distinction is made between at the one side factors expected to further promote the expansion of GVCs (business as usual) and at the other side so-called game-changers or shifts that may reorient and inhibit the growth of GVCs (“new normal”).
The paper empirically simulates how production and trade within GVCs may look like in 2030 under different scenarios. The objective is to assess if and to what extent different determinants may shift the structure and dynamics of GVCs. The different scenarios describe the (most) likely evolution of each of the driving factors in the future and are then calculated through using the OECD METRO-model which is a general equilibrium model on trade. It should be made clear from in the beginning that the aim of the paper is not about predicting the future, as there are too many uncertainties – now and in the near future - surrounding the global economy. The scenarios in this paper look at the impact of individual factors while the future will be the result of different factors changing simultaneously including these which have not been included in our modelling. Instead of forecasting, the paper proposes a foresight exercise to develop a better understanding of the factors that are important in the future of GVCs4. The empirical results thus aim to illustrate possible future developments rather than actually predicting what will happen in the future.
2. Business as usual: factors that further promote the expansion of GVCs5
Several of the factors that have been driving the growth of GVCs in the past (see for a first overview OECD (2013)) will continue to push the international fragmentation of production processes also in the future. Because of these factors, the length and complexity of GVCs can be expected to further increase although some characteristics of GVCs (e.g. regional character, industry concentration) might change over time depending on the relative importance of each of these driving factors.

THE FUTURE OF GLOBAL VALUE CHAINS: BUSINESS AS USUAL OR “A NEW NORMAL”?
10 OECD SCIENCE, TECHNOLOGY AND INDUSTRY POLICY PAPERS
2.1.Open trade and investment agreements
Successive rounds of liberalisation have resulted in barriers to trade and investment to fall gradually over time, particularly for (manufactured) goods. The scope for further reduction in tariffs seems to be rather limited particularly in OECD economies, although other countries still apply significant tariffs. But in addition to tariff barriers, non-tariff measures encompass a wide variety of trade impediments and regulations, such as administrative custom procedures, technical regulations, and health and safety standards, quantitative restrictions such as quotas and voluntary export restraints and subsidies (Moïse and Sorescu, 2015). In addition, domestic regulations and limitations on foreign investment impact international investment as well as trade.
Although the gradual lowering of non-tariff barriers has already contributed to international trade of goods and services in the past, it is especially in this domain that the largest progress could be expected in the future. The mutual recognition of standards, technical regulation, better trade facilitation measures will favour the expansion of GVCs. Important in this respect will be the reduction of barriers to services trade because of the growing importance of services, also within GVCs (see below). Ongoing OECD work on the Services Trade Restrictiveness Index has shown that important barriers to trade and investment in services exist (OECD, 2014).
Reflecting the failure of the WTO Doha Round, a shift has been observed from multilateral trade negotiations towards bilateral, regional and even industry-level agreements. The World Trade Organisation (WTO) reports that the number of regional trade agreements in force – mostly on the bilateral level – has grown dramatically since 1990 with more agreements under negotiation (Figure 1). In addition, recent years saw negotiations evolving on new (mega-)regional agreements – i.e. between different countries - such as ASEAN6, Trans-Pacific Partnership (TPP)7, Transatlantic Trade and Investment Partnership (TTIP)8, Pacific Alliance in Latin America9, Regional Comprehensive Economic Partnership (RCEP)10. A lot of these agreements concern so-called ‘deep’ agreements addressing behind-the-border issues including transparency, investment, intellectual property rights, competition, etc. which are crucial to the smooth functioning of GVCs. It could be that such regional agreements, if successful, will rather strengthen the regional character of GVCs.

THE FUTURE OF GLOBAL VALUE CHAINS: BUSINESS AS USUAL OR “A NEW NORMAL”?
OECD SCIENCE, TECHNOLOGY AND INDUSTRY POLICY PAPERS 11
Figure 1. Evolution of regional trade agreements in the world, 1948-2016
Source: WTO
The rise in trade agreements has been mirrored by an increase in bilateral investments treaties (BITs), which govern the interactions between (private) foreign investors and host governments. Particularly since the 1990s, a growing number of BITs have been agreed with, and more than 3,000 such agreements have been signed. In recent years, also emerging economies have been increasingly negotiating BITs reflecting their growing importance as foreign investor abroad (Baldwin, 2016).
But globalisation is increasingly facing headwinds in recent years, often motivated by the anxiety of people about job security and stagnating incomes (HSBC, 2015). For example, a number of the above mentioned regional trade agreements have attracted a lot of opposition in different countries. Recent protectionism is also reflected in the growing number of new trade measures that have been implemented by countries since the economic crisis in 2008/2009. The regular joint WTO/OECD/UNCTAD report (November 2016) – measuring trade and investment measures for G20 countries, identified 1671 trade restrictive measures introduced since 2008, of which only 408 had been removed by mid-October 201611. A significant share of these measures can be characterised as localisation barriers – i.e. measures that favour domestic industry at the expense of foreign competitors. Local content requirements for example prescribe that a minimum level of locally produced – as opposed to imported – materials, parts, etc. is sometimes required when giving foreign companies the right to manufacture in a particular place. Such measures are detrimental to the international sourcing and trade of intermediate goods and services within GVCs and an increase in this type of measures may limit the further growth of GVCs.
431
643
271
0
100
200
300
400
500
600
700
0
5
10
15
20
25
30
35
40
45
50
55
60
65
70
75
80
85
90
95
100
105
Num
ber p
er y
ear
Cum
ulat
ive n
umbe
r
Notifications of RTAs in force
Notifications of Inactive RTAs
Note: Notifications of RTAs: goods, services & accessions to an RTA are counted separately. Physical RTAs: goods, services & accessions to an RTA are counted together. The cumulative lines show the number of notifications/physical RTAs that were in force for a given year.Source: WTO Secretariat.
Cumulative Notifications of RTAs in force and inactive RTAs
Cumulative Number of Physical RTAs in forceCumulative Notifications of RTAs in force

THE FUTURE OF GLOBAL VALUE CHAINS: BUSINESS AS USUAL OR “A NEW NORMAL”?
12 OECD SCIENCE, TECHNOLOGY AND INDUSTRY POLICY PAPERS
2.2 Digitalisation and ICT: new communication technologies
In addition to trade and investment liberalisation, the spread of GVCs has especially been facilitated by the rapid technological advances in ICT. Baldwin (2016) explicitly refers to the ICT revolution as the technological breakthrough behind the international dispersion of activities within GVCs. Cheaper and more reliable telecommunications as well as information management software and increasingly powerful personal computers have significantly decreased the cost of organising complex activities over long distances both within and between companies (Baldwin, 2016). The co-ordination and transaction costs associated with international fragmentation (e.g. communication, information and governance costs) fell quickly below the expected cost advantages through specialisation, economies of scale and differences in (labour) costs; this has motivated companies to organise their production processes on an international scale.
The wider availability and the better performance of communication technologies like improved broadband applications, the spread of smartphones, video and virtual conference, etc. is already allowing for more efficient communication within GVCs. The Internet of Things, bolstered by powerful sensors and ‘smart’ products, will deliver faster and cheaper communications in the future (HSBC, 2015). On top of this, newer and more sophisticated – but not that frequently used yet (Figure 2) - communication technologies/applications will allow for the better management of information flows. For example, radio-frequency identification technology (RFID) technology will make it cheaper and easier to track and monitor inputs throughout the supply chain (Standard Chartered, 2015). Also big data is expected to promote GVCs as it allows through the use of data (sales, inventories, deficiencies, etc.) to better plan the production process and adapt to changes in production conditions and market requirements. In general, digital communication technologies are expected to make it easier to operate longer and more complex GVCs in the future.
Figure 2. Diffusion of selected ICT tools and activities in enterprises, 2015
As a percentage of enterprises with ten or more persons employed
Source: OECD (2017b)
MEX
MEX
GRCPOL
ISL POL GRC HUN CAN
FINFIN
CHE
IRLDEU FIN
NZL
DNK
KOR
0
20
40
60
80
100
Broadband Website E-purchases Social media Enterpriseresourceplanning
Cloudcomputing
E-sales Supply chainmngt. (ADE)
RFID
%
Gap 1st and 3rd quartiles Average Lowest Highest

THE FUTURE OF GLOBAL VALUE CHAINS: BUSINESS AS USUAL OR “A NEW NORMAL”?
OECD SCIENCE, TECHNOLOGY AND INDUSTRY POLICY PAPERS 13
2.3 New (low-cost) producers in manufacturing
Emerging economies have become important partners in GVCs especially in producing manufactured goods. Numerous activities across different manufacturing industries have been relocated to emerging economies as sourcing inputs from low-cost producers, either within or outside the boundaries of the firm, lowered production costs. The emergence of GVCs has allowed emerging economies to integrate in the global economy faster than in the past. Countries are able to specialise in a certain production activity according to their comparative advantage instead of developing the whole value chain itself (OECD, 2013a).
Participation in GVCs is often viewed by governments as a fast track to industrialisation and strategies to increase the participation within GVCs are essentially part of economic development policies. In addition, countries already participating in GVCs are increasingly looking to upgrade their GVC activities. This necessarily means giving up certain activities thereby creating opportunities for new players (i.e. other emerging economies). As a result, countries that have been receivers of offshoring in the previous decade (e.g. the People’s Republic of China, [hereafter "China"]) have recently witnessed a growing offshoring to new low cost countries like Cambodia, Viet Nam, etc. Indeed, in addition to a number of larger emerging economies, many smaller countries are also developing fast. The economic rise of these economies is expected to expand GVCs more thereby further shifting the centre of gravity of the world economy towards the east and south.
One thing these new economic players have in common is their vast and rapidly growing labour force, which gives these countries an advantage especially in labour-intensive industries and activities. In contrast, the labour force in developed and some other emerging economies is expected to stagnate or even decrease over the next 10 to 15 years. Because of the higher population growth in emerging economies in South Asia and Africa, over 1 billion additional persons are projected to be of working age over the next years (OECD, 2016b). While also representing a big challenge for policy makers a high proportion of working-age adults can offer these countries a much needed economic boost resulting in strong economic growth, productivity increases and growing GVC integration. A problem for these countries though is often their lack of a conducive business environment for investments and economic activities, with significant bottlenecks in infrastructure, education, governance, etc.
Recently, it has been argued however that economic development through industrialisation is coming under increasing pressure. The traditional model of industrialisation - starting with low-end, labour-intensive manufacturing allowing to move large number of people from agriculture to manufacturing, is increasingly eroded. Rodrik (2015) demonstrates that a trend of premature deindustrialisation is taking place with many developing countries becoming service economies without having had a proper experience of industrialisation.
2.4 Growing demand in emerging economies
The attractiveness of emerging economies within GVCs however is not only determined by their supply conditions and particularly their cost conditions. In addition to their lower labour costs, emerging economies are also quickly becoming important consumer markets. Countries like China and India are the world’s most populous countries and continue to have high GDP growth, which make them increasingly important markets for firms in many industries. Population growth in the next decades will take place almost entirely in less developed countries, while population size in the developed world will overall stabilise with some developed countries forecasted to experience a population decline.
In addition to population growth, the rising general prosperity in emerging economies will lead to changing patterns of international demand. At a time when large parts of the developed world face slower

THE FUTURE OF GLOBAL VALUE CHAINS: BUSINESS AS USUAL OR “A NEW NORMAL”?
14 OECD SCIENCE, TECHNOLOGY AND INDUSTRY POLICY PAPERS
growth in demand as a result of aging, the increasingly prosperous consumers concentrated in fast-growing cities12 in emerging economies provide an important new growth market for companies. Because of income increases in emerging economies, consumption of basic consumer products is expected to rise significantly in these countries. But as preferences change with income, discretionary spending on clothing, high tech products like electronics, tourism and recreation but also financial services will increase (HSBC, 2012). Within these product categories, spending on brand products and luxury goods will represent a growing share.
As a result of these changes in population and income, a new global middle class is emerging, particularly in China and India. Until now, global consumer demand has been concentrated in (rich) OECD economies. Today’s middle class in Europe and North America make up just over half of the global total in terms of number of people, but they account for almost two-thirds of total spending by the world’s middle class. The growing middle class worldwide could rise to 3.2 billion by 2020 and to 4.9 billion by 2030 and almost 85% of this growth is expected to come from Asia (Figure 3). About two-thirds of those middle-class citizens are expected to be found in Asia. And while Asia (excluding Japan) only accounted for 10% of the global middle-class spending in 2000, this could reach 40% by 2040 and almost 60% in the long term (OECD, 2016b; Kharas, 2010).
Figure 3. Middle-class consumption, 1965-2030
Source: European Environment Agency (2015) in OECD (2016b)
The growth of the middle class in emerging economies is traditionally considered to be an important factor behind the (current and future) growth of GVCs. The growing number of prosperous consumers is expected to increase GVC trade from developed economies to these countries. The question is however to what extent that growing demand will be met through imports (of final as well as intermediate products). While producers in OECD economies will benefit from these growing markets, it can be expected that local – be it domestic or intra-regional – production will rise in importance particularly when taking into account the growing capabilities of these countries (see previous factor). Emerging economies like China have witnessed a large inflow of foreign direct investment in the beginning often to exploit locational cost advantages, but affiliates of MNEs increasingly produce also for the local market. As such, the future impact of the growing middle class on the importance and length of GVCs is not straightforward; one

THE FUTURE OF GLOBAL VALUE CHAINS: BUSINESS AS USUAL OR “A NEW NORMAL”?
OECD SCIENCE, TECHNOLOGY AND INDUSTRY POLICY PAPERS 15
outcome could actually be that (the international parts of) GVCs in these countries grow less rapidly than local production. In addition, the ageing population in developed economies can also be expected to have a dampening effect on the further expansion of GVCs.
2.5 Development of services
Services have dramatically changed over time; instead of being the corollary of manufacturing, services industries are nowadays among the most dynamic sectors in OECD economies. Technological innovations combined with new business models have profoundly altered the nature of services provision and structure for certain categories of services. “Modern” - typically more knowledge- and ICT-intensive - services such as information and communication services, and finance and insurance have recorded high growth rates of labour productivity over the last 10 years. Technological progress, particularly in ICT, deregulation of previously closed service industries and multilateral efforts to liberalise service trade, have allowed services companies to enter new markets outside their home.
“Modern” services inputs play nowadays an increasingly important role both in co-ordinating value chain activities. Logistics, communication services, business services etc. permit the efficient functioning of GVCs as they allow for the transfer goods, data, technology and (managerial) know how across borders, and the coordination of dispersed activities in a quick and smooth manner. Basically, transportation and communications networks are the glue of GVCs and the provision of services to these networks directly benefit manufacturing activities. For example, implementing just-in-time organisation of production in GVCs requires effective and reliable transport and logistics services, but also technical testing, legal advice, ICT support and many other business services.
But services are not only a facilitator of international goods sourcing; in addition, they are increasingly becoming a major source of value creation for companies. Services allow for the differentiation of products and add increasing value to manufactured products (De Backer et al, 2015; Miroudot, 2016). The rapid progress of services is a driving force behind the servitisation of manufacturing industries, with bundles of services and goods offered as ‘solutions’ to customers. Further on, recent years witnessed the emergence of pure services GVCs for instance in tourism and business services. As services become increasingly digitalised, certain services categories are likely to become increasingly fragmented and located across different countries.
Increasing efficiency and wider international availability of services is expected to further promote GVCs across different industries including services and manufacturing. The growing attention for these sectors from policy makers also in emerging economies will further facilitate the growth of GVCs13; the abolition of services (trade) barriers is advocated to be an important step in the participation of countries in GVCs. While impediments to goods trade are (relatively) easily measured, impediments to services trade are more complex and harder to measure. Tariffs are generally smaller or non-existent for services trade, but the scope of potential barriers to trade in services is broader than trade in goods (OECD, 2014).
2.6 The role of Multinational Enterprises (MNEs)
International investment has been instrumental in the rise of GVCs as MNEs have offshored activities since decades in search for better location factors (vertical MNEs) and/or new markets (horizontal MNEs). The gradual investment liberalisation has allowed MNEs to increasingly organise and disperse their production processes on a truly global scale. Technological progress in ICT in particular communication technologies (see above) has allowed MNEs to transfer their Knowledge Based Capital (KBC) and proprietary knowledge - production processes, R&D, design, brand names, etc. – to their affiliates abroad and coordinate activities across borders (cfr. “transfer of ideas” in the second unbundling – Baldwin (2016)).

THE FUTURE OF GLOBAL VALUE CHAINS: BUSINESS AS USUAL OR “A NEW NORMAL”?
16 OECD SCIENCE, TECHNOLOGY AND INDUSTRY POLICY PAPERS
The intra-firm trade between MNEs and their affiliates account nowadays for a large share of international trade in goods and services. A growing part of such intra-firm trade concerns the exports and imports by foreign affiliates that manufacture (part of) products destined for other markets. In addition to setting up affiliates abroad, MNEs have also increasingly set-up contractual agreements with local producers in different countries. UNCTAD (2011) has argued that non-equity modes such as contract manufacturing, services outsourcing, contract farming, franchising, licensing and management contracts have increased in importance, particularly in developing economies.
OECD countries still account for the largest share of MNE activity in the global economy, both as a host (inward investment into OECD countries) as well as home (outward investment by OECD countries) country (Figure 4). But emerging economies like the BRIICS countries have attracted a growing number of foreign investments during the past decades (as discussed above). More recently, MNEs with headquarters in emerging economies have also started to extend their international activities and this trend is expected to become more prominent in the future. McKinsey Global Institute (2016) estimates that almost half of the world’s largest companies by 2025 will be headquartered in emerging markets. Similarly emerging economies’ share of Fortune Global 500 companies will jump to more than 45 percent by 2025, up from just 5 percent in 2000.
Figure 4. Foreign affiliates’ production, inward and outward investment, 2000-2014
(in billion US$)
HOME COUNTRY (inward investment) HOST COUNTY (outward investment)
Note: data for South Africa are not included in BRIICS
Source: OECD analytical AMNE database, see De Backer et al. (2017, forthcoming)
There is/was a general belief that MNEs will become only more important over time, and as such will further support the growth of GVCs across countries. The poor performance of a (large) number of MNEs as well as the sluggish growth in foreign direct investment (FDI) in recent years, is however interpreted by some as the retreat of the global company (The Economist, 2017). MNE activities seem indeed to have stagnated somewhat in most recent years, but it is unclear if this is enough to talk already about a structural shift in the global economy.
3. “A new normal”: factors that will reorient/impede the growth of GVCs
A number of emerging factors increasingly challenge the organisation of production in long and complex GVCs and may shape the evolution of GVCs differently in the future. Some of these “game-changers” have already been discussed in recent OECD work on reshoring (De Backer et al., 2016) as they
THE FUTURE OF GLOBAL VALUE CHAINS: BUSINESS AS USUAL OR “A NEW NORMAL”?
OECD SCIENCE, TECHNOLOGY AND INDUSTRY POLICY PAPERS 17
may motivate (a number of) companies to relocate activities back home14. Reshoring can be thought as being part of the “A new normal” for GVCs and the global economy. Companies are increasingly changing their sourcing strategies for example by localising their production, i.e. bringing production closer to the market. As a result, a rebalancing of GVCs may be at the horizon with the topography of GVCs becoming more varied and distributed in the coming 10-15 years. In addition to global hubs in GVCs, production may become increasingly concentrated in regional/local hubs closer to end markets both in developed and emerging economies.
3.1. Changing cost conditions in emerging economies
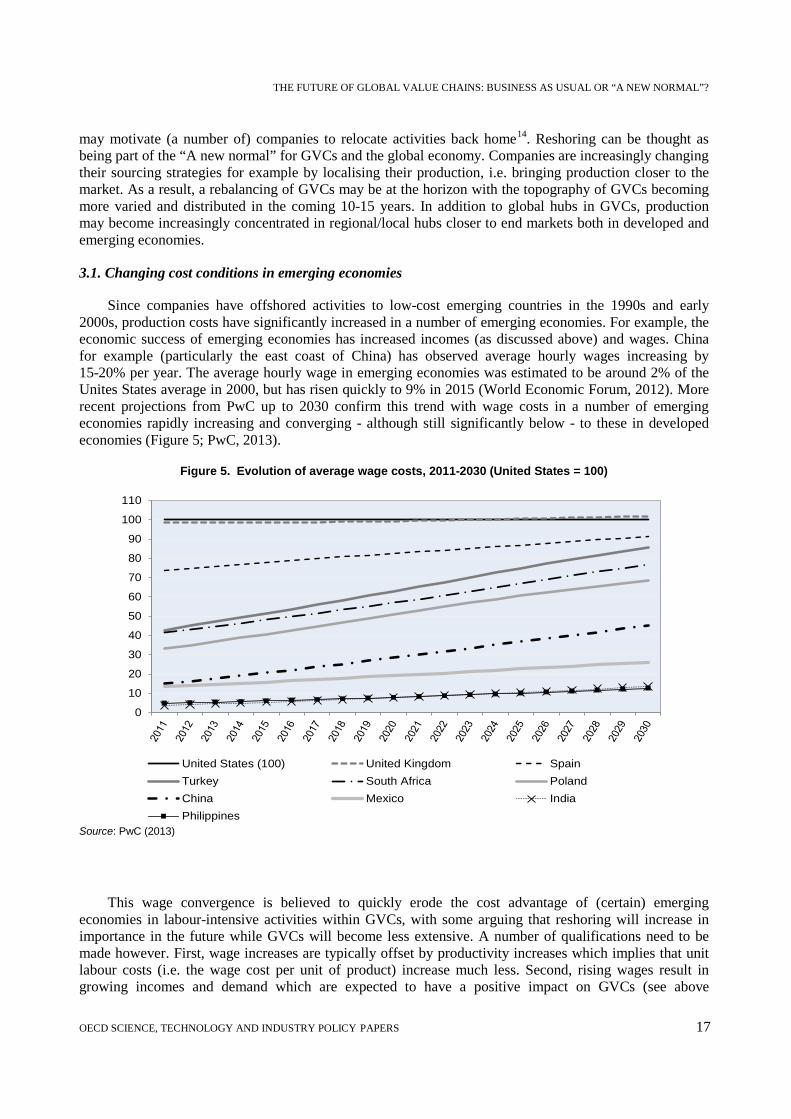
Since companies have offshored activities to low-cost emerging countries in the 1990s and early 2000s, production costs have significantly increased in a number of emerging economies. For example, the economic success of emerging economies has increased incomes (as discussed above) and wages. China for example (particularly the east coast of China) has observed average hourly wages increasing by 15-20% per year. The average hourly wage in emerging economies was estimated to be around 2% of the Unites States average in 2000, but has risen quickly to 9% in 2015 (World Economic Forum, 2012). More recent projections from PwC up to 2030 confirm this trend with wage costs in a number of emerging economies rapidly increasing and converging - although still significantly below - to these in developed economies (Figure 5; PwC, 2013).
Figure 5. Evolution of average wage costs, 2011-2030 (United States = 100)
Source: PwC (2013)
This wage convergence is believed to quickly erode the cost advantage of (certain) emerging economies in labour-intensive activities within GVCs, with some arguing that reshoring will increase in importance in the future while GVCs will become less extensive. A number of qualifications need to be made however. First, wage increases are typically offset by productivity increases which implies that unit labour costs (i.e. the wage cost per unit of product) increase much less. Second, rising wages result in growing incomes and demand which are expected to have a positive impact on GVCs (see above
0
10
20
30
40
50
60
70
80
90
100
110
United States (100) United Kingdom SpainTurkey South Africa PolandChina Mexico IndiaPhilippines

THE FUTURE OF GLOBAL VALUE CHAINS: BUSINESS AS USUAL OR “A NEW NORMAL”?
18 OECD SCIENCE, TECHNOLOGY AND INDUSTRY POLICY PAPERS
discussion on the ‘emerging middle class’). Third, if countries experience a loss of (certain) economic activities because of rising domestic costs, these activities are not necessarily relocated back home to developed economies. When they are - and this will often go together with increasing automation of these activities, hence resulting in relatively lower job impacts (see below), the length and complexity of GVCs will indeed most likely decrease. But such (labour-intensive) activities often end up in other emerging economies with low cost conditions, which would actually then increase the length and complexity of GVCs.
Indeed, companies in search of low labour costs may seek to invest in other low-cost countries and regions (for example in central or Western China). The metaphor of the flying geese has often been used to describe the process of industrial upgrading and development in Asia. One economy (e.g. Japan), like the first goose in a V-shaped formation, leads other economies (e.g. Korea) toward industrialisation, passing older technologies down to followers as it moves into newer ones. This process still seems to be happening, with countries such as Bangladesh, Cambodia and Viet Nam picking up textile and garment business from China, as the wage costs in these countries are a fraction of wages in China. This trend is reinforced as governments in these countries are eager to start/increase their engagement in GVCs and provide incentives (see above discussion on ‘new emerging players’).
3.2. The hidden/extra-costs of international fragmentation
While ICT progress has greatly reduced the barriers of internationally fragmented production, GVCs themselves have confronted companies with new disadvantages. Companies increasingly appreciate that the pecuniary cost of monitoring, communication, and coordination between distant affiliates and headquarters may be greater than initially envisaged. Management, logistical and operational problems have often resulted in significant ‘hidden’ costs (i.e. costs which were not taken into account in the decision to offshore) and have in some cases made offshoring less/not profitable (Porter and Rivkin, 2012; Boston Consulting Group, 2014). In addition, given the length and complexity of GVCs, some working capital has been tied up in stocks and inventories trapped in slow transport flows.
In addition to disappointing cost savings, several companies have encountered serious problems with the quality of offshored products. The below standard quality has often necessitated new production runs and recalls of deficient products, thereby further pushing up the total cost of offshoring.
Companies have also experienced adverse effects on innovative activities, particularly where co-location between manufacturing and innovative activities is important (e.g. in engineering industries). In these industries slower rates of innovation have been reported as production in sectors which were prone to offshoring became separated from R&D and innovative activities (which stayed largely in home countries). Given the sometimes important feedback effects between both activities in the value chain, innovation and product changes are generally easier to manage in a shortened supply chain.
One answer could be – and some companies have actually taken this route - to offshore innovation activities as well. However, protection of intellectual property in emerging economies is often not at the same level as at home, hence directly exposing the proprietary knowledge of companies and the business models based on this KBC15 (OECD, 2013b; OECD 2016c). The risk is then that local suppliers can easily become competitors if they gain insights into the production process, as some cases – though largely anecdotal16 - have shown. Less developed legal systems of intellectual property rights, and particularly weaker enforcement, have made companies reconsider their offshoring strategies within GVCs including moving activities closer to home.

THE FUTURE OF GLOBAL VALUE CHAINS: BUSINESS AS USUAL OR “A NEW NORMAL”?
OECD SCIENCE, TECHNOLOGY AND INDUSTRY POLICY PAPERS 19
3.3 In search of resilience: balancing risk diversification and cost efficiency
GVCs have often become so complex and extensive that a breakdown in one part of the chain - very locally - may quickly have detrimental global effects throughout the chain. It has been become clear that companies do not always have a complete overview of the length and depth of their GVCs. In organising their GVCs, companies have traditionally focused primarily on reducing costs by applying principles such as single sourcing, just-in-time production and small inventories. A system with little slack, increases efficiency when the system works smoothly but rapidly propagate shocks when they arise. A breakdown of one production stage will then rapidly propagate through the whole chain and may result in a complete disruption of the supply chain.
The more that firms have spread their operations around the globe, the more vulnerable they have become to disruption from unexpected events. The outcomes of a number of natural disasters in the recent past (e.g. earthquake in Japan, flooding Thailand, volcano eruption in Iceland) have shown the potential costs for companies and countries when GVCs break down (see OECD, 2013a for a detailed discussion on this). Companies increasingly try to protect their GVC activities from multiple sources of risk with sources of GVC disruption being many including terrorism, geopolitical uncertainty and stability, political risks, cyber-security issues, pandemics, etc. .
In trying to increase the resilience of GVCs, companies increasingly try to balance cost efficiency and risk diversification and management. In a global world characterised by uncertainty, companies increasingly try to complement “just-in-time” with “just-in-case” strategies by adjusting supply chains to enable them to withstand a variety of shocks. For example, to diversify the risks inherent in their supply chains, companies increasingly consider alternative GVCs for the same product, thereby adding some redundancy in their supply chains. To further increase the resilience of their supply chains, companies also opt for shorter GVCs and bring production closer to the market (including reshoring).
3.4. Digitalisation and ICT: new information technologies
New digital technologies are radically changing the outlook of manufacturing and services industries by altering the way how companies organise their production processes and which business models they adopt. The wider availability of these technologies – as their costs are plummeting – and especially the conjunction of different technologies/applications are expected to result in a digital revolution. Three technologies can conceptually be considered as underpinning the digitalisation of production (OECD, 2017a): the Internet of Things (IoT) – which enables the interconnection of machines, inventories, and goods; big data and embedded software which allow for the analysis of the huge volumes of digital data generated by these objects; and cloud computing providing the ubiquitous availability of computing power (Figure 6).17

THE FUTURE OF GLOBAL VALUE CHAINS: BUSINESS AS USUAL OR “A NEW NORMAL”?
20 OECD SCIENCE, TECHNOLOGY AND INDUSTRY POLICY PAPERS
Figure 6. The confluence of key technologies enabling the industrial digital transformation
Source: OECD (2017a)
While communication technologies will further promote the growth of GVCs (see above), information technologies could have opposite effects and may shorten GVCs (Baldwin, 2016). Robotics, automation, computerised manufacturing, artificial intelligence, etc. all could reduce the advantages of production in low-labour-cost emerging economies, hence curtailing the progress of international fragmentation of production. The robots that are already widely used across manufacturing industries are rather suited for repetitive activities and very precisely defined environments. While robots might have sensors on board, most of their movements are pre-planned and programmed. In addition, setting up a robotic plant typically takes months if not years. The production of consumer electronics for example is still often done by hand, as the life cycle of consumer electronics and the time to market is that short that a robotic factory would not be ready to make the current product by the time the successor should be on the market (OECD, 2017a).
Because of the increased use of artificial intelligence with learning based on the data they receive and collect via sensors/accentuators, machines are becoming however more flexible. Autonomous robots can increasingly perform a wider range of more complex manual work and auto-correct themselves to changing conditions. The growing digitalisation is expected to increasingly allow for lower-cost and high-quality production in developed economies, hence discouraging offshoring from and favouring reshoring to these countries. The growing use of information technologies will make (labour) costs relatively less important for competitive advantage in a number of manufacturing industries. Due to increased automation of production processes and growing use of robots, labour costs will represent a smaller share in total costs. Shorter GVCs will also result in direct savings in transport and trade costs, while companies also can reduce the risk of low quality products.

THE FUTURE OF GLOBAL VALUE CHAINS: BUSINESS AS USUAL OR “A NEW NORMAL”?
OECD SCIENCE, TECHNOLOGY AND INDUSTRY POLICY PAPERS 21
Some modern factories, such as the Philips shaver factory in Drachten in the Netherlands, are almost fully robotic (Markoff, 2012). This particular factory employs only one-tenth of the workforce employed in Philips’ factory in China that makes the same shavers. More recently in 2016, Adidas opened a fully automated shoe factory using 3-D technology and robotics in Germany, in order to individualise their products and react more promptly to consumer needs by bringing manufacturing closer to its clients and speeding up delivery (see below). The number of jobs in this new production facility is a fraction of the number of people that were working in emerging economies in the production of the same sportswear.
As new digital technologies are expected to increasingly allow for the profitable location of production activities in developed economies, these countries see digital production as a new source of competitiveness in restoring their position in manufacturing industries (e.g. Industrie 4.0 in Germany). But also emerging economies like China, also Indonesia and Thailand are investing heavily in these digital technologies (BCG, 2015). Foxconn, the Chinese Taipei based multinational electronics contract manufacturing company - most known for assembling Apple products, is looking into deploying over 1 million robots in its business in the coming years (OECD, 2015b). The Chinese government has promoted the growing use of robotics by companies in order to compensate for rising wage costs. The big challenge seems to be particularly for low-income countries wanting to increase their participation in GVCs as they will have to find activities that cannot be done more cheaply by machines.
3.5 From mass production to mass customisation
Some argue that a shift from mass production to mass customisation is coming with economies to increasingly shift from mass markets to millions of niche markets (see for example C. Anderson “The Long Tail”). Instead of periodical launches of a limited number of products, a continuous sale of endless varieties will be increasingly sought after by consumers. Particularly for customised and fashion products, companies need to respond quickly to changing demand and sometimes be able to deliver new products immediately.
The organisation of production in long and complex GVCs however has significantly limited the flexibility and agility of companies to respond to changes in (consumer) demand. In addition, manufacturers produce today mainly standardised and commoditised products as scale economies do not easily allow for different product specifications. Companies increasingly become aware that this disconnect between supply and demand comes at a major cost; the most successful companies in consumer products are those that are able to quickly respond to market signals.
Short lead times and fast times to market are crucial in to swiftly respond to changes in customer preferences. Companies experiment with new business models incorporating technological and organisational changes to this. Several companies have increasingly used services to tailor products for different consumers. Digital technologies like additive manufacturing and 3D printing (Box 1), autonomous robots, big data, etc. will increasingly allow for customised products manufactured at the cost of a standardised product (some even go as far as ‘manufacturing on-demand’). Also other technologies like new materials, nano- and biotechnology will increase the possibilities for more personalised products.
By lowering the cost of producing smaller batches of a wider variety, production closer to the consumer will become (more) economically feasible. The reconfiguration of supply chains with more localised production centres and to some extent duplication between different production facilities centres will increase the responsiveness when demand is volatile. By bringing production centres closer to the end markets, companies want to regain flexibility in the competitive struggle.

THE FUTURE OF GLOBAL VALUE CHAINS: BUSINESS AS USUAL OR “A NEW NORMAL”?
22 OECD SCIENCE, TECHNOLOGY AND INDUSTRY POLICY PAPERS
Box 1. 3D-printing and GVCs
Additive manufacturing and 3D-printing could play a leading role in mass-customisation in the future. There is however a lot of discussion – and confusion – about the (future) impact of 3D-printing on production processes, with ‘believers’ pointing to the revolutionary character of this technology and ‘sceptics’ referring to its still rather limited commercial applications. 3D-printing may potentially transform the architecture of GVCs and the outlook of whole production processes (TNO, 2014), but it is very hard to predict the timeframe in which 3D-printing could become a game-changer, if ever.
Worldwide shipments of 3D-printers in 2015 were estimated to be close to 250,000 units (Gartner, 2015). Estimates of the future market for 3D-printing vary with Gartner (2015) expecting a doubling between 2016 and 2019 to reach a value of US$ 5.6 billion. JP Morgan forecasts a growth to 7 billion US$ by 2020, far below Morgan Stanley’s estimate of 22 billion US$ (Forbes, 2015). In terms of impact on other industries globally, McKinsey (2014) estimates this to exceed USD 550 billion by 2025 (Rehnberg and Ponte, 2016).
The largest factor driving and limiting its expansion is the cost of switching from mass-manufacturing methods to 3D printing. It is rapidly penetrating high-cost, low-volume industries such as aerospace, medical and dental, defence, education and increasingly also the automotive industry. But it is expected that 3D-printing will more slowly penetrate moderate-cost, moderate-volume industries, and low-cost, high-volume industries will not switch to 3D printing for decades (OECD, 2017a). Laplume et al. (2016) argue that the most likely industries to adopt 3D printing are those producing small but customised products, made of one single material and with no need of many interacting parts, characterised by low economies of scale and low degrees of automation.
In addition to industry differences, the use of 3D-printing varies significantly along the value chain, with most 3D- printing concentrated in upstream activities like prototyping, product development and R&D. Estimates indicate that only 15% of the 3D-printing outputs concern goods (final but especially intermediate parts) with the majority being models, tools and prototypes.
In describing the potential impact of 3D-printing on GVCs, Rehnberg and Ponte (2016) distinguish between two future scenarios. One scenario foresees in 3D-printing acting as the complement to traditional manufacturing with 3D-printing especially used for prototyping, production of specialised machine tooling, etc. This scenario seems to describe the current situation in certain industries. Companies adopt 3D-printing in order to compress their design and development cycles of new products; the products themselves are then produced via the ‘traditional’ production methods. This scenario could result in a further deepening of the so-called smile curve, with a competitive advantage for companies who have timely access to customer intelligence (big data) and are able to respond quickly to changing customer needs.
At the other side, a more optimistic and longer-run scenario foresees 3DP printing substituting traditional manufacturing with products fully or largely 3D-printed. It is clear that in this scenario the impact on the future of GVCs and global production can be expected to be much bigger. First, 3D-printing will make the manufacturing of products increasingly possible at the point of sales by “printing” the object, rather than having to rely on outsourced production and assembly. Second, GVCs will become compressed as intermediary input/components are removed apart from the “ink” (Kommerskollegium, 2016). Third, 3D-printing will also lower the need for inventory, warehousing, distribution, retail centres, and packaging. Fourth, as intermediary goods will be replaced by CAD-files, 3D printing will alter the characteristics of trade within GVCs (Kommerskollegium, 2016; HSBC, 2015). Rather the cross-border transfer of material goods and services, trade will increasingly consist of the international transfer of immaterial data (designs, blueprints, software etc.).
3.6 The green and sustainability imperative
The continuous expansion of GVCs and their related transport flows of intermediate and final products has resulted in major environmental impacts like emissions, waste generation, etc. For example, estimates from the International Transport Forum (ITF, 2016a) show that international trade-related freight transport - as a rough indication of the (international) transport flows within GVCs - currently accounts for

THE FUTURE OF GLOBAL VALUE CHAINS: BUSINESS AS USUAL OR “A NEW NORMAL”?
OECD SCIENCE, TECHNOLOGY AND INDUSTRY POLICY PAPERS 23
around 30% of all transport related CO2-emissions from fuel combustion, and more than 7% of global emissions. The carbon footprint of global trade has been growing (and is expected to increase further over time) due to longer and more complex GVCs with material flows going from one side of the world to the other. New manufacturing requirements and consumer preferences have led to extra transport flows, for example through smaller but more frequent shipments and an increased demand for rapid, energy-intensive transport such as air freight.
Environmental sustainability is expected to increasingly become an issue for companies in organising their production and GVCs in the future. With demand for some natural resources outstripping available and future supplies, shortages of natural resources are predicted to emerge in many regions across the world. In order to address climate change, growing pressure (on companies) can be expected to reduce resource use, energy consumption and waste generation. Government regulations through emission limits and/or carbon taxes could have a big impact, among others on transport and logistics costs (Box 2)18.
In addition, consumer expectations and consumer demand for sustainable products is slowly growing; the growing popularity of “home-grown” food is probably the most obvious example of this19. The drive for environmental sustainability will increasingly be reflected in companies’ strategies of corporate social responsibility. Therefore, and irrespective of the regulatory environment, some companies are increasingly attempting to ‘green’ their value chains by rationalising the natural resource inputs into the value chain and controlling the outputs affecting the natural environment (Sinclair-Desgagné, 2013). This includes improving efficiency and renewable capacity in terms of water, energy, material, building, land and tools at the input side. At the output side, the focus is on reducing wastage and pollution through cleaner production, pollution control, closed loop production and industrial ecology. Green technologies benefitting from advances in nano, bio- and ICT technologies are an important part of the solution.
But also more broadly and of more direct relevance for GVCs, companies have started to rethink how they source within GVCs in the future. Sourcing less products in general while at the same time more inputs from closer to home may become more important, as this will result in smaller transport flows and costs. In addition, strategies for a circular economy will increasingly be applied to increase the re-use, remanufacturing and recycling of products. Companies increasingly apply cradle to cradle in the design of their products, where the reuse or recycling of each component and part is planned for at the design phase of the product. It is clear that all these strategies will impact the length and complexity of GVCs.
Box 2. What with transport costs?
Declining transport costs combined with regulatory reforms in key transport and infrastructure sectors have enabled firms to fragment their production process across multiple borders in the past. Empirical evidence shows transport cost have fallen especially for air shipping due to advances in technology (e.g. jet engine), but the evidence seems to be less clear for ocean shipping20 (Hummels, 2007). Decreases in transport costs may be even larger than statistics show, since trade costs are generally expressed as weight-based measures. As such, trade costs do not always reflect the gains in time and quality of different transport modes over time. In addition, the composition of traded goods has significantly changed over the past decades (OECD, 2008): many valuable goods are now relatively light and transport costs may well have fallen relative to the value of transported goods (i.e. ad-valorem measures of trade costs might show a declining trend).
Because of many uncertainties, it is very unclear how transport costs will evolve in the future and correspondingly different views emerge. Some argue that ever-more expensive fuel prices, in particular the price of crude oil, will force companies to significantly change their sourcing strategies. Instead of sourcing inputs and outsourcing activities where it is cheapest to do so, companies will prefer to locate production activities closer to end markets to reduce transport costs. Oil and gas prices have however strongly decreased since 2014 – among other things due to the growing exploration of shale oil and gas, but show a rising trend more recently.
Estimates suggest that transport costs represent (only) one-third of total trade costs (Anderson and van Wincoop, 2004) with crude oil prices in turn accounting for less than a fifth of transport costs (Chevroulet, 2008). As such, the

THE FUTURE OF GLOBAL VALUE CHAINS: BUSINESS AS USUAL OR “A NEW NORMAL”?
24 OECD SCIENCE, TECHNOLOGY AND INDUSTRY POLICY PAPERS
impact of rising oil prices on transport costs would overall be rather limited. Further on, it is expected that the current overcapacity in maritime transport – maritime roughly accounts for 80% of international freight transport in volume terms21 - will keep freight shipping cost low in the coming years. OECD research has documented that the global ship market has accumulated massive excess vessel supply during recent years. It is estimated that the extent of oversupply currently corresponds to around 307 million gt representing almost one quarter of the world fleet in 2015. Future vessel requirements are only expected to equal the peak of completions of the boom year 2011 in 2035.
Infrastructure is growing also for other international transport modes. Air freight for example will benefit from the building of new airports and the emergence of new carriers particularly in emerging economies which are expected to increase the supply of transport services at competitive prices. In addition, improvements in energy efficiency are assumed to make international transport much more efficient and curb potential increases in transport costs. Altogether then, it could be hypothesized that the upward trend in transport costs during the next 10-15 years, if any, would be rather limited.
Global merchant fleet and seaborne trade, 1995 - 2015. Million gross tonnes
Source: OECD STI Shipbuilding Unit
4. Empirical analysis using the OECD’s METRO model
4.1 The rationale of the empirical analysis
The OECD’s METRO model which is a global Computable General Equilibrium (CGE) model for trade in goods and services, is used to empirically evaluate the potential impacts of different factors discussed in the previous sections on GVCs. Trade flows and production patterns as predicted by the METRO model under different scenarios are analysed and changes in the architecture and geography of GVCs are identified. In comparison with other CGE models, METRO has the advantage of explicitly incorporating the GVC reality by distinguishing trade by end-use, i.e. between intermediate, final and capital goods and services.
The empirical analysis assesses the impact each factor (Business as usual as well as “A new normal”) may have on the future of GVCs in the coming 10 to 15 years. For this, a number of long term scenarios (up to 2030) has been developed in order to describe the evolution of selected factors. It has not been possible to develop scenarios for each of the individual factors discussed above, because of the non-availability of (credible) forecasts. The following scenarios are then (individually) imputed in the METRO model:
1. Trade policy
2. New (low-cost) producers in manufacturing
0
200
400
600
800
1000
1200
1400
1995 2000 2005 2010 2015
Gap Fleet Seaborne trade

THE FUTURE OF GLOBAL VALUE CHAINS: BUSINESS AS USUAL OR “A NEW NORMAL”?
OECD SCIENCE, TECHNOLOGY AND INDUSTRY POLICY PAPERS 25
3. Growing demand in emerging economies
4. Rising wage costs
5. Digitalisation (IT) of production
6. Rising transport costs
Each scenario ‘shocks’ a certain factor while keeping the other factors constant (ceteris paribus assumption) while in reality a multitude of factors will change simultaneously. As we expect all these factors to impact the outlook and structure of GVCs simultaneously in the future, a last scenario combines the evolution up to 2030 in the different factors listed above. This however does not mean that this combined scenario will forecast the likely outcome of GVCs in 2030, hence the need to stress that this scenario does not aim to predict the future. The reason is that static CGE models like METRO typically assess the impact of specific factors while not modelling for the evolution in other factors affecting the global economy. In contrast, dynamic CGE models formulate a baseline based on (assumptions for) factors including GDP, capital accumulation, savings rate, etc. and provide a framework which should in principle come closer to accurately predicting the future (see for example the OECD@100 work, 2014). However, this means also that the calculated impacts are directly dependent on the different assumptions used for modelling the evolution of a large number of factors.
While the different factors listed above have been amply discussed in qualitative terms, not many sources have documented this with empirical data and analysis since projections on future developments are not that widely available. In developing the scenarios in this paper, the available information has been scanned and projections are sourced from from a broad range of sources and official statistics/estimates. Where necessary these have been combined with other data (e.g. data from researchers, consultants, foresight exercises, etc.). For example, in discussing the importance of the global middle class (scenario 3 – see below), data on population growth (coming from United Nations) combined with consumption spending data (coming from The Brooking Institute) for the period up to 2030 are used to forecast the growth in consumer spending across developed and emerging economies. These data are then used to impute a shock in the METRO model; the equilibrium conditions of the model allow then for an estimation of the impacts of this growth in consumer spending on production and trade in 2030.
It is clear that the validity of the end-results directly depends on the assumptions applied in the formulation of the different scenarios. The scenarios have been developed carefully in order for them to mimic as much as possible the (most) likely future evolution of each individual factor based on the currently available data. Only then is a proper evaluation of the expected impacts on the future of GVCs possible. While some useful projections are available for a number of factors (e.g. population and labour force growth, transport costs), the future of other factors is much more uncertain. For example, the effects of digitalisation for the next 10 to 15 years are very hard to measure – some effects have most likely not be thought about yet - hence more speculative data have to be used. The sources and methods of each scenario are described in more detail when discussing the results.
4.2. The OECD’s METRO model and its (dis)advantages for this analysis
METRO is a static computable general equilibrium model (CGE)22, deriving from the model GLOBE developed by McDonald and Thierfelder (2013). As the model's name implies, CGE models rely on a comprehensive specification of economic activity within and between countries (and therefore the different inter-linkages that tie these together). The novelty and strength of METRO, relative to other CGE models, lies in the detailed trade structure and the differentiation of commodities by use – commodities and thus trade flows are distinguished by use category (u), whether these are designed for intermediate use, use by

THE FUTURE OF GLOBAL VALUE CHAINS: BUSINESS AS USUAL OR “A NEW NORMAL”?
26 OECD SCIENCE, TECHNOLOGY AND INDUSTRY POLICY PAPERS
households, government consumption as well as investment commodities. This information, in particular imports of these different use categories, is based on the OECD Inter-Country Input-Output Table (ICIO) which is the underlying datasource for TiVA. While the ICIO table provides a high level of detail, it does not allow to model changes or shocks like METRO does (see Box 3) .
The underlying approach for the multi-region model is the construction of a series of single country CGE models that are linked through trade relationships. Agents (depicted by the 4 use categories) consume imports and domestic supply, assuming imperfect substitutability. On the export side, METRO employs also the assumption of imperfect transformability of supply to the domestic or export market. Production activities maximise profits and form output from primary inputs (i.e. land, natural resources, labour and capital), combined using Constant Elasticity of Substitution (CES) technology, and intermediate inputs in fixed shares. Households are assumed to maximise utility, while receiving income from labour supply. The model depicts various policy variables such as taxes, tariffs and subsidies. The government receives income from these taxes, pays for subsidies and also engages in consumption. Total savings consist of savings from households, the internal balance on the government account and the external balance on the trade account. The external balance is defined as the difference between total exports and total imports in domestic currency units.
The model allows for a variety of macroeconomic setups, by defining how the markets and accounts mentioned above are cleared, e.g. the labour market, the capital market and the government account. In this study the following setup is chosen: all tax rates and the government balance are fixed, the government adjust its expenditures to balance the government account23; the exchange rates are flexible and the current account balances fixed at its base levels; investment is defined by savings (which is in fixed shares of household income); all production factors are mobile and fully employed and the CPI serves as regional numéraire24.
The METRO database derives from the GTAP V9 database (see Aguiar et al., 2016) and disaggregates imports based on use categories derived from OECD sources, as opposed to the widely applied proportionality assumption. The standard database consists of all 57 GTAP sectors and 60 regions plus rest of the world, where the regional coverage is restricted by the data availability for the use categories. For the purpose of this study the database is aggregated to reflect 23 countries and geographic regions as well as 24 sectors (Table Annex).
Box 3. The OECD METRO model
The OECD METRO model is a static computable general equilibrium model (CGE) (OECD, 2015). The Model is derived from the Social Accounting Matrix (SAM) based CGE model GLOBE developed by Scott McDonald and Karen Thierfelder (2013)25. The novelty and strength of METRO lies in the detailed trade structure and the differentiation of commodities by use – commodities and thus trade flows are distinguished by use category (u), whether these are designed for intermediate use, use by households, government consumption as well as investment commodities.
Agents (depicted by the 4 use categories) consume composite commodities, which are formed as three level nested CES aggregate of imports and domestic goods following the Armington assumption of imperfect substitutability (Armington, 1969). At the third level imports from various sources form a CES aggregate while allowing for imports in small shares, which are aggregated at the second level to the other imports in fixed shares, forming aggregate imports. This small shares feature avoids large terms of trade effects for very small trade flows. On the first level domestic goods and aggregate imports are forming a composite commodity using CES technology. On the export side, METRO employs also the assumption of imperfect transformability using a 2 level CET structure: products are allocated to the domestic or export market depending on relative price changes employing CET technology, and are subsequently allocated to the different export destinations.
The underlying approach for the multi-region model is the construction of a series of single country CGE models that are linked through trade relationships. As is common in CGE models, the price system in the model is linear homogeneous, which directs the focus on relative, not absolute, price changes. Each region has its own numéraire, typically the Consumer Price Index (CPI), and a nominal exchange rate (an exchange rate index of reference regions

THE FUTURE OF GLOBAL VALUE CHAINS: BUSINESS AS USUAL OR “A NEW NORMAL”?
OECD SCIENCE, TECHNOLOGY AND INDUSTRY POLICY PAPERS 27
serves as model numéraire). Thus, price effects inside a country are fed through the model as a change relative to the country’s numéraire, and prices between regions change relative to the reference region. Finally, the Model contains a ‘dummy’ region to allow for inter-regional transactions where full bilateral information is not available, i.e., data on trade and transportation margins.
The model distinguishes activities which produce commodities. Activities maximise profits and form output from primary inputs (i.e. land, natural resources, labour and capital), combined using Constant Elasticity of Substitution (CES) technology, and intermediate inputs in fixed shares (Leontief technology). Households are assumed to maximise utility subject to a Stone-Geary utility function, which allows for the inclusion of a subsistence level of consumption. All commodity and activity taxes are expressed as ad valorem tax rates and taxes are the only income source to the government. Government consumption is in fixed proportions to its income and government savings are defined as a residual. Closure rules for the government account allow for various fiscal specifications. Total savings consist of savings from households, the internal balance on the government account and the external balance on the trade account. The external balance is defined as the difference between total exports and total imports in domestic currency units. While income to the capital account is defined by several savings sources, expenditures by the capital account are based solely on commodity demand for investment.
Their nature makes CGE models especially useful to answer the ‘what if’ kind of questions as employed in this study. CGE models are typically used to evaluate policy shocks whose impacts are expected to be complex, transmitted by different channels, have economy-wide effects and materialise not only in one but various rounds (e.g. trade and fiscal policy reform). Through their general equilibrium setup, including the whole economy, they can detect spill-over effects and allow for the analysis of effects on various economic variables such as trade, production, or final demand. In addition, the specific scenario setup makes it possible to identify effects for distinct factors (ceteris paribus). This study does not focus that much on policy shocks, but imputes shocks which mimic the evolution of a number of other factors in the CGE model (e.g. labour force, industry productivity, etc.).
Another difference with other more ‘traditional’ CGE analyses is that this paper considers a rather long time horizon of 10 to 15 years (i.e. the shock imputed in METRO is modelled according to the (most) likely evolution of the different factors). The comparative statics addressing ‘what if’ questions through CGE analysis are based on a certain economic (input-output) structure, which is not assumed to change over time. An important difficulty in doing this forward-looking exercise in this paper is then the assumption regarding the changes the technology will/may undergo up to 2030. The METRO-model is based on the technological coefficients of the GTAP v9 database with the base year 2011, and while the coefficients may be valid for a number of years given the structural character of production technology, the assumption of fixed technology becomes more of an issue the longer the considered time period.
In order to deal with this issue, the analysis incorporates a number of features of technological change (without however reaching the first-best solution which would require perfect information of future production technology across industries and countries):
• the set-up of METRO-model inherently allows for changes in the sourcing patterns of companies based on the price evolution of the inputs. As such, a shift is possible from domestic to foreign sourcing (and vice versa) and also between the foreign suppliers;
• the METRO model allows for shocks in productivity at different levels (total, sector specific and/or for specific production factors) in order to capture higher efficiency (due to new machines, learning by doing, etc.) of production technologies. In addition there is substitution possible between material inputs and value added;
• in order to (partially) allow for changing technical coefficients (for example, the shift from metal to plastic inputs in the automotive industry), whole production technologies are changed in specific scenarios; for example, in scenario 2 on the growing manufacturing importance of a

THE FUTURE OF GLOBAL VALUE CHAINS: BUSINESS AS USUAL OR “A NEW NORMAL”?
28 OECD SCIENCE, TECHNOLOGY AND INDUSTRY POLICY PAPERS
number of emerging economies, the production technology of Korea (given Korea’s success in manufacturing) is supplanted on emerging economies.
4.3 The interpretation of the results
The METRO model simulates the respective scenarios and provides outcomes along different dimensions; for this analysis, the most relevant variables focus on production, value added and trade for different types of products, industries and countries. In order to describe the evolution in GVCs under the different scenarios, the results are expressed relative to the base year (which is 2011). The idea is to illustrate general trends in GVC evolution hence only results for at the global and (large) regional level are presented.26
To facilitate the interpretation of the multitude of results, a number of indicators are calculated in direct relation to the structure and geography of GVCs at the international/global level27. These indicators are of a different nature than the OECD TiVA indicators (e.g. domestic/foreign value added of exports), as the METRO model does not incorporate full ICIO tables. This of course limits somewhat the interpretation of the results since new work has shown that more complex indicators are able to describe GVCs in more detail. Future work could progress the analysis along these lines by developing ICIO table and constructing additional indicators based on the simulation outcomes for each scenario (see Greenvile et al. (forthcoming) for similar work on agriculture GVCs).
The following results are reported for each of the different scenarios; while providing maybe rather ‘indirect’ evidence on GVCs each individually, all together these results provide insights in the future evolution of GVCs:
1. Indicators on the importance of GVCs and GVC trade:
• Imports of intermediates as a share of production: this indicator estimates to what extent intermediates are sourced internationally;
• Exports as a share of production: indicates what percentage of production is exported; localisation of production and reshoring in particular would imply that this indicator decreases;
2. Indicator on the length of GVCs
• Average distance of traded goods: shows the kilometres a good/service (final or intermediate) travels on average; shorter GVCs and localised productions will ceteris paribus result in a downward trend in this indicator;
3. Indicators on the geography of GVCs
• Intra-regional versus inter-regional trade28: expresses the respective shares of trade within and between broader geographical regions; localised production would imply a relative increase of intra-regional trade;
• North-South trade29: calculates the shares of North-North, South-South and North-South; the growing importance of emerging economies and the shifting of the centre of gravity would be reflected in growing shares of South-South trade;
• Geographical concentration of production and value added: regional shares of production and value added.
4. Indicator on the importance of international trade
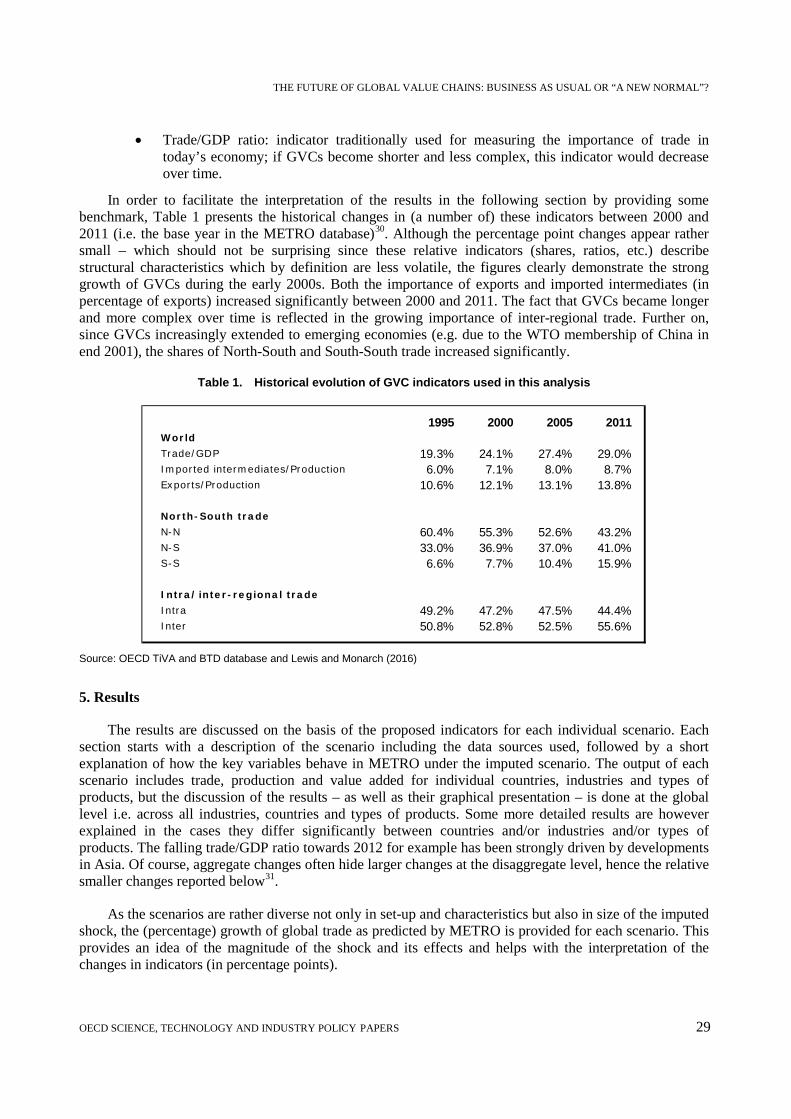
THE FUTURE OF GLOBAL VALUE CHAINS: BUSINESS AS USUAL OR “A NEW NORMAL”?
OECD SCIENCE, TECHNOLOGY AND INDUSTRY POLICY PAPERS 29
• Trade/GDP ratio: indicator traditionally used for measuring the importance of trade in today’s economy; if GVCs become shorter and less complex, this indicator would decrease over time.
In order to facilitate the interpretation of the results in the following section by providing some benchmark, Table 1 presents the historical changes in (a number of) these indicators between 2000 and 2011 (i.e. the base year in the METRO database)30. Although the percentage point changes appear rather small – which should not be surprising since these relative indicators (shares, ratios, etc.) describe structural characteristics which by definition are less volatile, the figures clearly demonstrate the strong growth of GVCs during the early 2000s. Both the importance of exports and imported intermediates (in percentage of exports) increased significantly between 2000 and 2011. The fact that GVCs became longer and more complex over time is reflected in the growing importance of inter-regional trade. Further on, since GVCs increasingly extended to emerging economies (e.g. due to the WTO membership of China in end 2001), the shares of North-South and South-South trade increased significantly.
Table 1. Historical evolution of GVC indicators used in this analysis
Source: OECD TiVA and BTD database and Lewis and Monarch (2016)
5. Results
The results are discussed on the basis of the proposed indicators for each individual scenario. Each section starts with a description of the scenario including the data sources used, followed by a short explanation of how the key variables behave in METRO under the imputed scenario. The output of each scenario includes trade, production and value added for individual countries, industries and types of products, but the discussion of the results – as well as their graphical presentation – is done at the global level i.e. across all industries, countries and types of products. Some more detailed results are however explained in the cases they differ significantly between countries and/or industries and/or types of products. The falling trade/GDP ratio towards 2012 for example has been strongly driven by developments in Asia. Of course, aggregate changes often hide larger changes at the disaggregate level, hence the relative smaller changes reported below31.
As the scenarios are rather diverse not only in set-up and characteristics but also in size of the imputed shock, the (percentage) growth of global trade as predicted by METRO is provided for each scenario. This provides an idea of the magnitude of the shock and its effects and helps with the interpretation of the changes in indicators (in percentage points).
1995 2000 2005 2011WorldTrade/GDP 19.3% 24.1% 27.4% 29.0%Imported intermediates/Production 6.0% 7.1% 8.0% 8.7%Exports/Production 10.6% 12.1% 13.1% 13.8%
North-South tradeN-N 60.4% 55.3% 52.6% 43.2%N-S 33.0% 36.9% 37.0% 41.0%S-S 6.6% 7.7% 10.4% 15.9%
Intra/inter-regional tradeIntra 49.2% 47.2% 47.5% 44.4%Inter 50.8% 52.8% 52.5% 55.6%

THE FUTURE OF GLOBAL VALUE CHAINS: BUSINESS AS USUAL OR “A NEW NORMAL”?
30 OECD SCIENCE, TECHNOLOGY AND INDUSTRY POLICY PAPERS
5.1. Scenario 1: trade policy
Reflecting the current (policy) views on further trade/investment liberalisation across countries, this first scenario includes two contrasting sub-scenarios: ongoing trade liberalisation efforts on the one hand, and rising protectionism on the other hand. The first sub-scenario 1a simulates ongoing trade liberalisation efforts by abolishing all tariffs, i.e. tariffs are globally set to zero; non-tariff barriers continue to exist. In addition, increasing effort in trade facilitation is modelled using ad-valorem equivalents (AVEs) estimated for the OECD Trade Facilitation Indicators (TFI, Moisé and Sorescu, 2013)32,33. Decreasing protection in METRO is expected to increase international trade especially in regions which were previously relatively strongly protected, i.e. especially non-OECD countries. As prices for imports of goods and services decrease, input costs and domestic prices fall resulting in higher competitiveness, growing final demand and GDP increase. The lower costs of trading goods and services across borders will favour the international fragmentation of production.
Sub-scenario 1b simulates growing protectionism by extrapolating the protectionist trends that have been observed since 2008. The WTO/OECD G-20 report (2016) reported that the percentage of trade affected by newly imposed measures since 2008 is estimated at 1.1% (4 year average), which is then differentiated by sector. Henn and McDonald (2011) estimates that “affected trade flows fell by 5 percent in response to border measures []” (p.35). Higher protection in METRO increases the costs for trade, and results overall in less trade. Consumers and producers face higher costs for imports, hence production costs increase and domestic as well as international demand decrease.
Figure 7 shows that more open trade policies in the future will increase GVC trade just like past trade liberalisation has facilitated the growth of GVCs (Business as usual). Overall, the effects are small as the imputed shock is moderate given that the largest trading countries/regions are currently already applying open trade policies. This sub-scenario 1a results in a higher trade/GDP ratio in 2030 (+0.8 percentage points) as well as higher levels of international sourcing of intermediates and total exports (respectively +0.2 and +0.4 percentage points, both in % of production). Higher levels are particularly observed in manufacturing reflecting the fact that GVCs are relatively more important in manufacturing industries (OECD, 2013a). The length of GVCs continues to increase with the average distance of products internationally traded rising to 5,425 km in 2030. In line with Miroudot and Nordstrom (2015), final products are traded over longer distances in GVCs than intermediates. Since the effects are relatively larger in emerging economies - particularly Asia, the shares of North-South and especially South-South trade increase towards 2030. In addition, a minor shift in production towards Asia is observed.

THE FUTURE OF GLOBAL VALUE CHAINS: BUSINESS AS USUAL OR “A NEW NORMAL”?
OECD SCIENCE, TECHNOLOGY AND INDUSTRY POLICY PAPERS 31
Figure 7. Simulation results for scenario 1: trade policy
Note: Sim 1a (sub-scenario 1a) models growing liberalisation while sim 1b (sub-scenario 1b) models growing protectionism
Importance of GVCs 1. Ratio intermediate imports/production
Length of GVCs 3. Average km
Geography of GVCs 5. Intra-inter regional trade
International production 7. Production
2. Exports as a share of production Importance of Trade
4. Trade as a share of GDP
6. North-South trade
8. Value Added
6
9
12
15
18
6
7
8
9
10
2011 sim1a sim1b
All industries (left scale)Manufacturing (right scale)
%%
5 000
5 100
5 200
5 300
5 400
5 500
2011 sim1a sim1b
All products Intermediateskm
44.8 43.9 44.7
55.2 56.1 55.3
2011 sim1a sim1b
intra-regional inter-regional
%
31.6 31.8 31.6
25.9 25.8 25.8
4.4 4.4 4.4
23.6 23.5 23.6
14.6 14.6 14.6
2011 sim1a sim1b
Asia EuropeLatin America North AmericaROW
%
10
14
18
22
26
30
10
11
12
13
14
15
2011 sim1a sim1b
All industries (left scale)Manufacturing (right scale)
%%
+3.30% -0.81%
0
5
10
15
20
25
30
2011 sim1a sim1b
All products% Growth of trade
44.0 42.9 44.0
40.1 40.7 40.0
15.9 16.4 16.0
2011 sim1a sim1b
North-North North-SouthSouth-South
%
28.8 28.8 28.8
23.0 23.0 23.0
5.1 5.1 5.1
26.5 26.5 26.5
16.7 16.7 16.7
2011 sim1a sim1b
Asia EuropeLatin America North AmericaROW
%

THE FUTURE OF GLOBAL VALUE CHAINS: BUSINESS AS USUAL OR “A NEW NORMAL”?
32 OECD SCIENCE, TECHNOLOGY AND INDUSTRY POLICY PAPERS
Not surprisingly, the results go in the opposite direction for sub-scenario 1b when imputing growing protectionism. Both trade and GVCs stagnate towards 2030: the trade/GDP ratio decreases slightly as well as the international sourcing of intermediates and exports in percent of production (all decrease with 0.1 percentage points). The average distance of products exported/imported within GVCs does not increase further, suggesting a break with the long-term trend of growing length of GVCs. Changes are more important for developed economies. As effects are small, no real shift in economic activity between regions is however observed with the shares in GVCs trade and production and value added of the different regions remaining constant. The imputed shock of protectionism is smaller than the shock in the liberalisation sub-scenario, hence resulting in even smaller effects.
5.2. Scenario 2: new (low-cost) producers in manufacturing
The large and rapidly growing labour supply in emerging economies is considered to be a major determinant of their (future) economic rise, hence growth projections of the labour force up to 2030 (Source: United Nations – medium fertility variant)34 have been imputed in METRO in sub-scenario 2a. A growing labour supply causes simultaneous supply and demand effects. First, the higher abundance of labour decreases wages and thus also lowers production costs, thereby improving the competitive position of these countries. This allows these countries to integrate in GVCs: production and exports increase especially in labour intensive sectors. Second, the larger labour supply generates more income for domestic households; demand (on the domestic as well as international markets) increases and this increases imports of final goods further supporting domestic production. The higher income (labour supply increases more than wages drop) leads additionally to a reallocation of consumption expenditure away from basic goods and a higher consumption share of services goods (governed through the income elasticities). Regions where population growth is negative experience the opposite effects.
The results of this sub-scenario 2a (Figure 8) show no or only small effects on GVC trade and production patterns at the global level. Indicators on the importance of GVCs (imported intermediates, total exports) and trade (in % of GDP) do not change between the 2011 base year and 2030. But the average distance of international trade within GVCs continues to show an upward trend (Business as usual). Looking at more detailed results, different regional dynamics in GVCs come clear. As the growth of the labour force up to 2030 is concentrated in Asia, GVCs in 2030 further extend in this part of the world thereby becoming larger and longer. In addition, Asia increases its economic importance in the world, accounting for a larger share in global production, value added, and trade.
The assumption of fixed production technology in sub-scenario 2a is a strong assumption as during their economic development, countries typically move from an agricultural economy towards manufacturing and subsequently services. The adoption of new technologies is instrumental in this process of structural change; therefor, a second sub-scenario 2b supplants the production technology of Korean manufacturing industries on a number of emerging economies35,36 (in addition to the growth estimates of the labour force in sub-scenario 2a). The choice of Korea is straightforward: following a process of rapid industrialisation in the 1980s-1990, Korea has rapidly caught up with other economies and established itself as a major exporter in manufactures.
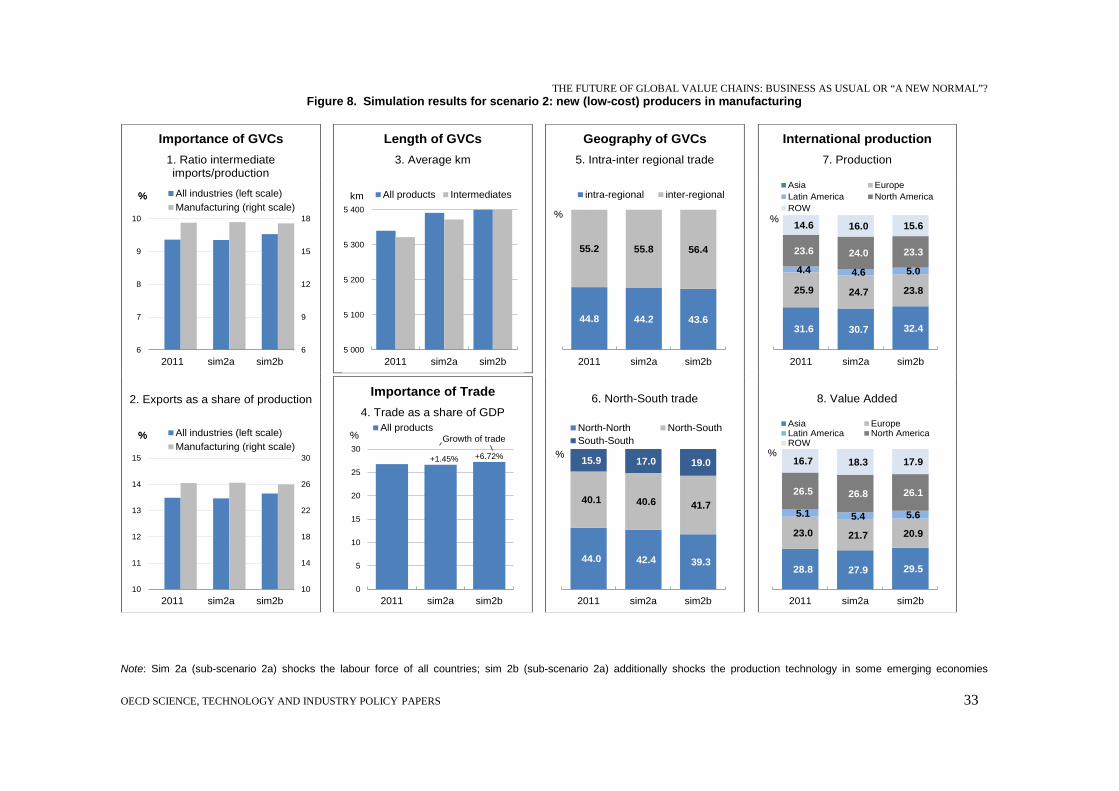
THE FUTURE OF GLOBAL VALUE CHAINS: BUSINESS AS USUAL OR “A NEW NORMAL”?
OECD SCIENCE, TECHNOLOGY AND INDUSTRY POLICY PAPERS 33
Figure 8. Simulation results for scenario 2: new (low-cost) producers in manufacturing
Note: Sim 2a (sub-scenario 2a) shocks the labour force of all countries; sim 2b (sub-scenario 2a) additionally shocks the production technology in some emerging economies
Importance of GVCs 1. Ratio intermediate imports/production
Length of GVCs 3. Average km
Geography of GVCs 5. Intra-inter regional trade
International production 7. Production
2. Exports as a share of production Importance of Trade
4. Trade as a share of GDP
6. North-South trade
8. Value Added
6
9
12
15
18
6
7
8
9
10
2011 sim2a sim2b
All industries (left scale)Manufacturing (right scale)
%%
5 000
5 100
5 200
5 300
5 400
2011 sim2a sim2b
All products Intermediateskm
44.8 44.2 43.6
55.2 55.8 56.4
2011 sim2a sim2b
intra-regional inter-regional
%
31.6 30.7 32.4
25.9 24.7 23.8
4.4 4.6 5.0
23.6 24.0 23.3
14.6 16.0 15.6
2011 sim2a sim2b
Asia EuropeLatin America North AmericaROW
%
10
14
18
22
26
30
10
11
12
13
14
15
2011 sim2a sim2b
All industries (left scale)Manufacturing (right scale)
%%
+1.45% +6.72%
0
5
10
15
20
25
30
2011 sim2a sim2b
All products% Growth of trade
44.0 42.4 39.3
40.1 40.6 41.7
15.9 17.0 19.0
2011 sim2a sim2b
North-North North-SouthSouth-South
%
28.8 27.9 29.5
23.0 21.7 20.9
5.1 5.4 5.6
26.5 26.8 26.1
16.7 18.3 17.9
2011 sim2a sim2b
Asia EuropeLatin America North AmericaROW
%

THE FUTURE OF GLOBAL VALUE CHAINS: BUSINESS AS USUAL OR “A NEW NORMAL”?
34 OECD SCIENCE, TECHNOLOGY AND INDUSTRY POLICY PAPERS
Allowing emerging economies to adopt new production technologies in sub-scenario 2b results indeed in (larger) positive effects but the impact on trade and GVC trade overall remains moderate. Global trade/GDP increases slightly (+0.4 percentage points) due to the larger exports and more international sourcing of intermediates (both +0.1 percentage points, in % of global production). The average km products travel in GVCs increases strongly (up to 5,484 in 2030) indicating that the length of GVCs continues to increase (and more compared to sub-scenario 2a). Larger effects are observed for the geographical distribution of global production and trade: the growth of South-South and North-South trade is higher than North-North trade and emerging economies accounting for a larger share in global production and value added. North America and especially Europe are losing ground in sub-scenario 2b.
5.3. Scenario 3: growing demand in emerging economies
The same projections of the labour force (see Scenario 2) have been used as a first input in developing Scenario 3 since the growth in the labour force, underpinned by the growth in total population in these countries, is an important driver behind the growing consumer markets in emerging economies37. In addition, the average consumption spending will gradually change as consumers become more prosperous. For that, projections on the share of the middle class and their consumption expenditure (source: The Brookings Institute)38 have been used. Important changes in consumption patterns are modelled to occur in the following regions: Brazil, (other) Middle and South America, ASEAN, China, India, and Tunisia and South Africa: their consumption patterns in 2030 are assumed to increasingly resemble the average OECD consumption spending39. The effects are largely similar to the mechanisms described in Scenario 2 with both supply and demand effects arising in METRO. At the demand side, the reallocation of consumption is strengthened by the changing consumption patterns in emerging economies which increasingly reflect these of more developed economies The growing middle class gradually shifts consumption away from agro-food products to services and manufacturing products such as electronic equipment or motor vehicles.
The results (Figure 9) indicate, maybe somewhat surprisingly, that the emergence of the middle class in emerging economies does not significantly promote the growth of international fragmentation and GVCs in the future. The international sourcing of intermediates and exports as percentage of production even decrease by one percentage point notwithstanding the substantial growth of both exports and intermediate inputs in absolute amounts. Important differences exist however between developed and emerging regions, with especially Asia showing increases in both indicators. The length of GVCs continues to increase in this scenario with the average distance of traded products increasing from 5,335 in the 2011 base year to 5,393 km in 2030.

THE FUTURE OF GLOBAL VALUE CHAINS: BUSINESS AS USUAL OR “A NEW NORMAL”?
OECD SCIENCE, TECHNOLOGY AND INDUSTRY POLICY PAPERS 35
Figure 9. Simulation results for scenario 3: growing demand in emerging economies
Note: Sim 3 (scenario 3) shocks the labour force of all countries plus the consumption patterns of a number emerging economies
Importance of GVCs 1. Ratio intermediate imports/production
Length of GVCs 3. Average km
Geography of GVCs 5. Intra-inter regional trade
International production 7. Production
2. Exports as a share of production Importance of Trade
4. Trade as a share of GDP
6. North-South trade
8. Value Added
6
9
12
15
18
6
7
8
9
10
2011 sim3
All industries (left scale)Manufacturing (right scale)
%%
5 000
5 100
5 200
5 300
5 400
2011 sim3
All products Intermediateskm
44.8 44.1
55.2 55.9
2011 sim3
intra-regional inter-regional
%
31.6 31.3
25.9 24.5
4.4 4.6
23.6 23.8
14.6 15.9
2011 sim3
Asia EuropeLatin America North AmericaROW
%
10
14
18
22
26
30
10
11
12
13
14
15
2011 sim3
All industries (left scale)Manufacturing (right scale)
%%
+2.05%
0
5
10
15
20
25
30
2011 sim3
All products% Growth of trade
44.0 41.9
40.1 40.7
15.9 17.4
2011 sim3
North-North North-SouthSouth-South
%
28.8 28.3
23.0 21.5
5.1 5.3
26.5 26.6
16.7 18.2
2011 sim3
Asia EuropeLatin America North AmericaROW
%

THE FUTURE OF GLOBAL VALUE CHAINS: BUSINESS AS USUAL OR “A NEW NORMAL”?
36 OECD SCIENCE, TECHNOLOGY AND INDUSTRY POLICY PAPERS
The trade/GDP ratio decreases slightly (from 26.8 to 26.6%) which seems to be related to the gradual shift from an export-led growth model to one increasingly based on domestic consumption particularly in Asian countries. In addition to domestic production, imports into emerging economies increase significantly towards 2030 due to the growing demand of the middle class. In contrast, the ageing population in North America and especially Europe limits their growth in GDP and imports.
The results confirm however that the growing middle class in emerging economies is shifting the economic centre further towards emerging economies and in particular Asia. South-South trade, and to a lesser extent also North-South trade, grows faster than North-North trade towards 2030. In addition, intra-regional trade in Asia increases more strongly than inter-regional trade, further underlining the strong dynamics in this part of the world. As a result, Asia increases its share both in production and value added.
5.4. Scenario 4: rising wage costs
The modelling of rising wage costs in the METRO-model is not straightforward, as METRO assumes perfect competition on the labour market. Wage increases thus reflect similar productivity increases, consequently unit labour costs and production costs do not change. But since wages and productivity often diverge – among others because of frictions in the labour market, an alternative modelling approach has been used to directly impute an increase in production costs (mimicked by increasing production taxes). For this, projections on wage costs (PwC, 2013) have been adjusted to account for the proportion of unit labour costs increases due to increases in labour costs (per hour) across countries40 and the importance of wage costs in total production costs (across industries and countries).
An increase in production costs in METRO directly results in a deteriorating competitiveness on domestic as well as international markets and leads to falling production. Exports decrease and domestic final demand shifts to imported goods. Decreasing production reduces the amount of inputs needed and international sourcing of intermediates decreases. Countries witnessing an increase in their production costs will become less attractive in GVCs for the sourcing of intermediates.
The increases in production costs result in global trade to fall both in absolute terms and in percentage of GDP in 2030. Higher prices as a result of rising wage costs discourage demand on domestic and international markets. At the same time, higher production costs also resort a negative effect on GVCs, with international sourcing of intermediates as well as exports decreasing (respectively -0.3 and -0.1 percentage points, both in % of production). The fact that some emerging economies become more expensive makes offshoring from developed economies a less attractive option; instead domestic sourcing of intermediates increase relatively more in developed economies. This also seems to explain why the length of GVCs does not continue to increase between the 2011 base year and 2030. The effects are larger in more labour-intensive industries in particular textiles and wood, reflecting the larger importance of wages in the total production cost.
Although future wage increases are higher in some emerging economies, there is no shift in global production and trade towards developed economies. The share of North and South trade remains basically the same, just like the geographic distribution of global production. The small magnitude of the effects seems to suggest that the activities that move out of some emerging economies – as these countries become more/too expensive - go to some extent to developed economies but also especially to other emerging economies. The large labour reserve in these countries limits the risk of any wage increases.

THE FUTURE OF GLOBAL VALUE CHAINS: BUSINESS AS USUAL OR “A NEW NORMAL”?
OECD SCIENCE, TECHNOLOGY AND INDUSTRY POLICY PAPERS 37
Figure 10. Simulation results for scenario 4: rising wage costs
Note: Sim 4 (scenario 4) shocks the production costs of countries
Importance of GVCs 1. Ratio intermediate imports/production
Length of GVCs 3. Average km
Geography of GVCs 5. Intra-inter regional trade
International production 7. Production
2. Exports as a share of production Importance of Trade
4. Trade as a share of GDP
6. North-South trade
8. Value Added
6
9
12
15
18
6
7
8
9
10
2011 sim4
All industries (left scale)Manufacturing (right scale)
%%
5 000
5 100
5 200
5 300
5 400
2011 sim4
All products Intermediateskm
44.8 44.5
55.2 55.5
2011 sim4
intra-regional inter-regional
%
31.6 31.4
25.9 25.8
4.4 4.5
23.6 23.8
14.6 14.6
2011 sim4
Asia EuropeLatin America North AmericaROW
%
10
14
18
22
26
30
10
11
12
13
14
15
2011 sim4
All industries (left scale)Manufacturing (right scale)
%%
-3.94%
0
5
10
15
20
25
30
2011 sim4
All products% Growth of trade
44.0 43.9
40.1 40.1
15.9 15.9
2011 sim4
North-North North-SouthSouth-South
%
28.8 29.2
23.0 22.8
5.1 5.0
26.5 26.3
16.7 16.6
2011 sim4
Asia EuropeLatin America North AmericaROW
%

THE FUTURE OF GLOBAL VALUE CHAINS: BUSINESS AS USUAL OR “A NEW NORMAL”?
38 OECD SCIENCE, TECHNOLOGY AND INDUSTRY POLICY PAPERS
5.5. Scenario 5: the digitalisation (IT) of production
Because of the expected broad and possible disruptive effects of digitalisation, complete estimates on the impact of digitalisation of production and manufacturing are not widely available. One German study (undertaken by Bitkom and Fraunhofer in 2014) discussing the impact Industrie 4.0 (due to the robotics, automation, Internet of Things) on the German economy41, presents however estimates of productivity and value added growth across manufacturing industries in Germany. The study expects the largest impacts in the chemical, machine, transport, electrical and electronical industries (ranging between 15 and 30% growth in value added between 2013 and 2025 while the impact for the total manufacturing sector is estimated at 10%). These estimates have been used as the starting base in developing this scenario, but it is clear that these most likely do not capture the complete effects of digitalisation.
In order to model the impact of digitalisation beyond manufacturing – since effects on services industries are expected to be at least as important, similar estimations have been developed for other industries. Therefore, information on the digital character of industries (including manufacturing and services) coming from different sources4243 has been used to derive comparable effects of digitalisation. For example, finance typically comes out as the most digitalised industry across countries – often more digitalised than manufacturing industries, hence the highest effect has been applied to this sector. In addition, the same percentages as developed in the German study have been applied to the four most “digital-intensive” service industries. In order to derive estimates for different countries, several sources44 have been used to derive a measure of the digital readiness and aptitude of countries which has then been used to calibrate the estimations of Germany to other countries. The United States ranks typically as the digital leader with also Korea being upfront. The estimates of Germany – for manufacturing and services – have accordingly been grossed up for these two countries, while for other countries the estimated effects of digitalisation have been revised downwards.
The estimates across industries and countries have been used in METRO to simulate a positive productivity shock (sub-scenario 5a). This productivity increase will directly result in a higher competitiveness on domestic and international markets. Production, GDP and income will increase, as well as exports and intermediate use (internationally sourced intermediates will increase in absolute amounts but will become less competitive than domestic intermediates). As the growing digitalisation can be expected to go together with changes in production technology in different countries, sub-scenario 5b additionally assumes that the digital-following countries will switch to the US production technology (with the United States the digital leader) in the most digitalised industries45.

THE FUTURE OF GLOBAL VALUE CHAINS: BUSINESS AS USUAL OR “A NEW NORMAL”?
OECD SCIENCE, TECHNOLOGY AND INDUSTRY POLICY PAPERS 39
Figure 11. Simulation results for scenario 5: the digitalisation (IT) of production
Note: Sim 5a (sub-scenario 5a) shocks the productivity in the most IT-intensive industries while sim 5b (sub-scenario 5a) additionally models larger access to the frontier technology in these industries
Importance of GVCs 1. Ratio intermediate imports/production
Length of GVCs 3. Average km
Geography of GVCs 5. Intra-inter regional trade
International production 7. Production
2. Exports as a share of production Importance of Trade
4. Trade as a share of GDP
6. North-South trade
8. Value Added
6
9
12
15
18
6
7
8
9
10
2011 sim5a sim5b
All industries (left scale)Manufacturing (right scale)
%%
5 000
5 100
5 200
5 300
5 400
5 500
2011 sim5a sim5b
All products Intermediateskm
44.8 44.1 43.9
55.2 55.9 56.1
2011 sim5a sim5b
intra-regional inter-regional
%
31.6 31.1 31.5
25.9 25.0 24.7
4.4 4.0 4.0
23.6 26.9 26.8
14.6 13.0 13.0
2011 sim5a sim5b
Asia EuropeLatin America North AmericaROW
%
10
14
18
22
26
30
10
11
12
13
14
15
2011 sim5a sim5b
All industries (left scale)Manufacturing (right scale)
%%
+13.6% +13.1%
0
5
10
15
20
25
30
2011 sim5a sim5b
All products% Growth of trade
44.0 45.1 44.7
40.1 40.2 40.3
15.9 14.8 15.0
2011 sim5a sim5b
North-North North-SouthSouth-South
%
28.8 28.3 29.0
23.0 22.2 21.8
5.1 4.6 4.6
26.5 30.2 29.9
16.7 14.7 14.7
2011 sim5a sim5b
Asia EuropeLatin America North AmericaROW
%

THE FUTURE OF GLOBAL VALUE CHAINS: BUSINESS AS USUAL OR “A NEW NORMAL”?
40 OECD SCIENCE, TECHNOLOGY AND INDUSTRY POLICY PAPERS
The results (Figure 11) indicate that digitalisation, as instrumented by an increase of productivity across countries and industries, will increase both global trade and world GDP. But digitalisation will have an overall negative impact on GVCs, at least on the international stages of GVCs. The reason is that new information technologies make the international fragmentation of production less attractive; a larger part of the demand for intermediate as well as final products46 will be served by domestic production. International sourcing of intermediates declines (from 9.4% to 9.0% in percentage of production) while also exports decrease (-0.6 percentage points, relative to production). The decreases in international sourcing are most prominent in developed economies, reflecting the fact that digitalisation through automation, robotics, etc. help restore the competitiveness of these countries and reduce future offshoring. This is also reflected in the stronger growth of North-North trade at the expense of South-South trade. Reflecting the digital lead of the United States, particularly North-America increases its share in global production and value added.
The decreasing importance of GVCs will result in a drop of the trade/GDP ratio from 26.8 to 25.4% in 2030, as the benefits of the international fragmentation of production decreases because of growing digitalisation. Notwithstanding this falling importance of trade, the length and complexity of GVCs seems to grow further (from 5,340 to 5,430 km), reflecting the increased GVC trade especially in final products from developed to emerging economies.
When digital followers are able to adopt the same production technology as the digital leader (sub-scenario 5b), the effects become even larger. Imported intermediates loose further ground to domestic intermediates (international sourcing decreases to 8.8% of production in 2030), while also exports in percentage of production decrease further (from 13.5 to 12.8%). As a result, the trade/GDP ratio in this sub-scenario drops to 25.1% in 2030 (i.e. a decrease of 1.8 percentage points). The rebalancing of the global economy towards developed economies remains but is somewhat smaller given that also a number of IT followers – emerging economies (e.g. China) get access to the frontier IT technology.
5.6 Scenario 6: rising transport costs
Transport costs are dependent on a multitude of factors such as the mode of transport, scale of operation, fixed and operational costs (dependent on fuel prices, efficiency, average utilisation, etc.). As described in Box 2, different views exist how transport costs will evolve in the future. Discussions with experts at the International Transport Forum have resulted in the formulation of a base-line scenario 6a where international shipping costs are assumed to remain the same until 2020 and grow afterwards at a yearly rate of 4% to 2030 (i.e. a total growth of 40%). With maritime shipping representing about 80% of international transport flows, transport costs are expected to remain relatively low particularly due to continuing overcapacity in the sector (a large number of mega-ships have been ordered but not delivered yet). However, an additional scenario 6b has been included in the analysis with an annual growth rate of 8% between 2020 and 2030 (i.e. total growth of 80%) in order to account for other factors including more uncertain determinants like e.g. possible increases in oil prices47. While increases of 40% and 80% over 15 years might seem large at first sight, it has to be kept in mind that transport costs are only a (small) part of import prices hence representing a rather moderate change in total costs.

THE FUTURE OF GLOBAL VALUE CHAINS: BUSINESS AS USUAL OR “A NEW NORMAL”?
OECD SCIENCE, TECHNOLOGY AND INDUSTRY POLICY PAPERS 41
Figure 12. Simulation results for scenario 6: rising transport costs
Note: Sim 6a (sub-scenario 6a) models an annual growth of 40% in transport costs while sim 6b (sub-scenario 6b) models an annual growth of 80%
Importance of GVCs 1. Ratio intermediate imports/production
Length of GVCs 3. Average km
Geography of GVCs 5. Intra-inter regional trade
International production 7. Production
2. Exports as a share of production Importance of Trade
4. Trade as a share of GDP
6. North-South trade
8. Value Added
6
9
12
15
18
6
7
8
9
10
2011 sim6a sim6b
All industries (left scale)Manufacturing (right scale)
%%
5 000
5 100
5 200
5 300
5 400
2011 sim6a sim6b
All products Intermediateskm
44.8 44.8 44.7
55.2 55.2 55.3
2011 sim6a sim6b
intra-regional inter-regional
%
31.6 31.6 31.5
25.9 25.8 25.8
4.4 4.4 4.4
23.6 23.6 23.7
14.6 14.6 14.6
2011 sim6a sim6b
Asia EuropeLatin America North AmericaROW
%
10
14
18
22
26
30
10
11
12
13
14
15
2011 sim6a sim6b
All industries (left scale)Manufacturing (right scale)
%%
-2.03% -3.92%
0
5
10
15
20
25
30
2011 sim6a sim6b
All products% Growth of trade
44.0 44.2 44.4
40.1 39.9 39.8
15.9 15.9 15.8
2011 sim6a sim6b
North-North North-SouthSouth-South
%
28.8 28.8 28.9
23.0 23.0 22.9
5.1 5.1 5.1
26.5 26.5 26.5
16.7 16.7 16.7
2011 sim6a sim6b
Asia EuropeLatin America North AmericaROW
%

THE FUTURE OF GLOBAL VALUE CHAINS: BUSINESS AS USUAL OR “A NEW NORMAL”?
42 OECD SCIENCE, TECHNOLOGY AND INDUSTRY POLICY PAPERS
The increasing transportation costs, which are modelled as an export tax on transport services, increase trade and transport margins making importing more expensive. This overall reduces trade and lowers worldwide GDP with especially long distance trade becoming more expensive. In addition, the organisation of production across borders becomes more expensive, expecting to have a negative effect on GVCs. Goods are differently affected depending on the respective trade margins. While there are no trade margins on services, services are affected by increased input prices for non-service imported inputs and by the link as inputs in manufacturing. The effect is rather small as trade and transport margins represent only a small share of the total trade value.
The results (Figure 12) underscore the importance of transports costs as possible game-changer because rising transport costs are become harmful for the functioning of GVCs. International sourcing of intermediates and total exports (of intermediate as well as final products) fall both in absolute terms and in percentage of production. The effects are, as expected, larger in the 80% sub-scenario 6b and demonstrate a reversal in GVCs towards 2030 – for example international sourcing decreases with respectively 0.2 and 0.4 percentage points). In addition, there is a clear break with the long-term trend of increasing length of GVCs, with the average distance of products internationally traded in GVCs falling in this scenario: from 5,340 km in the 2011 base year to respectively 5,333 km and 5,328 km in sub-scenarios 6a and 6b. As expected, especially the average distance of inter-regional trade decreases towards 2030, since trade flows over large distances become relatively more expensive.
The result of this GVC reversal is that global trade decreases in importance with the trade/GDP ratio dropping from 26.8 to 26.2% in the 40% base-line scenario 6a and 25.8% in the 80% scenario 6b. Particularly the first sub-scenario seems to resemble remarkably well the global trade slowdown and the stalling of GVCs in recent years with similar magnitudes of the modelled effects. The fall in international trade is somewhat larger for manufacturing and intermediate products further illustrating the negative effect on GVCs
The largest decreases in trade are observed for Asia and Latin-America, with overall smaller decreases for Europe and NAFTA. These regional differences however do not give rise to changes in the geographical distribution of international trade and production. North-North, North-South and South-South trade all shrink at roughly the same rate, and production and value added shares of the large regions remains roughly the same.
5.7 A combined scenario: new manufacturers, growing demand in emerging economies, rising wage and transports and the digitalisation (IT) of production
While the previous scenarios focused on the impact of one factor while keeping the other factors constant (ceteris paribus), a last scenario allows for different factors to change simultaneously. It also reflects that the future will be determined by Business as usual as well as “A new normal” factors at the same time. This scenario is a combined scenario of the sub-scenarios 2b (growing labour force and new production technologies in emerging economies), 3 (growing and changing (consumer) demand in emerging economies), 4 (rising wage costs), 5b (digitalisation of production resulting in productivity increases and larger access to frontier IT technology) and 6b (80% increase in transport costs in order to take into account also other factors that may result in rising costs of internationally trading goods and services). Scenario 1 has not been included in this combined scenario because of the large uncertainty about future trade and investment policies across different countries.

THE FUTURE OF GLOBAL VALUE CHAINS: BUSINESS AS USUAL OR “A NEW NORMAL”?
OECD SCIENCE, TECHNOLOGY AND INDUSTRY POLICY PAPERS 43
Figure 13. Simulation results for combined scenario: new (low-cost) producers in manufacturers, growing demand in emerging economies, rising wage and transport costs and digitalisation (IT) of production
Importance of GVCs 1. Ratio intermediate imports/production
Length of GVCs 3. Average km
Geography of GVCs 5. Intra-inter regional trade
International production 7. Production
2. Exports as a share of production Importance of Trade
4. Trade as a share of GDP
6. North-South trade
8. Value Added
6
10
14
18
22
6
7
8
9
10
2011 combi
All industries (left scale)Manufacturing* (right scale)
%%
* excluding Food
5 000
5 100
5 200
5 300
5 400
5 500
2011 combi
All products Intermediateskm
44.8 43.8
55.2 56.2
2011 combi
intra-regional inter-regional
%
31.6 26.5
25.924.9
4.44.6
23.6 29.4
14.6 14.6
2011 combi
Asia EuropeLatin America North AmericaROW
%
10
14
18
22
26
30
10
11
12
13
14
15
2011 combi
All industries (left scale)Manufacturing* (right scale)
%%
* excluding Food
+2.61%
0
5
10
15
20
25
30
2011 combi
All products%
Growth of trade
44.0 46.1
40.1 40.6
15.9 13.3
2011 combi
North-North North-SouthSouth-South
%
28.8 29.0
23.0 20.2
5.1 5.0
26.5 30.0
16.7 15.9
2011 combi
Asia EuropeLatin America North AmericaROW
%
THE FUTURE OF GLOBAL VALUE CHAINS: BUSINESS AS USUAL OR “A NEW NORMAL”?
44 OECD SCIENCE, TECHNOLOGY AND INDUSTRY POLICY PAPERS
The results indicate that the negative impact of the ‘A new normal’ factors is larger than the (positive) impact of the Business as usual factors, resulting in a dramatic restructuring of GVCs at the global level. International sourcing of intermediates is expected to decrease with 1.0 percentage point by 2030, while also the exports of (all) products will decrease with 0.9 percentage points (both expressed in percentage of production). Manufacturing is affected most heavily, reflecting the large importance of GVCs in these industries.
The negative growth of GVCs also results in a declining importance of trade with the trade/GDP ratio dropping by 4.1 percentage points in 2030. The changes are somewhat larger for emerging economies, but also OECD economies will be affected by the contraction of GVCs. The growing competitiveness of developed economies leads to a geographical reallocation of trade and production, with particularly North-North trade gaining in importance at the expense of South-South trade. Particularly the United States acquires a growing share in global production.
Notwithstanding the contraction of GVCs and somewhat surprisingly, the average length of GVCs continues to increase – although at a slower rate – with the average kilometres products internationally travelling in GVCs increasing to 5,408 km in 2030. This is completely driven by the growing length of intra-regional GVCs as the length of the interregional parts of GVCs decreases slightly.
6. Discussion and concluding remarks
The world economy is facing a number of structural shifts that may dramatically change - some refer so ‘seismic’ changes – the outlook of GVCs in the coming years. The empirical evidence evaluating the potential impact of these shifts however largely lags behind, which makes these discussions somewhat speculative. By describing how these shifts will likely evolve over the next 10 to 15 years and calculating their effects on global production and trade, the scenarios in this paper offers new - empirically funded - insights on the future of GVCs. What are the major conclusions coming out of the multitude of results that have been presented in the previous section?
Different factors will be at play at the same time and steer the future of GVCs in different directions. A number of factors are expected to advance the expansion of GVCs further just like they have done in the past, advocating that it will be rather Business as usual. But other factors will slow down, stop and even reverse the continuous expansion of GVCs at the global level, thereby suggesting that “A new normal” is developing for GVCs. Factors under Business as usual as well as “A new normal” include new and old factors, i.e. factors of which the impact on GVCs is already known and also other factors of which the possible impact is less known until now (e.g. digitalisation).
The empirical results of the different scenarios provide support for each of the individual factors: the results go overall in the expected directions but the magnitudes of the likely impacts are very different (Table 2). The negative impacts on GVCs are found to be larger than the positive impacts suggesting we may move to “A new normal” for GVCs in the future, rather than that it will be Business as usual. It has not been possible to develop (credible) future scenarios for all factors under Business as usual and “A new normal” because of data unavailability.

THE FUTURE OF GLOBAL VALUE CHAINS: BUSINESS AS USUAL OR “A NEW NORMAL”?
OECD SCIENCE, TECHNOLOGY AND INDUSTRY POLICY PAPERS 45
Table 2. Summary of simulated shocks and effects
The digitalisation of production is most likely the biggest game-changer for the future of GVCs, just like technology has significantly shaped the organisation of production in the past. The growing importance of information technologies like robotics, artificial intelligence, automation, etc. will significantly redraw the contours of the global economy and have a disruptive impact on GVCs. The analysis – admittedly based on more speculative data for this scenario – demonstrates that IT will make offshoring less attractive and GVCs less pervasive and also shorter. International sourcing is expected to decrease significantly with intermediates increasingly sourced domestically in developed economies. As a result, the contribution of trade GDP growth decreases with the global trade/GDP dropping a couple of percentage-points.
These results on digitalisation do not take into account any effect 3D printing may have as these effects are at the moment uncertain; it is generally expected that the use of 3D-printing for mass-produced goods will not be for immediately. But if 3D printing becomes as widely spread as proclaimed by its proponents, the effects of digitalisation on GVC trade will undoubtedly be much larger. This technology can be expected to significantly depress the imports of intermediates as well as the exports of final products.
Digitalisation will also lead to a rebalancing of international activities towards developed economies. Digitalisation - if managed well - may thus result in a restructuring of global production and trade benefitting especially OECD economies. But also emerging economies are looking increasingly at the potential opportunities of automation, robotics, etc., often to compensate for their eroding advantage of low
Factors modelled Modelled shock Simulated effects
Variable shocked Size (likely evolution in future)
Trade (US$)
Trade (% GDP)
International sourcing
GVC length
Trade geography
(biggest winners)
Production geography
(biggest winners)
Business as usual Further liberalisation tariffs and trade
facilitaionsmall + ++ + ++ North-South
Growing protectionism non-tariff barriers small - - - 0
New manufacturers labour force and production technology
large ++ + + +++ South-South Asia
Emerging middle class labour force and consumption patterns
large + - - ++ South-South Asia
A New Normal Rising wage costs total production costs moderate -- -- - +
Digitalisation (IT) productivity and production technology
large +++ --- -- +++ North-North North America
Rising transport costs transport costs moderate -- -- - -
Factors not modelled Expected size Expected effects
Business as usual Digitalisation (CT) moderate reverse of 'rising transport costs' Services moderate reverse of 'rising transport costs' MNEs small/moderate reverse of 'rising transport costs'
A New Normal Hidden/extra costs GVCs small/moderate similar as 'rising transport costs' Risk diversification small/moderate similar as 'rising transport costs' Environmental sustainability small/moderate similar as 'rising transport costs'

THE FUTURE OF GLOBAL VALUE CHAINS: BUSINESS AS USUAL OR “A NEW NORMAL”?
46 OECD SCIENCE, TECHNOLOGY AND INDUSTRY POLICY PAPERS
(labour) costs. IT investments e.g. in robotics in a number of emerging economies are a multiple of investments in some OECD economies.
The rise in (wage) costs in (some) emerging economies, is another factor that could make OECD economies again more competitive and thus offshoring less attractive. While this issue has attracted a lot of attention in policy discussions around, the analysis shows however that its impact on GVCs and global production in 2030 is more limited. The effects go in the same direction as the effects of digitalisation, but are much smaller. One reason is that wage increases in a country are typically compensated to some extent by productivity increases. Further on, even when one emerging economy becomes too expensive for some - particularly labour-intensive activities, there are millions of people in other emerging economies ready to leave their agricultural living on the countryside for a job in a manufacturing factory in the city.
The empirical analysis further shows that rising transport costs could act as another game-changer and depress both the international sourcing of intermediates and the exports of final and intermediate products. Transport costs are however not expected to rise dramatically in the near future especially because of the (large) over-supply in maritime transport – which accounts for roughly 80% of international cargo transport. But even the rather moderate increases in transport costs modelled in this paper show already that GVCs will be significantly affected. Unlike digitalisation, rising transport costs - at least the magnitudes (respectively 40 and 80%) simulated in this paper - do however not significantly change the geographical distribution of global trade and production towards 2030. The results indicate that transport costs rather impact the importance and length of GVCs.
The simulated results on transport costs should probably be interpreted more broadly by recognising that the scenario basically models the rising costs of organising production on a global scale, i.e. when trading and transferring products internationally becomes more costly. This cost is not only determined by ‘pure’ transport costs but increasingly stems also from other factors discussed in this paper. For example, higher costs also reflect the changed sourcing behaviour of companies to balance cost efficiency with risk diversification – which typically comes at an additional (direct) cost. Also possible future costs for companies arising from green and environmental market trends and/or regulation can be expected to have an impact on GVCs. The sub-scenario which models an increase of 80% in transport costs up to 2030 could then maybe considered as a more encompassing scenario compared to the 40% sub-scenario.
But as mentioned before, not only factors underwriting “A new normal” storyline will be at play in the future. The factors that have facilitated the growth of GVCs in the past, will clearly do so also in the future. Remarkably digitalisation plays also an important role in this Business as usual scenario as communication – in contrast to information – technologies makes it easier to fragment and internationally disperse production networks. New communication technologies will thus further facilitate international offshoring in the future. Also the increasingly efficient and international provision of ‘modern’ services will contribute to the further growth of GVCs as they ease the international operations of companies.
In addition, the growing importance of emerging economies, both at the supply and the demand side, subscribes to the Business as usual storyline. New manufacturers are expected to gradually acquire a place in the future global economy thereby further pushing the international fragmentation of production and thus expanding GVCs. Past trends of increasing length of GVCs, growing international sourcing and total exports can be expected to continue because of these factors. The growing number of prosperous consumers in these emerging economies – following their economic success – will further shift the economic centre of the global economy in (South-) eastern direction.
The impact of this growing middle class in emerging economies on GVCs and particularly international sourcing is however limited. The strong growth of local consumer markets will cause a shift away from an export-led growth model in emerging economies, thereby rather having a negative effect on

THE FUTURE OF GLOBAL VALUE CHAINS: BUSINESS AS USUAL OR “A NEW NORMAL”?
OECD SCIENCE, TECHNOLOGY AND INDUSTRY POLICY PAPERS 47
the growth of GVCs. At the same time, the ageing population in developed economies will also limit the expansion of GVCs. The results of this scenario show that the impact on specifically the importance and length of GVCs is even slightly negative. In general, the scenarios under “Business as usual” generate rather smaller effects than some of the scenarios under “A new normal”.
One scenario, i.e. the scenario of trade policy, does probably not mimic the (most) likely evolution of trade policy in the future. The (policy) views and stances on the benefits of further liberalisation are so different and uncertain in different parts of the world, that forecasting the direction and impact of future policy developments is difficult for the moment. Reflecting these marked differences, the trade scenario in this paper has analysed the effects of both growing liberalisation and protectionism, basically by extrapolating a number of trends of the (recent) past. The most important takeaway from this is that also (very) moderate shocks, in one or the other direction, are demonstrated to impact the future of GVCs, thereby underlining thus the importance of an open economy and relevant government policies for the efficient functioning of GVCs.
Overall, the magnitudes of the impacts of individual factors appear to be rather moderate, particularly when comparing these effects with the historical evolution of some of the indicators during the 2000s. The changes in this decade of hyperglobalisation were the result however of a confluence of different (and interdependent) factors: better communication technologies, falling trade barriers, growing expansion of MNEs, more efficient services and the growing capabilities of emerging - often due to the inflow of capital and technology by MNEs headquartered in OECD economies.
Further on, (some of) the smaller effects may be inherent to the use of the CGE methodology. While CGE analysis is perfectly legitimate in analysing changes on the short term, the issue of fixed technology and input-output structure becomes more important over a longer time frame. The fact that the effects are larger in the couple of sub-scenarios where technological change is explicitly allowed for, seems to indicate that some of the effects may be underestimated48.
The results of the combined scenario, reflecting the fact that factors under Business as usual as well as “A new normal” factors will impact GVCs simultaneously, indicate that it will be the concurrence of different factors that will significantly change the outlook and structure of GVCs in the future49. The estimates for this scenario point at a drop of 1 percentage point in international sourcing of intermediates (in percent of production) and 4.1 percentage points in the trade/GDP ratio. These effects may appear moderate at first sight but as a comparison, these indicators increased with respectively 1.7 and 4.8 percentage points during the explosive growth of GVCs in the 2000s. And the same indicators fell in 2009 during/after the global financial crisis respectively with 1.5 and 3.6 percentage points. These last changes were of course more cyclical and rebounded - although not completely - soon after, but the estimated results of the combined scenario can be expected to be more permanent given the structural characteristics of the factors included in this scenario. Roughly speaking, this would mean a return to the levels of 20005-2006 for GVCs, underlining the large impact different factors have on GVCs. At the same, a reallocation of global trade and production towards developed economies will take place. The growing digitalisation of production is an important factor behind the restored competitiveness of OECD economies and the shift towards “A new normal” in the future of GVCs.
The future in 2030 will however most likely look differently and the presented estimates should thus not be interpreted as forecasts. The simple reason is that the empirical methodology used in this paper does not allow to predict the future50. Instead, the objective of the empirical analysis was to evaluate the individual and combined effects of the different factors, hence foregoing the modelling of other – more general economic - factors impacting the future of GVCs and global production51. In addition, it has not been possible to develop credible scenarios for all the factors identified in this paper to be important for the future of GVCs. Likewise, the modelling of some factors - in particular, new and more unknown factors –

THE FUTURE OF GLOBAL VALUE CHAINS: BUSINESS AS USUAL OR “A NEW NORMAL”?
48 OECD SCIENCE, TECHNOLOGY AND INDUSTRY POLICY PAPERS
rests on a number of assumptions of which the thruthfullness will only become clear over time. And last but not least, one has to keep in mind that the results are derived from a model which almost by definition does not correspond to reality. Some of the disadvantages of the METRO model for this type of analysis have been discussed which have to be taken into account when discussing the results presented in this paper.
Despite the limitations of the empirical analysis, the results overall demonstrate that the future of GVCs may look quite different from the past. A number of emerging factors are shown to result in a clear break and reversal of the past trends of growing length, complexity and pervasiveness of GVCs. It is often taken for granted that these trends will continue also in the future. Given the close link between the evolution of GVCs and the role of global trade for GDP growth, these factors will also be important for the discussions on the future of globalisation. Indeed, the results show that the expansion of GVCs is accompanied by an increase in the global trade/GDP ratio and reversely, the consolidation and contraction of GVCs immediately translates in a global trade slowdown. A number of future directions have been raised for extending and further fine-tuning the analysis, but it is hoped that the results start to inform policy makers about the future of GVCs and globalisation.

THE FUTURE OF GLOBAL VALUE CHAINS: BUSINESS AS USUAL OR “A NEW NORMAL”?
OECD SCIENCE, TECHNOLOGY AND INDUSTRY POLICY PAPERS 49
NOTES
1 OECD (2013) has illustrated the emergence of GVCs in more detail and discussed their implications across
different policy domains; the OECD database on Trade in Value Added has provided the much needed evidence to analyse this new organisation of production and trade.
2 While at the same time GVCs have contributed to the economic development of developed (access to cheap labour supply and cheap imported products) and emerging economies (growing integration in global economy).
3 Research on falling trade levels (after the 2008 economic crisis and in more recent years) makes a distinction between demand factors (i.e. global trade decreases as demand has shifted to less trade-intensive goods and especially services) and international fragmentation. Most research finds that a structural GVCs effect has contributed to the decrease in trade (as % of GDP).
4 “It is better to foresee even without certainty than not to foresee at all” (H. Poincaré – Foundations of Science).
5 Business as usual includes old and new (i.e. known and unknown) factors that are expected to further promote the growth of GVCs; business as usual points to the expected pattern of continued GVC growth in the future, similar to what has been observed in the past. “A new normal” refers to a different expected growth pattern in the future, namely one of GVC retrenchment; the factors discussed under this new normal concern old (e.g. transport costs are known to negatively affect GVC growth) and new (e.g. digitalisation) factors.
6 Association of Southeast Asian Nations: Brunei Darussalam, Cambodia, Indonesia, Laos, Malaysia, Myanmar, the Philippines, Singapore, Thailand, Viet Nam.
7 Included countries are the United States, Canada, Japan, Australia, New Zealand, Chile, Peru, Mexico, Brunei, Malaysia, Singapore and Viet Nam.
8 Between the United States and EU countries.
9 Between Chile, Colombia, Mexico and Peru
10 RCEP is a proposed free trade agreement between the ten member states of ASEAN and the six states with which ASEAN has existing FTAs (Australia, China, India, Japan, South Korea and New Zealand).
11 Similar conclusions emerge from the Global Trade Alert analysis (2015) which uses a broader definition of protectionism including economic policies that are not necessarily violations of WTO rules (i.e. so-called “murky” protectionism).
12 By 2050, the urban population is expected to surpass 6 billion – up from less than 1 billion in 1950. This growth in city populations will be spread unevenly across the globe: almost all urban population growth will occur in cities in developing countries, with nearly 90% occurring in Asia and Africa (OECD, 2016b).
13 Ghani and O’Connell (2014) discuss how developing countries can bypass industrialisation and use services as a growth escalator.
THE FUTURE OF GLOBAL VALUE CHAINS: BUSINESS AS USUAL OR “A NEW NORMAL”?
50 OECD SCIENCE, TECHNOLOGY AND INDUSTRY POLICY PAPERS
14 Until now however, the evidence at the aggregate level on reshoring (including back- and nearshoring) is
rather limited (De Backer et al., 2016).
15 KBC has become crucial for the (international) competitiveness of companies as it allows to differentiate products, promotes innovation, establishes new business models, etc. Value creation in GVCs differs along the value chain with often a large share of the value created in up- and downstream stages directly linked to KBC (see e.g. the discussion on the smiley curve in the electronics industry).
16 The (empirical) literature on the link between IPR, foreign direct investment and international trade has not always produced equivocal results, although the positive effect of strong IPR (including enforcement) on international investment has been demonstrated in several papers.
17 The figure depicts the key ICTs which are enabling the digital transformation of industrial production. The technologies at the bottom enable those at the top, as indicated by the arrows. The technologies at the top which include (i) additive manufacturing, (ii) autonomous machines and systems, and (iii) human-machine integration, are the applications through which the main productivity effects in industry are likely to unfold.
18 See OECD (2016d) for a discussion on the impact of environmental policies on the location of activities within GVCs (in line with the so-called Pollution Haven Hypothesis). In addition, there is some evidence that the relative degree of internalisation of environmental effects is presently greater for domestic than international goods transport, hence encouraging the international parts of GVCs.
19 The growing discussion about ‘ecological footprints’ of products is another illustration.
20 Nevertheless, other research has shown that containerisation has been an important driver of economic globalisation (Bernhofer et al., 2013).
21 This does not mean that air freight is not important for the efficient functioning of GVCs. On the contrary, against compensating its high costs – which have been decreasing over time, the big advantage of air cargo is its speed. Baldwin (2016) argues that air cargo is a quick and certain fix in case of problems in international production networks. Air transports accounts for a significantly higher share in cargo value than volume.
22 For a detailed model description: OECD (2015c), METRO Version 1 Model Documentation.
23 For scenario 4 and the combined scenario, which include a shock of the production tax, the income tax adjusts to changes in government income, while government expenditure follows changes in final demand and the internal balance is constant.
24 One could argue that changing GVCs will affect countries’ current account balances and may result in (temporary) unemployment; these factors are however not taken into this analysis.
25 The original model and a detailed documentation are available at http://www.cgemod.org.uk/. Developed from the GLOBE model, the model is a direct descendant of an early US Department of Agriculture model (Robinson et al., 1990) and NAFTA (Robinson et al., 1993) and follows trade principles deriving from the 1-2-3 model (de Melo and Robinson, 1989; Devarajan et al., 1990).
26 In addition, uncertainties become larger at more disaggregated levels (country and industry), hence the need for interpreting the results carefully. Furthermore, in order for the METRO model to function in an adequate manner, a number of aggregations across industries and countries have been made (see Annex).

THE FUTURE OF GLOBAL VALUE CHAINS: BUSINESS AS USUAL OR “A NEW NORMAL”?
OECD SCIENCE, TECHNOLOGY AND INDUSTRY POLICY PAPERS 51
27 As several of these indicators are based on trade data, the analysis focuses more on the international part of
GVCs rather than on domestic stages (e.g. retail services, after sales, etc.).
28 Regions are defined as Asia, Europe, North America (United States, Canada and Mexico), Middle and South America, Rest of the World.
29 The North region is defined as Europe, United States, Canada, Japan, Korea, Russia, Australia, New Zealand, Turkey and Israel; other countries and regions belong to South.
30 Slight differences exist between the 2011 figures in Table 1 and those in the METRO base year (see following section), due to the different sources (e.g. OECD TiVA) used for calculating the historical evolution; differences are however minor.
31 In addition, as already mentioned above, the indicators capture structural characteristics which by definition change relatively less.
32 Sub-scenario 1 reflects only nominal changes in tariffs and trade facilitation; qualitative changes such as the evolution towards more regional and deeper (trade) agreements has not been included in this sub-scenario 1a.
33 The TFI reform is modelled as a reduction in non-tariff barriers, using the estimated AVEs, by partly using the well-known iceberg approach (Samuelson, 1954) and partly the newly developed ‘Willingness to Pay’ approach (Walmsley and Minor, 2016). For imports of intermediates; the AVEs for final demand are split in two with half of it accruing as iceberg cost. The ‘Willingness to Pay’ approach is employed for the other part of the AVE for final demand imports (Flaig and Sorescu, forthcoming).
34 United Nations (2015), “World Population Prospects: The 2015 Revision”
35 In particular, the MIST (Mexico, Indonesia, Nigeria and Turkey) and N-11 (‘Next 11’: Bangladesh, Egypt, Indonesia, Iran, Korea, Mexico, Nigeria, Pakistan, Philippines, Turkey and Viet Nam) countries – acronyms put forward by Goldman Sachs to designate the next and future economic giants.
36 In doing this, the input coefficients of Korean manufacturing have been applied as well as catching up to Korean productivity (assuming emerging economies are able to half their productivity gap with Korea).
37 The METRO-model does not allow for shocking population, hence growth projections on labour force have been used. Comparison between the UN projections on population and labour force show a strong correlation between both series across countries.
38 The Brookings Institute (2016), “Brooking Development, Aid and Governance Indicators: Raw Data”. Middle Class defined as the number of people living in households earning or spending between 10 USD and 100 USD per person per day (2005 PPP USD),
39 The average OECD consumption spending is calculated as the unweighted average of the different consumption patterns in OECD countries (source: METRO database). The 2030 consumption spending in non-OECD economies reflects the spending of the growing middle class (proxied by the OECD average spending pattern multiplied with the share of the middle class in 2030) and the spending of the rest of the population (proxied by countries’ original consumption spending multiplied by the share of the non-middle class).
40 Data on labour compensation and unit labour costs over 2000-2010 have been used for OECD countries (source: OECD Productivity database). For non-OECD countries, very limited information is available and estimates have been used.

THE FUTURE OF GLOBAL VALUE CHAINS: BUSINESS AS USUAL OR “A NEW NORMAL”?
52 OECD SCIENCE, TECHNOLOGY AND INDUSTRY POLICY PAPERS
41 Bitkom and Fraunhofer (2014), “Industrie 4.0 - Volkswirtschaftliches Potenzial für Deutschland”.
43 In addition to OECD industry data: Gandhi et al. (2016) “Which Industries Are the Most Digital (and Why)?; McKinsey Global Institute (2014) “Global Flows in a Digital Age”; Booz & Company (2011) “Measuring industry digitisation. Leaders and Laggards in the Digital Economy”. The measurement module in the OECD “Going Digital” project also plans to develop indicators on the ICT-intensity and usage of industries along different dimensions.
44 Roland Berger Strategy Consultants (2014) “ Industry 4.0 – The New Industrial Revolution. How Europe Will Succeed”; Roland Berger and Internet Economy Foundation (2016) “Going Digital: Seven Steps to the Future. Germany's Path to Lead European Digital Transformation”; McKinsey Global Institute (2016) “Digital Europe: Realizing the Continent’s Potential”; the Boston Consulting Group (2015) “The Robotics Revolution, The Next Great Leap in Manufacturing”.
45 The most digital industries are 4 manufacturing industries (chemical, machine, transport, electrical and electronical industries – Source: Bitkom and Fraunhofer) and 4 services industries (finance, media and telecommunications, trade and retail, transport and logistics – Source: see footnote 37).
46 Trade in intermediates grows less strongly than trade in final products though.
47 This scenario of rising transport costs can be interpreted in broader terms to evaluate the impact of other factors (“A new Normal”) discussed in previous sections. As an indication of higher costs for transporting products within GVCs, the results would also apply for the factors discussed under ‘hidden/extra costs of international fragmentation’, ‘balancing risk diversification and cost efficiency“ and “the green and sustainability imperative”. Also the set-up of scenario 4 would match if these factors would instead/complementary increase production costs.
48 That could be also one explanation why a number of structural characteristics of GVCs show a – surprisingly - high ‘resilience’ across the different scenarios. For example, the analysis lends not much support for a localisation of production at the regional level with the share of inter-regional trade further rising in most scenarios.
49 While each scenario provides insights in the individual impact of each factor on GVCs (“ceteris paribus” assumption), the combined scenario allows to assess the simultaneous impact of the different factors. Do factors reinforce or compensate each other? As such this scenario provides also a more comprehensive overview of the factors discussed in this paper.
50 Lao Tzu: “Those who have knowledge, don’t predict. Those who predict, don’t have the knowledge.”
51 As this would confound and bias the results.

THE FUTURE OF GLOBAL VALUE CHAINS: BUSINESS AS USUAL OR “A NEW NORMAL”?
OECD SCIENCE, TECHNOLOGY AND INDUSTRY POLICY PAPERS 53
REFERENCES
Anderson J. and E. van Wincoop (2004), “Trade Costs”, Journal of Economic Literature, XLII, pp. 691-751
Baldwin, R. (2016), “The Great Convergence: Information Technology and the New Globalisation”, Harvard University Press
Baldwin, R. and A.J. Venables, (2013), “Spiders and snakes: Offshoring and agglomeration in the global economy”, Journal of International Economics, 90(2): 245-254.
Bernhofen, D.M., Z. El-Sahli and R. Kneller (2013), “Estimating the Effects of the Container Revolution on International Trade”, Working paper (mimeo). http://www.uv.es/~inteco/jornadas/jornadas10/BEK_Nov25.pdf
Bitkom and Fraunhofer (2014), “Industrie 4.0 - Volkswirtschaftliches Potenzial für Deutschland”, Studie, https://www.bitkom.org/noindex/Publikationen/2014/Studien/Studie-Industrie-4-0-Volkswirtschaftliches-Potenzial-fuer-Deutschland/Studie-Industrie-40.pdf
Booz & Company (2011) “Measuring industry digitisation. Leaders and Laggards in the Digital Economy”, report. http://www.strategyand.pwc.com/media/file/Strategyand-Measuring-Industry-Digitization-Leaders-Laggards-Digital-Economy.pdf
Boulhol, H., A. de Serres and M. Molnar (2008), “The Contribution of Economic Geography to GDP per Capita”, OECD Journal: Economic Studies, No 9, pp. 1-37, OECD Publishing, http://dx.doi.org/10.1787/eco_studies-v2008-art9-en
Chevroulet, T. (2008), “Importance of Oil Price in Freight Transport Costs”, Discussion Paper No 2008-4, Joint Transport Research Centre
De Backer, K., I. Desnoyers-James and L. Moussiegt (2015), “Manufacturing or Services: That is not the Question”, OECD Science, Technology and Innovation Policy Paper No. 19, OECD Publishing, Paris http://dx.doi.org/10.1787/5js64ks09dmn-en
De Backer, K. , C. Menon, I. Desnoyers-James and L. Moussiegt (2016), “Reshoring : Myth of Reality?”, OECD Science, Technology and Innovation Policy Paper, No 27, OECD Publishing, Paris http://dx.doi.org/10.1787/5jm56frbm38s-en
European Environment Agency (2015), “The European Environment: State and Outlook 2015 – Assessment of Global Megatrends”, European Environment Agency, Copenhagen.
Evenett, S. and J. Fritz (2015), “The Tide Turns? Falling World Trade and the G20”, VoxEU column 15 November 2015, www.voxeu.org
Forbes (2015) ‘Roundup of 3D printing forecasts and estimates’, 31 March. http://www.forbes.com/sites/louiscolumbus/2015/03/31/2015-roundup-of-3d-printing-market-forecasts-and-estimates

THE FUTURE OF GLOBAL VALUE CHAINS: BUSINESS AS USUAL OR “A NEW NORMAL”?
54 OECD SCIENCE, TECHNOLOGY AND INDUSTRY POLICY PAPERS
Gandhi et al. (2016) “Which Industries Are the Most Digital (and Why)?”, Harvard Business Review, April 2016
Gartner (2015) ‘Gartner says worldwide shipments of 3D printers to reach more than 490,000 in 2016’ http://www.gartner.com/newsroom/id/3139118
Ghani, E. and S. D. O’Connell (2014), “Can Service Be a Growth Escalator in Low-Income Countries?”, Policy Research Paper No 6971, World Bank group.
Global Trade Alert (2015), “The Tide Turns? Trade, Protectionism, and Slowing Global Growth”, The 18th Global Trade Alert Report, CEPR Press
Greenville, J., K. Kawasaki and R. Beuajeu (forthcoming), Estimating GVC Participation in the Agriculture and Foods Sectors”, OECD Trade and Agriculture Policy Paper, OECD Publishing, Paris.
Harms, P., O. Lorz and D. Urban (2012), “Offshoring along the production chain”, Canadian Journal of Economics, 45: 93–106.
HSBC (2015), “Trade Winds: Shaping the Future of International Business”, https://globalconnections.hsbc.com/grid/uploads/trade_wind_report.pdf
HSBC (2012), “Consumer in 2050, The Rise of the EM Middle Class”, HSBC Global Research, https://www.hsbc.com.vn/1/PA_ES_Content_Mgmt/content/vietnam/abouthsbc/newsroom/attached_files/HSBC_report_Consumer_in_2050_EN.pdf
Hummels, D. (2007), “Transportation Costs and International Trade in the Second Era of Globalization”, Journal of Economic Perspectives, Vol. 21, No 3, pp. 131-154
IMF (2016), “Global Trade: What’s Behind the Global Slowdown”, Chapter 2 in World Economic Outlook, Washington,
ITF (2016a), “The Carbon Footprint of Global Trade: Tackling Emissions from International Freight Transport”, OECD Publishing, Paris
ITF (2016b), “ITF Transport Outlook”, OECD Publishing, Paris.
Kharas, H. (2010), “The Emerging Middle Class in Developing Countries”, OECD Development Centre Working Paper, No.285
Kee, H.L. and H. Tang (2016), “Domestic Value Added in Exports: Theory and Firm Evidence from China,” American Economic Review, 106(6): 1402-36.
Kommerskollegium (2016), “Trade Regulation in a 3D Printed World – a Primer”, Sweden
Laplume, A.O., B. Petersen and J.M. Pearce (2016). ‘Global value chains from a 3D printing perspective’, Journal of International Business Studies, 1-15.
Lewis, L. and R. Monarch (2016), “Cause of the Global Trade Slowdown”, International Finance Discussion Paper Note November 2016, Board of Governors of the Federal reserve System.
THE FUTURE OF GLOBAL VALUE CHAINS: BUSINESS AS USUAL OR “A NEW NORMAL”?
OECD SCIENCE, TECHNOLOGY AND INDUSTRY POLICY PAPERS 55
Markoff, J. (2012), “Skilled Work, Without the Worker”, The iEconomy, Part 6: Artificial Competence, New York Times, 18 August.
McKinsey Global Institute (2014) ‘3D Printing takes shape’. http://www.mckinsey.com/insights/manufacturing/3-d_printing_takes_shape
McKinsey Global Institute (2014) “Global Flows in a Digital Age”, http://www.mckinsey.com/business-functions/strategy-and-corporate-finance/our-insights/global-flows-in-a-digital-age
McKinsey Global Institute (2016) “Digital Europe: Realizing the Continent’s Potential”, http://www.mckinsey.com/business-functions/digital-mckinsey/our-insights/digital-europe-realizing-the-continents-potential
Miroudot, S. (2017), “Services in Global Value Chains: From Inputs to Value-Creating Activities”, OECD Trade Policy Paper (forthcoming), OECD Publishing
Miroudot, S. and H.Nordström (2015), “Made in the World?”, EUI Working Paper RSCAS 2015/60, European University Institute.
Moïse, E. and S. Sorescu (2015), “Contribution of Trade Facilitation Measures to the Operation of Supply Chains”, OECD Trade Policy Paper, No. 181, OECD Publishing, Paris.
OECD (2017a), “Enabling The Next Production Revolution”, OECD publishing, Paris, http://dx.doi.org/10.1787/9789264271036-en
OECD (2017b), “Going Digital3”, paper prepared for the OECD Ministerial Council Meeting
OECD (2016a), “Cardiac Arrest or Dizzy Spell: Why is World Trade so Weak?”, OECD Economic Policy Paper No 18, OECD Publishing, Paris, http://dx.doi.org/10.1787/9789264229358-en
OECD (2016b), “OECD Science, Technology and Innovation Outlook”, OECD Publishing, Paris, http://dx.doi.org/10.1787/sti_in_outlook-2016-en
OECD (2016c), “Trade in Counterfeit and Pirated Goods: Mapping the Economic Impact”, OECD Publishing, Paris. http://dx.doi.org/10.1787/9789264193307-en
OECD (2016d), “Do environmental policies affect global value chains? A new perspective on the pollution haven hypothesis, OECD Economics Department Working Papers, OECD Publishing, Paris. http://dx.doi.org/10.1787/5jm2hh7nf3wd-en
OECD (2015a), “OECD Science, Technology and Industry Scoreboard 2015: Innovation for Growth and Society”, OECD Publishing, Paris http://dx.doi.org/10.1787/sti_scoreboard-2015-en
OECD (2015b), “Data-Driven Innovation for Growth and Well-Being”, OECD Publishing, Paris. http://dx.doi.org/10.1787/9789264229358-en
OECD (2015c), METRO Version 1 Model Documentation, OECD Publishing, Paris, http://www.oecd.org/officialdocuments/publicdisplaydocumentpdf/?cote=TAD/TC/WP(2014)24/FINAL&docLanguage=En
OECD (2014), “Services Trade Restrictiveness Index: Policy Brief”, OECD Publishing, http://www.oecd.org/tad/services-trade/sector-notes-services-trade-restrictiveness-index.htm

THE FUTURE OF GLOBAL VALUE CHAINS: BUSINESS AS USUAL OR “A NEW NORMAL”?
56 OECD SCIENCE, TECHNOLOGY AND INDUSTRY POLICY PAPERS
OECD (2013a), “Interconnected Economies. Benefitting from Global Value Chains”, OECD Publishing, Paris. http://dx.doi.org/10.1787/9789264189560-en
OECD (2013b), “Supporting Investment in Knowledge Capital, Growth and Innovation”, OECD Publishing, Paris. http://dx.doi.org/10.1787/9789264193307-en
OECD-WTO-UNCTAD (2016) , “The 16th Report on G20 Trade and Investment Measures”, report for the G20, OECD Publishing, http://www.oecd.org/daf/inv/investment-policy/g20.htm
Porter, M.E. and J.W Rivkin (2012), “Choosing the United States”, Harvard Business Review, March 2012.
PwC (2013), “Global Wage Projections”, http://www.pwc.fr/fr/publications/ressources-humaines/global-wage-projections-to-2030.html
Rehnberg, M. and S. Ponte (2016), 3D Printing and Global Value Chains: How a technology May Restructure Global Production, National University of Singapore, GPN Working Paper Series GPN 2016-010
Rodrik, D. (2015), “Premature Deindustrialization,” NBER Working Paper No. 20935, February 2015.
Roland Berger Strategy Consultants (2014), “Industry 4.0 – The New Industrial Revolution. How Europe Will Succeed”, report, https://www.rolandberger.com/publications/publication_pdf/roland_berger_tab_industry_4_0_20140403.pdf
Roland Berger and Internet Economy Foundation (2016) “Going Digital: Seven Steps to the Future. Germany's Path to Lead European Digital Transformation”, report, https://www.rolandberger.com/publications/publication_pdf/roland_berger_ief_deutschland_digital_e_20160428.pdf
Samuelson, P. A. (1954), “The Transfer Problem and Transport Costs, II: Analysis of Effects of Trade Impediments”, The Economic Journal, 64(254): 264-289.
Sinclair-Desgagné, B. (2013), “Greening Global Value Chains: Implementation Challenges”, OECD Green Growth Papers, No 2013/04, OECD Publishing, Paris
Standard Chartered (2015), “Global Supply Chains: New directions, Special Report”, https://www.sc.com/en/news-and-media/news/global/2015-05-29-global-supply-chains-new-directions.html
The Boston Consulting Group (2015), “The Robotics Revolution, The Next Great Leap in Manufacturing”, https://www.bcgperspectives.com/content/articles/lean-manufacturing-innovation-robotics-revolution-next-great-leap-manufacturing/
The Boston Consulting Group (2014), “The Shifting Economics of Global Manufacturing, How Cost Competitiveness Is Changing Worldwide”. https://www.bcgperspectives.com/content/articles/lean_manufacturing_globalization_shifting_economics_global_manufacturing/
The Brookings Institute (2016), “Brooking Development, Aid and Governance Indicators: Raw Data”.

THE FUTURE OF GLOBAL VALUE CHAINS: BUSINESS AS USUAL OR “A NEW NORMAL”?
OECD SCIENCE, TECHNOLOGY AND INDUSTRY POLICY PAPERS 57
Timmer, M.P. et al. (2016), “An Anatomy of the Global Trade Slowdown based on the WIOD 2016 Release”, GGDC Research Memorandum No 162, University of Groningen
Tomb, I. and K. Trivedi (2017), “’Peak trade’ is Premature”, VoxEU Column 6 January 2017, www.voxeu.org
TNO: The Impact of 3D Printing on Supply Chain Management, report, http://3din.nl/wp-content/uploads/2014/02/TNO-Whitepaper-3-D-Printing-and-Supply-Chain-Management-April-2014-web.pdf
United Nations (2015), “World Population Prospects: The 2015 Revision”, New York
Walmsley, T. and P. Minor (2016), “Willingness to Pay in CGE Models: Estimating the benefits of improved customs efficiencies within the WTO Trade Facilitation Agreement”, ImpactEcon Working Paper Rev2.
Wohler 2015 ‘3D Printing and Additive Manufacturing State of the Industry: Annual Worldwide Progress Report’, Fort Collines, CO: Wohler Associates.
World Economic Forum (2012), “The Future of Manufacturing, Opportunities To Drive Economic Growth”, Geneva.

THE FUTURE OF GLOBAL VALUE CHAINS: BUSINESS AS USUAL OR “A NEW NORMAL”?
58 OECD SCIENCE, TECHNOLOGY AND INDUSTRY POLICY PAPERS
ANNEX: AGGREGATION OF REGIONS, SECTORS AND FACTORS
Regions Factors Sectors
N-Eur Northern Europe Land Land agri Agriculture
BENELUX BENELUX tech_aspros Technical and Assistant Professionals
extr Natural resources
FRA France clerks Clerks food Food
UK-IRL United Kingdom and Ireland
service_shop Service and shop assistants texwl Textiles Wearing Apparel and Leather
DEU Germany off_mgr_pros Office managers and Professionals
lum Wood products
S-Eur Southern Europe ag_othlowsk Agricultural and other low skilled workers
ppp Paper products and publishing
ME-Eur Middle and Eastern Europe
Capital Capital p_c Petroleum and coal products
USA United States NatRes Natural Resources crp chemical rubber plastic
CAN Canada nmm Mineral products nec
MEX Mexico metal Metals
BRA Brazil fmp Metal products
MS-Am Middle and South America
mvh Motor vehicles and parts
ASEAN ASEAN otn Transport equipment nec
JAP Japan elme Electronic equipment and machinery
KOR Korea omf Other manufacturing
REAsia Rest of east Asia util Utilities
AUS-NZ Australia and New Zealand
cns Construction
RUS Russia trd Trade
ISR-TUR Israel and Turkey otp Transport
SAU Saudi Arabia cmn Communication
IND India ofii Financial services
TUN-ZAF Tunisia and South Africa
obsd Business services and dwellings
ROW Rest of the World icts ICT services
GLO Globe rosg Recreation government and other services