THE FUNCTIONING · 2019-05-01 · Palaeontology Fossils Physiology Functioning of living things...
13
UNIT 01 THE FUNCTIONING HUMAN BODY Shutterstock/Sebastian Kaulitzki
Transcript of THE FUNCTIONING · 2019-05-01 · Palaeontology Fossils Physiology Functioning of living things...
UN
IT
01 THE FUNCTIONING HUMAN BODY
Shut
ters
tock
/Seb
astia
n K
aulit
zki

CHAPTER
01UNIT 1 CONTENT
HUMAN BIOLOGICAL SCIENCE
SCIENCE INQUIRY SKILLS❯❯ identify, research and construct questions for investigation;
propose hypotheses; and predict possible outcomes❯❯ design investigations, including the procedure(s) to be
followed, the materials required, and the type and amount of primary and/or secondary data to be collected; conduct risk assessments; and consider research ethics, including animal ethics
❯❯ conduct investigations, including monitoring body functions; use microscopy techniques; and perform real or virtual dissection, safely, competently and methodically for the collection of valid and reliable data
❯❯ represent data in meaningful and useful ways; organise and analyse data to identify trends, patterns and relationships; qualitatively describe sources of measurement error, and uncertainty and limitations in data; and select, synthesise and use evidence to make and justify conclusions
❯❯ interpret a range of scientific and media texts, and evaluate processes, claims and conclusions by considering the quality of available evidence; and use reasoning to construct scientific arguments
❯❯ select, construct and use appropriate representations, including labelled diagrams and images of various cells, tissues and organ systems, to communicate conceptual understanding, solve problems and make predictions
❯❯ communicate to specific audiences and for specific purposes using appropriate language, nomenclature, genres and modes, including scientific reports
Shut
ters
tock
/Oliv
er S
ved
Year
11
Sylla
bus,
Hum
an B
iolo
gy, ©
Sch
ool C
urri
culu
m a
nd S
tand
ards
Aut
hori
ty, 2
014,
Gov
ernm
ent o
f Wes
tern
Aus
tral
ia

ISBN 9780170351126 | CHAPTER 1 | HUMAN BIOLOGICAL SCIENCE 3
What is human biology?All the people shown in the photographs below are human biologists. Human biological science is the scientific study of humans, both as individuals and as populations, and the study of the interaction between humans and their environment. Although a lot is now known and understood about humans, much still remains to be discovered. A glance through almost any newspaper will show that discoveries are continually being made about how our bodies work, about human behaviour and about where we came from. Despite the progress in knowledge of our species, new problems constantly arise.
Figure 1.1 Which of these people is a human biologist?
Shut
ters
tock
/aas
tock
Alam
y/©
Suz
anne
Lon
g
Javi
er T
rueb
a/M
SF/S
cien
ce P
hoto
Lib
rary
Shut
ters
tock
/Tyl
er O
lson

Human biology
SociologyGenetics
CytologyAnthropology
Prehistory
Biochemistry
Nutrition
Primatology
AnatomyPsychology
Palaeontology
Embryology
PhysiologyMolecularbiology
Archaeology
UNIT 1 | HUMAN PERSPECTIVES UNITS 1 & 2 | ISBN 97801703511264
What is science?There are two aspects to science. First, science is a process of inquiry – a way of finding out about human beings, and their living and non-living surroundings. Second, science is a body of knowledge – knowledge gained by systematic observation and testing of ideas.
Because of the nature of science as a process of investigation, scientific knowledge is not fixed and unchanging. Knowledge is continually increasing as new discoveries are made, and existing knowledge often has to be modified, or even discarded, as new evidence accumulates.
Human biological scienceHuman biology is a body of knowledge relating to humans, and it is concerned with finding out more about the human species. In this book, some of the knowledge that scientists have gained about humans is presented, sometimes with a description of how that knowledge was gained. It is important to remember when reading this, or any science textbook, that the information was originally gained by scientific investigation, and that the ideas presented are subject to change as research reveals more about the topics covered by this text.
Because human biology is a science, our knowledge of humans builds on the discoveries made by each generation of scientists. Discoveries made today become the building blocks for the knowledge of tomorrow. Collective knowledge of the human organism is now so great that human biologists must specialise in a particular field of study relating to humans, such as anatomy, physiology, nutrition or biochemistry. Some of the important fields of study that contribute to an understanding of our species are shown in Figure 1.2 and Table 1.1. Aspects of many of these fields will be discussed in this book.
The nature of scienceThis website provides more
information about the nature of science and the specialised
fields of study in science.
Figure 1.2 Some of the fields of study that contribute to our understanding of the biology of humans

ISBN 9780170351126 | CHAPTER 1 | HUMAN BIOLOGICAL SCIENCE 5
Table 1.1 Some important fields of study that contribute to our understanding of the biology of humans
Field Area of study
Anatomy Structure of the body
AnthropologyRelationships between the biological, cultural, geographical and historical aspects of humans (some people use the word ‘anthropology’ to mean the same as human biology, although human biology covers a wider field)
ArchaeologyMaterial evidence of the past such as tools, weapons and art rather than written records
Biochemistry Chemistry of living things
Cytology Cells
Demography Statistical study of populations
Embryology Development from fertilisation to birth
Genetics How characteristics are passed from generation to generation
Molecular biology Macromolecules of the cell
Nutrition Food requirements of humans
Palaeontology Fossils
Physiology Functioning of living things
Prehistory The past, before the time of written records
PrimatologyNon-human members of the order Primates – apes, monkeys, lemurs, lorises and tarsiers
Psychology Human behaviour
Sociology Nature of human society
How do scientists investigate?How are discoveries made? What procedures does a scientist use to gather new information?
There are no hard and fast rules, and no particular sequence of steps that must be followed. Different scientists investigate in different ways but, in every case, scientific investigation begins with a problem – a question that needs to be answered. Curiosity is a human characteristic. We like to know how and why things happen. The scientist defines a problem and then tries to find a solution to that problem. Some of the ways that scientists investigate are described below.
Literature reviewThe search for a solution to a problem will almost certainly involve a review of books, scientific journals and the Internet to see what information has already been collected by others. In this way, science builds on past discoveries and the scientist does not duplicate work already done by other scientists.
ObservationSome problems can be solved by observation. Information is gathered using the senses or instruments that enhance the senses, such as a microscope or stethoscope. For example, scientists who study monkeys and apes, close relatives of humans, will spend much of their time observing and noting what the animals do and how they behave towards one another. Microbiologists
UNIT 1 | HUMAN PERSPECTIVES UNITS 1 & 2 | ISBN 97801703511266
observe the structure of bacteria and viruses using electron microscopes. Archaeologists excavate ancient human living-sites and observe the type and distribution of shelters, tools, weapons, animal bones and charcoal from fires. Observation in the field is then followed by detailed laboratory examination of the material collected.
Patient observation produces data that must then be carefully analysed. Scientists look for patterns or trends in the data and try to draw meaningful conclusions. Often the observations will raise many new questions to be answered and problems to be solved.
ClassifyingClassification, placing things in groups based on the similarity of their characteristics, is a basic part of science. For example, astronomers classify galaxies by their shape and planets by their composition; geologists classify rocks according to the way they were formed and the minerals they contain; chemists classify substances by their properties; and biologists use structural features as a basis for classifying living things.
Some biologists specialise in the classification and naming of organisms, but all use classification from time to time. The classification of animals is based mainly on structural characteristics. It highlights the similarities and differences between groups and makes communication easier. For example, if we say that a particular animal is classified as a mammal we do not have to be given a description of its characteristics. We immediately know that it has hair, is warm-blooded and suckles its young on milk. We can then think of many other animals with those same characteristics and to which it is related. Classification, therefore, serves to facilitate scientific study.
Human biologists are concerned with the classification of the Primates, the order of mammals to which humans, apes, monkeys and some other animals belong. Although based on structural features, there is sometimes disagreement about the relative importance of certain structures. Even today, debate is continuing about how groups within the order Primates should be classified. Now that it is possible to compare the DNA of different species, biologists can be more certain about the relationships between groups. Extinct animals that are known only through fossils may be very difficult to classify and may provoke much controversy among experts.
ExperimentationMany scientists conduct experiments. They will propose a hypothesis, a possible explanation or solution to a problem, and then design experiments to test the hypothesis. An experiment must be designed so that the results clearly support or disprove the hypothesis being tested. To achieve this only one factor, or variable, is tested at a time. A control, or comparison, experiment is done in which the only difference is in the one variable being tested. If a scientist was testing the hypothesis that bacteria are killed by household bleach, two groups of bacterial cultures would be needed: experimental cultures and control cultures. The experimental cultures would be exposed to household bleach, whereas the control cultures would be exposed to distilled water. All other variables, such as the nature of the culture medium, the size of the culture containers, the type of bacteria, the temperature at which the cultures were kept, the length of time for which the cultures were observed and the volume of liquid added to each culture (bleach or distilled water), would have to be the same for both groups. These are known as controlled variables. If, at the end of the experiment, the bacteria in the experimental cultures were dead, whereas those in the control cultures were living, one could confidently say that the difference between the two sets of bacteria was due to the presence or absence of household bleach. This interpretation could only be made if just one variable was allowed to differ between the two groups of bacterial cultures.
ISBN 9780170351126 | CHAPTER 1 | HUMAN BIOLOGICAL SCIENCE 7
How do scientists avoid bias and error?Objectivity is a very important quality for a scientist. This means that scientists should not allow their own thoughts and feelings to influence their recording or interpretation of observations. They should not have preconceived ideas about the outcome of an investigation and should not plan and conduct an investigation to achieve a particular result. For example, Charles Darwin said:
I have steadily endeavoured to keep my mind free so to give up any hypothesis, however much beloved (and I cannot resist forming one on every subject), as soon as facts are shown to be opposed to it.
Source: Life and Letters of Charles Darwin, New York: D. Appleton, 1887
Scientists are ordinary people who are influenced by the culture in which they have been brought up, the friends and associates they work with, their own beliefs and values and a host of other factors. They need to be aware of the possibility of personal bias and make sure that it does not affect their conduct of an investigation or their interpretation of the results.
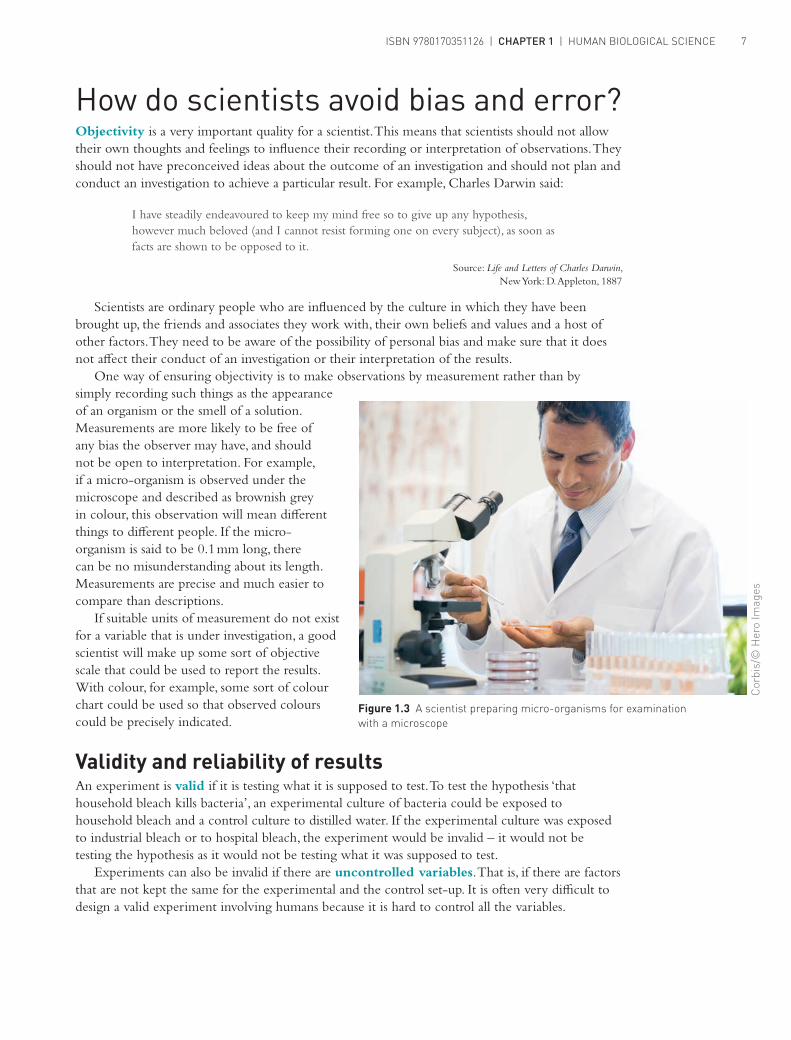
One way of ensuring objectivity is to make observations by measurement rather than by simply recording such things as the appearance of an organism or the smell of a solution. Measurements are more likely to be free of any bias the observer may have, and should not be open to interpretation. For example, if a micro-organism is observed under the microscope and described as brownish grey in colour, this observation will mean different things to different people. If the micro-organism is said to be 0.1 mm long, there can be no misunderstanding about its length. Measurements are precise and much easier to compare than descriptions.
If suitable units of measurement do not exist for a variable that is under investigation, a good scientist will make up some sort of objective scale that could be used to report the results. With colour, for example, some sort of colour chart could be used so that observed colours could be precisely indicated.
Validity and reliability of resultsAn experiment is valid if it is testing what it is supposed to test. To test the hypothesis ‘that household bleach kills bacteria’, an experimental culture of bacteria could be exposed to household bleach and a control culture to distilled water. If the experimental culture was exposed to industrial bleach or to hospital bleach, the experiment would be invalid – it would not be testing the hypothesis as it would not be testing what it was supposed to test.
Experiments can also be invalid if there are uncontrolled variables. That is, if there are factors that are not kept the same for the experimental and the control set-up. It is often very difficult to design a valid experiment involving humans because it is hard to control all the variables.
Figure 1.3 A scientist preparing micro-organisms for examination with a microscope
Cor
bis/
© H
ero
Imag
es

UNIT 1 | HUMAN PERSPECTIVES UNITS 1 & 2 | ISBN 97801703511268
Reliability is the extent to which an experiment gives the same result each time it is performed. The measuring instruments used in the experiment must also be reliable – they must give the same measurement each time they are used in the same way. For example, you may have a set of bathroom scales that give three different weights when you step on them three times. Those scales are unreliable and, if used in an experiment, would make the results of the experiment unreliable.
To make sure that the results of an experiment are reliable, an experiment is always repeated. Such repetition may mean doing the same experiment many times, or it may mean performing the experiment on a large number of subjects at the same time. Repetition ensures that, when the results are averaged, the effect of any chance factors that may have influenced the results will be minimised. It also ensures that the results are consistent. If the results are different every time the experiment is performed, they are worthless.
Scientists publish not only the results of an investigation but also a detailed description of how the investigation was carried out. Other scientists can then repeat the investigation to see whether they get the same results. This verification process is an important means of making sure that there have been no errors in the design of the investigation or collection of data and no bias in the interpretation of results.
Making sense of dataData are the observations and measurements that are collected during a scientific investigation. Understanding the data and interpreting what they mean are very important parts of any investigation.
As mentioned earlier, collecting numerical data helps to ensure objectivity. Numerical data are also much easier to analyse than data in the form of words or descriptions. Once scientists have collected their data they must present it in a meaningful form. This is usually done as tables or graphs, or both. A table is an organised and concise way of presenting data. Observations may be presented in a table and they are particularly useful for showing numerical data. Graphs make it easier to see trends in the data and allow predictions to be made. Tables and graphs will be covered in more detail in Chapter 2.
Measuring the centreIn science, a description of a set of numbers almost always includes a measure of its centre, or its average. Averages are a very common and simple way of handling sets of numerical data. The average that is most often calculated is the arithmetic mean, often just called the mean. To calculate the mean of a group of measurements, you add up all the measurements in the group and divide by the total number of measurements.
Sometimes in a set of measurements there are values that are well beyond the range of the rest of the measurements. Such values are called outliers. Means are affected by outliers, as a very high or very low value would make the mean higher or lower than it would be otherwise. Outliers may be the result of mistakes in measurement, failure of equipment or other errors. If the outliers are clearly the result of an error, they may be excluded when the mean is calculated.
Ratios and ratesA ratio is a numerical statement of how one variable relates to another. That is, it is a comparison of two numbers. Ratios are written as two numbers separated by a colon. For example, on a standard television screen, the ratio of width to height is 4:3; thus, if the width is 40 cm the height would be 30 cm, if the width is 60 cm the height would be 45 cm and so on. Wide-screen televisions have a ratio of 16:9.
ISBN 9780170351126 | CHAPTER 1 | HUMAN BIOLOGICAL SCIENCE 9
A rate is a special kind of ratio that shows how long it takes to do something. For example, if a person walks 4 km in one hour, they have walked at the rate of 4 km per hour. This is written as 4 km/h. The rate at which something occurs is much more meaningful than a simple count of how often it occurs. If you were investigating the effect of exercise on the heart, counting a person’s heartbeats would be meaningless unless we knew how many beats there were in a given time. That is, we would need to know the heart rate in beats per minute.
PercentagesPer cent means per hundred. If 48% of the students in your school are males, that means that 48 in every 100 students are males. Another way of looking at it would be to say that for every 48 males there would be 52 females.
Percentages are used to express how large one variable is in relation to another. An example is the amount of fat in a food. If a breakfast cereal were labelled as containing 1.5% fat, that would mean that 100 g of the cereal contains 1.5 g of fat.
Percentage changeCalculating a percentage increase or percentage decrease is often a good way of helping people to understand changes in a variable over time. For example, if a person weighing 100 kg lost 10 kg after dieting for six months, we could say that the person had lost 10% of their body weight as a result of the diet. If another person weighing 120 kg lost 13 kg after six months on the same diet, the percentage decrease would be 10.8%. Percentage change is often helpful in making such comparisons.
To calculate percentage change:❯❯ subtract the old value (120 kg) from the new value (107 kg)❯❯ then divide that figure (13) by the old value (120 kg)❯❯ multiply the result by 100 and add a per cent symbol (%) to it.
The result (10.8%) is the percentage change.
FrequenciesFrequency is the number of times an event occurs. For example, some students conducted a survey to find out how many times the students in a Year 8 class had taken a pain-killing tablet during the week before the survey. A table of the data they collected would be called a frequency distribution or frequency table. A frequency table summarises the data by showing how often the variable in question occurs. Frequencies can also be presented graphically as a histogram. Tables and graphs will be discussed in the next chapter.
How do scientists report their findings?ReportsScientists usually publish reports of their investigations, often in a scientific journal. Nature, Scientific American and the Medical Journal of Australia are journals that you may be familiar with, but there are numerous journals covering every area of science.
Most written reports are presented in a particular writing style. The presentation is impersonal; for example, instead of saying ‘I measured the subject’s blood pressure’ or ‘Fred measured the subject’s blood pressure’, the writer of a scientific report would say ‘The subject’s blood pressure was measured’. Notice also that it is written in the past tense – another characteristic of report writing style.

Title and name of author or authors
Acknowledgements – persons who have helpedwith the investigation or organisations that haveprovided funds for the research
Introduction stating the nature ofthe problem and hypothesis tested
Materials and equipmentlist of apparatus used
Procedure describing how theinvestigation was carried out
Results often include tables,graphs, diagrams or photographs
Discussion includes comments about theresults and how they relate to the hypothesis
Conclusion states whether the hypothesis issupported or disproved and summariseswhat can be concluded
Further research suggests areas forfurther investigation
References – books, articles, websites or otherresources that have been referred to in the report
UNIT 1 | HUMAN PERSPECTIVES UNITS 1 & 2 | ISBN 978017035112610
Reports follow a fairly standard format, similar to that shown in Figure 1.4.Conferences are another way in which scientists can make their findings known to others
working in the same field. Researchers can give a talk to their colleagues (known as delivering a paper) outlining their investigation, the data collected and their conclusions. At large conferences, some research groups may be asked to display a poster that summarises their research. Papers presented at conferences are usually published in a book known as the proceedings of the conference.
Peer reviewPapers prepared for publication or presentation at conferences are usually subject to peer review. This is a process in which articles submitted to a journal or conference are sent to several experts in the particular field of study prior to publication or presentation at the conference. The reviewers’ feedback may require that the author change the article in order to have it published in the journal or included in the conference.
Peer review is not just confined to articles or conference presentations. It is used at all stages in the investigation process and is an important means of avoiding bias and error.
Scientific terminologyEach area of science has a huge number of scientific terms that have very precise meanings. Human biological science is no exception. Although confusing for the non-scientist, the use of scientific terminology is very important because a precise meaning can be conveyed without any chance of ambiguity or misunderstanding. The language of science is expanding all the time because new discoveries often require new words to describe them.
In your study of human biological science you will have to learn the meaning of, and use, a great many terms that are currently unfamiliar. Use of appropriate terminology is an important part of communication in science. Where new terms are used in this book they are printed in bold blue type and their meaning is explained. They are also defined in the glossary. Scientific dictionaries or the Internet can also be useful in finding out the meanings of scientific terms and how to use them in the correct context.
Figure 1.4 Typical format of a scientific report

ISBN 9780170351126 | CHAPTER 1 | HUMAN BIOLOGICAL SCIENCE 11
Science inquiry
ACTIVITY 1.1 Is this how pollen causes hay fever?The following is part of an article published in The West Australian newspaper on 7 September 2005. Read the extract carefully and then answer the questions below.
For years scientists were puzzled at how a grain of pollen that was too big to get past the defences of the nose and throat and into the lungs could trigger breathing problems from allergy and asthma.
Murdoch University environmental scientist, Frank Murray, said it was known that only airborne objects with a diameter of 10 microns or smaller (one micron is one-thousandth of a millimetre) could pass through into these vital organs, yet grass pollens measured up at 20 to 30 microns.
But with the aid of the magnification of a powerful microscope, they have recently discovered that grass pollen swells and bursts when in contact with water, splitting like a damaged can of baked beans.
‘We saw a big particle but with smaller, little granules running out of it,’ Professor Murray said. He now believes the same reaction occurs when it rains on grass pollen or if the pollen hits a moist membrane in the body such as the nose, eyes or throat.
‘This is only one possible mechanism. But if they break up to particles only one micron in diameter, then it is easy to see how they get into the lungs.’
Professor Murray said this could partly explain why some people complained of hay fever following rainfall, though rain was also known to trigger the mass release of fungal spores to which some people were highly allergic.
‘A lot of people find when there are sunny, warm days and then a shower, the next day they feel crook,’ he said.
1 How could the investigation reported in the article be used to help answer the question ‘What is science?’?
2 What sorts of things would you need to know if you wished to repeat Professor Murray’s observations in order to verify his results?
3 Professor Murray was involved in both observation – looking at pollen grains under a microscope – and experimentation – checking what happened when water was added to the pollen. In testing pollen to see what happens when water is added, what control would be needed if the results were to be valid?
4 Can you think of any practical applications for Professor Murray’s discovery?5 The results of research often raise new questions to be answered. Suggest two problems that
now need to be solved as a result of Professor Murray’s research.6 Propose a hypothesis based on one of the questions you suggested in your answer to Question 5.7 The journalist has written an article describing Professor Murray’s results for the general
public. What additional information should be included in a report intended for other scientists working on the links between pollen grains and asthma?

UNIT 1 | HUMAN PERSPECTIVES UNITS 1 & 2 | ISBN 978017035112612
Design an experiment to test the claims that are made for Hairnu. In your design make sure you cover all the following points. ❯ State the hypothesis that you are testing. ❯ What will be your independent variable? ❯ What will be your dependent variable? ❯ What variables will you need to control – that is, keep the same for all trials? ❯ How will you provide a control (comparison) so that you will be able to see whether Hairnu does
what it is claimed to do? ❯ How will you measure your results? ❯ How many people will you need to test to get a reliable result? ❯ Draw a table to show how you would present your data. ❯ What results would support your hypothesis? What results would disprove your hypothesis?
ACTIVITY 1.2 HairnuHairnu is a product that claims to stimulate the growth of hair. Figure 1.5 shows an advertisement for Hairnu.
Figure 1.5 Advertisement for Hairnu

ISBN 9780170351126 | CHAPTER 1 | HUMAN BIOLOGICAL SCIENCE 13
Review questions 1 a What is science?
b Why is human biology a science?c Why is classification an important part of science?
2 a What is a hypothesis?b Why do scientists make hypotheses?
3 What is a literature review? When would you carry out a literature review? 4 Explain why an experiment must have a control. 5 a Explain the difference between the validity and the reliability of the results of an experiment.
b How would you make sure that the results of an investigation are valid?c How would you make sure that the results of an experiment are reliable?
6 Using examples, explain the difference between a ratio and a rate. 7 Why is repetition important in scientific investigation? 8 Why are the results of experiments expressed as measurements whenever possible? 9 Why are reports of scientific investigations published?10 What is a peer review and what is its purpose?11 Why do scientists use such a lot of technical terms?
Apply your knowledge1 Why are you studying human biological science? What do you hope to gain from your study
of the course?2 Is history a science? Is music a science? Give reasons for your answers.3 The word ‘malaria’ comes from two Italian words: male meaning ‘bad’, and aria meaning ‘air’.
The ancient Greeks and Romans believed that malaria was caused by ‘bad air’ associated with swamps and marshes. We now know that this is not the case.a Find out how the ancient Greeks and Romans tried to stop the spread of malaria.b Use resources to find out what causes malaria.c What were some of the experiments that were done to determine the cause of malaria?d Which scientists were instrumental in discovering the cause of malaria? How was their
discovery communicated to others?4 Many words not only have a meaning that is used in everyday speech and writing, but also have
a scientific meaning that may be quite different from normal usage. The following words are examples. Find out the correct meaning of each of these words in human biology.a Abductionb Systemc Absorption
d Origine Axis
5 Two students measured the resting pulse rates of the members of a Year 11 class. A list of the resting pulse rates of 20 class members is shown below.
79 87 81 75 69 73 91 82 23 88
76 75 71 84 83 86 79 82 31 72
a Calculate the (arithmetic) mean pulse rate for the class.b The students identified two pulse rates that they considered to be outliers resulting from
errors in counting. Calculate the mean pulse rate when the outliers are excluded. What is the effect of excluding the outliers?
c What percentage of the students had a pulse rate between 80 and 89?d The students concluded that the average pulse they calculated was ‘the average pulse rate
for Year 11 students’. Was this a valid conclusion? Explain the reasons for your answer.6 A baby weighed 3400 g at birth. After three months, the baby’s weight was 4600 g. Calculate the
percentage increase in the baby’s weight over the first three months of its life.