
Buyers and Sellers in Subregions: Data from the 2014 Profile of Home Buyers and Sellers

The Functional Role of Hippocampal Subregions and Subfields:
A High-Resolution fMRI Study of Memory
by
Melanie Carol MacGillivray
A thesis submitted in partial fulfillment of the requirements for the degree of
Master of Science
Neuroscience & Mental Health Institute
University of Alberta
© Melanie Carol MacGillivray, 2017

ii
Abstract
The involvement of the hippocampus in episodic memory is well accepted. What is often
overlooked is the involvement of hippocampal subfields and subregions. The hippocampal
subfields Cornu Ammonis (CA), Dentate Gyrus (DG) and Subiculum (Sub) are cellularly distinct
areas that communicate transversely across the hippocampus, while hippocampal subregions
(Head, Body & Tail) are delineated from anterior to posterior along the length of the hippocampus
and have different cortical connectivity.
The current study addressed the question of how hippocampal subfields and subregions are
involved in the encoding of episodic memory using high-resolution fMRI and an adaptation of the
Wechsler Memory Scale Designs Subtest (2009). Our memory tasks consisted of 3 conditions:
Symbol (content memory), Location (spatial memory) and Both (associative memory).
We found that the total hippocampus was active for the Symbol, Location and Both
conditions. All subfields and subregions were active across all conditions of the task relative to
baseline. DG activity was significantly larger than CA activity when averaged across conditions.
For the Location condition the hippocampal tail was more active than the hippocampal body,
suggesting it may play a more dominant role in spatial memory. In addition hemisphere by subfield
and subfield by condition interactions were observed.
Our results provide support for the theory of posterior hippocampal involvement in spatial
memory, and suggest the human hippocampus works in discrete but connected subsections to
encode episodic memory.
iii
Acknowledgements
I would like to thank my supervisor Dr. Nikolai Malykhin, for the opportunity to
participate in such an exciting and innovative research project. Thank you for guiding me
throughout the project, having patience and always being there to keep everything moving
forward.
A special thanks goes to Stanislau Hrybouski for teaching me all about fMRI and the
process of good science. He has guided me throughout the project and I am grateful for his
mentorship. I would also like to thank the contributors to our project. Chris Madan for his help
with task design and fMRI analysis, Peter Seres for his many hours of work and patience setting
up and running participants for the project, Yushan Huang for all his hard work and many hours
spent tracing hippocampi and making this project possible and Rawle Carter for his work on
recruitment, screening and scheduling of participants for the study.
I would also like to thank my committee members Jacqueline Cummine and Jeremy
Caplan for their feedback and guidance throughout this project. And thank you to my lab mates
Arash Sereshki and Scott Travis for being great anchors and sources of support throughout
graduate school and research project progression.
Lastly, I would also like to thank my parents and Sam Worrall for being great support
systems throughout my degree and encouraging me to pursue this degree program and my dreams.
This research was funded by Canadian Institutes of Health Research (CIHR) operating grants (PI
– Nikolai Malykhin). The results have been presented in part at the Society for Neuroscience
Annual Meeting 2016 in November in San Diego, California, USA, Campus Alberta Neuroscience
International Banff Conference 2016 and Organization for Human Brain Mapping (OHBM) annual
meeting in Vancouver, British Columbia, Canada, in June 2017.

iv
Table of Contents
Chapter 1: Introduction ..................................................................................................................... 1
1.1: Introduction to Memory in the Hippocampus ................................................................................ 1
1.2: Hippocampal Anatomy .................................................................................................................. 3
1.3: Hippocampal Subfields and Subregions in Memory Function .................................................... 13
1.4: Models of Hippocampal Function................................................................................................ 16
1.5: Objective ...................................................................................................................................... 18
Chapter 2: Material & Methods ...................................................................................................... 19
2.1: Participants ................................................................................................................................. 19
2.2: Stimuli ........................................................................................................................................ 19
2.3: Memory Task ............................................................................................................................. 20
2.4: Experimental Design .................................................................................................................. 25
2.5: Data Acquisition ........................................................................................................................ 25
2.6: Hippocampal Segmentation ....................................................................................................... 27
2.7: Image Preprocessing .................................................................................................................. 28
2.8 General Linear Model and HRF Fitting ...................................................................................... 30
2.9: Imaging Analysis ......................................................................................................................... 32
Chapter 3: Results ............................................................................................................................. 35
3.1: Behavioural Results ................................................................................................................... 35
3.2: Total Hippocampus .................................................................................................................... 36
3.3: Subregions .................................................................................................................................. 38
3.4: Subfields..................................................................................................................................... 41
Chapter 4: Discussion ....................................................................................................................... 46
4.1: Comparison Canonical & Canonical + Derivative Results ........................................................ 47
4.2: Models of Hippocampal Structure & Function ............................................................................ 51
v
4.3: Encoding .................................................................................................................................... 54
4.4: Spatial Memory .......................................................................................................................... 55
4.5: Limitations & Future Directions ................................................................................................ 57
4.6: Summary .................................................................................................................................... 58
References .......................................................................................................................................... 60

vi
List of Figures
1.1: Sagittal MRI Image Showing the Location of the Hippocampus in the Human Brain ….….. 3
1.2: Coronal Histologial Slice Showing Hippocampal Subfields ………………………….…….. 4
1.3: Coronal MRI Images Delineating Subfields within Subregions …………………….……… 5
1.4: Comparison of Typical and High-Resolution fMRI ……………………………….…..….…. 6
1.5: Visual Representation of the Direct Intrahippocampal Pathway …………………..…….….. 7
1.6: Visual Representation of the Polysynaptic Pathway ……………………………….…….….. 8
1.7: Visual Representation of the Polysynaptic Pathway Cortical Connections ……….….…….. 8
1.8: MRI and 3-D Images Showing the Hippocampal Head, Body and Tail ………….………… 9
1.9: Cross-species Comparison of Hippocampal Anatomy ………………………….…………. 10
1.10: Model of Long-Axis Specialization & Cortical Connectivity ……………….…..……….. 12
1.11: Sensory Input onto the Long-Axis of the Hippocampus ……………..…….…….….…… 12
1.12: Models of Hippocampal Functional Organization ………………………..…….….….….. 17
2.1: Visual Depiction of Study Stimuli ……………………………………………….….….….. 20
2.2: Visual Depiction of the Symbol Condition ………………………………………..……….. 22
2.3: Visual Depiction of the Location Condition ……………………………………………….. 22
2.4: Visual Depiction of the Both Condition with Location Cues …………………………….... 23
2.5: Visual Depiction of the Both Condition with Symbol Cues …………………….……….… 23
2.6: Brain coverage in anatomical and functional scans ………..…………………………….… 26
2.7: Hippocampal subfield ROIs shown on structural and functional images ………..…..….… 28
2.8: Total Hippocampal HRF fitted to Canonical Modelling …………………...…………….... 31
2.9: Total Hippocampal HRF fitted to Canonical + Derivative Modelling ………………….…. 32
3.1: Behavioural Accuracy ………………………………...……………………………….…… 35
3.2: Activation for Total Hippocampus (Canonical Modelling) …………………………..……. 37
3.3: Activation for Total Hippocampus (Canonical + Derivative Modelling) ……………..……. 37

vii
3.4: Activation for Subregions (Canonical Modelling) …………………………………..……. 39
3.5: Activation for Subregions (Canonical + Derivative Modelling) ……….…..………..……. 40
3.6: Activation for Subfields (Canonical Modelling): Main Effect of Subfield …………...…... 42
3.7: Activation for Subfields (Canonical Modelling): Hemisphere by Subfield Interaction …... 43
3.8: Activation for Subfields (Canonical Modelling): Condition by Subfield Interaction …….. 43
3.9: Activation for Subfields (Canonical Modelling) ……………………….……..…………... 45
3.10: Activation for Subfields (Canonical + Derivative Modelling) ………………….…….…. 45

viii
List of Tables
4.1: Differences observed between Canonical and Canonical + Derivative Modelling …..... 49-50

ix
List of Abbreviations
2-D Two-Dimensional
3-D Three-Dimensional
CA Cornu Ammonis
DG Dentate Gyrus
fMRI Functional Magnetic Resonance Imaging
FOV Field of View
FWE Family Wise Error
FSE Fast Spin Echo
mm Millimetre(s)
MPRAGE Magnetic Prepared Rapid Acquisition Gradient Echo
MRI Magnetic Resonance Imaging
ms Millisecond(s)
MTL Medial Temporal Lobe
PET Positron Emission Tomography
SD Standard Deviation
SE Spin Echo
SNR Signal to Noise Ratio
Sub Subiculum
T Tesla
T1 Longitudinal Relaxation Time
T2 Transverse Relaxation Time
TE Echo Time
TR Repetition Time
WMS Wechsler Memory Scale

1
Chapter 1: Introduction
1.1: Introduction to Memory in the Hippocampus
Episodic memory is long-term memory for past events, and can contain contextual
information about previous experiences (Squire & Dede, 2015). It is well accepted that the
hippocampus plays a role in episodic memory (Eichenbaum, 2001). The inability of patient H.M.
(Scoville & Milner, 1957) and other patients with hippocampal lesions (Squire & Wixted, 2011) to
successfully perform episodic memory tasks lends support for this theory.
It is important to note that there are many different types of memory. In the current study
we investigate hippocampal involvement in episodic memory. Often, memory is divided into
dichotomies. For instance, memory is often classified as either long-term or working memory.
Long-term memory is the ability to remember information from the past that is not kept in mind
via active rehearsal (Jeneson & Squire, 2011). It can be contrasted with working memory, which is
when a limited amount of information is kept in mind or recalled after a short delay without
significant distraction (Jeneson & Squire, 2011). Long-term memory is needed to access
information that is not actively kept in mind.
Long-term memory can be divided into declarative and procedural memory. Declarative
memory can be consciously recalled, and can include contextual information about a past event or
factual knowledge. Procedural memory is an unconscious memory for skills that can help guide
behaviour subconsciously (Squire & Dede, 2015).
Declarative memory can also be described as associative as it involves linking parts together
by spatial, temporal or other features. While declarative memory is classified as longterm memory,
working memory studies by Mayes et al. (2007) and Piekema et al. (2009) have shown hippocampal

2
activity during memory tasks that require associations to be made, especially when those
associations were cross-modal.
Declarative memory can be further subdivided into episodic and semantic memory.
Episodic memory refers to memory for past events, and can contain contextual information about
previous experiences while semantic memory is memory for factual information (Squire & Dede,
2015). Semantic memory is not tied to an event while episodic memory is specific to a certain time
or place. A unique feature of episodic memory is that it allows humans and animals to “mental time
travel” back to earlier events and relive them (Tulving, 2002). Our study assesses hippocampal
involvement in the encoding of episodic memory.
First evidence for hippocampal involvement in episodic memory came from research done
with patient H.M. (Scoville & Milner, 1957). Patient Henry Molaison underwent a bilateral medial
temporal lobe (MTL) resection to help relieve severe epilepsy, where the hippocampus, amygdala
and surrounding structures were removed (Squire & Wixted, 2011). He was unable to form new
episodic memories following the surgery, and lost all memory for years leading up to the surgery
(Scoville & Milner, 1957). Following this discovery, there have been many studies comparing
medial temporal lobe patients with healthy controls that imply the hippocampus as a whole plays a
role in episodic memory. For instance, a study performed by Olson et al (2006) where patients
with MTL damage completed a task where they were asked to remember a series of coloured blocks
over a short delay. They performed as well as controls at the shortest delay for all 6 items, but when
a longer delay was introduced they were unable to remember more than a few. Jeneson & Squire
(2011) argued that in this case, there was likely too much information to be actively rehearsed in

3
working memory, so participants had to access their long-term memory system to help them
complete the task.
1.2: Hippocampal Anatomy
The hippocampus is a structure found in the medial temporal lobe (See Figure 1.1).
Hippocampus is the Latin word for seahorse, and it was named in such a way because its outer
structure as a whole resembles a seahorse. It is a heterogeneous structure and is often divided into
anatomical subdivisions known as hippocampal subfields and subregions.
Figure 1.1: A sagittal MRI image showing the location of the hippocampus in the human brain.
Cross sectionally the hippocampus can be divided into cellularly distinct subfields known
as the Cornu Ammonis (CA1-4), the Dentate Gyrus (DG) and the Subiculum (Sub) (Duvernoy,
2013). These subfields communicate transversely across the hippocampus and can be delineated
on cross sectional post mortem images (See Figure 1.2 from Duvernoy, 2005) and visualized on
coronal MRI images (See Figure 1.3 from Malykhin et al., 2010).
The CA subfield can be further divided into CA1-4 regions. This subfield is composed of
pyramidal neurons with triangular soma in CA1 and ovoid soma in CA2-4. It is the largest subfield
in the human hippocampus and takes up the majority of the outer perimeter (Duveroy, 2013). The
4
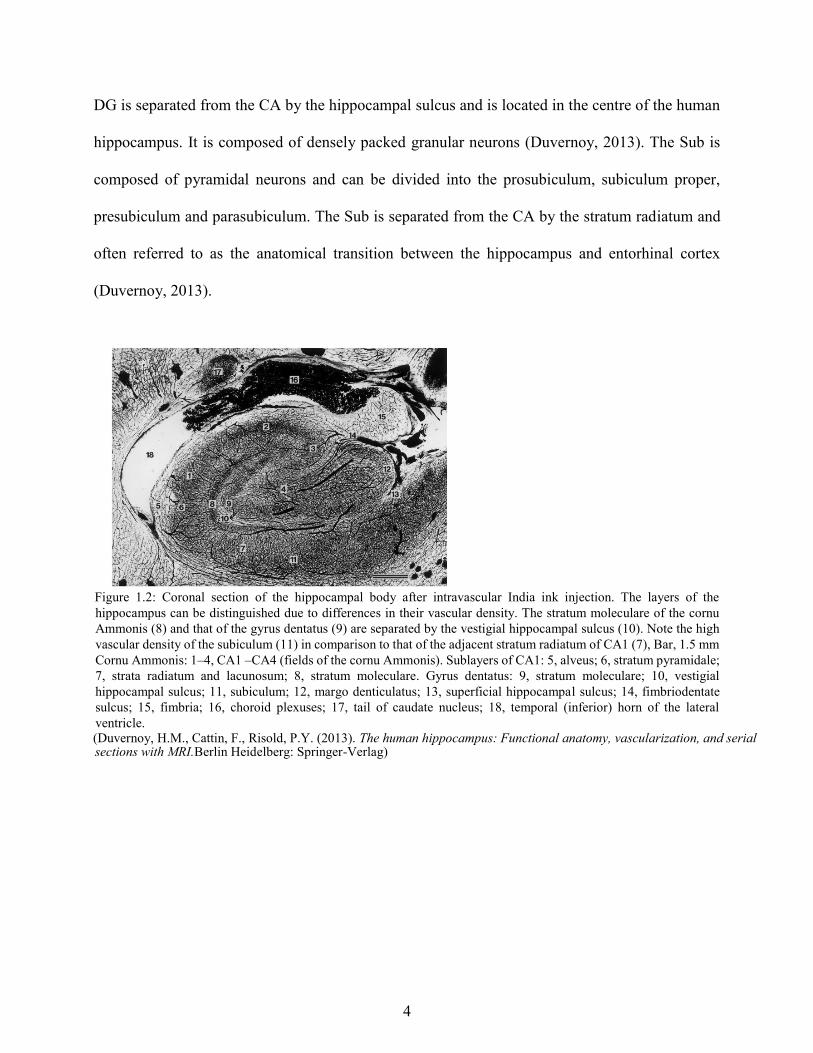
DG is separated from the CA by the hippocampal sulcus and is located in the centre of the human
hippocampus. It is composed of densely packed granular neurons (Duvernoy, 2013). The Sub is
composed of pyramidal neurons and can be divided into the prosubiculum, subiculum proper,
presubiculum and parasubiculum. The Sub is separated from the CA by the stratum radiatum and
often referred to as the anatomical transition between the hippocampus and entorhinal cortex
(Duvernoy, 2013).
Figure 1.2: Coronal section of the hippocampal body after intravascular India ink injection. The layers of the
hippocampus can be distinguished due to differences in their vascular density. The stratum moleculare of the cornu
Ammonis (8) and that of the gyrus dentatus (9) are separated by the vestigial hippocampal sulcus (10). Note the high
vascular density of the subiculum (11) in comparison to that of the adjacent stratum radiatum of CA1 (7), Bar, 1.5 mm
Cornu Ammonis: 1–4, CA1 –CA4 (fields of the cornu Ammonis). Sublayers of CA1: 5, alveus; 6, stratum pyramidale;
7, strata radiatum and lacunosum; 8, stratum moleculare. Gyrus dentatus: 9, stratum moleculare; 10, vestigial
hippocampal sulcus; 11, subiculum; 12, margo denticulatus; 13, superficial hippocampal sulcus; 14, fimbriodentate
sulcus; 15, fimbria; 16, choroid plexuses; 17, tail of caudate nucleus; 18, temporal (inferior) horn of the lateral
ventricle. (Duvernoy, H.M., Cattin, F., Risold, P.Y. (2013). The human hippocampus: Functional anatomy, vascularization, and serial sections with MRI.Berlin Heidelberg: Springer-Verlag)

5
Figure 1.3: T2-weighhed FSE images are shown in inverted contrast. Sagittal view of the hippocampus with references
to coronal slices (1). Coronal views of the hippocampal parts (2–4): hippocampal head (Fig. 2d); hippocampal body
(Fig. 3b); hippocampal tail (Fig. 4). Abbreviations: CA1-3, cornu ammonis (shown in red); DG, dentate gyrus (shown
in blue); Sub, subiculum (shown in green); SLM, stratum lacunosum-moleculare; fim, fimbria. (Malykhin, N.V., Lebel, R.M., Coupland, N.J., Wilman, A.H., & Carter, R. (2010). In vivo quantification of
hippocampal subfields using 4.7 T fast spin echo imaging. Neuroimage, 49,1224-30.)
Although there is some discrepancy in how to separate hippocampal subfields into more
accurate anatomical Regions of Interest (ROIs) (Yushkevich et al., 2015), most studies segment the
hippocampus into 3 main subfields: CA1-3, DG (+CA4) and Sub. The exact definition of the
boundaries varies between more than 21 protocols for manual segmentation (Yushkevitch et al.,
6
2015). Using 3T most structural MRI studies are unable to delineate the border between the DG,
CA3 and CA2 and therefore these regions are often combined to form an ROI known as DG/CA3
or DG/CA2/CA3 (Suthana et al., 2015). The current study divides these subfields into CA1-3, DG
(+CA4) and Sub ROIs.
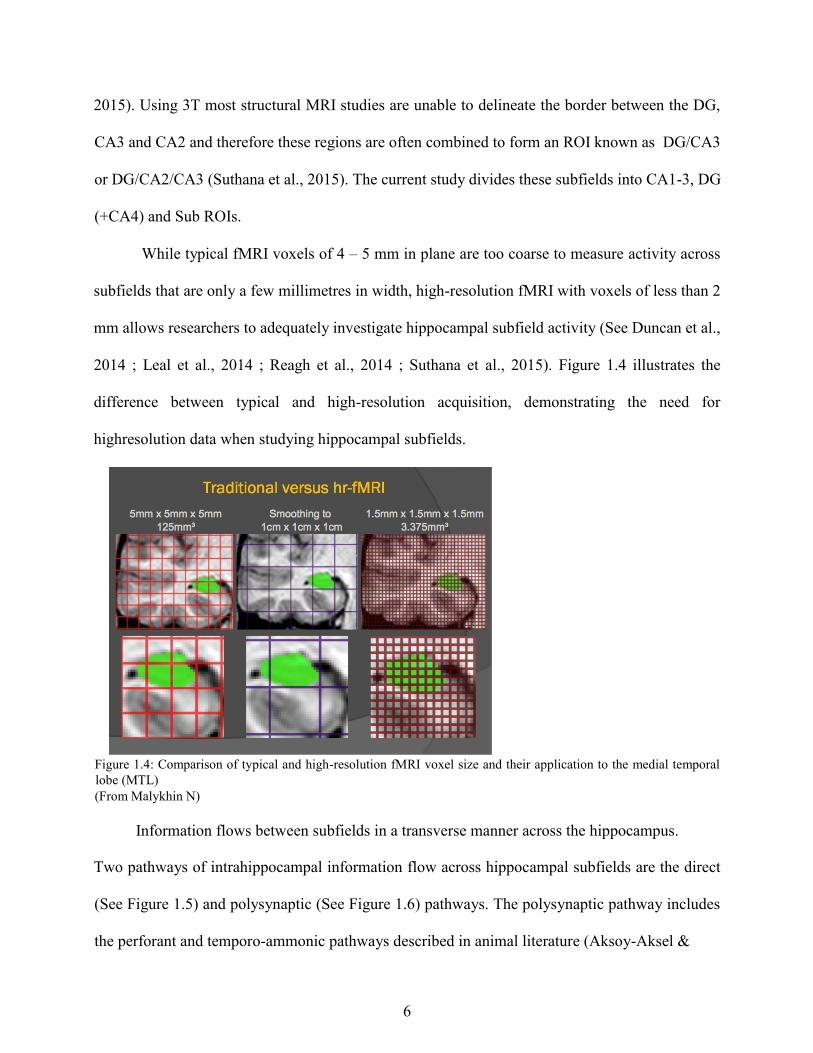
While typical fMRI voxels of 4 – 5 mm in plane are too coarse to measure activity across
subfields that are only a few millimetres in width, high-resolution fMRI with voxels of less than 2
mm allows researchers to adequately investigate hippocampal subfield activity (See Duncan et al.,
2014 ; Leal et al., 2014 ; Reagh et al., 2014 ; Suthana et al., 2015). Figure 1.4 illustrates the
difference between typical and high-resolution acquisition, demonstrating the need for
highresolution data when studying hippocampal subfields.
Figure 1.4: Comparison of typical and high-resolution fMRI voxel size and their application to the medial temporal
lobe (MTL) (From Malykhin N)
Information flows between subfields in a transverse manner across the hippocampus.
Two pathways of intrahippocampal information flow across hippocampal subfields are the direct
(See Figure 1.5) and polysynaptic (See Figure 1.6) pathways. The polysynaptic pathway includes
the perforant and temporo-ammonic pathways described in animal literature (Aksoy-Aksel &
7
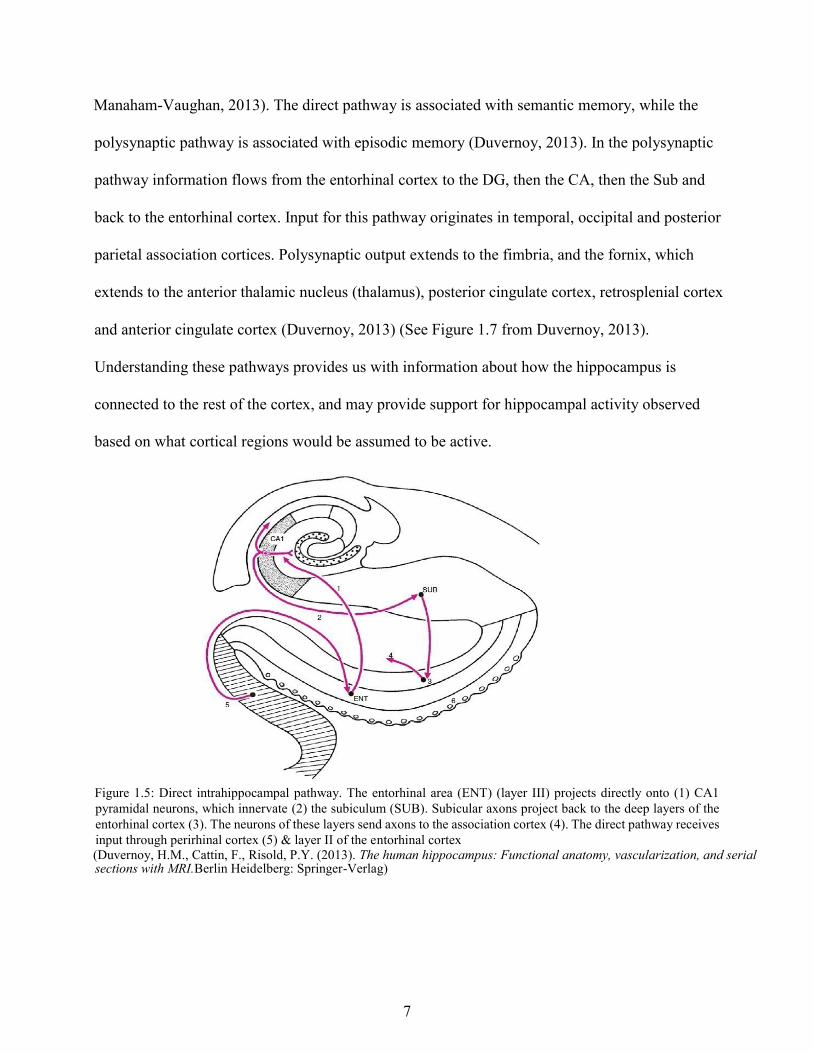
Manaham-Vaughan, 2013). The direct pathway is associated with semantic memory, while the
polysynaptic pathway is associated with episodic memory (Duvernoy, 2013). In the polysynaptic
pathway information flows from the entorhinal cortex to the DG, then the CA, then the Sub and
back to the entorhinal cortex. Input for this pathway originates in temporal, occipital and posterior
parietal association cortices. Polysynaptic output extends to the fimbria, and the fornix, which
extends to the anterior thalamic nucleus (thalamus), posterior cingulate cortex, retrosplenial cortex
and anterior cingulate cortex (Duvernoy, 2013) (See Figure 1.7 from Duvernoy, 2013).
Understanding these pathways provides us with information about how the hippocampus is
connected to the rest of the cortex, and may provide support for hippocampal activity observed
based on what cortical regions would be assumed to be active.
Figure 1.5: Direct intrahippocampal pathway. The entorhinal area (ENT) (layer III) projects directly onto (1) CA1
pyramidal neurons, which innervate (2) the subiculum (SUB). Subicular axons project back to the deep layers of the
entorhinal cortex (3). The neurons of these layers send axons to the association cortex (4). The direct pathway receives
input through perirhinal cortex (5) & layer II of the entorhinal cortex (Duvernoy, H.M., Cattin, F., Risold, P.Y. (2013). The human hippocampus: Functional anatomy, vascularization, and serial sections with MRI.Berlin Heidelberg: Springer-Verlag)

8
Figure 1.6: Polysynaptic intrahippocampal pathway. A-E are parts of the neural chain forming the polysynaptic
intrahippocampal pathway. Cornu Ammonis: 1 alveus, 2 stratum pyramidale, 3 Schaffer collaterals, 4 axons of
pyramidal neurons (mainly to septal nuclei), 5 strata lacunosum and radiatum, 6 stratum moleculare, 7 vestigial
hippocampal sulcus. Gyrus dentatus (GD): 8 stratum moleculare, 9 stratum granulosum. CA1, CA3 fields of the cornu
Ammonis, SUB subiculum. ENT (Layer II of the entorhinal area) is the origin of this chain; its large pyramidal neurons
are grouped in clusters, giving a granular aspect at the entorhinal surface. (Duvernoy, H.M., Cattin, F., Risold, P.Y. (2013). The human hippocampus: Functional anatomy, vascularization, and serial sections with MRI.Berlin Heidelberg: Springer-Verlag)
Figure 1.7: Cortical connections of the polysynaptic intrahippocampal pathway. Hippocampal outputs fibers to the
cortex: arising from the hippocampus (1), fibers successively reach the body (2) and column (3) of fornix (3’, anterior
commissure), the mamillary body (4), and then, via the mamillothalamic tract (5), the anterior thalamic nucleus (6);
some fibers reach this nucleus directly (6’); from the anterior thalamic nucleus, the main cortical projections are the
posterior cingulate (area 23) and retrosplenial (areas 29, 30) cortices; some fibers may project to the anterior cingulate
cortex (area 24) (see p. 33). Input fibers from the cortex to hippocampus: the posterior parietal association cortex (7)
in relation to the superior visual system (8) projects via the parahippocampal gyrus (9) to the entorhinal area (10); 10’,
perforant fibers (Duvernoy, H.M., Cattin, F., Risold, P.Y. (2013). The human hippocampus: Functional anatomy, vascularization, and serial sections with MRI.Berlin Heidelberg: Springer-Verlag)
The hippocampus can also be divided along its longitudinal axis into subregions known as
the hippocampal head, body and tail (Duvernoy, 2005) or anterior and posterior sections (See

9
Figure 1.8 from Malykhin et al., 2007). In the animal literature these subregions are known as the
ventral and dorsal hippocampus respectively (see Figure 1.9 from Strange et al., 2014). All
subregions of the hippocampus contain the CA, DG and Sub subfields, but the proportion of these
subfields varies along the longitudinal axis (Malykhin et al., 2010).
Figure 1.8: Three-dimensional renderings of the hippocampus and amygdala. A: 3-D hippocampus and amygdala (left)
placed in situ in the sagittal slice corresponding to Fig. 5b. B-C: 3-D hippocampi and amygdalae viewed from the right
with reference to slices from the two dimensional figures.D: 3-D hippocampi and amygdalae placed in situ in the axial
slice corresponding to Fig. 6a. E-F: 3-D hippocampi and amygdalae viewed from the top with reference to slices from
the two-dimensional figures. (Malykhin, N.V., Bouchard, T.P., Ogilvie, C.J., Coupland, N.J., Seres, P., Camicioli, R., (2007). Three-dimensional
volumetric analysis and reconstruction of amygdala and hippocampal head, body and tail. Psychiatry Research: Neuroimaging. 155(2), 155–165.)
For the purpose of this study we divided the hippocampus into head, body and tail regions
based on anatomical landmarks (Duvernoy, 2005) that can be identified on high-resolution MRI
images (Malykhin et al., 2007, 2010) to provide more anatomical specificity when analyzing our
results. Previous literature that separates the hippocampus into anterior and posterior sections often
simply divides the hippocampus in half (Poppenk et al., 2013) which means the anterior
hippocampus would be equal to our hippocampal head and the anterior part of the hippocampal

10
body, and the posterior hippocampus would be equal to our hippocampal tail and the posterior part
of the body.
Figure 1.9: Figure 1 | Cross-species comparison of hippocampal anatomy. a | Schematic illustrations of the
orientation of the hippocampal long axis in rats, macaque monkeys and humans. The longitudinal axis is described as
ventrodorsal in rodents and as anteroposterior in primates (also referred to as rostrocaudal in non-human primates).
There is currently no precise anatomical definition for a dorsal (or posterior) portion of the hippocampus relative to a
ventral (or anterior) one, although in general, topologically, the former is positioned close to the retrosplenial cortex
and the latter close to the amygdaloid complex. Note that a 90-degree rotation is required for the rat hippocampus to
have the same orientation as that of primates. In primates, the anterior extreme is curved rostromedially to form the
uncus. b | The full long axis of the hippocampus (red) can be seen in brains of rats, macaque monkeys and humans,
with the entorhinal cortex (EC) shown in blue. c | Drawings of Nissl cross-sections of mouse, rhesus and human
hippocampi. A, anterior; C, caudal; D, dorsal; DG, dentate gyrus; L, lateral; M, medial; P, posterior; R, rostral; V,
ventral. Panel a is adapted with permission from REF. 171 (Insausti 1993), Copyright © 1993 Wiley-Liss, Inc., A
Wiley Company. Panel c is from REF. 54 (Hawrylycz et al. 2012), Nature Publishing Group. (Strange, B.A., Witter, M.P., Lein, E.S. & Moser, E.I. (2014). Functional organization of the hippocampal longitudinal
axis. Nature Reviews Neuroscience. 15, 655-669.)
Structural connectivity suggests hippocampal subregions may be functionally
differentiated. The anterior hippocampus primarily projects to anterior cortical regions while the

11
posterior hippocampus primarily projects to more posterior cortical regions (See Figure 1.10 from
Poppenk et al., 2013). While there is some overlap in cortical connectivity of the anterior and
posterior hippocampus, the majority of their connectivity is quite different. For instance, both
anterior and posterior hippocampal subregions project to the entorhinal cortex, but to different
bands. They have little direct connectivity and may communicate indirectly via the perirhinal and
parahippocampal cortex (Poppenk et al., 2013). Schultz et al. (2012) showed that the
perirhinallateral entorhinal pathway was more involved in the retrieval of faces, while the
parahippocampalmedial entorhinal pathway was more involved in the retrieval of scenes. This
provided support for the theory of differential involvement of the perirhinal cortex and lateral
entorhinal cortex vs the parahippocampal cortex and medial entorhinal cortex in spatial vs.
nonspatial tasks, and provides further evidence for functional specialization of hippocampal
subregions. Parahippocampal cortex is located primarily within the posterior hippocampus (body
and tail), while enthorhinal cortex and perirhinal cortex are located within the anterior hippocampus
(head).
Other differences in anatomical cortical connectivity can be seen when comparing different
sensory inputs of the hippocampus (See Figure 1.11). There is some overlap across subregions
where auditory and somatosensory stimuli are connected to the intermediate hippocampus
(hippocampal body), but overlap with anterior (head) and posterior (tail) sections as well. Olfactory
and gustatory stimuli have dominant connections to the anterior hippocampus, while visual and
vestibular/proprioception stimuli have dominant connections to the posterior hippocampus (Small
et al., 2002). Although it might not be directly linked to the task used in the present study, the
differential functional connectivity of the hippocampus for various sensory inputs is further support
for functional specialization of hippocampal subregions.

12
Figure 1.10: Model of long-axis hippocampal specialization. Hippocampal connections (thick black lines) are depicted
with reciprocal termination points (black dots). The aHPC and pHPC are separated by the plane that contains the uncal
apex (dashed red line). The information hypothetically carried on each pathway is shown in boxes. (Poppenk, J., Evensmoen, H.R., Moskovitch, M. & Nadel, L. (2013). Long-axis specialization of the human
hippocampus. Trends in Cognitive Neuroscience. 17(5), 230-240.)
Figure 1.11: Sensory input onto the long-axis of the hippocampus. Based on a figure by Small, (2002).
The majority of fMRI studies on the human hippocampus divide it into anterior and
posterior sections, potentially missing important information about the intermediate hippocampus.
For instance, Small et al. (2002) studied hippocampal activity across the hippocampal head, body

13
and tail during a memory task using fMRI. Participants studied stimuli across three phases: visual
faces, auditory names, and visual faces paired with auditory names. A posterior-anterior activation
gradient with the largest activation found in the posterior hippocampus was observed during the
faces-only condition, while an anterior-posterior gradient with the largest activation found in the
anterior hippocampus was observed during the names only condition. The authors argued that if
the hippocampus did not engage in combining the face-name pairs the activity observed during the
face-name condition would simply be a summation of the activity observed in the face-only and
name-only conditions. However, the summation of activity was not observed, and the intermediate
hippocampus showed the greatest activation during the face-name pairs condition. The authors
suggest this pattern of activity is indicative of the hippocampus forming associations between
separate stimuli. While anatomical connectivity would suggest the anterior hippocampus should be
engaged while hearing names and the posterior hippocampus should be engaged while viewing
faces, it appears as though the activity is not restricted to only these areas.
The current study aimed to separate the hippocampus into its anatomical subregions of the
head, body and tail (Duvernoy, 2005) to provide a more accurate picture of activity along the entire
long axis of the hippocampus. Furthermore, this approach allows us to address the possibility of a
gradient in activity (head, body and tail) as opposed to a dichotomy (anterior/posterior).
1.3: Hippocampal Subfields and Subregions in Memory Function
The current study aimed to address the important gap in the literature of how hippocampal
subregions and subfields are involved in the encoding of new episodic memories. Using
highresolution fMRI we assessed activity across subregions and subfields during an episodic
memory
14
task.
While disagreements do exist, there is evidence suggesting activity in the CA1 area
demonstrates a match/mismatch/novelty signal (Duncan et al., 2012), while activity in the DG/CA3
changes with repetition, degree of change in stimuli and behavioural performance (Reagh et al.,
2014, Stokes et al., 2015). The match/mismatch/novelty signal observed in CA1 by Duncan et al.
(2012) is characterized by a linear change in activity that correlated with the degree of change in a
scene. Reagh et al. (2014) found that activity in the DG/CA3 subfield was reduced with repetition of
stimuli, where greater activity suppression was related to better behavioural performance.
Using structural MRI, a previous study from our lab (Travis et al. 2014) found that
performance on the Wechsler Memory Scale (WMS---IV; Pearson Education I., 2009)
was associated with specific hippocampal subfield and subregion volumes. (For a more thorough
description of the Wechsler Memory Scale see Section 2.3: Memory Task) DG volume in the
hippocampal body was associated with visual-spatial memory, while CA1-3 volume was associated
with both visual-spatial memory and visual-content memory. The strongest correlations were
observed for scores in the Designs subtest. Therefore our fMRI task was designed to mimic this
task and produce the strongest activation in the hippocampus and its subfields. A single previous
adaptation of the WMS for use in an fMRI paradigm was completed by Neuner et al.
(2007). The study used an adaptation of the Paired Associates subtest and found no significant
activation in the hippocampus, but did find activation in other cortical regions. In contrast the task
used in our study is designed to study visual memory, while the Paired Associates subtest is
designed to test auditory memory. In the current study we employed an episodic memory task based
on the Wechsler Memory Scale (WMS---IV; Pearson Education I., 2009) Designs Subtest,
which tested visual memory. Such translational design allows us to determine whether or not our

15
previous volumetric findings are indicative of functional activation differences between
hippocampal subfields.
It is well accepted the hippocampus plays a role in spatial memory, which may be due to
the associative nature of encoding spatial locations (Piekema et al., 2010). Although there is no
clear agreement in the field, some evidence suggests the posterior hippocampus is more active than
the anterior hippocampus for spatial memory tasks (Strange et al., 2014). The current study aimed
to address subregion and subfield involvement in spatial memory by measuring activity during the
encoding of our spatial task.
A meta analysis of studies on hippocampal subregions suggests the anterior and posterior
regions play different roles in memory. Some studies have reported that for episodic memory the
anterior hippocampus is active during encoding (Spaniol et al., 2009; De-Vanssay-Maigne et al.,
2012) and the posterior hippocampus is active during retrieval. However there is contradictory
research suggesting the entire hippocampus along the long axis is engaged for encoding, or that
encoding effects observed may be due to novelty effects (Poppenk et al., 2013). Other studies have
reported anterior hippocampal activity to be associated with memory for global spatial
representations and general features of a memory with posterior hippocampal activity associated
with local spatial representations and more detailed features of a memory (Poppenk et al., 2013).
The current study aimed to further contribute to our knowledge of this subregional specificity by
indicating whether or not all anatomical subregions are simultaneously involved in the encoding of
episodic memories and if they are equally involved during the encoding of spatial and content
information.

16
1.4: Models of Hippocampal Function
The goal of the current study was to investigate how the hippocampus encodes new episodic
memories. Different theories suggest the hippocampus works as a single unit, in discrete sections
or in interconnected sections with preferred roles (See Figure 1.12). Understanding which model
best describes hippocampal activity can provide us with information that either supports or rejects
hippocampal functional specialization. We investigated hippocampal function by assessing
subregion and subfield activity. If a function was specific to a particular subregion and that
subregion was damaged, we would expect for that function to be severely impaired and the person
or animal to be unable to complete that function. However, if subregions are all functionally
involved then it is less likely that damage to a particular area would result in complete loss of that
function. Performance may be impaired, but the function should not be wiped out entirely.
The first model of hippocampal function suggests the hippocampus functions as separate
independent units. This is based on studies by Anderson et al. (1971) and Bliss and Lomo (1973)
that demonstrated activation that spread transversely across the hippocampus and that long term
potentiation (LTP) occurs during this spread of activation. This theory suggests the hippocampus
is made up of separate sections with independent circuits across its length (Small et al., 2002).
The second model of hippocampal function suggests the hippocampus acts as a single
functional unit. Studies by Amaral and Witter (1989) and Pare et al. (1994) that showed anterograde
and retrograde tracers and electrical activity travelled the length of the hippocampus provide
support for this theory of hippocampal function. According to this theory, the hippocampus should
function as a single unit regardless of cortical input (Small et al., 2002).

17
Figure 1.12: Three models describing the functional organization of the hippocampus. Based on a figure from Small,
(2002)
The third model of hippocampal function suggests the hippocampus is made up of
subregions that are interconnected but functionally segregated. Small et al. (2002) observed a
gradient in fMRI activation where the anterior hippocampus was most active when participants
heard names and the posterior hippocampus was most active when they viewed faces. Retrieval of
face-name pairs elicited activity in the intermediate hippocampus. Retrieval activity was observed
in a different region for combined faces and names than for encoding of faces or names
individually. This is indicative of functionally separate, yet connected subregions. The current
study assesses hippocampal subregion circuitry by measuring hippocampal activation across its
anatomical subregions during an episodic memory task.

18
1.5: Objective
Interest in the long axis of the hippocampal formation as well as in function of its subfields
has been increasing since the introduction of high-resolution structural and functional MRI has
allowed separation of the hippocampus into its anatomical parts. Recent human fMRI studies
indicate that, much like the more popular transverse axis, the long axis of the hippocampus needs
to be viewed as a functional circuit. As has been shown with previous structural MRI studies from
our lab, circuit analysis of the long axis provides unique insight into the role played by the
hippocampal subfields and subregions in episodic memory.
The main goal of the present study was to investigate how the hippocampus as a whole, and
its smaller subsections (subfields and subregions) are involved in the encoding of new episodic
memories using high-resolution functional Magnetic Resonance Imaging (fMRI). The second goal
was to investigate the role of these subfields and subregions in the encoding of different types of
episodic memory, in particular content, spatial, and associative memory. Based on a previous study
in our lab (Travis et al., 2014) we hypothesize subfields and subregions will be differentially active
during the encoding of different conditions of our task. Specifically, we anticipate the posterior
hippocampus to be more active during the spatial task than the anterior hippocampus, and the DG
to be more active than the CA1-3 and Sub across tasks.
Understanding the similarities and differences in activity across subfields and subregions
will contribute to current knowledge of how the hippocampus works. Our study aimed to determine
whether the hippocampus acts as a single unit or multiple units that are either connected or
independent.

19
Chapter 2: Material and Methods
2.1: Participants
A total of 29 healthy volunteers were recruited to participate in the current study. All
participants were screened to ensure they had no personal history of psychiatric or neurological
illness as assessed by a structured interview (Anxiety Disorders Interview Schedule-IV: Brown et
al., 2001) and were excluded if they were on medication that could affect cognition such as
antipsychotics, benzodiazepines, antidepressants, anti-cholinergic medications or alcohol. Medical
exclusion criteria were defined as active and inactive medical conditions that may interfere with
normal cognitive function: cerebrovascular pathology, tumors or congenital malformations of the
nervous system, diabetes, multiple sclerosis, Parkinson's disease, epilepsy, dementia, organic
psychosis (other than dementia), schizophrenia, and stroke. Four participants were excluded from
analyses due to excessive head motion (>25% of volumes had to be removed) or deciding not to
continue with the study. A final sample of 25 participants (13 female, 20-33 years old) with a mean
age of 25.44 years (SD: 3.03) was used for analysis. Our participants were all right-handed.
Written, informed consent was obtained from each participant. The study was approved by the
University of Alberta Health Research Ethics Board.
2.2: Stimuli
Participants studied rectangular 4x4 grids with 4 abstract symbols spaced throughout the
boxes (See Figure 2.1). The abstract symbols used for the study were obtained from the Wechsler
Memory Scale (Wechsler, 2009) Design and Symbol Span subtests. We scanned pages from a
paperback version of the task, cropped all images into the same dimensions and changed them into
identical pixel quality. The task was modelled after the Designs subtest, but Symbol Span images

20
were used to increase the number of stimuli so participants could complete more trials. The
presentation of stimuli was randomized for each participant, so each person saw abstract images in
a different temporal order and spatial configuration.
Figure 2.1: One example of a 4x4 grid containing 4 abstract symbols that participants would view during the encoding
phase of all conditions of the task
2.3: Memory Task
Participants were told they were performing 2 tasks: a memory task and a number judgment
task. The memory task used in the current study was based on the Designs subtests of the Wechsler
Memory Scale (WMS-IV; Pearson Education I., 2009). The Wechsler Memory Scale is a
paperbased clinical memory test that assesses different forms of memory. The Designs subtest in
particular assesses both visual-spatial and visual-content memory. The examiner shows the
examinee a grid containing 4-8 abstract symbols on a page for 10 seconds. Immediate memory is
assessed just after the grid is removed, and delayed memory is assessed after a longer period of

21
time has passed and other tests have been completed. Memory performance is tested in two different
ways: the examinee recreates the grid by choosing the abstract symbols they remember and placing
them in the corresponding locations, and by indicating which grid out of a group of grids
corresponds to what they previously studied. Scores are broken down into visual-spatial and visual-
content memory. Visual-spatial memory scores are given for correct placement of images on the
grid. Visual-content memory scores are given for choosing the correct abstract images (Maccow,
2011). For the current study’s memory task, participants were shown 4 abstract symbols placed
randomly in a 4x4 grid. They were cued to focus on different aspects of the grid by a letter (S, L or
B) that appeared in the middle of the screen prior to the grid. Letters represented the 3 different
conditions: Symbol, Location and Both. For the Symbol condition participants were instructed to
remember what symbols appeared regardless of their location (See Figure 2.2 for visual
explanation). For the Location condition participants were instructed to remember where the
symbols appeared in the grid regardless of what the symbols were (See Figure 2.3 for visual
explanation). For the Both condition participants were instructed to remember both what symbols
they saw and where they appeared in the grid (See Figures 2.4 and 2.5 for visual explanation).
Participants viewed the grid for 10 seconds. Everyone was read pre-written instructions to ensure
they all received the same information.

22
Figure 2.2: Visual depiction of the symbol condition of the memory task
Figure 2.3: Visual depiction of the location condition of the memory task

23
Figure 2.4: Visual depiction of the both condition of the memory task with location cues.
Figure 2.5: Visual depiction of the both condition of the memory task with symbol cues.
24
For the retrieval phase of the task, participants were asked to indicate by button press which
symbol they previously viewed (Symbol/Both) or which location previously contained a symbol
(Location/Both). They completed 2 retrievals for each encoding trial. During retrieval of the
Symbol condition participants viewed 4 symbols for 5 seconds. After the first 2 seconds the
numbers 1 to 4 appeared under the symbols in a randomized order and they had 3 seconds to
respond. During retrieval of the Location condition participants viewed a blank 4x4 grid for 2
seconds. After 2 seconds the numbers 1 to 4 appeared randomly in the boxes for 3 seconds. The
Both condition retrieval was sectioned into 2 parts – participants were either presented with a
symbol they previously viewed and asked to indicate where in the grid it appeared, or they were
given a location and asked which symbol appeared in that location. Participants were given a cue
(a location or a symbol) for 2 seconds, then presented with either 4 symbols or a blank grid for 2
seconds, and randomized numbers for 3 seconds. Each run of the task included all 3 conditions
(Symbol, Location and Both) in a randomized order.
Inter-mixed with the memory task was our baseline task: number judgment (odd/even).
Participants were presented with a single number in the middle of the screen and asked to indicate
whether the number was odd or even. The odd and even cues were visible in the bottom left and
right corners of the screen. Participants were randomly assigned arrangement of odd and even cues.
(Approximately half of the participants completed the task with “odd” in the bottom left corner,
while the other half competed the task with “odd” in the bottom right corner.) Numbers appeared
on the screen for 1.25 seconds. At this speed, participants were actively engaged in the task.
Participants were instructed to focus on the task at hand and to actively engage in the number
judgment task to ensure they were not rehearsing the memory task.

25
2.4: Experimental Design
Participants were given instructions and completed a practice session (without responding)
prior to entering the scanner to ensure they understood the task. Once participants were set up inside
the scanner they had the opportunity to adjust their screen, and become familiarized with the button
presses.
Next, participants had the opportunity to complete a practice session of the memory task
while inside the scanner before collection of fMRI data. Correct answers turned blue after a delay
so participants could see if they had responded correctly.
After all of the setup and practice sessions were complete, participants completed 12 runs of
the task inside the scanner. Each run of the task contained one trial of each condition (Symbol,
Location and Both) and lasted approximately 2.5 minutes with a 3 minute break in between. The 12
runs of the task were randomized for each participant ensuring that participants completed the
Symbol, Location and Both conditions in a random and different order each time.
2.5: Data Acquisition
High-resolution anatomical images, full-brain anatomical images, high-resolution
functional images and field maps were acquired using the 4.7 Tesla Varian MR Imaging System at
the Peter Allen MR Research Centre. The images were acquired in 2 scanning sessions: in the first
session we acquired Coronal FSE and MPRAGE images, and in the second session we acquired
Axial FSE and EPI (functional) images.

26
High-resolution structural images were acquired using a 2D T2-Weighted Fast Spin Echo
(FSE) Sequence aligned along the anterior-posterior commissure (AC-PC) line. The Coronal FSE
[TR: 11000 ms, TE: 39 ms, FOV: 200 x 200 mm2, Voxel Size: 0.52 x 0.68 x 1 mm3, Echo
Train Length: 4, 90 Slices] was used for tracing hippocampal subfields and subregions, while the
Axial FSE [TR: 7000 ms, TE: 39 ms, FOV: 210 x 200 mm2, Voxel Size: 0.52 x 0.68 x 1mm3, 55
Slices] was used to help improve accuracy when registering volumes as functional volumes were
acquired axially (See Figure 2.6).
Figure 2.6: Brain coverage of high-resolution images. A single participant’s full-brain t1-weighted MPRAGE is shown
in the background. The anatomical high-resolution image (FSE) used to trace ROIs is shown in blue. The functional
high-resolution (EPI) image is shown in red. Segmented hippocampal ROI is shown in light blue.

27
Full-brain anatomical images were acquired using a T1-Weighted 3D Magnetization Prepared
Rapid Gradient-Echo (MPRAGE) sequence [TR: 8.5 ms,TE: 4.5 ms, Inversion Time: 300 ms, FOV: 256
x 200 x 180 mm3, Voxel Size: 1 x 1 x 1 mm3, Flip Angle: 10 degrees] and were used for tissue
segmentation to create nuisance regressors during analysis.
Functional volumes were acquired axially using a T2* Sensitive Gradient Echo Planar
Imaging (EPI) Pulse Sequence [TR: 2500 ms, TE: 19 ms, FOV: 168 x 210 mm2, Voxel Size: 1.5 x
1.5 x 1.4 mm3 with a .1mm interslice gap, Flip Angle: 75 degrees]. During each run (of the 12 runs)
of the memory task 62 EPI volumes were acquired, giving us 744 EPI volumes for each participant.
Fieldmaps were acquired using a multi-echo 3D gradient echo sequence [TR: 577.8, TE: 3.56,
6.71, FOV: 192 x 168mm, Resolution: 1.5 x 1.5 mm, Slice Thickness: 1.5 mm, 35 Slices].
2.6: Hippocampal Segmentation
All manual hippocampal segmentation was completed using Freesurfer’s Freeview
Visualization GUI (http://surfer.nmr.mgh.harvard.edu/) software on T2-weighted coronal FSE
images. Tracing protocols were developed with guidance from Duvernoy’s (2005) anatomical atlas
of the human hippocampus. Manual segmentation of hippocampal subregions (head body & tail)
and subfields (CA, DG & SUB) were completed by a skilled observer (Yushan Huang) using a
volumetric protocol developed by Malykhin et al. (2007) and Malykhin et al. (2010). Intra-rater
and inter-rater reliability of subfields and subregions has been published in previous work from our
lab (Malykhin et al., 2007, 2010). In these studies, intra-rater reliability was assessed by retracing
the hippocampi of 5 subjects (10 hippocampi overall) one week after the initial tracing using
intraclass correlations (ICCs) for a one-way fixed-effects design. Inter-rater (intra-rater) intraclass
correlations published for this segmentation method was 0.96(0.86) for the total hippocampus,

28
0.95(0.92) for the hippocampal head, 0.83(0.93) for the hippocampal body and 0.95(0.88) for the
hippocampal tail (Malykhin et al., 2007), 0.956 for CA1-3, 0.959 for DG and 0.972 for Sub
(Malykhin et al., 2010). Subfields were first traced on anatomical coregistered T2 images, then
resliced into fMRI space and manually corrected if needed (See Figure 2.7).
Figure 2.7: Sagittal views of the length of the hippoccampus in anatomical & fMRI space. B&F) Coronal views of the
hippocampal head C&G) Coronal views of the hippocampal body D&H) Coronal views of the hippocampal tail.
[CA13shown in red, DG shown in blue & Sub shown in green]
The hippocampus was divided into 3 main subfields based on our best approximation of
CA1-3, DG and Sub. Our Sub volumes did not include the presubiculum and parasubiculum
sections. Due to constraints of MRI imaging, the CA4 and DG regions are unable to be
differentiated and CA4 is included as part of the DG.
2.7: Image Preprocessing
Structural images were acquired for various purposes and therefore provided differential
coverage of the brain. To aid in registration of these volumes, images were cropped over the same
brain regions across scans using Matlab (The MathWorks Inc., Natick, MA). Next, cropped images
were registered using automated rigid-body transformations. The axial FSE images remained
stationary while coronal FSE and MPRAGE volumes were moved to match the axial image.
Tracing of hippocampal ROIs was completed on Coronal FSE images after registration.

29
However, MPRAGE images were corrected for intensity non-uniformity using N3 (Nonparametric
Non-uniform intensity Normalization) (McGill University, Montreal, QC) before registration. This
controls for MRI signal intensity fluctuations in structural images, which helps improve the
accuracy of tissue classification in later analysis. Without N3 correction, signal variation would be
too large and accurate tissue segmentation analysis would not be possible on the MPRAGE images.
Using hippocampal subfield and subregion ROIs and neglecting the rest of the brain
preserves statistical power and allows us to detect subtle hippocampal activation (Small et al.,
2002). ROI analysis allows us to assess how the hippocampus is engaged in our task.
Functional volumes were registered manually using Freesurfer’s Freeview Visualization
GUI (http://surfer.nmr.mgh.harvard.edu/) and SPM12 (Welcome Trust Centre for Neuroimaging,
UCL, UK). The first functional volume was registered to the axial FSE image. Next, the average
functional file for each participant was manually moved to align with the hippocampal masks. Once
this image was manually adjusted, all functional files for that participant were then moved to match
the adjusted volume. 23 out of 25 participants’ functional volumes underwent fieldmap correction
using SPM to help correct for distortions in the data (i.e. stretching of anterior temporal lobe and
dropout). ART (Artifact Detection Tool) was used to identify volumes with head movement
artifacts. If the head-movement was larger than 3 standard deviations (SDs) above the global signal
mean and greater than 0.5mm per TR that individual volume was removed.
White matter (WM) and cerebrospinal fluid (CSF) masks were created by segmenting the
MPRAGE volume in SPM12. These masks were then resampled into fMRI space, thresholded at
0.9 tissue probability and manually adjusted in Freeview. (Voxels that overlapped with
hippocampal masks or that clearly represented other tissue types were removed.) The first 3

30
principle eigenvariates from raw WM and CSF signals were extracted using REX toolbox
(http://www.nitrc.org/projects/rex/). These timecourses were filtered to co-vary out the effect of
motion and then used as nuisance regressors in the general linear model (GLM) analysis.
To account for physiological noise in the fMRI data we collected heart rate and breathing
information while participants were in the scanner. Using custom written code based on work by
Glover et al. (2000), Birn et al. (2006), Birn et al. (2008) and Chang et al. (2009), we implemented
a system that created nuisance regressor timecourses modeled after heart rate and breathing
parameters. These timecourses were used in the GLM to control for fMRI signal associated with
heart rate and breathing.
2.8: General Linear Model and HRF Fitting
The typical canonical BOLD (blood oxygen level dependent) response is based on visual
cortex and may not be an appropriate fit for subcortical regions. Therefore this model may not
effectively identify activity occurring in the hippocampus (Devonshire et al., 2012; Handwerker et
al., 2004; Hrybouski et al., 2016; Pernet 2014). To assess the HRF (hemodynamic response
function) in the hippocampus during encoding we deconvolved it using a Finite Impulse Response
(FIR) model in Marsbar (v. 0.43; http://marsbar.sourceforge.net). We modeled all events with their
own regression parameters (encoding of Symbol, Location and Both) for each run of the task (3
betas). After estimates of BOLD were created for each event separately, we averaged signal change
across events where participants remembered at least 1 of 2 retrieval stimuli. For the Symbol
condition 0.20 out of 12 trials were removed per participant on average (5 trials removed overall,
SD = 0.50, Maximum number removed: 2). For the Location condition1.32 out of 12 trials were
removed per participant on average (33 trials removed overall, SD = 1.31,

31
Maximum number removed: 4) For the Both condition 1.20 out of 12 trials were removed per
participant on average (30 trials removed overall, SD = 1.08, Maximum number removed: 3). Next,
these fitted HRF timecourses were averaged across all participants (left and right hemispheres
combined). This provided us with a plot of the hippocampal BOLD response with one point
occurring for each TR (2.5s). Upon visual inspection of the model, it appeared as though the
canonical HRF was a satisfactory fit (See Figure 2.8). The canonical HRF makes assumptions about
when the peak of activity occurs, and how long it lasts (Calhoun et al., 2004). Since stimuli were
presented to participants for 10 seconds we also modeled the HRF using time and dispersion
derivatives in addition to the canonical double gamma function to provide more flexibility in what
would be considered activity (See Figure 2.9).
Figure 2.8: Total Hippocampal HRF fitted to Canonical Modelling. (From Hrybouksi, S)

32
Figure 2.9: Total Hippocampal HRF fitted to Canonical + Derivative Modelling. (From Hrybouski, S)
To implement the time and dispersion derivatives we fit a double-gamma function to the
mean fitted timecourse using the SIMPLEX algorithm (Nelder and Mead, 1965). This was done by
using bootstrapping to optimize parameters of the HRF over 15,000 iterations, minimizing the
difference between the double-gamma function and the FIR timecourse. We used the optimized
double-gamma function and its first order derivative to estimate our BOLD response.
2.9: Imaging Analysis
We completed two sets of analyses using classical canonical HRF modelling and canonical
with time and dispersion derivatives HRF modelling. For the classical canonical HRF modelling
we completed paired t-tests, one-sample t-tests and repeated measures ANOVAs. For the canonical
with time and dispersion derivatives, we used the Bootstrap technique to estimate the standard error
to estimate t statistics and p values. We will discuss similarities and differences observed using
different analyses.

33
Canonical Analysis
HRF modelling was completed using the classical canonical double-gamma function. This
model is often used in fMRI research and makes assumptions about the timing and duration of the
expected response. Due to the stricter nature of this model, it is more conservative and may not
correctly model the HRF for our region of interest (Calhoun et al., 2004). Paired samples t-tests
were used to test for hemisphere effects of total hippocampi, subregions and subfields across
conditions. After discovering there were no significant differences of activation across conditions
with strict corrections for multiple comparisons, hemispheres were collapsed together. One-sample
t-tests were used to compare activity for the total hippocampus bilaterally versus baseline. To
investigate the differential involvement of subfields and subregions, we employed
repeatedmeasures ANOVAs. Holm-Bonferroni was used to control for multiple comparisons and
FWEcorrected values are reported.
Canonical + Derivatives Analysis
HRF modelling was completed using the classical canonical double-gamma function in
addition to time and dispersion derivatives. This is more flexible than the classical canonical HRF,
and therefore allows for more variation in timing and duration of the response. This model is less
conservative and may provide a better fit of the HRF for our data. We relied on nonparametric
methodology to resolve ambiguities produced by multi-parameter BOLD response modelling,
which sometimes yields ambiguous BOLD response estimates, difficult to classify as either
activation or deactivation (Calhoun et al. 2004). The bootstrap technique (100,000 samples) was
used to estimate the standard error when evaluating statistical significance of hippocampal
activations relative to the baseline task. If the bootstrap distribution was approximately normal, we

34
used the standard deviation of the bootstrap distribution to estimate the t-static for a given region
of interest. Otherwise, bootstrap percentile intervals were used to estimate p-values.
HolmBonferroni correction was employed to control for type I error inflation in all tests when
testing for presence of activation relative to the baseline. We controlled for multiple comparisons
across all conditions for the total hippocampus (3: symbol, location and both), all subregions (9:
head/symbol, head/location, head/both, body/symbol, body/location, body/both, tail/symbol,
tail/location, tail/both) and all subfields (9: CA/symbol, CA/location, CA/both, DG/symbol,
DG/location, DG/both, SUB/symbol, SUB/location, SUB/both). Only FWE-corrected results are
reported in the results section. To compare activations between conditions and between
hemispheres we used non-parametric permutation tests. A total of 100,000 within-subject shuffles
were generated to estimate amplitude differences within conditions across subregions (3:
symbol/head&tail, symbol/body&tail, symbol/head&body; 3: location/head&tail,
location/body&tail, location/head&body; 3: both/head&tail, both/body&tail, both/head&body)
and subfields (3: symbol/CA&DG, symbol/CA&SUB, symbol/DG⊂ 3: location/CA&DG,
location/CA&SUB, location/DG⊂ 3: both/CA&DG, both/CA&SUB, both/DG&SUB) under
the null hypothesis. Similar to earlier tests, Holm-Bonferroni correction for multiple comparisons
was applied and only FWE-corrected results are reported. This approach is not often used in the
literature because it requires an extensive programming component and major computations that
require the use of a supercomputer. Both of these conditions have to be met to analyze the variance
of the signal with randomized models and they are not widely available at this time.

35
Chapter 3: Results
3.1: Behavioural Results
Behavioural results show that participants performed best during the Symbol condition
(95.5%). Performance on the more difficult Location and Both conditions was 79.5% and 78.3%
respectively (See Figure 3.1). We used a repeated measures ANOVA to compare accuracy across
conditions. There was a significant main effect of condition (F(2,48) = 26.30, p < 0.001) where
performance on the Symbol condition was higher than on the Location (p < 0.001) and Both (p <
0.001) conditions. There was no significant difference in performance on the Location versus Both
conditions (p = 1.00).
Figure 3.1: Accuracy across conditions displayed in percentage correct. A repeated measures ANOVA demonstrated
that participants performed significantly better during the Symbol than during the Location and Both conditions. Error
bars indicate standard error.

36
3.2: Total Hippocampus
Canonical Modelling
Paired samples t-tests corrected for multiple comparisons revealed there were no significant
differences in BOLD response between left and right total hippocampi across Symbol (t(24) = 0.21,
p = 1.67) Location (t(24) = -0.16, p = 0.87) and Both (t(24) = 2.25, p = 0.10) conditions so they
were collapsed together. One sample t-tests showed that the total hippocampus was significantly
more active than baseline during encoding of the Symbol (t(24) = 5.55, p = 0.000020), Location
(t(24) = 6.76, p = 0.000003) and Both (t(24) = 5.47, p = 0.000013) conditions (See Figure 3.2). A
repeated measures ANOVA with hemisphere and condition as factors was employed to assess
differential activity of total hippocampi across conditions. No significant main effects or
interactions were observed.
Canonical + Derivatives Modelling
There were no laterality effects for the total hippocampus across Symbol (p = 0.66), Location
(p = 0.93) and Both (p = 0.96) conditions using a t-test so left and right total hippocampi were
collapsed together. The total hippocampus was significantly more active than baseline for encoding
of the Symbol, (t(24) = 4.45, p = 0.0005) Location (t(24) = 3.13, p = 0.0046) and Both (t(24) =
3.83, p = 0.0016) conditions (See Figure 3.3). No differences were observed when we compared
the total hippocampal response across different encoding conditions (Symbol vs Location: p =
0.32; Location vs Both: p = 0.53; Symbol vs Both: p = 0.72).

37
Figure 3.2: Activation for the total hippocampus across conditions using canonical modelling and one-sample t-tests
comparing activity relative to baseline. Error bars indicate standard error. (* p < 0.05, ** p < 0.01, *** p < 0.001)
Figure 3.3: Activation for the total hippocampus across conditions using canonical and derivatives modelling and
onesample t-tests comparing activity relative to baseline. Error bars indicate standard error. (* p < 0.05, ** p < 0.01,
*** p < 0.001)
38
3.3: Subregions
Canonical Modelling
Paired samples t-tests revealed no significant differences in BOLD signal between
hemispheres for the hippocampal head, body and tail subregions during encoding of the Symbol,
Location and Both conditions after Holm-Bonferroni correction for multiple comparisons.
Therefore, hemispheres were collapsed together for one-sample t-tests to assess activity relative to
baseline. One sample t-tests showed that the hippocampal head, body and tail were significantly
more active than baseline during encoding of the Symbol (Head: t(24) = 3.40, p =
0.0093; Body: t(24) = 4.72, p = 0.0006; Tail: t(24) = 6.06, p = 0.00003), Location (Head: t(24) =
4.58, p = 0.00007; Body: t(24) = 4.85, p = 0.00005; Tail: t(24) = 3.27, p = 0.0098) and Both (Head:
t(24) = 3.21, p = 0.0075; Body: t(24) = 3.85, p = 0.0039; Tail: t(24) = 2.19, p = 0.039) conditions
after corrections for multiple comparisons across subregions and conditions (See Figure 3.4).
A repeated measures ANOVA (including hemisphere, subregion and condition as factors)
was employed to assess functional heterogeneity of subregions. No significant main effects or
interactions were observed. There were trends observed for hemisphere by condition (F(2,48) =
2.70, MSE = 0.31, p = 0.078) and hemisphere by subregion by condition (F(4,96) = 2.15, MSE =
0.13, p = 0.080) interactions.
Canonical + Derivatives Modelling
No laterality effects were observed in the head, body or tail across Symbol, Location and
Both conditions (Head/Symbol: p = 0.80; Head/Location: p = 0.41; Head/Both: p = 0.52;
Body/Symbol: p = 0.90; Body/Location: p = 0.17; Body/Both: p = 0.24; Tail/Symbol: p = 0.83;
39
Tail/Location: p = 0.22; Tail/Both: p = 0.63). Therefore we collapsed left and right hippocampal
subregions for further analysis.
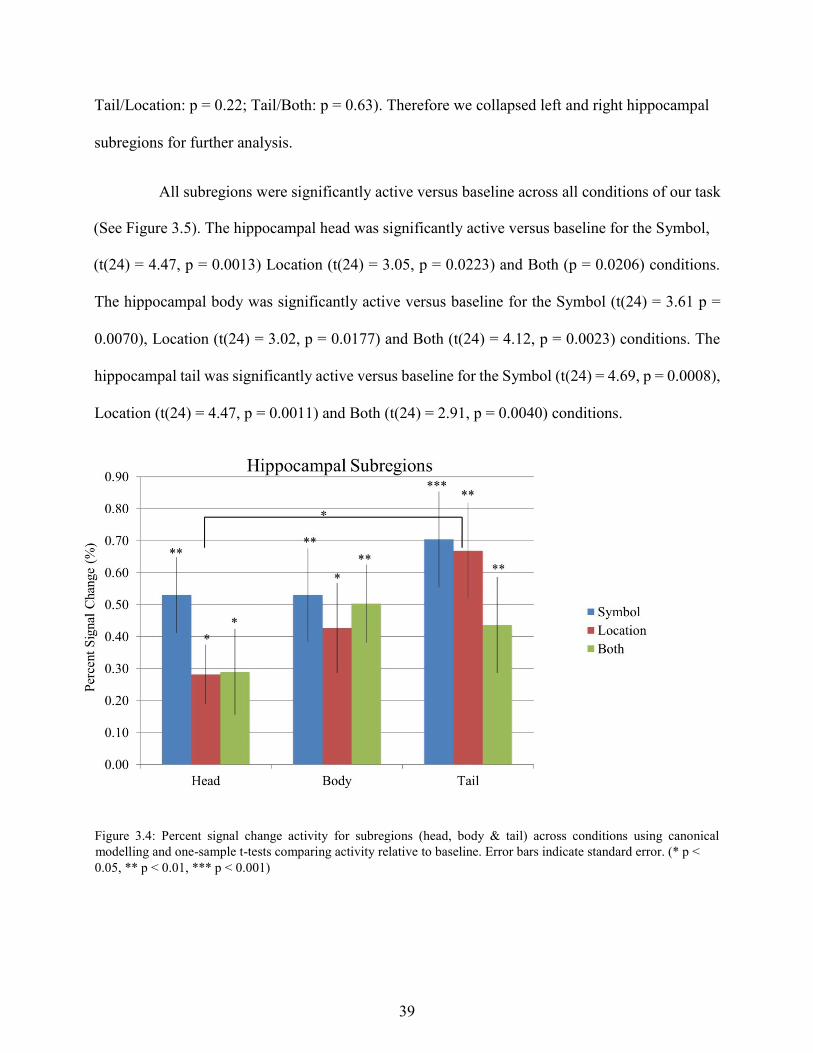
All subregions were significantly active versus baseline across all conditions of our task
(See Figure 3.5). The hippocampal head was significantly active versus baseline for the Symbol,
(t(24) = 4.47, p = 0.0013) Location (t(24) = 3.05, p = 0.0223) and Both (p = 0.0206) conditions.
The hippocampal body was significantly active versus baseline for the Symbol (t(24) = 3.61 p =
0.0070), Location (t(24) = 3.02, p = 0.0177) and Both (t(24) = 4.12, p = 0.0023) conditions. The
hippocampal tail was significantly active versus baseline for the Symbol (t(24) = 4.69, p = 0.0008),
Location (t(24) = 4.47, p = 0.0011) and Both (t(24) = 2.91, p = 0.0040) conditions.
Figure 3.4: Percent signal change activity for subregions (head, body & tail) across conditions using canonical
modelling and one-sample t-tests comparing activity relative to baseline. Error bars indicate standard error. (* p < 0.05, ** p < 0.01, *** p < 0.001)

40
Figure 3.5: Percent signal change activity for subregions (head, body & tail) across conditions using canonical and
derivatives modelling and one-sample t-tests comparing activity relative to baseline. Error bars indicate standard error. (* p < 0.05, ** p < 0.01, *** p < 0.001)
Next, we examined whether there were differences in activity across subregions within a
condition. There was a significant difference between activation in the head vs tail for the Location
condition (p = 0.047), where activation in the tail was significantly higher than in the head. No
significant difference existed between the head and body (p = 0.36) or body and tail (p = 0.31) for
the Location condition. No differences were observed across subregions for the Symbol (head vs
body: p = 1.0; body vs tail: p = 0.27; head vs tail: p = 0.22) or Both conditions (head vs body: p =
0.27; body vs tail: p = 0.72; head vs tail: p = 0.54). Next we compared activation within a subregion
across conditions. No differences were observed across conditions within the head (Symbol vs
Location: p = 0.16; Location vs Both: p = 0.96; Symbol vs Both: p = 0.24) body (Symbol vs
Location: p = 0.60; Location vs Both: p = 0.70; Symbol vs Both: p = 0.89) or tail (Symbol vs
Location: p = 0.88; Location vs Both: p = 0.39; Symbol vs Both: p = 0.15).

41
3.4: Subfields
Canonical Modelling
Paired samples t-tests corrected for multiple comparisons revealed no significant difference
between hemispheres after corrections for multiple comparisons across subfields and conditions,
so hemispheres were collapsed together for one-sample t-tests to assess activity relative to baseline.
One sample t-tests showed that the CA1-3 and DG were significantly active relative baseline during
encoding of the Symbol (CA1-3: t(24) = 4.76, p = 0.00039; DG: t(24) = 6.34, p = 0.000009),
Location (CA1-3: t(24) = 5.00, p = 0.00025; DG: t(24) = 4.61, p = 0.00045) and Both (CA1-3: t(24)
= 2.93, p = 0.015; DG: t(24) = 6.45, p = 0.000008) conditions after corrections for multiple
comparisons across subfields and conditions (See Figure 3.9). The Sub was significantly active
relative to baseline for the Location (t(24) = 5.73, p = 0.000049) and Both (t(24) = 3.93, p = 0.0019)
conditions. Sub activation for the Symbol condition (t(24) = 1.81, p = 0.083) was not significant
relative to baseline, but reflected a trend.
To investigate functional heterogeneity of hippocampal subfield activity we completed a
repeated measures ANOVA with hemisphere, subfield and condition as factors and post-hoc
Bonferroni correction. We observed a significant main effect of subfield (F(2,48) = 5.18, MSE =
0.52, p = 0.0092), where the DG was significantly more active than the CA1-3 across conditions
(p = 0.0007) (See Figure 3.6). We also observed a significant interaction of hemisphere by subfield
(F(2,48) = 4.51, MSE = 0.20, p = 0.016) (See Figure 3.7) and subfield by condition (F(4,96) =
3.36, MSE = 0.19, p = 0.013) (See Figure 3.8). The hemisphere by subfield interaction was
followed up using paired samples t-tests for subfields (averaged across conditions) between
hemispheres. Results showed CA1-3 activity averaged across all conditions was similar for left and

42
right hemispheres (t(24) = -0.22, p = 0.85), while DG (t(24) = 2.17, p = 0.040) and Sub (t(24) =
2.21, p = 0.037) activity differed across hemispheres. The subfield by condition interaction was
followed up using repeated measures ANOVAs for each condition, with subfields as factors.
Results showed that DG activity was greater than CA1-3 (p = 0.0028) and Sub (p = 0.013) activity
for the Symbol condition, DG activity was greater than CA1-3 (p = 0.0006) activity for the Both
condition, and subfield activity did not differ for the Location condition.
Figure 3.6: Percent signal change activity for subfields (CA1-3, DG & SUB) collapsed across conditions and
hemispheres using canonical modelling. A repeated measures ANOVA revealed a main effect of subfield where the
DG is significantly more active than the CA1-3. (*** p < 0.001)

43
Figure 3.7: Percent signal change activity of subfields (CA1-3, DG & Sub) averaged across conditions. A repeated
measures ANOVA revealed a significant Hemisphere by Subfield interaction, where CA1-3 activity was similar for
left and right hemispheres, but DG (p = 0.040) and Sub (p = 0.037) activity was significantly different in left and right
hemispheres.
Figure 3.8: Percent signal change activity for subfields within conditions (collapsed across hemispheres). A repeated
measures ANOVA revealed a significant Condition by Subfield interaction, where DG activity was significantly larger
than CA1-3 (p = 0.0028) and Sub (p = 0.013) during encoding of the Symbol condition, and DG activity was
significantly larger than CA1-3 (p = 0.0006) during encoding of the Both condition.

44
Canonical + Derivatives Modelling
Since we did not observe laterality effects in the CA1-3, DG or Sub across Symbol,
Location and Both conditions (CA1-3/Symbol: p = 0.75; CA1-3/Location: p = 0.58; CA13/Both: p
= 0.51; DG/Symbol: p = 0.49; DG/Location: p = 0.41; DG/Both: p = 0.51; Sub/Symbol: p = 0.23;
Sub/Location: p = 0.75; Sub/Both: p = 0.52) so we collapsed left and right hippocampal subfields
together.
All subfields were significantly more active than baseline across all conditions of our task
(See Figure 3.10). The CA1-3 subfield was significantly active relative to baseline during encoding
of the Symbol (t(24) = 3.92, p = 0.0051) Location (t(24) = 3.86, p = 0.0045) and Both (t(24) = 3.15,
p = 0.013) conditions. The DG subfield was significantly more active than baseline during encoding
of the Symbol (t(24) = 3.89, p = 0.0048), Location (t(24) = 3.82, p = 0.0042) and Both (p = 0.00004)
conditions. The Sub subfield was significantly more active than baseline during encoding of the
Symbol (t(24) = 3.03, p = 0.0116), location (t(24) = 2.99, p = 0.0063) and both (t(24) = 3.74, p =
0.0040) conditions.
Next, we examined whether there were differences in activity across subfields within
Symbol, Location and Both conditions. There were no significant differences across subfields
within Symbol (CA1-3vs DG: p = 0.67; DG vs Sub: p = 0.27; CA1-3vs Sub: p = 0.18), Location
(CA1-3vs DG: p = 0.38; DG vs Sub: p = 0.91; CA1-3vs Sub: p = 0.46) or Both (CA1-3vs DG: p =
0.22; DG vs Sub: p = 0.61; CA1-3vs Sub: p = 0.20) conditions. Next we compared activation within
CA, DG and Sub across conditions. No differences were observed within CA1-3(Symbol vs

45
Location: p = 0.36; Location vs Both: p = 0.68; Symbol vs Both: p = 0.26), DG (Symbol vs
Location: p = 0.83; Location vs Both: p = 0.64; Symbol vs Both: p = 0.56) or Sub (Symbol vs
Location: p = 0.48; Location vs Both: p = 0.94; Symbol vs Both: p = 0.30) across conditions.
Figure 3.9: Percent signal change activity for subfields (CA1-3, DG & SUB) across conditions using canonical
modelling and one-sample t-tests comparing activity relative to baseline. Error bars indicate standard error. (* p < 0.05, ** p< 0.01, *** p < 0.001)
Figure 3.10: Percent signal change activity for subfields (CA1-3, DG & SUB) across conditions using canonical and
derivatives modelling and one-sample t-tests comparing activity relative to baseline. Error bars indicate standard error. (* p < 0.05, ** p< 0.01, *** p < 0.001)

46
Chapter 4: Discussion
Using high-resolution fMRI, an adaptation of the Wechsler Memory Scale Designs Subtest
(2009) and two different methods of HRF modelling we demonstrated that the entire hippocampus
was active bilaterally during the encoding of content, spatial and associative episodic memories
(Symbol, Location and Both conditions respectively). To gain a better understanding of how the
hippocampus encodes memories we measured activity across subfields and subregions. We found
that all subfields and subregions were significantly active for the encoding of Symbol, Location
and Both conditions of our task.
The classical canonical HRF modelling and canonical with time and dispersion derivatives
HRF modelling varied in the number of betas they created and the flexibility of the model. The
classical canonical HRF (double gamma function) used one set of betas, and used a more strict
method of determining the shape of the HRF that was accepted as activity. This model does not
accurately account for waves that peak later than anticipated, or that last for a longer than
anticipated duration (Calhoun et al., 2004) which may occur in our data when participants view the
encoding stimuli over a duration of 10 seconds. The canonical with time and dispersion derivatives
HRF model used 3 sets of betas, and allowed the double gamma function in addition to the time
and dispersion wave forms to be combined which created a more flexible model. The waves that
were accepted as activity did not have to display the typical canonical response in order to
contribute to the overall values measured. Therefore, the canonical with time and dispersion
derivatives model provided a better fit of the HRF function to our data.
The Canonical model showed that when averaged across all conditions the DG was more
active than the CA1-3, and that CA1-3 activity was similar across hemispheres while DG and Sub

47
activity differed. The lack of difference in hippocampal activity observed across hemispheres may
be due to hippocampal commissure connectivity. Previous literature on the rat hippocampus has
shown that the hippocampal commissure connects the CA between hemispheres, but not the DG or
Sub (Hamilton, 1976). The DG was more active than CA1-3 and Sub during the Symbol condition,
and more active than CA1-3 during the Both condition. The Canonical + Derivatives model showed
the hippocampal tail was significantly more active than the hippocampal head for the encoding of
the Location condition. All other differences were not statistically significant, but may reflect
gradients in activation or more subtle differences that may or may not become significant with more
power.
4.1 Comparison Canonical & Canonical + Derivative Results
The results observed using the Canonical model and using the Canonical + Derivatives
model were similar, but some differences do exist. For a summary of differences in findings, see
Table 4.1.
Results for the total hippocampus were similar for the Canonical and Canonical +
Derivatives analyses. No hemisphere effects were observed, and the total hippocampus was active
relative to baseline across all conditions.
Subregion results were similar for the Canonical and Canonical + Derivatives analyses, but
there were also some differences. No hemisphere effects were observed, and all subregions were
active relative to baseline across all conditions. The Canonical repeated measures ANOVA showed
no significant interactions or effects, but trends of Hemisphere by Condition and Hemisphere by
Condition by Subregion. Using the Canonical + Derivatives T-Tests we found a significant
difference between the Head and Tail during the Location condition. It is possible that the

48
Canonical + Derivatives model provided a better fit for the HRF and was able to better assess
differences across subregions.
Subfield results were similar for the Canonical and Canonical + Derivatives analyses, but
there were some differences. No hemisphere effects were observed, and all subfields were active
relative to baseline across all conditions except for the Sub during the Symbol condition using the
Canonical Model (which showed a trend). The Canonical repeated measures ANOVA found a
significant main effect of subregion, and significant interactions of Hemisphere by Subfield and
Subfield by Condition. The Canonical + Derivatives T-Tests did not find any significant
differences between the Subfields across conditions. It appears as though the Canonical Model
found differences that were not observed using the Canonical + Derivatives bootstrapping methods.

49
Canonical + Derivatives:
Bootstrapping,
Resampling & T-Tests
Canonical: ANOVAs
& T-Tests
Total Hippocampus No difference between
hemispheres before
correction for multiple
comparisons.
No difference between
hemispheres after correction
for multiple comparisons.
(Combined hemispheres)
Significantly active versus
baseline across all
conditions
(Combined hemispheres)
Significantly active versus
baseline across all
conditions
T-Tests show no difference
in activity between
conditions.
ANOVA shows no
difference in
activity between
conditions.
Subregions No difference between
hemispheres before
correction for multiple
comparisons.
Difference between hemispheres for
Body_Both after correction
for multiple comparisons
within subregion (*3). If
controlled for multiple
comparisons across
subregions and conditions
(*9), difference would not
survive.
(Combined hemispheres)
All significantly active
versus baseline after
correction for multiple
comparisons
(Combined hemispheres)
All significantly active
versus baseline after
correction for multiple
comparisons within
subregions (*3) and across
subregions and conditions
(*9)
T-Tests show no significant
difference in activity
between subregions and
conditions.
ANOVA shows no
significant effects or
interactions, but does show
trends.

50
N/A ANOVA Trends:
Hemisphere X Condition
(p=0.078)
Hemisphere X Subregion X
Condition (p=0.080)
Subfields No difference between
hemispheres before
correction for multiple
comparisons.
Difference between
hemispheres for DG_Both
& Sub_Both after
correction for multiple
comparisons within subfield
(*3). If controlled for
multiple comparisons across
subfields and conditions
(*9), differences do not
survive.
(Combined hemispheres)
All significantly active
versus baseline after
correction for multiple
comparisons.
(Combined hemispheres)
All significantly active
versus baseline after
correction for multiple
comparisons (*9) EXCEPT
SUB_Symbol (p=0.083)
T-Tests show no significant
difference in activity
between subfields and
conditions.
ANOVA shows significant
main effect and 2
significant interactions
N/A Main effect of Subfield
(p=0.009)
N/A Significant interaction of
Hemisphere X Subfield
(p=0.016) and
Subfield X Condition
(p=0.013)
Table 4.1: Summary of differences observed between Canonical and Canonical + Derivative HRF Modelling

51
4.2: Models of Hippocampal Structure & Function
The purpose of the current study was to investigate how hippocampal subregions and
subfields are involved in the encoding of episodic memory. We wanted to know whether the
hippocampus works as a single unit, in discrete sections or in anatomically separate sections that
are functionally involved.
The first model of hippocampal function states that the hippocampus functions as separate
independent units. It is based on the lamellar hypothesis by Anderson et al. (1971) where
stimulation of the perforant pathway resulted in activation that spread across the hippocampus
transversely (across subfields) and Bliss and Lomo (1973)’s studies that found evidence of
longterm potentiation across subfields. This theory suggests the hippocampus is made up of
lamellae with independent circuits across its length (Small et al., 2002). Our results suggest that the
entire hippocampus was engaged for our task, and does not provide support for this theory.
The second model of hippocampal function states the hippocampus works as a single
functional unit. In Amaral and Witter (1989)’s study they used anterograde and retrograde tracers
in a rodent hippocampus. The tracers travelled across the length of the hippocampus suggesting it
functioned as a single unit. In Pare et al. (1994)’s electrophysiology study they stimulated
entorhinal neurons of a rat. The stimulation resulted activation that spread across the entire length
of the hippocampus. This theory suggests the hippocampus functions as a single unit regardless of
where cortical input enters the hippocampus and disregards the existence of anterior-posterior
subregion specification (Small et al., 2002). Our results provide partial indirect support for this
theory as all subfields and subregions are active relative to baseline across all conditions of our
task. However for the spatial condition of the memory task, there was a significant difference
between the hippocampal head and tail. In addition, the DG was more active than CA1-3 and Sub

52
during the Symbol condition, and more active than the CA1-3 during the Both condition. These
results do not completely agree with the theory that the hippocampus functions as a single unit.
The third model of hippocampal function states that the hippocampus is made up of
functionally segregated but interconnected subregions. Using a memory task for faces, names, and
face-name pairs Small et al. (2002) assessed this theory of hippocampal function in humans using
fMRI. A gradient in activation was observed where when participants heard names the anterior
hippocampus was the most active and when they viewed faces the posterior hippocampus was the
most active. Retrieval of face-name pairs after a short delay elicited the largest activation in the
intermediate hippocampus. If the subregions were functionally separate, activity would be expected
in the most anterior and posterior regions as opposed to the intermediate hippocampus. This is
support for functionally separate, yet interconnected subregions. In the current study we analyzed
hippocampal activation across subregions and subfields during different episodic memory tasks.
While the entire hippocampus was engaged for the symbol, location and both conditions, there
were regional differences in activity suggesting subfields and subregions may be differentially
involved. These variations in activity suggest that while the entire hippocampus is engaged during
the task, there are regional differences in how the information is processed. Our results indirectly
support the third theory of hippocampal function, which claims differential functional involvement
of subregions and subfields.
Many studies have been unable to adequately assess activity across subfields due to limited
spatial resolution. The hippocampus is not a large structure at approximately 3300 mm3 (Malykhin
et al., 2007). Using typical fMRI the voxel size is usually 4-5 mm before spatial smoothing is
applied. This means that cross-sectionally only a few voxels would account for the entire width of
the hippocampus. At this resolution, delineation of subfields would not be feasible since the

53
thickness of CA1-3 and Sub subfields are less than 3 mm. With a strong magnetic field (4.7 T) and
small voxel size (1.5 mm x 1.5 mm x 1.4 mm) we were able to acquire high-resolution data to
accurately investigate differential activity across subfields.
The CA1-3, DG and Sub were all significantly active relative to baseline during the
encoding of the Symbol, Location and Both conditions of our episodic memory task. The
polysynaptic pathway of information flow incorporates all subfields of the hippocampus and is
associated with episodic memory (Duvernoy, 2013). Although the information flow in this model
is much faster than the scale we observe in fMRI, our results are still in agreement with previous
literature where all three subfields were engaged in our task. While all subfields were active across
all conditions of our task, the activity observed was not equal. The difference between DG and
CA1-3 activity averaged across all conditions was statistically significant, where DG activity was
larger. This suggests that overall our task engaged the DG more than the CA1-3. When assessing
activity within conditions, DG activity was significantly larger than CA1-3 and Sub activity during
the Symbol condition, DG activity was significantly larger than CA1-3 during the Both condition
and activity did not significantly differ between subfields during the Location condition.
Hippocampal cortical connections vary along the length of the hippocampus, which lends
support for their division (Poppenk et al., 2013). The head, body and tail were all significantly
active during the Symbol, Location and Both encoding conditions of our episodic memory task.
This suggests that all subregions of the hippocampus were engaged across its entire length during
our task. During the Location condition of our task there was a significant difference between the
head and tail, with the tail eliciting a larger activation. This suggests the hippocampal tail might be
more involved in the encoding of spatial memory than the head.

54
4.3 : Encoding
Previous literature suggests the hippocampus is engaged in the encoding of episodic
memory (Poppenk et al., 2013). The question remains in human literature whether the hippocampus
as a whole is engaged during encoding or if subregions or subfields are selectively involved. While
there is some discrepancy in the field, there are specific subsections of the hippocampus that are
thought to be more actively engaged than others during the encoding of an episodic memory task.
An fMRI study by Parsons et al. (2006) studied medial temporal lobe activity along the
anterior-posterior gradient while participants encoded auditory or visual stimuli. There was
activation in the anterior region regardless of stimulus type for encoding. In addition, a
metaanalysis of PET studies by Lepage et al. (1998) found the anterior hippocampus to be more
engaged during the encoding and the posterior hippocampus more engaged during retrieval of
episodic memory tasks. In the current study we have addressed the question of subregion specificity
during encoding. According to our results, all subregions of the hippocampus are actively engaged
in the encoding of an episodic memory task. Since we are only assessing activation during the
encoding phase we cannot speak to differences between encoding and retrieval. All three
hippocampal subregions appear to be active for the encoding of episodic memory for content,
spatial and associative memory.
While the evidence for subfield involvement in encoding is less clear, reports of a
match/mismatch response or novelty signalling (Reagh et al., 2014) may be related to encoding and
retrieval of spatial details. A study by Duncan et al. (2012) observed a match/mismatch signal in
the CA1 subfield. Participants studied 30 room layouts along with their associated names. The next
day they were re-familiarized with the stimuli prior to entering the MRI scanner. The name of the
room would probe participants and they would then be shown a scene with a varying number of

55
changes to what they had studied. The activity in CA1 was related to the degree of change in the
stimuli participants viewed. The authors suggest the CA1 subfield is involved in tracking changes
in the environment. This type of cognitive process may reflect some features of encoding. While
our delineation of subfields is different, and we analyzed our data in a different way, the current
study does provide further support for the CA1-3 subfield’s involvement in the encoding of
episodic spatial memory.
Our results are not in agreement with previous literature suggesting that hippocampal
subfields are differentially involved in a memory (Duncan et al. 2012 ; Reagh et al., 2014). We
found that all subfields were significantly active during encoding of all conditions of our memory
task. In addition, DG activity was significantly larger than CA1-3 activity across all conditions.
Our results may differ due to differences in subfield segmentation, differences in task structure and
differences in analysis.
4.4: Spatial Memory
Previous literature has suggested the hippocampus plays an important role in spatial
memory (Graham et al., 2010). While previous studies suggest the posterior hippocampus is more
engaged than anterior hippocampus there is still no clear agreement in the field. Most fMRI studies
of hippocampal subfield activity do not directly address spatial memory in comparison to other
kinds of memory (i.e. Duncan et al., 2012; Reagh et al., 2014; Suthana et al., 2015).
Previous literature suggests the posterior hippocampus may be preferentially involved in
spatial memory (Lepage et al., 1998), but when damaged the anterior hippocampus may
compensate and allow humans or rodents to complete spatial tasks. Moser et al (1995) lesioned
rodent hippocampi bilaterally to assess its effect on their spatial learning. The lesions varied from
20% to 100% of total hippocampal volume, from the dorsal or ventral ends. When the ventral

56
(anterior) hippocampus was not intact, and only 26% of the dorsal (posterior) hippocampus was
still intact animals were still able to navigate effectively through a watermaze task. When the dorsal
hippocampus was not intact and as much as 60% of the ventral (anterior) hippocampus remained
intact the animals exhibited impairment in their ability to complete the task.
Our results suggest the entire hippocampus was engaged during a spatial task, as all
subregions were significantly active relative to baseline during the encoding of our spatial episodic
memory task. While all regions were active, there was a significant difference between the
hippocampal head and tail where hippocampal tail activity was larger. The activity observed across
subregions for our study suggests there is a gradient in activation where the posterior hippocampus
(hippocampal tail) is most active for our spatial task, followed by the intermediate hippocampus
(hippocampal body) and then the anterior hippocampus (hippocampal head). This is in line with
previous literature and adds to human studies confirming the posterior hippocampus’ involvement
in spatial memory.
Previous work in our lab (Travis et al. 2014) found that performance on the Wechsler
Memory Scale (2009) was associated with subfield volumes. While visual content memory was
associated with only the CA1-3 volume, visual spatial memory was associated with DG and CA13
volume. This suggests both regions may be related to successful spatial encoding and retrieval. The
current study has confirmed DG and CA1-3 subfields are actively engaged during the encoding of
spatial episodic memory, and also the Sub. Our current findings do not support differential
involvement of subfields for spatial memory. While all subfields were significantly active relative
to baseline for the encoding of the Location condition, it was the only condition where differences
in hippocampal subfield activity were not observed. The hippocampus is known to be active for
spatial memory and it appears as though all subfields contribute to this process.

57
4.5 : Limitations & Future Directions
Our task is designed using abstract symbols, which varies from the traditional everyday
objects, words, familiar faces or room layouts that are often employed in hippocampal memory
tasks (Spaniol et al., 2009). Initially, we anticipated the abstract images would make it difficult for
participants to relate to the stimuli. However, after assessing participant descriptions of memory
strategies it appears that participants made connections to these abstract symbols (i.e. “this symbol
looks like a stethoscope”). Participants related the abstract symbols to previous experience, which
may have resulted in participants forming strong cortical connections for these memories because
of the associative process they were engaging in. This may account for the robust activity observed
across the entire hippocampus during the Symbol condition.
Some limitations of our study exist as limitations across the field of fMRI. Using our 4.7T
system we were able to acquire data with voxel sizes of 1.5 mm x 1.5 mm x 1.5 mm and a TR of
2.5 seconds. These parameters are good for the field, but limit us to inferring activity at 2.5 second
intervals, and 1.5 mm isotropic resolution. While our masks were all created in structural space
with 0.52 x 0.68 x 1 mm3 resolution, they had to be transferred into 1.5 mm space, taking away
some of the specificity created in the original tracings. There is also some discrepancy in the field
as to how to delineate the subfields of the hippocampus which means that our CA1-3 region may
not be a perfect match for the CA2-3 region in another study, etc. This means that when taking
results from other studies and applying them to our project caution must be taken as the regions
may not have absolute overlap. However, this is an issue with all hippocampal fMRI research and
there is a committee developed to address this issue and come up with a harmonized protocol to
improve this problem (Yushkevitch et al., 2015). Future work should keep these discrepancies in
58
subfield delineation in mind and stay up to date on the hippocampal segmentation summit’s
progress.
Due to high accuracy during our task, we are unable to compare correct and incorrect trials
to look at subsequent memory effects. Future work could modify sections of the task to increase
difficulty by adding more items to remember and allow for this type of analysis. We were able to
detect a significant difference in activation during all conditions of our task versus baseline, the
differences observed across subregions and subfields, and across conditions were limited. The next
step in our analysis will be to analyze activity in the anterior (head) versus posterior (body and tail)
hippocampus. Future research could focus on one condition of our task and acquire more data to
give more power in analysis. This could confirm whether the patterns we see in the current study
are indicative of strong differences in subregion and subfield activity or not, and could provide
stronger support for the use of classical Canonical or Canonical + Derivative modelling.
4.6: Summary
With the use of high-resolution fMRI, adaptation of a standard clinical episodic memory
task based on Wechsler Memory Scale (2009), and an advanced manual segmentation protocol for
hippocampal subfields and subregions we investigated how the hippocampus encodes episodic
memory. Using classical Canonical modelling and Canonical with derivative modelling we found
that the total hippocampus in addition to all subfields and all subregions were significantly active
relative to baseline during the encoding phase of the Symbol, Location and Both conditions of our
task. This suggests the hippocampus as a whole and its smaller parts are engaged in the encoding
of episodic content, spatial and associative memory. The Canonical + Derivatives model showed
the hippocampal tail was more active than the hippocampal head for the location condition of our
task, providing support for the posterior hippocampus’ preferential involvement in spatial memory.

59
The Canonical model showed that when averaged across all conditions the DG was more active
than CA1-3, and that CA1-3 activity was similar across hemispheres while DG and Sub activity
differed. The DG was more active than CA1-3 and Sub during the Symbol condition, and more
active than CA1-3 during the Both condition. Our use of two different HRF models and analysis
procedures showed that the way you analyze your data could modify your results. Some approaches
are more sensitive than others for assessing differential activity. Our study contributes to current
knowledge of how the human hippocampus encodes episodic memories.

60
References
Aksoy-Aksel, A & Manaham-Vaughan, D. (2013). The temporoammonic input to the
hippocampal CA1 region displays distinctly different synaptic plasticity compared to the Schaffer
collateral input in vivo: significance for synaptic information processing. Frontiers in Synaptic
Neuroscience. 5, 1-12.
Amaral, D.G., Witter, M.P. (1989). The three-dimensional organization of the hippocampal
formation: a review of anatomical data. Neuroscience. 31, 571-591.
Anderson, P, Bliss, T.V., Skrede, K.K. (1971). Lamellar organization of hippocampal pathways.
Experimental Brain Research. 13, 222-238.
Baumann, O. & Mattingley, J. B. (2013). Dissociable representations of environmental size and
complexity in the human hippocampus. Journal of Neuroscience. 33, 10526–10533.
Birn, R.M., Diamond, J.B., Smith, M.A. & Bandettini, P.A. (2006). Separating
respiratoryvariation-related fluctuations from neuronal-activity-related fluctuations in fMRI.
Neuroimage. 31, 1536-1548.
Birn, R.M., Smith, M.A., Jones, T.B. & Bandettini, P.A. (2008). The respiration response function:
The temporal dynamics of fMRI signal fluctuations related to changes in respiration. Neuroimage.
40, 644-654.
Bliss, T.V., Lomo, T. (1973). Long-lasting potentiation of synaptic transmission in the dentate area
of the anaesthetized rabbit following stimulation of the perforant path. The Journal of
Physiology. 232, 331-356.

61
Calhoun, V.D., Stevens, M.C., Pearlson, G.D. & Kiehl, K.A. (2004). fMRI analysis with the general
linear model: removal of latency-induced amplitude bias by incorporation of hemodynamic
derivative terms. Neuroimage. 22, 252–257.
Chang, C., Cunningham, J.P. & Glover, G.H. (2009) Influence of heart rate on the BOLD signal:
The cardiac response function. Neuroimage. 44, 857-869.
De Vanssay-Maigne, A. Noulhiane, M., Devauchelle, A.D., Rodrigo, S., Baudoin-Chial, S., Meder,
J.F., Oppenheim, C., Chiron, C. & Chassoux, F. (2011). Modulation of encoding and retrieval by
recollection and familiarity: Mapping the medial temporal lobe networks. Neuroimage. 58,
11311138.
Devonshire, I.M., Papadakis, N.G., Port, M., Berwick, J., Kennerly, A.J., Mayhew, J.E.W.,
Overton, P.G., 2012. Neurovascular coupling is brain region-dependent. Neuroimage 59, 1997–
2006.
Duncan K., Ketz N., Inati S.J. & Davachi L. (2012). Evidence for area CA1 as a match/mismatch
detector: a high-resolution fMRI study of the human hippocampus. Hippocampus. 22(3), 389398.
Duvernoy, H.M. (2005). The human hippocampus: Functional anatomy, vascularization, and serial
sections with MRI. Berlin Heidelberg: Springer-Verlag
Duvernoy, H.M., Cattin, F., Risold, P.Y. (2013). The human hippocampus: Functional anatomy,
vascularization, and serial sections with MRI.Berlin Heidelberg: Springer-Verlag
Eichenbaum, H. (2001). The hippocampus and declarative memory: cognitive mechanisms and
neural codes. Behavioural Brain Research. 127(1-2), 199-207.

62
Glover, G.H., Li, T. & Ress, D. (2000). Image-based method for retrospective correction of
physiological motion effects in fMRI: RETROICOR. Magnetic Resonance in Medicine. 44,
162167.
Graham, K.S., Barense, M.D. & Lee, A.C.H. (2010). Going beyond LTM in the MTL: A synthesis
of neuropsychological and neuroimaging findings on the role of the medial temporal love in
memory and perception. Neuropsychologia. 48, 831-853.
Hamilton, L.W. (1976). Basic Limbic System Anatomy of the rat. Heidelberg: Springer-Verlag US
Handwerker, D.A., Ollinger, J.M., D'Esposito, M., 2004. Variation of BOLD hemodynamic
responses across subjects and brain regions and their effects on statistical analyses. Neuroimage
21, 1639–1651.
Hartley, T., Maguire, E. A., Spiers, H. J. & Burgess, N. (2003). The well-worn route and the path
less traveled: distinct neural bases of route following and wayfinding in humans. Neuron, 37,
877888.
Hawrylycz, M.J., Lein, E.S., Guillozet-Bongaarts, A.L., Shen, E.H., Ng, L., Miller, J.A., van de
Lagemaat, L.N., Smith, K.A., Ebbert, A., Riley, Z.L., Abajian, C., Beckmann, C.F., Bernard, A.,
Bertagnolli, D., Boe, A.F., Cartagena, P.M., Chakravarty, M.M., Chapin, M., Chong, J., Dalley,
R.A., Daly, B.D., Dang, C., Datta, S., Dee, N., Dolbeare, T.A., Faber, V., Feng, D., Fowler,
D.R., Goldy, J., Gregor, B.W., Haradon, Z., Haynor, D.R., Hohmann, J.G., Horvath, S., Howard,
R.E., Jeromin, A., Jochim, J.M., Kinnunen, M., Lau, C., Lazarz, E.T., Lee, C., Lemon, T.A., Li,
L., Li, Y., Morris, J.A., Overly, C.C., Parker, P.D., Parry, S.E., Reding, M., Royall, J.J.,
Schulkin, J., Sequeira, P.A., Slaughterbeck, C.R., Smith, S.C., Sodt, A.J., Sunkin, S.M., Swanson,

63
B.E., Vawter, M.P., Williams, D., Wohnoutka, P., Zielke, H.R., Geschwind, D.H., Hof, P.R., Smith,
S.M., Koch, C., Grant, S.G., Jones, A.R. (2012). An anatomically comprehensive atlas of the adult
human brain transcriptome. Nature. 489, 391–399.
Insausti, R. (1993). Comparative anatomy of the entorhinal cortex and hippocampus in mammals.
Hippocampus. 3, 19–26.
Jeneson, A. & Squire, L.R., (2011). Working memory, long-term memory, and medial temporal
lobe function. Learning & Memory, 19(1), 15-25.
Leal, S.L., Tighe, S.K., Jones, C.K. & Yassa, M.A. (2014). Pattern separation of emotional
information in hippocampal dentate and CA3. Hippocampus. 24, 1146-1155.
Lepage, M., Habib, R. & Tulving, E. (1998). Hippocampal PET activations of memory encoding and retrieval: the HIPER model. Hippocampus. 8(4), 313-322.
Malykhin, N.V., Lebel, R.M., Coupland, N.J., Wilman, A.H., & Carter, R. (2010). In vivo
quantification of hippocampal subfields using 4.7 T fast spin echo imaging.
Neuroimage, 49,1224-30.
Malykhin, N.V., Bouchard, T.P., Ogilvie, C.J., Coupland, N.J., Seres, P., Camicioli, R., (2007).
Three-dimensional volumetric analysis and reconstruction of amygdala and hippocampal head,
body and tail. Psychiatry Research: Neuroimaging. 155(2), 155–165.
Mayes, A., Montaldi, D. & Migo, E. (2007). Associative memory and the medial temporal lobes.
Trends in Cognitive Sciences. 11(3), 126-135.
Milner B, Corkin S, & Teuber HL. (1968). Further analysis of the hippocampal amnesic syndrome:
14 year follow-up study of H.M. Neuropsychologia. 6, 215–34.

64
Moser, M.B., Moser, E.I., Forrest, E., Andersen, P. & Morris, R.G.M. (1995). Spatial learning with
a minislab in the dorsal hippocampus. Proceedings of the National Academy of Sciences of the
United States. 92, 9697 –9701.
Nelder, J.A. & Mead, R. (1965). A simplex method for function minimization. The Computer
Journal. 7, 308–313.
Neuner, I., Stocker, T., Kellermann, T., Kircher, T., Zilles, K., Schneider, F. & Shah, N.J. (2007).
Wechsler memory scale revised edition: Neural correlates of the visual paired associates subtest
adapted for fMRI. Brain Research. 1177, 66-78.
Olson IR, Moore KS, Stark M, Chatterjee A. (2006). Visual working memory is impaired when the
medial temporal lobe is damaged. Journal of Cognitive Neuroscience, 18. 1087–1097. Pare, D.,
Llinas, R. (1994). Non-lamellar propagation of entorhinal influences in the hippocampal formation:
multiple electrode recordings in the isolated guinea pig brain in vitro. Hippocampus. 4, 403-409.
Parsons, M.W., Haut, M.W., Lemieux, S.K., Moran, M.T. & Leach, S.G. (2006). Anterior medial
temporal lobe activation during encoding of words: fMRI methods to optimize sensitivity. Brain
and Cognition. 60(30). 253-261.
Pernet, C.R., 2014. Misconceptions in the use of the General Linear Model applied to functional
MRI: a tutorial for junior neuro-imagers. Front. Neurosci. 8, 1.
Piekema, C. Kessels, R.P.C., Rijpkema, M. & Fernandez, G. (2009). The hippocampus supports
encoding of between-domain associations within working memory. Learning & Memory. 16,
231234.
Piekema, C., Rijpkema, M., Fernandez, G. & Kessels, R.P.C. (2010). Dissociating the neural
correlates of intra-item and inter-item working-memory binding. Plos One. 5(4), 1-8.

65
Poppenk, J., Evensmoen, H.R., Moskovitch, M. & Nadel, L. (2013). Long-axis specialization of
the human hippocampus. Trends in Cognitive Neuroscience. 17(5), 230-240.
Reagh, Z.M. Watabe, J., Ly, M., Murray, E. & Yassa, M.A. (2014). Dissociated signals in human
dentate gyrus and CA3 predict different facets of recognition memory. Journal of Cognitive
Neuroscience. 34(40), 546-559.
Sadeh, T., Maril, A. & Goshen-Gottstein, Y. (2012). Encoding-related brain activity dissociates
between the recollective processes underlying successful recall and recognition: a
subsequentmemory study. Neuropsychologia. 50, 2317-24.
Schultz, H., Sommer, T. & Peters, J. (2012). Direct evidence for domain-sensitive functional
subregions in human entorhinal cortex. The Journal of Neuroscience. 32(14). 4716-4723.
Scoville, W.B., & Milner, B. (1957). Loss of recent memory after bilateral hippocampal lesions.
Journal of Neurology, Neurosurgery, and Psychiatry, 20, 11-21.
Small, S.A. (2002). The longitudinal axis of the hippocampal formation: Its anatomy, circuitry, and
role in cognitive function. Reviews in the Neurosciences. 13(2), 183-194.
Spaniol, J., Davidson, P.S., Kim A.S., Moscovitch, M. & Grady, C.L. (2009). Event-related fMRI
studies of episodic encoding and retrieval: meta-analyses using activation likelihood estimation.
Neuropsychologia. 47, 1765–1779
Squire, L.R. & Dede, A.J., (2015). Conscious and unconscious memory systems. Cold Harbor
Perspectives in Biology, 7(3), 1-14.
Squire L.R., Genzel L., Wixted J.T. & Morris RG. (2015). Memory Consolidation. Cold Spring
Harbor Perspectives in Biology, 7(8), 1-21.

66
Squire, L.R. & Wixted, J.T. (2011). The cognitive neuroscience of human memory since H.M.
Annual Review of Neuroscience. 34, 259-288.
Squire, L.R. & Zola, S.M. (1996). Structure and function of declarative and nondeclarative memory
systems. Proceedings of the National Academy of Sciences. 93, 13515-13522.
Strange, B.A., Fletcher, P.C., Henson, R.N.A., Friston, K.J. & Dolan, R.J. (1999). Segregating the
functions of human hippocampus. Proceedings of the National Academy of Sciences, 96, 4034–
4039.
Strange, B.A., Witter, M.P., Lein, E.S. & Moser, E.I. (2014). Functional organization of the
hippocampal longitudinal axis. Nature Reviews Neuroscience. 15, 655-669.
Stokes, J., Kyle, C. & Ekstrom, A.D. (2015). Complementary roles of human hippocampal
subfields in differentiation and integration of spatial context. Journal of Cognitive Neuroscience.
27(3), 546-559.
Suthana, N.A. Donix, M. Wozny, D.R. Bazih, A., Jones, M., Heidermann, R.M., Trampel, R.,
Ekstrom, A.D., Scharf, M., Knolton, B., Turner, R. & Bookheimer, S.Y. (2015). High-resolution
7T fMRI of human hippocampal subfields during associative learning. Journal of Cognitive
Neuroscience. 27(6), 1194-1206.
Travis, S.G., Huang, Y., Fujiwara, E., Radomnki, A., Olsen, F., Carter, R., Seres, P., & Malykhin,
N.V. (2014). High field structural MRI reveals specific episodic memory correlates in the subfields
of the hippocampus.Neuropsychologia, 53. 233-245
Tulving, E. (2002). Episodic memory: From mind to brain. Annual Review of Psychology. 53(1),
1-25.

67
Wechsler, D. (2009). Wechsler Memory Scale-IV administration and scoring manual. San Antonio,
TX: Pearson.
Wixted, J.T., Mickes, L. & Squire, L.R. (2010). Measuring recollection and familiarity in the
medial temporal lobe. Hippocampus. 20(11), 1195-1205.
Yushkevich, P.A., Amaral, R.S.C., Augustinack, J.C, Bender, A.R., Bernstein, J.D., Boccardi,
M., Bocchetta, M., Burggren, A.C., Carr, V.A., Chakravarty, M.M., Chetelat, G., Daugherty,
A.M., Davachi, L., Ding, S., Ekstrom, A., Geerlings, M.I., Hassan, A., Huang, Y., Iglesias, J.E.,
La Joie, R., Kerchner, G.A., LaRocque, K.F., Libby, L.A., Malykhin, N., Mueller, S.G., Olsen,
R.K., Palombo, D.J., Parekh, M.B., Pluta, J.B., Preston, A.R., Pressner, J.C., Ranganath, C., Raz,
N., Schlichting, M.L., Schoemaker, D., Singh, S., Stark, C.E.L., Suthana, N., Tompary, A.,
Turowski, M.M., Leemput, K.V., Wagner, A.D., Wang, L., Winterburn, J.L., Wisse, L.E.M., Yassa,
M.A. & Zeineh, M.M. (2015) Quantitative comparison of 21 protocols for labeling hippocampal
subfields and parahippocampal cortical subregions in vivo mri: Towards developing a harmonized
segmentation protocol. Neuroimage. 111, 526-41.
Zeineh, M.M., Engel, S.A., Thompson, P.M., & Bookheimer, S.Y. (2003). Dynamics of the
hippocampus during encoding and retrieval of face–name pairs. Science, 299, 577–580.


![MAP UNIT DESCRIPTIONS OF SUBREGIONS (SECTIONS) OF THE ... · Description of ecological subregions: sections of the conterminous United States [CD-ROM]. Gen. Tech. Report WO-76B. Washington,](https://static.fdocuments.us/doc/165x107/5f0acf117e708231d42d7220/map-unit-descriptions-of-subregions-sections-of-the-description-of-ecological.jpg)


