The Full Portfolio - EPRImydocs.epri.com/docs/public/DiscussionPaper2007.pdfThe Full Portfolio...
45
The Power to Reduce CO 2 Emissions The Full Portfolio D ISCUSSION P APER Prepared for the EPRI 2007 Summer Seminar By The EPRI Energy Technology Assessment Center
-
Upload
trinhxuyen -
Category
Documents
-
view
214 -
download
1
Transcript of The Full Portfolio - EPRImydocs.epri.com/docs/public/DiscussionPaper2007.pdfThe Full Portfolio...

The Power to Reduce CO2 EmissionsThe Full Portfolio
Discussion PaPer
Prepared for the EPRI 2007 Summer Seminar By The EPRI Energy Technology Assessment Center

ELECTRIC POWER RESEARCH INSTITUTE 3420 Hillview Avenue, Palo Alto, California 94304-1338 ▪ PO Box 10412, Palo Alto, California 94303-0813 ▪ USA
800.313.3774 ▪ 650.855.2121 ▪ [email protected] ▪ www.epri.com
The Power to Reduce CO2 Emissions
The Full Portfolio
Discussion Paper
August 2007
Prepared for the EPRI 2007 Summer Seminar Attendees
By
The EPRI Energy Technology Assessment Center
DISCLAIMER OF WARRANTIES AND LIMITATION OF LIABILITIES
THIS DOCUMENT WAS PREPARED BY THE ORGANIZATION(S) NAMED BELOW AS AN ACCOUNT OF WORK SPONSORED OR COSPONSORED BY THE ELECTRIC POWER RESEARCH INSTITUTE, INC. (EPRI). NEITHER EPRI, ANY MEMBER OF EPRI, ANY COSPONSOR, THE ORGANIZATION(S) BELOW, NOR ANY PERSON ACTING ON BEHALF OF ANY OF THEM:
(A) MAKES ANY WARRANTY OR REPRESENTATION WHATSOEVER, EXPRESS OR IMPLIED, (I) WITH RESPECT TO THE USE OF ANY INFORMATION, APPARATUS, METHOD, PROCESS, OR SIMILAR ITEM DISCLOSED IN THIS DOCUMENT, INCLUDING MERCHANTABILITY AND FITNESS FOR A PARTICULAR PURPOSE, OR (II) THAT SUCH USE DOES NOT INFRINGE ON OR INTERFERE WITH PRIVATELY OWNED RIGHTS, INCLUDING ANY PARTY'S INTELLECTUAL PROPERTY, OR (III) THAT THIS DOCUMENT IS SUITABLE TO ANY PARTICULAR USER'S CIRCUMSTANCE; OR
(B) ASSUMES RESPONSIBILITY FOR ANY DAMAGES OR OTHER LIABILITY WHATSOEVER (INCLUDING ANY CONSEQUENTIAL DAMAGES, EVEN IF EPRI OR ANY EPRI REPRESENTATIVE HAS BEEN ADVISED OF THE POSSIBILITY OF SUCH DAMAGES) RESULTING FROM YOUR SELECTION OR USE OF THIS DOCUMENT OR ANY INFORMATION, APPARATUS, METHOD, PROCESS, OR SIMILAR ITEM DISCLOSED IN THIS DOCUMENT.
ORGANIZATION(S) THAT PREPARED THIS DOCUMENT
The EPRI Energy Technology Assessment Center
NOTE
For further information about EPRI, call the EPRI Customer Assistance Center at 800.313.3774 or e-mail [email protected].
Electric Power Research Institute, EPRI, and TOGETHER…SHAPING THE FUTURE OF ELECTRICITY are registered service marks of the Electric Power Research Institute, Inc.
Copyright © 2007 Electric Power Research Institute, Inc. All rights reserved.

ACKNOWLEDGMENTS
The lead authors of this paper were Revis James, Richard Richels, Geoff Blanford and Steve Gehl. The following EPRI staff members provided substantial contributions to this paper:
Hank Courtright Bryan Hannegan Ken Huffman Tom Key Chris Larsen Arshad Mansoor Mark McGranaghan Dave Modeen Jack Parkes Ellen Petrill Tom Reddoch Steve Specker Gary Vine Tom Wilson
Brian Schimmoller (EPRI) provided invaluable editing support. David Victor (Stanford University) provided important insights during development of the content and organization of the report. John Douglas, Rich Myhre, and Brent Barker provided technical writing support. Rick Moore provided graphics and report production support.

CONTENTS
1 INTRODUCTION ....................................................................................................................1-1
2 ELECTRICITY TECHNOLOGY UNDER A CARBON-CONSTRAINED FUTURE (PRISM ANALYSIS) ..................................................................................................................2-1
The Technology Portfolio ......................................................................................................2-1 Analysis Approach and Key Assumptions.............................................................................2-2 Results ..................................................................................................................................2-3 PRISM Conclusions ..............................................................................................................2-5
3 TECHNOLOGY DEVELOPMENT PATHWAYS.....................................................................3-1 Distribution Enabled Technologies - Energy Efficiency, PHEVs, DER..................................3-2 Transmission Enabled Technologies - Renewable Energy...................................................3-5 Nuclear Technology Development and Deployment .............................................................3-7 Advanced Coal With CO2 Capture and Storage..................................................................3-10 Estimated Funding Needs for Technology Pathways..........................................................3-14
4 ECONOMIC ASSESSMENT (MERGE)..................................................................................4-1 Analysis Approach ................................................................................................................4-1 MERGE Results ....................................................................................................................4-3
5 CONCLUSIONS .....................................................................................................................5-1
A PRISM ANALYSIS TARGETS.............................................................................................. A-1 Overview of PRISM Analysis................................................................................................ A-1
B MERGE TECHNOLOGY INPUT ASSUMPTIONS................................................................ B-1
C REFERENCES...................................................................................................................... C-1

1-1
1 INTRODUCTION
The large-scale CO2 reductions envisioned to stabilize, and ultimately reverse, global atmospheric CO2 concentrations present major technical, economic, regulatory and policy challenges. Reconciling these challenges with the continued growth in energy demand highlights the need for a diverse, economy-wide approach.
This Discussion Paper provides stakeholders with a framework for developing a research, development, and demonstration (RD&D) Action Plan that will enable sustainable and substantial electricity sector CO2 emissions reductions over the coming decades. The technology development pathways and specific research activities discussed in this paper provide a basis for a detailed Action Plan to be published later this year incorporating input from participants in the 2007 EPRI Summer Seminar.
The analyses summarized in this paper address the technical feasibility for the sector to achieve large-scale CO2 emissions reductions, the technology development pathways and associated RD&D funding needed to achieve this potential, and the economic impact of realizing emissions reduction targets. Given the 20- to 30-year lead-time needed to fully research, develop, and commercially deploy technologies, it is critical for the industry to define priorities and initiate RD&D activities.
The assessment involves three related EPRI studies:
• The PRISM analysis, which determined the U.S. electricity sector’s potential for reducing CO2 emissions from a purely technical perspective, based on deployment of a portfolio of advanced technologies.
• A technology development pathways analysis, which identified the sequence of research, development, and demonstration (RD&D) steps needed to achieve the necessary technology performance and deployment levels, and developed preliminary estimates of the RD&D investment required.
• The MERGE analysis, which assessed the economic value of deploying the full technology portfolio analyzed in the PRISM analysis, and projected the least-cost combination of technologies needed to meet a specified CO2 emission reduction requirement.

2-1
2 ELECTRICITY TECHNOLOGY UNDER A CARBON-CONSTRAINED FUTURE (PRISM ANALYSIS)
Based on a “bottoms-up” review of technology performance capabilities and deployment potential, EPRI has developed a technical assessment of the feasibility for future U.S. electricity sector CO2 emissions reductions. This so-called “PRISM” analysis (from the colorful appearance of the graphical results) represents an estimate of the potential electric sector CO2 emission reductions, in that it focuses solely on technical capabilities assuming no economic or policy constraints.
The Technology Portfolio
The PRISM analysis assumes successful achievement of performance and deployment targets associated with several advanced technologies as a basis for estimating CO2 emissions reduction potential:
• End-use energy efficiency
• Renewable energy
• Advanced light water nuclear reactors
• Advanced coal power plants
• CO2 capture and storage
• Plug-in hybrid electric vehicles
• Distributed energy resources
The technologies considered and the selection of “aggressive but feasible” analysis targets were based on capabilities that still face substantive research, development, demonstration, and/or deployment challenges, but for which a specific sequence of RD&D activities can be identified that will achieve wide-scale deployment of the technologies between today and 2030. Capabilities requiring assumption of break-through technology developments or which have deployment timelines past 2030 were excluded from the analysis.
The Table 2-1 below compares the analysis targets used in the PRISM analysis with those in the U.S. Energy Information Administration’s (EIA) 2007 Annual Energy Outlook Base Case [AEO 2007]. A more detailed discussion of the analysis targets can be found in Appendix A.

Electricity Technology Under a Carbon-Constrained Future (PRISM Analysis)
2-2
Table 2-1
Analysis Approach and Key Assumptions
To estimate potential CO2 emissions reductions, the PRISM analysis calculated a different national electricity generation mix based upon the technical targets described above, and then calculated the change in CO2 emissions relative to the EIA 2007 Annual Energy Outlook [AEO 2007] Base Case. The emissions reduction is calculated for each technology separately over time and graphed relative to the emissions indicated in the EIA base case. The Figure 2-1 below schematically illustrates the analytical approach for the PRISM analysis:

Electricity Technology Under a Carbon-Constrained Future (PRISM Analysis)
2-3
Source Data:EIA Annual Energy
Outlook 2007
Technology Development and
Deployment Assumptions
Generation Changes due to
Technology Implementation
CO2 Emissions Reductions
For each technology:
• Energy efficiency
• Renewables
• Advanced coal
• Nuclear
• Carbon capture and sequestration
• PHEVs
• Distributed energy resources
Simplified PRISM Analytical Approach
Figure 2-1
Results
As shown in the Figure 2-2 below, the aggressive development and deployment of several advanced technologies could reduce U.S. electricity sector CO2 emissions by roughly 45% by 2030, relative to estimates in the EIA 2007 Annual Energy Outlook [AEO 2007] Base Case. Most importantly, the PRISM analysis indicates that the rising trend in CO2 emissions from the U.S. electricity sector can be slowed, stopped and ultimately turned around.
The aggressive implementation of advanced technologies provides a significant shift in the generation mix compared to projections in the 2007 Annual Energy Outlook [AEO 2007] Base Case (see Figure 2-3 below). Coal remains a critical part of U.S. electricity supply, albeit with CO2 capture; nuclear energy and renewables expand their share; and natural gas-fired generation declines. Also note that the estimated total electricity consumption in 2030 remains approximately the same in both the EIA and PRISM analyses. This is due to improvements in energy efficiency and to the movement of load to distributed generation, offset by increased electricity demand associated with plug-in hybrid electric vehicles (PHEVs).

Electricity Technology Under a Carbon-Constrained Future (PRISM Analysis)
2-4
Figure 2-2
Figure 2-3

Electricity Technology Under a Carbon-Constrained Future (PRISM Analysis)
2-5
PRISM Conclusions
Several important conclusions derive from the PRISM results:
• The emissions “profile” for the U.S. electricity sector as it aggressively implements advanced technologies would represent a slowing, stopping, and eventually declining level of annual CO2 emissions. Such a curve shape may be necessary to comply with future carbon policies and to contribute to global efforts to stabilize atmospheric greenhouse gas concentrations.
• Achieving the indicated emissions reductions requires deployment of a diverse set of new and existing technologies, none of which will provide the majority of potential reductions. In other words, there is no “silver bullet” that represents the bulk of emissions-reducing potential.
• Consequently, if one or more of these technology options are not available, even more aggressive levels of technology performance and deployment would be necessary in the remaining technology areas to achieve the estimated emissions-reduction potential.
• Key enabling grid-related technologies are needed to fully realize the emissions-reduction potential associated with end-use efficiency, renewables, plug-in hybrid electric vehicles, and distributed energy resources.

3-1
3 TECHNOLOGY DEVELOPMENT PATHWAYS
EPRI’s evaluation of the implications of the PRISM analysis reveals four key strategic technology deployment challenges that must be met for the U.S. electricity sector to significantly reduce CO2 emissions over the coming decades: • Deployment of smart distribution grids and communications infrastructures to enable
widespread end-use efficiency technology deployment, distributed generation, and plug-in hybrid electric vehicles.
• Deployment of transmission grids and associated energy storage infrastructures with the capacity and reliability to operate with 20-30% intermittent renewables in specific regions of the United States.
• Deployment of advanced light water reactors enabled by continued safe and economic operation of the existing nuclear fleet.
• Deployment of commercial-scale coal-based generation units operating with 90% CO2 capture and with the associated infrastructures to transport and sequester the captured CO2.
The specific technologies associated with each of these challenges are at various stages of development. However, common to all is the need for sustained, substantial RD&D to accelerate commercial deployment and meet the aggressive targets established in the PRISM analysis for 2030. The following sections detail the technology development pathways associated with each of the challenges. The research milestones and deployment targets described below represent critical guideposts in addressing the strategic challenges. EPRI is developing a detailed RD&D Action Plan for release in late 2007.
Challenge 1: Distribution-enabled technologies— deployment of smart distribution grids and communications infrastructures to drive broader commercialization of end-use energy efficiency (EE), distributed energy resources (DER), and plug-in hybrid electric vehicles (PHEVs).
While active RD&D and commercial development is advancing the capabilities of distribution-enabled technologies – such as energy efficient devices, distributed energy resources, and plug-in hybrid electric vehicles – their widespread deployment requires a smart, interactive infrastructure, including a range of solutions that can be integrated all along the distribution system. To reduce both energy consumption and CO2 emissions to levels consistent with those estimated in the PRISM analysis, greater synergy is needed between energy consuming and producing devices and the electrical distribution system.

Technology Development Pathways
3-2
Technology Development Pathways
Technology development pathways are described below for the grid-enabled technologies that will enable widespread commercialization of EE, DER and PHEVs. The accompanying timeline shows key research milestones and deployment targets.
Distribution Enabled Technologies
Figure 3-1
Energy Efficiency and Distributed Energy Resources
Energy-efficient technologies provide many of the most cost-effective, near-term options for CO2 emissions reduction, since many can be deployed faster and at lower cost than supply-side options such as new central power stations. The impact of EE on CO2 emissions includes not only the load that it directly reduces, but also the new generation that it defers, buying time for incrementally cleaner and more efficient generation to come on-line. Distributed energy resources deliver electricity closer to the point of use, better matching demand with supply, and mitigating the need for new generation and transmission facilities.

Technology Development Pathways
3-3
Key research milestones and deployment targets include: • By 2010, ensure standards for interoperability are in place, and the advanced meter
infrastructure (AMI) has the capability for real-time data acquisition and dynamic energy management. This is the beginning of the information technology and communication backbone of the smart distribution system.
• By 2012, complete pilot projects to assess the capability of dynamic energy management based upon first-generation AMI, providing real-time pricing signals and emergency demand condition signals to smart devices.
• By 2015, ensure that smart resources are built to standards. End-use devices and DER are routinely manufactured with interactive intelligence built into their operating systems based upon accepted communication standards.
• By 2020, ensure AMI can be integrated with smart resources (smart end-use devices and smart DER), allowing consumers to optimize energy use.
Plug-In Hybrid Electric Vehicles
Plug-in hybrid vehicles, building upon the engineering and market acceptance of traditional hybrids, are expected to enter the U.S. market around 2010, and to gain market penetration through 2050 because of their superior fuel performance and environmental benefits. With parallel advances in smart vehicles and the smart grid, PHEVs will become an integral part of the distribution system itself within 20 years, providing storage, emergency supply, and grid stability.
Key research milestones and deployment targets include: • By 2012, develop advanced on-board chargers capable of handling two-way power flow,
opening the door for vehicles to become potential supply resources. • By 2017, deploy PHEVs to represent 10% of new light vehicle sales in the United States. • By 2020, ensure PHEVs can be integrated into the smart distribution system and managed
in aggregate to meet peak loads and emergencies, and to provide ancillary services. • By 2030, deploy PHEVs to represent 30% of new light vehicle sales in the United States.
Smart Distribution Grid
The technologies discussed above share a number of common attributes. First, they have or will have high levels of distributed intelligence (embedded computers) built into their basic operating structure, allowing them to become “smart resources” that are interactive with their digital environment. Second, they incorporate standardized communication protocols, affording high levels of interoperability with other devices through AMI. Third, they are designed to be integrated with a smart electricity infrastructure at multiple levels – the distribution level, the energy management systems (EMS) level, and grid operations and planning. Consequently, while established research and commercial activities continue to develop core technologies for efficiency, PHEVs, and DER, parallel RD&D efforts are required to transform the distribution system into a smart enabling infrastructure.

Technology Development Pathways
3-4
Key research milestones and deployment targets include: • By 2010, develop and deploy communication standards for AMI to ensure interoperability
with the grid. • By 2015, integrate AMI with smart resources, and complete pilot projects of distribution
system optimization. • By 2020, develop models for integrating smart resources with EMS, maximizing the energy
efficiency benefit at the system level. Ensure smart resources can be aggregated into virtual loads and sources. Pilot projects test the management of these resources.
• By 2025, fully integrate EMS with distribution management systems (DMS) and smart resources. Ensure the seamless integration of smart distributed resources with distribution system operations and with the market for energy services.

Technology Development Pathways
3-5
Challenge 2: Transmission-enabled technologies—deployment of transmission grids and associated energy storage infrastructures with the capacity and reliability to operate with as much as 20-30% intermittent renewables in specific regions.
Because the principal non-hydro renewable resources (i.e., wind, solar) are intermittent, integrating large quantities into the generation mix will require significant transmission system enhancements. Specific challenges include insufficient transmission for wind farms in remote locations, voltage and power supply problems due to fluctuating energy output, high ramping burdens requiring added reserves, and limited reactive power control. This section describes the RD&D steps needed to equip the transmission system with the resiliency and flexibility necessary to operate under conditions where potentially 20-30% of electricity generation is produced by intermittent renewables in specific regions and/or at specific points in time.
Technology Development Pathways
Technology development pathways are described below for the transmission-enabled technologies that will enable greater penetration of renewable energy into the U.S. grid. The accompanying timeline shows key research milestones and deployment targets.
Transmission Enabled Technologies
Figure 3-2

Technology Development Pathways
3-6
Utility-Scale Energy Storage
Because they are inherently less controllable, renewable energy resources challenge grid operations. Wind power provides the most striking example, with potential remedies including better wind turbines, improved fault tolerances, more accurate wind forecasting, power electronics for stabilization and compensation, and electric energy storage. Of these, only electric energy storage offers a comprehensive solution to the grid challenges of intermittent generation. Decoupling intermittent generation from demand by allowing large-scale energy storage and discharge increases resource dispatchability and allows intermittent renewable resources to operate during periods of maximum efficiency.
Key research milestones and deployment targets include: • By 2017, demonstrate an energy storage plant to support widespread integration of wind
turbines.
• By the mid-2020s, develop energy storage technology based on nano-supercapacitors.
Grid Visualization Tools
Under-investment in transmission infrastructure relative to growth in electricity demand presents critical near-term concerns. Analytical and visualization tools can enable more accurate forecasting of renewable energy output and its impact on grid operations, providing operators with greater confidence in scheduling adequate capacity to meet energy requirements.
Key research milestones and deployment targets include:
• By 2015, apply new analysis tools to optimize regulation, reserves, and load-following requirements in regions with high penetration of intermittent resources.
• By 2020, develop visualization tools that more accurately reflect load and demand response capabilities, enabling higher wind penetration.
Transmission Infrastructure
Renewable energy sites that are optimal in terms of primary energy resources are often far from load centers, requiring additional transmission infrastructure. Further, new generation resources and transmission lines change the topology and power flows on the grid, and intermittency leads to a need for power electronics allowing new control strategies. Through advanced transmission systems, novel materials, and advanced power electronics, the transmission infrastructure can be adapted for increased renewable energy generation.
Key research milestones and deployment targets include:
• By the mid-2020s, incorporate novel superconducting materials into a “supercable” that provides a low-loss transmission medium and an energy storage medium that can also be used for low-emission transportation applications.
• By the late 2020s, develop high-voltage direct current systems incorporating power electronics controllers that could be used to increase the use of off-shore wind farms.
Technology Development Pathways
3-7
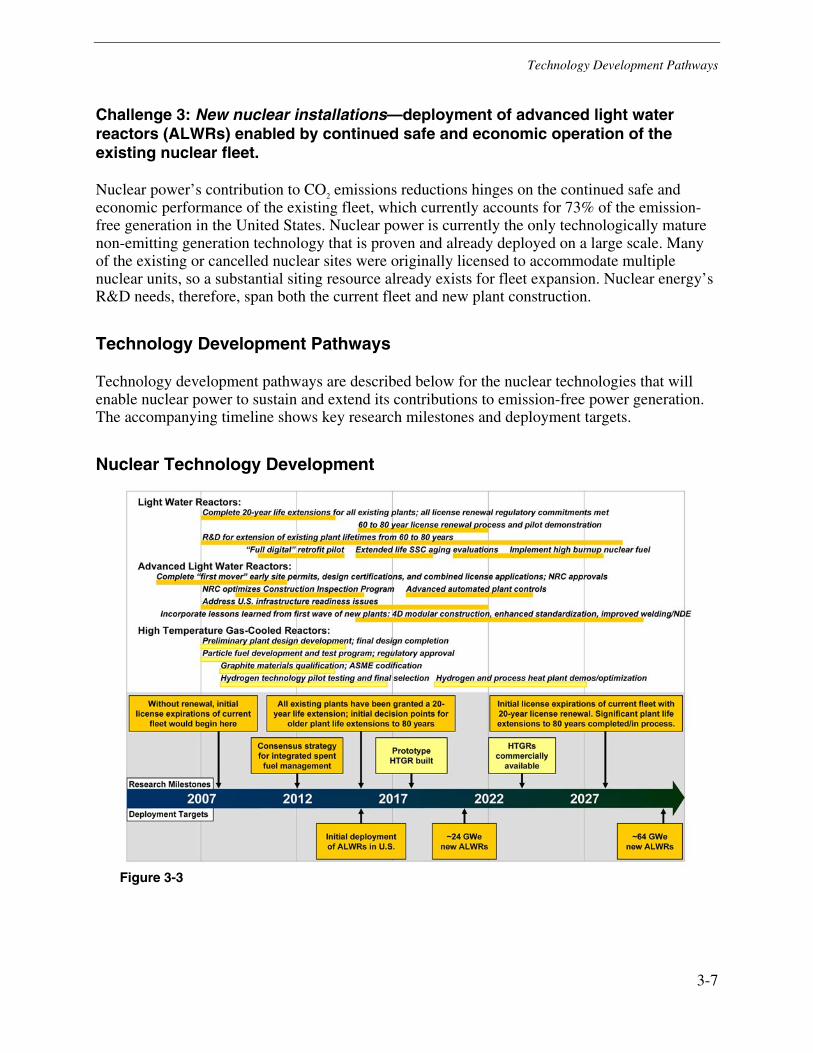
Challenge 3: New nuclear installations—deployment of advanced light water reactors (ALWRs) enabled by continued safe and economic operation of the existing nuclear fleet.
Nuclear power’s contribution to CO2 emissions reductions hinges on the continued safe and economic performance of the existing fleet, which currently accounts for 73% of the emission-free generation in the United States. Nuclear power is currently the only technologically mature non-emitting generation technology that is proven and already deployed on a large scale. Many of the existing or cancelled nuclear sites were originally licensed to accommodate multiple nuclear units, so a substantial siting resource already exists for fleet expansion. Nuclear energy’s R&D needs, therefore, span both the current fleet and new plant construction.
Technology Development Pathways
Technology development pathways are described below for the nuclear technologies that will enable nuclear power to sustain and extend its contributions to emission-free power generation. The accompanying timeline shows key research milestones and deployment targets.
Nuclear Technology Development
Figure 3-3

Technology Development Pathways
3-8
Light Water Reactors (LWR)
The near-term technology needs for nuclear energy in the United States relate to light water reactor (LWR) technology, which is the technology used in more than 80% of the world’s current reactors. The existing fleet of commercial nuclear reactors in the U.S. generates approximately 20% of the nation’s electricity at capacity factors averaging 90%. Existing U.S. plants have already operated for 12 to 38 years, and almost half of the current fleet received their operating licenses between 1980 and 1995. Sustaining electricity production from these plants is critical to national efforts aimed at significant CO2 reductions. RD&D priorities are thus focused on sustaining this high level of performance.
Key research milestones and deployment targets include:
• By 2016, ensure that all existing plants have been granted a 20-year life extension.
• By 2030, expand the application of digital control technology in both safety and plant control applications.
• By 2030, develop a new generation of highly reliable, high burnup nuclear fuel, capable of longer outage cycles and significantly reduced volumes of spent fuel.
Advanced Light Water Reactors (ALWR)
After more than two decades of investment in design development and pre-licensing, ALWR designs are approaching “essentially complete design” status. There are five major commercial designs, two of which are certified by the U.S. Nuclear Regulatory Commission (the remaining designs are under review or in the process of preparing review applications). Some ALWRs are in commercial operation or under construction today in Japan, Korea, Taiwan, France, and Finland. In the United States, 15 utilities have stated their intent to file a Combined License application based on ALWR designs. Although ALWR technology is available today, projections for earliest commercial operations of an ALWR in the U.S. are in the 2015 timeframe, due to time required for licensing and construction. The RD&D focus is to build upon existing designs and programs, such as the U.S. DOE’s NP-2010, to enable completion of the detailed engineering necessary for detailed ALWR cost estimates and plant construction. Additional RD&D will ensure that ALWRs perform at high levels of safety, capacity factor, and reliability, comparable to levels now achieved in the existing fleet.
Key research milestones and deployment targets include:
• By 2011, resolve remaining ALWR generic regulatory issues – including instrumentation and control design criteria, high-frequency seismic design criteria, quality assurance standards, and fitness for duty – in support of a commercial operation goal of 2015.
• By 2020-2025, develop enhancements to ALWR design, construction, and operations (e.g. modular construction, advanced automated plant controls, enhanced standardization) based on successful technology transfer of construction and operating experience from the existing fleet and early ALWR deployments.

Technology Development Pathways
3-9
Special Considerations
The analyses conducted for this Discussion Paper focused on those technologies that directly create emissions reductions from the electricity sector. For the time horizon of interest, and the boundary condition of electricity generation, two nuclear-energy related technology areas not specifically analyzed in this report will nevertheless have a bearing on the commercial electricity sector: spent fuel management and high-temperature gas reactors (HTGR).
Spent Fuel Management
Spent fuel management, although important to the long-term sustainability of nuclear energy, does not contribute directly to CO2 emissions reductions. Today’s plants and those to be constructed between now and 2030 will be able to store spent fuel on site. For economic, energy security, and sustainability reasons, however, there is an imperative to establish an integrated spent fuel management system consisting of centralized interim storage, long-term geologic storage, and, when necessary, a closed nuclear fuel cycle (recycling, reprocessing and advanced reactor strategies). The current analysis assumes a consensus strategy is established by 2012 for integrated and cost-effective spent fuel management. Long-term projections in the 2050 timeframe include a closed fuel cycle and deployment of “fast” reactors enabling the new fuel cycle. While not an imperative to achieving the emissions reductions envisioned in PRISM by 2030, substantial future RD&D will be necessary to enable a successful, cost-effective transition from a once-through to closed fuel cycle.
Key research milestones and deployment targets include:
• By 2012, build a consensus strategy for integrated spent fuel management, spanning on-site storage, interim central storage, long-term geologic storage, and potentially fuel reprocessing.
High-Temperature Gas-Cooled Reactors (HTGR)
Operating at much higher temperatures (700 to 950ºC) than conventional LWR technology (300ºC), high-temperature gas-cooled reactors (HTGR) can generate both electricity and process heat for industrial processes. Although originating from electricity sector technology, HTGRs will provide a non-emitting technology option to reduce CO2 emissions from large industrial energy consumers (e.g., hydrogen production, petrochemical operations, and desalination). The Next Generation Nuclear Plant (NGNP) commercial demonstration project – the U.S. Department of Energy’s name for the U.S. application of HTGR technology [NGNP] – is already underway. Key research milestones and deployment targets include prototype HTGR plant operation by 2018 and commercial HTGR introduction by the mid-2020s.

Technology Development Pathways
3-10
Challenge 4: Advanced coal—deployment of commercial-scale coal-based generation units operating with 90% CO2 capture and with the associated infrastructures to transport and sequester the captured CO2.
Coal currently accounts for more than half of the electricity generated in the United States, and is projected by most analyses to remain the backbone of U.S. electricity supply through 2050 and beyond. Sustaining coal as a viable option in a carbon-constrained world entails increasing the efficiency and reducing the capital cost of pulverized coal (PC) and integrated gasification combined-cycle (IGCC) technologies, and bringing CO2 carbon capture and storage to the point of cost-effective commercialization by 2020. Large-scale demonstrations will be necessary to convince private industry that technology commercialization is feasible.
Technology Development Pathways
The technology development pathways outlined in this section are intended to achieve two key targets: first, increase the efficiency of PC and IGCC baseload plants (with CO2 capture) to the 43-45% range by 2030; and second, ensure that all coal plants built after 2020 have the capability to capture and store 90% of the CO2 produced. The accompanying timeline shows key research milestones and deployment targets.
Advanced Coal With CO2 Capture and Storage
Figure 3-4

Technology Development Pathways
3-11
PC Plant Efficiency and Capital Cost
Significant efficiency gains for PC technology can only be realized by increasing the peak temperatures and pressures of the steam cycle; a 10% efficiency gain, for example, translates into a CO2 emissions reduction of 25%. Advanced materials such as corrosion-resistant nickel alloys, and new boiler and steam turbine designs, will be necessary to accommodate these higher temperatures and pressures. The targets for PC plants with carbon capture are efficiencies of 43-45% (with CO2 capture) with capital cost reductions of 25% by 2030 relative to 2005 costs documented in the EPRI/CURC Roadmap [CURC/EPRI]. It is expected that an advanced ultra-supercritical plant operating at about 1290°F (700°C) will be built during the next 7-10 years, following the demonstration and commercial availability of advanced materials from current research programs.
Key research milestones and deployment targets include:
• By 2020, achieve efficiencies of 33-35% for advanced pulverized coal plants with CO2 capture.
• By 2020, design, construct, and operate “Ultragen-I” facilities – ultra-supercritical pulverized coal plants operating at greater than 1100°F (593°C) with 25-50% CO2 capture.
• By 2025, design, construct, and operate “Ultragen-II” facilities – ultra-supercritical pulverized coal near zero emissions plant operating at 1200-1300°F (649-704°C) with 50+% CO2 capture.
IGCC Plant Efficiency and Capital Cost
With aggressive RD&D, IGCC capital cost reductions are targeted at 30% by 2030 relative to 2005 costs documented in the EPRI/CURC Roadmap [CURC/EPRI], with efficiencies climbing from 30% today to the 45% range (with CO2 capture). Expected technology advances include development of larger gasifiers, integration of these gasifiers with larger, more efficient combustion turbines, and use of ion transfer membrane (ITM) and/or other low-energy-demand oxygen supply technologies. Over the longer term, warm-gas cleanup and membrane separation processes for CO2 capture will reduce energy losses in these areas. Eventually, it is anticipated that hybrid combined cycles using fuel cells will enable generating efficiencies exceeding the theoretical limits of conventional combined-cycle technology.
Key research milestones and deployment targets include: • By 2012, field test ion transfer membrane technology, leading to pre-commercial testing of
IGCC with oxy-combustion. • By 2012, develop and evaluate hydrogen-fired F-class gas turbines, extending to G/H class
gas turbine testing in 2020 and beyond. • By 2017, achieve efficiencies of 33-35% for advanced integrated gasification combined-
cycle coal plants equipped with CO2 capture. • By 2020, demonstrate the FutureGen project with CO2 capture and storage. • By 2025, demonstrate G/H-class turbine IGCC plants with CO2 capture. • By 2030, demonstrate integrated gasification fuel cell (IGFC) plants.
Technology Development Pathways
3-12
CO2 Capture Technology
The greatest reductions in future U.S. electric sector CO2 emissions are likely to come from applying carbon capture and storage (CCS) technologies to nearly all new coal-based power plants coming on-line after 2020. CCS technologies can be feasibly integrated into virtually all types of new coal-fired power plants, including IGCC, PC, circulating fluidized bed (CFB), and variants such as oxy-fuel combustion.
Pre-combustion CO2 separation processes suitable for IGCC plants are used commercially in the oil and gas and chemical industries at a scale close to that ultimately needed for power production. Currently, adding CO2 capture, drying, compression, transportation, and storage capabilities to IGCC plant designs would increase the wholesale cost of electricity by 40-50%. One promising cost-reduction pathway involves membrane technology for separating the CO2 from syngas, which could enable a 50% reduction in both the capital cost and auxiliary power requirements.
Post-combustion CO2 capture for PC plants uses a solvent to interact with the flue gas and adsorb the CO2. A 2000 EPRI-DOE study [EPRI 2000] concluded that the energy needed by the current monoethanolamine (MEA) process would reduce net power by 29% and raise the cost of electricity by 65%. Extensive research [e.g. EPRI 2007] is being done to test and develop better solvents, such as chilled ammonia, which may reduce power consumption to as low as 10%, with an associated cost-of-electricity increase of about 25%. Alstom and EPRI are conducting a 5 MWt pilot scale test of a chilled ammonia process at We Energies’ Pleasant Prairie Power Station. If successful, a 30 MW pilot will follow around 2010.
Key research milestones and deployment targets include: • By 2012, conduct multiple 10 MW scale oxy-combustion pilot projects, leading to pre-
commercial demonstration around 2020 and beyond. • By 2015, conduct pilot projects demonstrating chilled ammonia and improved amine capture
technologies. • By 2020, develop new/improved processes and membrane contactors for post-combustion
capture in support of Ultragen-II demonstration (see advanced pulverized coal section above).
CO2 Storage Technology
Geologic CO2 storage has been proven effective by nature, as evidenced by the numerous natural underground CO2 reservoirs in Colorado, Utah, and other western states. CO2 is also found in natural gas reservoirs, where it has resided for millions of years. Large-scale injection and storage of CO2 produced from electricity generation, however, has not been proven. DOE has an active R&D program, the “Regional Carbon Sequestration Partnerships,” [NETL]which is mapping geologic formations suitable for CO2 storage and conducting pilot-scale CO2 injection validation tests across the country. After successful completion of pilot-scale activities, the Partnerships will undertake larger demonstrations in differing geologies, injecting quantities of one million tons or more of CO2 over a several year period, along with post-injection monitoring to track the CO2 plume in the target formations and to check for potential leakage.

Technology Development Pathways
3-13
Key research milestones and deployment targets include: • By 2010, complete the validation phase of the U.S. Department of Energy regional
partnerships.
• By 2018, complete the deployment phase of the U.S. Department of Energy regional partnerships deployment phase.
• By 2020, conduct 3-5 large-scale demonstrations of CO2 storage (for multiple geologies) receiving captured CO2 from coal plants.
• By 2020, demonstrate commercial availability of CO2 storage capable of supporting new coal plants capturing 90% of CO2.

Technology Development Pathways
3-14
Estimated Funding Needs for Technology Pathways
The commercial availability of the technologies described above will require an expanded and multi-decade RD&D program. This RD&D must include expanded, yet well-coordinated programs in both the public (government) and private sectors. Although advances are needed all along the RD&D chain – basic science, applied research, development and demonstration – a significant portion of the funds will be needed for large-scale demonstrations. The figure below illustrates the timing and relative level of investment typically associated with the critical stages of the technology development cycle. Mature technologies with low R&D costs are depicted on the right, while novel technologies with uncertain commercial prospects are depicted on the left. RD&D costs are highest for technologies at the demonstration stage, where private industry has not yet accepted commercial viability.
Figure 3-5
EPRI assessed several technology roadmaps to estimate recommended RD&D funding levels for applied engineering research, including the Coal Utilization Research Council/EPRI Roadmap [CURC/EPRI], often cited by DOE’s Fossil Energy Office; and the INL/EPRI Nuclear Energy Development Agenda [INL/EPRI]. Assessments were also made of international experience in several technology areas. Based on these evaluations and EPRI’s own research, EPRI domain experts developed high-level estimates of RD&D funding to enable the development and deployment of technologies discussed in this report. These estimates were developed by making a preliminary estimate of the funding needs in each of the phases of RD&D depicted in the figure above, for 5 year intervals between 2005 and 2030. Table 3-1 displays estimates of annual funding needs in five-year increments. These estimates are incremental to existing public/private funding. All of the technology challenges require significant and sustained funding. These estimates will be further developed based on the more detailed RD&D action plan to be published later this year.

Technology Development Pathways
3-15
Table 3-1
2005-2009 2010-2014 2015-2019 2020-2024 2025-2030 Average Annual
(2005-2030) Distribution Enabled Technologies
$250M/yr $220M/yr $140M/yr $240M/yr $240M/yr $220M/yr
Transmission Enabled Technologies
$100M/yr $130M/yr $120M/yr $70M/yr $60M/yr $100M/yr
Nuclear $500M/yr $520M/yr $370M/yr $370M/yr $400M/yr $430M/yr Advanced Coal + CO2 Capture/ Storage
$830M/yr $800M/yr $800M/yr $620M/yr $400M/yr $690M/yr
$1,700M/yr $1,700M/yr $1,400M/yr $1,300M/yr $1,100M/yr $1,400M/yr
All figures rounded to 2 significant digits.

4-1
4 ECONOMIC ASSESSMENT (MERGE)
The MERGE analysis assesses the economic impact of the technologies defined in the PRISM analysis, tied to a specific CO2 emissions constraint. MERGE [RICHELS, et al] is a general equilibrium economic model that has been used for more than a decade to analyze the cost of CO2 emissions mitigation as a function of technology cost, availability, and performance. MERGE models long time horizons to capture economic effects of potential climate change and encompasses all major greenhouse gases and all emitting sectors of the economy. Using technology descriptions and policy constraints as inputs, the model outputs not only energy production by technology, but also prices for wholesale electricity and carbon emissions.
The linkage between the PRISM and MERGE analyses facilitates an economic assessment of aggressive deployment of a full portfolio of advanced technologies. As discussed below, the MERGE analysis clearly shows the enormous economy-wide benefit of investing in the RD&D needed to commercialize the technologies described in the PRISM analysis.
Analysis Approach
Conceptually, MERGE estimates the least-cost combination of technologies necessary to provide the economy’s energy services with or without a CO2 emissions constraint. For this analysis, MERGE contrasts two technology scenarios: a “Limited Portfolio” scenario representing incremental technology improvements, and a “Full Portfolio” scenario representing the electricity technology advances described in the PRISM analysis. Comparing the economy-wide cost of meeting a CO2 constraint between these two scenarios provides a basis for assessing the value of the RD&D investment needed to assure the levels of technology performance described in the PRISM analysis.
The Limited Portfolio scenario is designed to represent modest improvement beyond the current technologies, but without the availability of carbon capture and storage. The Full Portfolio scenario is designed to represent substantially more improvement in performance and costs for a range of technologies, thus allowing more widespread economical deployment of these technologies.
The tables 4-1 below illustrate the key differences between the two scenarios. Note that costs do not include any production or investment tax credits for any technologies. Appendix B provides detailed information forming the basis of these scenarios

Economic Assessment (MERGE)
4-2
Table 4-1
For both the Limited Portfolio and Full Portfolio scenarios, demand-side improvements in energy requirements occur due to both technological progress (end-use efficiency) and structural changes in the economy (energy intensity). In the Full Portfolio scenario, MERGE simulates accelerated technology progress by assuming that the average rate of demand growth in the electricity sector is 20% lower than in the Limited Portfolio scenario.
The MERGE analysis considers three CO2 emissions constraints representative of possible future emissions policies. In all three cases, the United States meets its goal of reducing greenhouse gas intensity during the first decade of the 21st century.
Policy A: Reduce carbon emissions by 2% per year through 2050 (starting in 2010)
Policy B: Stabilize carbon emissions at 2010 levels through 2020 Reduce carbon emissions by 3% per year through 2050
Policy C: Stabilize carbon emissions at 2010 levels through 2020 Reduce carbon emissions by 2% per year through 2050
Note that these constraints do not imply endorsement of any particular proposal or set of proposals. They have been chosen for two reasons: first, they are indicative of the types of proposals currently being discussed by policymakers; and second, they provide insight into the rate and magnitude of reductions associated with various technology choices. As noted previously, such economy-wide emissions constraints serve as inputs into MERGE. The model then allocates emissions reductions across the economy in a manner that minimizes the economic abatement costs.
Economic Assessment (MERGE)
4-3
MERGE Results
Policy Constraints
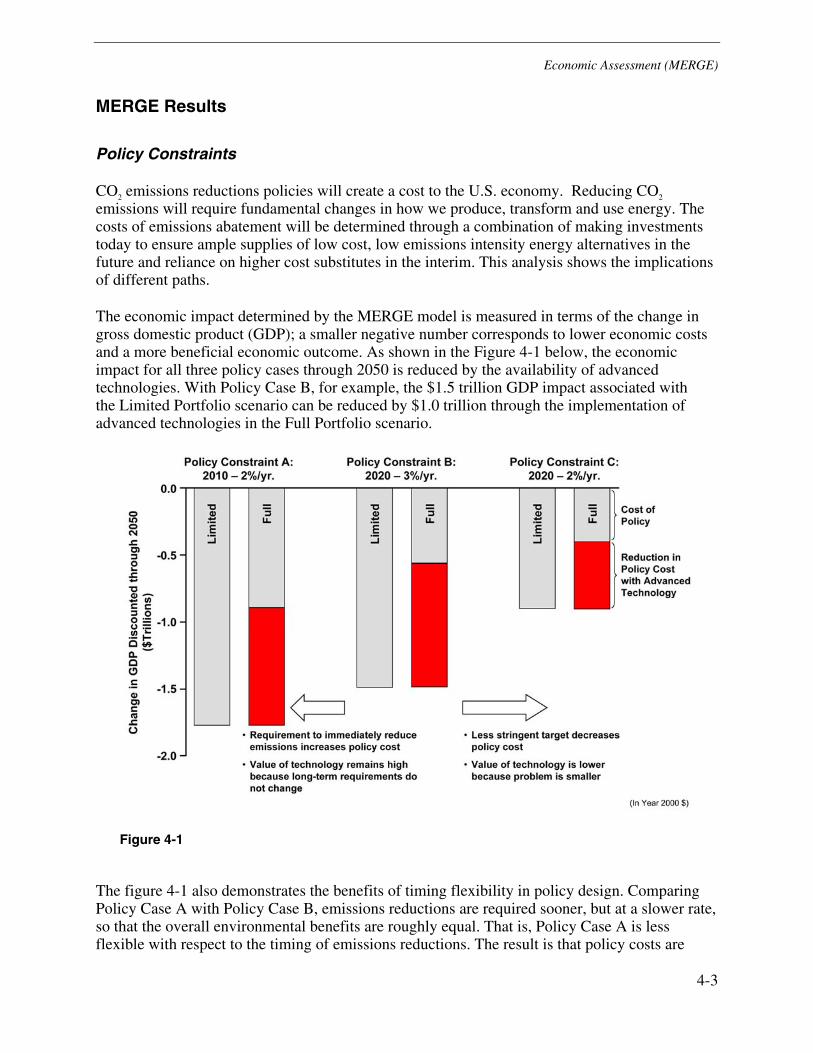
CO2 emissions reductions policies will create a cost to the U.S. economy. Reducing CO2 emissions will require fundamental changes in how we produce, transform and use energy. The costs of emissions abatement will be determined through a combination of making investments today to ensure ample supplies of low cost, low emissions intensity energy alternatives in the future and reliance on higher cost substitutes in the interim. This analysis shows the implications of different paths.
The economic impact determined by the MERGE model is measured in terms of the change in gross domestic product (GDP); a smaller negative number corresponds to lower economic costs and a more beneficial economic outcome. As shown in the Figure 4-1 below, the economic impact for all three policy cases through 2050 is reduced by the availability of advanced technologies. With Policy Case B, for example, the $1.5 trillion GDP impact associated with the Limited Portfolio scenario can be reduced by $1.0 trillion through the implementation of advanced technologies in the Full Portfolio scenario.
Figure 4-1
The figure 4-1 also demonstrates the benefits of timing flexibility in policy design. Comparing Policy Case A with Policy Case B, emissions reductions are required sooner, but at a slower rate, so that the overall environmental benefits are roughly equal. That is, Policy Case A is less flexible with respect to the timing of emissions reductions. The result is that policy costs are

Economic Assessment (MERGE)
4-4
increased in both the Limited Portfolio and Full Portfolio cases, but the value of technology remains the same. While the long-term requirements do not change, more work is required in the short term before new technologies become available.
Comparing Policy Case C to Policy Case B, reductions are required at the same time, but at a slower rate, so that the target is actually less stringent (and results in a smaller environmental improvement). Here the policy cost is reduced in both cases, due to the relaxed policy, but the value of technology is also reduced because the magnitude of the problem has been reduced. These results are consistent with previous research by EPRI and others showing that time-based flexibility in imposing constraints can reduce policy costs.
Individual Technology Impact
Considered together, the suite of technologies included in the Full Portfolio scenario provides a significant economic benefit. The Figure 4-2 below examines the economic impacts of the individual technologies for Policy Case B, which most closely resembles the emissions profile resulting from the PRISM analysis. The first bar shows the $1.5 trillion aggregate economic impact without the implementation of advanced technologies. Moving to the right, the red portions of the bars illustrate the economic benefit of incorporating each technology individually. Note that the relationship between these individual benefits and the benefit of implementing all technologies is not additive, due to complex interactions between different economic sectors and how they use energy.
Figure 4-2

Economic Assessment (MERGE)
4-5
Generation Mix and Wholesale Electricity Prices
Technology availability has a large impact on the U.S. generation mix. The Figure 4-3 below compares the generation mix under Policy Case B for the Limited Portfolio and Full Portfolio scenarios. In the Limited Portfolio scenario, emissions reductions require large reductions in electricity demand, which places severe constraints on economic growth. In contrast, for the Full Portfolio scenario, the availability of CCS and nuclear generation provide large-scale, supply-side emissions reductions so that the electricity market is preserved and constraints on economic growth are limited. Consequently, the availability of advanced generation technologies results in a substantially lower projection for wholesale electricity costs – reaching $65/MWh in 2050, compared to $160/MWh if emissions reductions are met under the Limited Portfolio scenario.
Figure 4-3
Natural Gas Prices
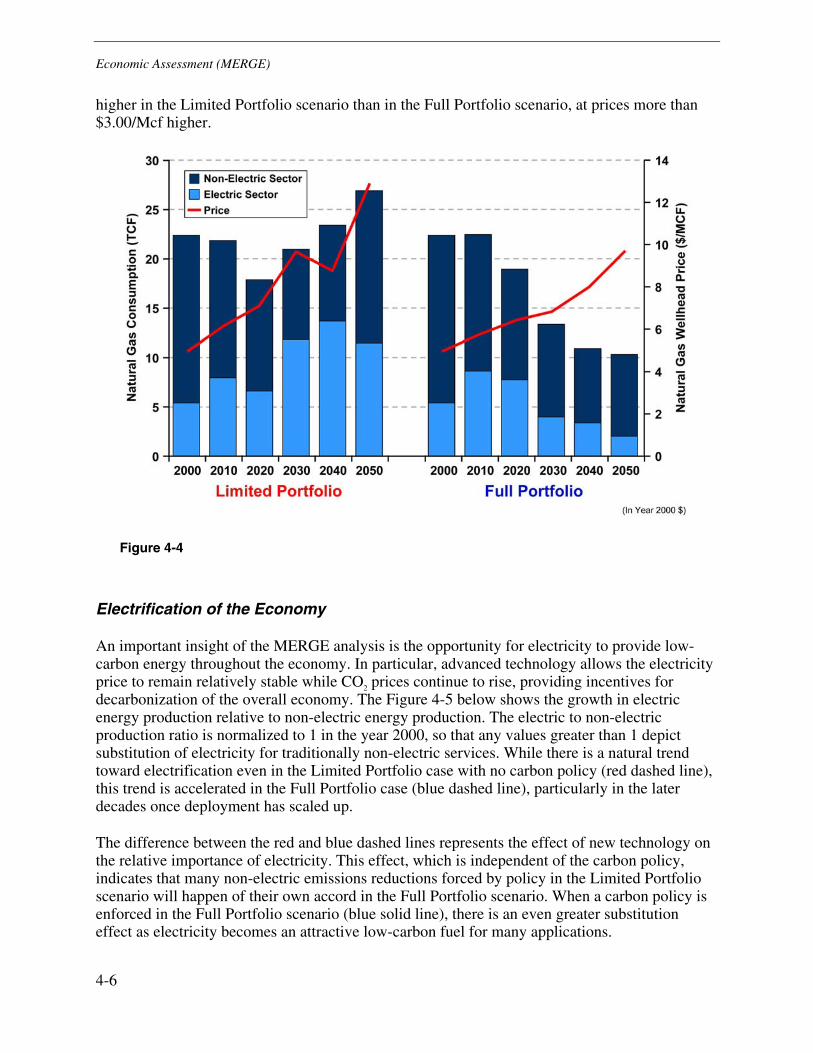
The extent of advanced technology development and deployment also influences natural gas usage and pricing in the context of meeting policy constraints. As shown Figure 4-4 below, in the Limited Portfolio scenario, achieving emissions reductions would require a significant amount of fuel switching to natural gas for electricity generation and large accompanying reductions in electricity demand. These effects place severe constraints on economic growth and drive natural gas prices up. By 2050, natural gas consumption in the electric sector is more than five times
Economic Assessment (MERGE)
4-6
higher in the Limited Portfolio scenario than in the Full Portfolio scenario, at prices more than $3.00/Mcf higher.
Figure 4-4
Electrification of the Economy
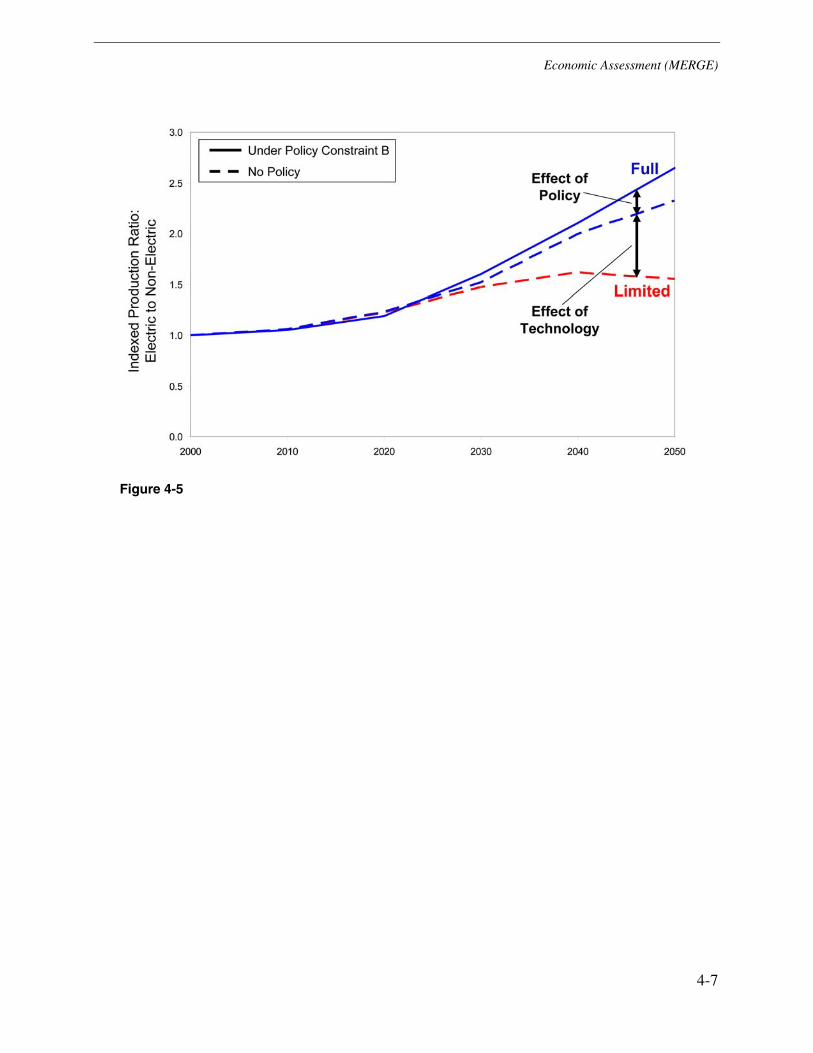
An important insight of the MERGE analysis is the opportunity for electricity to provide low-carbon energy throughout the economy. In particular, advanced technology allows the electricity price to remain relatively stable while CO2 prices continue to rise, providing incentives for decarbonization of the overall economy. The Figure 4-5 below shows the growth in electric energy production relative to non-electric energy production. The electric to non-electric production ratio is normalized to 1 in the year 2000, so that any values greater than 1 depict substitution of electricity for traditionally non-electric services. While there is a natural trend toward electrification even in the Limited Portfolio case with no carbon policy (red dashed line), this trend is accelerated in the Full Portfolio case (blue dashed line), particularly in the later decades once deployment has scaled up.
The difference between the red and blue dashed lines represents the effect of new technology on the relative importance of electricity. This effect, which is independent of the carbon policy, indicates that many non-electric emissions reductions forced by policy in the Limited Portfolio scenario will happen of their own accord in the Full Portfolio scenario. When a carbon policy is enforced in the Full Portfolio scenario (blue solid line), there is an even greater substitution effect as electricity becomes an attractive low-carbon fuel for many applications.
Economic Assessment (MERGE)
4-7
Figure 4-5

5-1
5 CONCLUSIONS
The prospect of CO2 emissions policies, coupled with sustained growth in electricity consumption, present the electricity sector with unprecedented technical challenges. Through three separate but inter-related analyses, EPRI has investigated the technical capability and economic feasibility of achieving substantial CO2 emissions reductions from the U.S. electricity sector. The analyses encompass an assessment of the CO2 emissions reduction potential of a portfolio of advanced technologies; an assessment of the national economic impacts associated with deploying these advanced technologies; and an assessment of the research, development, demonstration and deployment pathways necessary for these technologies to reach prescribed performance goals.
Four major conclusions emerge from these studies:
• The strategy for reducing sector emissions will be technology-based. A technology-based strategy is sustainable, minimizes costs to the U.S. economy, and creates opportunities for decarbonization beyond the electricity sector and ultimately beyond the United States.
• A diverse portfolio of advanced technologies will be required. No single technological “silver bullet” will suffice. Rather, a full portfolio is needed that includes efficiency, renewable energy resources, nuclear, coal with carbon capture and storage, and other technologies enabled by expanded transmission and distribution system capabilities.
• Significant RD&D is needed over a sustained period, and technology development lead times require starting now. An investment in RD&D investment (public and private) will lower the cost of emissions reductions on the order of $1 trillion.
• Near- and long-term RD&D activities will be needed to enable significant emissions reductions. The proposals discussed in this paper are designed to elicit discussion from industry stakeholders about how best to develop the technology capabilities to substantially reduce the electricity sector’s CO2 emissions.
This Discussion Paper provides a framework for developing a research, development, and demonstration (RD&D) Action Plan that will enable sustainable and substantial electricity sector CO2 emissions reductions over the coming decades. The Action Plan will be published later this year and incorporate input from participants at the 2007 EPRI Summer Seminar.

A-1
A PRISM ANALYSIS TARGETS
A more detailed discussion of the PRISM analysis is presented here. The flow chart Figure A-1 below outlines the PRISM analysis approach. Each of the technology performance and deployment targets and their rationale is discussed below.
Overview of PRISM Analysis
Nat Gas, DER, T&D, and PHEV Analysis
CO2 Emissions Analysis
Efficiency AnalysisAdv Coal/CCS Analysis
Nuclear/Renewables Analysis
End Capacity Analysis
(for each technology)
(for each technology)
CO2 Emissions Reductions
Total Adjusted Generation
Net Generation
Assumptions Regarding Development and
Deployment of Adv Coal and CCS Technologies
Adv Coal/CCS CO2 Reductions
Assumptions Regarding New Nuclear and
Renewables Capacity Targets
Generation Change Due to Nuclear/Renewables
Nuclear/Renewable CO2 Reductions
Generation and Reductions Data from All Other
Sectors and Assumptions Regarding Growth Rate of
Efficiency
Efficiency CO2 Reductions
Assumptions Regarding Technological
Advancements (e.g., Efficiency) and
Application Rates*
Nat Gas, DER, T&D, and PHEV CO2 Reductions
Energy Information Administration Data from
2007 Annual Energy Outlook
End Capacity with Generation Share
Percentage
Nat Gas, DER, T&D, and PHEV Analysis
CO2 Emissions Analysis
Efficiency AnalysisAdv Coal/CCS Analysis
Nuclear/Renewables Analysis
End Capacity Analysis
(for each technology)
(for each technology)
CO2 Emissions Reductions
(for each technology)
CO2 Emissions Reductions
Total Adjusted Generation
Net Generation
Assumptions Regarding Development and
Deployment of Adv Coal and CCS Technologies
Adv Coal/CCS CO2 Reductions
Assumptions Regarding New Nuclear and
Renewables Capacity Targets
Generation Change Due to Nuclear/Renewables
Nuclear/Renewable CO2 Reductions
Generation and Reductions Data from All Other
Sectors and Assumptions Regarding Growth Rate of
Efficiency
Efficiency CO2 Reductions
Assumptions Regarding Technological
Advancements (e.g., Efficiency) and
Application Rates*
Nat Gas, DER, T&D, and PHEV CO2 Reductions
Energy Information Administration Data from
2007 Annual Energy Outlook
End Capacity with Generation Share
Percentage
Figure A-1

PRISM Analysis Targets
A-2
PRISM Analysis Targets
End-Use Efficiency
Based on the Energy Policy Act of 2005 [EPAct 2005] mandate of a 20% intensity improvement for federal buildings, an assumption was made that this level of improvement would be achieved for all electricity consumption within the three major consumption sectors. This assumption equates to an average electricity demand growth over the period 2005-2030 of 1.1%, which is about 30% lower than the EIA [AEO 2007] assumed demand growth rate of 1.5%. This was implemented in the analysis via the following technical assumptions:
• Electricity intensity of new demand for residential, industrial and commercial sectors reduces by 2%/yr starting in 2007, achieving 20% intensity improvement by 2016, after which intensity improvement remains constant.
• Electricity intensity of a fraction of existing demand improves at a rate of 2%/year for the same period cited above. The fraction of existing demand to which this improvement rate is applied is 2% (starting in 2007), and increases at a rate of 2%/year to a maximum of 20% retrofit (by 2016).
Available efficiency potential corresponds to both new technologies as well as current technologies that have not been deployed to the maximum degree possible [SS 2006]. Factors affecting the rate at which efficiency technologies are deployed include relatively long timescales for wide-spread improvements to building and equipment efficiencies and the need for advanced infrastructure capabilities (e.g. distributed computing, communications networks, distributed sensors and advanced metering) to enable automated control of electricity consumption on scales capable of significantly affecting CO2 emissions.
Renewables
Based on the presence of renewable portfolio standards (RPS) in nearly half of the states and experience from Europe with large deployments of intermittent renewables, an assumption was made that the capacity additions prescribed collectively by the existing RPS would be realized. This capacity was estimated to be about 50 GW (excluding hydroelectric power) by 2020, a date which encompasses the horizon of nearly all of the existing RPS. A further assumption was made that non-hydro renewables deployments would continue to grow at a rate of 2 GWe/year between 2020 and 2030, resulting in a target total deployment of 70 GWe by 2030. This assumption represents more than doubling the EIA projection of 30 GW by 2030. In the context of the PRISM analysis, renewables exclude large scale hydroelectric power, which is assumed to follow the growth pattern projected in the EIA 2007 Annual Energy Outlook [AEO 2007] base case. For purposes of the PRISM analysis, all renewables were assumed to be non-emitting, without specifying a particular combination of technologies. With this approach, avoided emissions can be calculated based on displacing emitting generation with renewables-based generation.
PRISM Analysis Targets
A-3
Nuclear
Estimates of the U.S. nuclear fleet’s capability to expand are addressed in a strategic assessment jointly developed by Idaho National Laboratory and EPRI [INEL/EPRI]. This assessment developed critical research priorities and timeframes, and discussed deployment capabilities. Based on a consideration of this strategic assessment combined with recognition of the substantial number of brownfield sites available at existing U.S. nuclear sites, an analysis target of 64 GWe of new nuclear capacity in 2030 (including the EIA assumption of 12.5 GWe) was assumed. An additional assumption was that all of the existing nuclear plants continue to operate through 2030 based on the assumption of successful plant life extensions to 60 years. While the above deployment assumption roughly constitutes a 50% expansion of the current nuclear fleet, this was viewed as a technically feasible analysis goal because: (a) most of this capacity could be sited at existing nuclear sites, (b) the advanced light water reactor (ALWR) technology that would be the basis of these new plants has been built several times overseas, is a well-developed commercial technology, and (c) the goal of the analysis is to explore the impact of aggressive deployment assumptions.
Advanced Coal Plant Efficiency Improvements
Advanced coal plants principally consist of two technologies: advanced pulverized coal combustion (PC) and integrated gasification and combined cycle (IGCC). Both technologies are addressed in a well-developed technology strategy plan jointly developed by the Coal Utilization Research Council (CURC) and EPRI [CURC/EPRI]. The EPRI/CURC roadmap lays out a series of performance milestones extending to 2025 for the thermodynamic performance and heat rates of both the PC and IGCC technologies. Based on this roadmap, the PRISM analysis target was a thermodynamic efficiency of 49% for all new coal plants by 2025. The efficiency is assumed to improve linearly between 2005 and 2025, and then remain constant. For coal plants existing as of 2005, an assumption was made that annually 1% of these plants would be uprated to efficiencies equal to new plant efficiencies. Increased efficiencies result in lower heat rates, which become the basis for calculating avoided emissions. The PRISM analysis does not differentiate between coal types or plant locations – average emissions intensities (metric tons CO2/MWh) are used.
CO2 Capture and Storage
The CURC/EPRI technology strategy plan [CURC/EPRI] cited above also identifies performance targets for increasingly efficient CO2 capture technologies. Based on evaluation of this roadmap, the PRISM analysis target assumes that by 2020, 90% of all new coal plants are capturing and storing 90% of the CO2 that they generate. Implicit in this assumption, therefore, is availability at commercial scale of CO2 transport and storage in 2020 and thereafter. For purposes of the PRISM analysis, it is presumed that the large scale CO2 storage demonstration program sponsored by the U.S. Department of Energy will be successful and on schedule.

PRISM Analysis Targets
A-4
Plug-In Hybrid Electric Vehicles (PHEVs)
PHEVs are somewhat unique in that they represent assets owned by end-users, not utility companies, and any reduction in their emissions perhaps should be attributed to the transportation sector. The effect of PHEVs was analyzed in the PRISM to address widespread questions regarding the magnitude of their potential contribution to CO2 emissions reductions. To assess how significant PHEVs could be, aggressive assumptions were made regarding the percentage of new light vehicle sales that would be PHEVs: 16% by 2020 and 39% by 2030. Assumptions for PHEV performance, emissions intensity, and percentage of electric operations were taken from EPRI PHEV studies [PHEV]. Avoided emissions calculations account for added emissions created by the added electricity load associated with PHEV recharging.
Distributed Energy Resources (DER)
As with PHEVs, DER also represents assets not owned or controlled by utilities. However, there is much interest in the potential impact on emissions reductions deriving from a potentially significant deployment of DER. Consequently, the PRISM analysis target for DER was 5% of total electricity generation. The DER heat rate was assumed to equal that for the EIA combined-heat and power unit (to reflect the average efficiency of the portfolio of CHP possibilities) from the EIA 2007 Annual Energy Outlook [AEO 2007]. By comparing this improved heat rate/efficiency to the existing fossil unit mix, potential CO2 emissions reductions can be estimated.

B-1
B MERGE TECHNOLOGY INPUT ASSUMPTIONS

M
ERG
E Te
chno
logy
Inpu
t Ass
umpt
ions
B-2
Li
mite
d Po
rtfo
lio S
cena
rio
Full
Port
folio
Sce
nario
N
otes
Coa
l •
2010
•
Leve
lized
cos
t of e
lect
ricity
= $
45/M
Wh
• Ef
ficie
ncy
= 38
%
• 20
20
• Le
veliz
ed c
ost o
f ele
ctric
ity =
$37
/MW
h •
Effic
ienc
y =
42%
•
2030
- 20
50
• Le
veliz
ed c
ost o
f ele
ctric
ity =
$30
/MW
h
• E
ffici
ency
46%
• 20
10
• Le
veliz
ed c
ost o
f ele
ctric
ity =
$45
/MW
h •
Effic
ienc
y =
38%
•
2020
•
Leve
lized
cos
t of e
lect
ricity
= $
37/M
Wh
• Ef
ficie
ncy
= 42
%
• 20
30 -
2050
•
Leve
lized
cos
t of e
lect
ricity
= $
30/M
Wh
•
Effi
cien
cy 4
6%
• V
alue
s ar
e av
erag
es a
cros
s pu
lver
ized
coa
l, in
tegr
ated
ga
sific
atio
n co
mbi
ned
cycl
e te
chno
logi
es a
nd a
cros
s bi
tum
inou
s an
d su
b-bi
tum
inou
s co
al ty
pes
• V
alue
s co
rres
pond
to n
omin
al 6
00
MW
pla
nt c
apac
ity, 8
0% c
apac
ity
fact
or
• C
osts
in 2
006
$ •
Cos
ts a
re e
xclu
sive
of f
uel c
osts
(fu
el c
osts
sep
arat
ely
mod
eled
in
ME
RG
E)
C
oal +
CO
2 ca
ptur
e an
d st
orag
e
• N
ot a
vaila
ble
• 20
10 –
not
ava
ilabl
e •
2020
•
Leve
lized
cos
t of e
lect
ricity
= $
57/M
Wh
• Ef
ficie
ncy
= 36
%
• 20
30 -
2050
•
Leve
lized
cos
t of e
lect
ricity
= $
44/M
Wh
•
Effi
cien
cy 4
2%
• V
alue
s ar
e av
erag
es a
cros
s pu
lver
ized
coa
l, in
tegr
ated
ga
sific
atio
n co
mbi
ned
cycl
e te
chno
logi
es a
nd a
cros
s bi
tum
inou
s an
d su
b-bi
tum
inou
s co
al ty
pes
• V
alue
s co
rres
pond
to n
omin
al 6
00
MW
pla
nt c
apac
ity, 8
0% c
apac
ity
fact
or
• C
osts
in 2
006
$ •
Cos
ts a
re e
xclu
sive
of f
uel c
osts
(fu
el c
osts
sep
arat
ely
mod
eled
in
ME
RG
E)
• 90
% C
O2 c
aptu
re e
ffici
ency
•
Tran
spor
t + s
tora
ge c
ost =
$1
0/m
etric
ton
CO
2

MER
GE
Tech
nolo
gy In
put A
ssum
ptio
ns
B-3
Li
mite
d Po
rtfo
lio S
cena
rio
Full
Port
folio
Sce
nario
N
otes
Nuc
lear
•
2010
– n
o ne
w p
lant
s •
2020
- 20
50
• Le
veliz
ed c
ost o
f ele
ctric
ity =
$45
/MW
h •
New
nuc
lear
pla
nt c
onst
ruct
ion
bala
nces
re
tirem
ents
of e
xist
ing
plan
ts, p
rese
rvin
g 10
0 G
W fl
eet s
ize.
• 20
10 –
no
new
pla
nts
•
2020
– le
veliz
ed c
ost o
f ele
ctric
ity =
$44
/MW
h •
2030
– le
veliz
ed c
ost o
f ele
ctric
ity =
$43
/MW
h •
2040
– le
veliz
ed c
ost o
f ele
ctric
ity =
$42
/MW
h •
2050
– le
veliz
ed c
ost o
f ele
ctric
ity =
$41
/MW
h •
Nom
inal
3%
/dec
ade
impr
ovem
ent p
ost-2
020
• C
osts
in 2
006
$ •
Cap
acity
fact
or =
90%
•
Effi
cien
cy =
33%
•
Exi
stin
g nu
clea
r pla
nt li
fe =
60
year
s •
Add
ed n
on-m
arke
t cos
t =
~$10
/MW
h (a
t cur
rent
gen
erat
ion
shar
e fo
r nuc
lear
); sc
ales
with
in
crea
sing
nuc
lear
gen
erat
ion
shar
e.
Nat
ural
Gas
•
2010
– 2
050
•
Leve
lized
cos
t of e
lect
ricity
=
$14.
5/M
Wh
• 20
10
• Ef
ficie
ncy
= 49
%
• 20
20
• Ef
ficie
ncy
= 55
%
• 20
30 -
2050
•
Effic
ienc
y =
60%
• 20
10 –
205
0
• Le
veliz
ed c
ost o
f ele
ctric
ity =
$14
.5/M
Wh
• 20
10
• Ef
ficie
ncy
= 49
%
• 20
20
• Ef
ficie
ncy
= 55
%
• 20
30-2
050
•
Effic
ienc
y =
60%
• C
osts
in 2
006
$ •
Cos
ts a
re e
xclu
sive
of f
uel c
osts
(fu
el c
osts
sep
arat
ely
mod
eled
in
ME
RG
E)
• N
omin
al p
lant
= 4
00 M
W
• C
apac
ity fa
ctor
= 8
0%
• 90
% C
O2 c
aptu
re e
ffici
ency
•
Tran
spor
t + s
tora
ge c
ost =
$1
0/m
etric
ton
CO
2
Nat
ural
Gas
+
CO
2 cap
ture
an
d st
orag
e
• N
ot a
vaila
ble
• 20
10 –
not
ava
ilabl
e •
2020
- 20
50
• Le
veliz
ed c
ost o
f ele
ctric
ity =
$33
/MW
h •
2020
– E
ffici
ency
= 3
9%
• 20
30 -
2050
- E
ffici
ency
42%
• C
osts
in 2
006
$ •
Cos
ts a
re e
xclu
sive
of f
uel c
osts
(fu
el c
osts
sep
arat
ely
mod
eled
in
ME
RG
E)
• N
omin
al p
lant
= 4
00 M
W
• C
apac
ity fa
ctor
= 8
0%
• 90
% C
O2 c
aptu
re e
ffici
ency
•
Tran
spor
t + s
tora
ge c
ost =
$1
0/m
etric
ton
CO
2
Ren
ewab
les
• M
axim
um p
enet
ratio
n of
in
term
itten
t ren
ewab
les
= 20
% o
f to
tal g
ener
atio
n •
Max
imum
pen
etra
tion
of a
ll no
n-hy
dro
rene
wab
les
= 30
% o
f tot
al
gene
ratio
n

M
ERG
E Te
chno
logy
Inpu
t Ass
umpt
ions
B-4
Li
mite
d Po
rtfo
lio S
cena
rio
Full
Port
folio
Sce
nario
N
otes
Win
d •
2010
– 2
050
– C
apac
ity fa
ctor
= 3
2.5%
•
2010
– L
evel
ized
cos
t of e
lect
ricity
=
$96/
MW
h •
2020
- Le
veliz
ed c
ost o
f ele
ctric
ity =
$9
3/M
Wh
• 20
30 -
Leve
lized
cos
t of e
lect
ricity
=
$90/
MW
h •
2040
- Le
veliz
ed c
ost o
f ele
ctric
ity =
$8
7/M
Wh
• 20
50 -
Leve
lized
cos
t of e
lect
ricity
=
$85/
MW
h
• 20
10 –
Cap
acity
fact
or =
32.
5%
• 20
20 –
205
0 –
Cap
acity
fact
or =
42%
•
2010
– L
evel
ized
cos
t of e
lect
ricity
= $
96/M
Wh
• 20
20 -
Leve
lized
cos
t of e
lect
ricity
= $
75/M
Wh
• 20
30 -
Leve
lized
cos
t of e
lect
ricity
= $
73/M
Wh
• 20
40 -
Leve
lized
cos
t of e
lect
ricity
= $
71/M
Wh
• 20
50 -
Leve
lized
cos
t of e
lect
ricity
= $
69/M
Wh
• N
omin
al 3
%/d
ecad
e im
prov
emen
t pos
t-202
0
• 10
0 M
W w
ind
farm
•
All
cost
s ex
clud
e an
y re
duct
ions
du
e to
pro
duct
ion
or ta
x in
cent
ives
•
Cos
ts in
200
6 $
Bio
mas
s •
2010
– 2
050
• Le
veliz
ed c
ost o
f ele
ctric
ity =
$9
6.5/
MW
h
• 20
10 –
Lev
eliz
ed c
ost o
f ele
ctric
ity =
$97
/MW
h •
2020
- Le
veliz
ed c
ost o
f ele
ctric
ity =
$92
/MW
h •
2030
- Le
veliz
ed c
ost o
f ele
ctric
ity =
$87
/MW
h •
2040
- Le
veliz
ed c
ost o
f ele
ctric
ity =
$82
/MW
h •
2050
- Le
veliz
ed c
ost o
f ele
ctric
ity =
$77
/MW
h •
Nom
inal
3%
/dec
ade
impr
ovem
ent p
ost-2
020
• 50
MW
flui
dize
d be
d co
mbu
stio
n •
Cos
ts in
200
6 $
• C
apac
ity fa
ctor
= 8
5%
• A
dvan
ced
case
Sola
r The
rmal
•
2010
– 2
050
• Le
veliz
ed c
ost o
f ele
ctric
ity =
$16
0/M
Wh
• 20
10 –
Lev
eliz
ed c
ost o
f ele
ctric
ity =
$16
0/M
Wh
• 20
20 -
Leve
lized
cos
t of e
lect
ricity
= $
80/M
Wh
• 20
30 -
Leve
lized
cos
t of e
lect
ricity
= $
78/M
Wh
• 20
40 -
Leve
lized
cos
t of e
lect
ricity
= $
75/M
Wh
• 20
50 -
Leve
lized
cos
t of e
lect
ricity
= $
73/M
Wh
• N
omin
al 3
%/d
ecad
e im
prov
emen
t pos
t-202
0
• 80
MW
site
•
Cap
acity
fact
or =
34%
•
No
ener
gy s
tora
ge
• C
osts
in 2
006
$
Sola
r Ph
otov
olta
ic
• 20
10 –
205
0 •
Leve
lized
cos
t of e
lect
ricity
= $
250/
MW
h•
2010
– L
evel
ized
cos
t of e
lect
ricity
= $
250/
MW
h•
2020
- Le
veliz
ed c
ost o
f ele
ctric
ity =
$21
0/M
Wh
• 20
30 -
Leve
lized
cos
t of e
lect
ricity
= $
170/
MW
h•
2040
- Le
veliz
ed c
ost o
f ele
ctric
ity =
$13
0/M
Wh
• 20
50 -
Leve
lized
cos
t of e
lect
ricity
= $
90/M
Wh
• N
omin
al 3
%/d
ecad
e im
prov
emen
t pos
t-202
0
• D
istri
bute
d re
sour
ce
• In
clud
es e
nerg
y st
orag
e •
Cos
ts in
200
6 $

MER
GE
Tech
nolo
gy In
put A
ssum
ptio
ns
B-5
Li
mite
d Po
rtfo
lio S
cena
rio
Full
Port
folio
Sce
nario
N
otes
Plug
-In H
ybrid
El
ectr
ic
Vehi
cles
• N
ot a
vaila
ble
• 20
10
• $4
000/
vehi
cle
prem
ium
•
Max
3%
of p
asse
nger
veh
icle
flee
t •
2020
•
$300
0/ve
hicl
e pr
emiu
m
• M
ax 1
6% o
f pas
seng
er v
ehic
le fl
eet
• 20
30
• $2
000/
vehi
cle
prem
ium
•
Max
39%
of p
asse
nger
veh
icle
flee
t •
2040
•
$100
0/ve
hicl
e pr
emiu
m
• M
ax 6
0% o
f pas
seng
er v
ehic
le fl
eet
• 20
50
• $0
/veh
icle
pre
miu
m
• M
ax 1
00%
of p
asse
nger
veh
icle
flee
t
• P
HE
Vs
assu
med
to o
pera
te 5
0% o
f tim
e in
ele
ctric
mod
e.
• G
row
th o
f PH
EV
flee
t cal
ibra
ted
to
fit P
RIS
M a
naly
sis
targ
ets
in 2
020,
20
30.
Sou
rces
: •
EP
RI C
oalF
leet
for T
omor
row
R&
D P
rogr
am a
nd E
PR
I/CU
RC
Tec
hnol
ogy
Roa
dmap
[CU
RC
/EP
RI]
• E
PR
I Gen
erat
ion
Opt
ions
Stu
dy, E
nerg
y Te
chno
logy
Ass
essm
ent C
ente
r

C-1
C REFERENCES
[AEO 2007] U.S. DOE Energy Information Administration (EIA), 2007 Annual Energy Outlook, 2007.
[CURC/EPRI] Coal Utilization Research Council/EPRI Technology Roadmap, September 2006, http://www.coal.org/content/roadmap.htm
[EPRI 2000] “Evaluation of Innovative Fossil Fuel Power Plants with CO2 Removal”, EPRI Report 1000316, December 2000.
[EPRI 2007] “Updated Cost and Performance Estimates for Clean Coal Technologies Including CO2 Capture–2006”, EPRI Report 1013355, March 2007.
[EPAct 2005] Energy Policy Act of 2005, U.S. Department of Energy, August 2005.
[INEL/EPRI] Idaho National Laboratory/EPRI , “The Nuclear Energy Development Agenda: A Consensus Strategy for U.S. Government and Industry”, January 2006, gop.science.house.gov/hearings/energy06/April%206/Modeen.pdf
[PHEV] Environmental Assessment of Plug-In Hybrid Electric Vehicles, Volume 1 and Volume 2, EPRI Report 1015325, July 2007.
[NETL] “Carbon Sequestration Technology Roadmap and Progam Plan”, National Energy Technology Laboratory, U.S. Department of Energy, April 2007.
[NGNP] Next Generation Nuclear Plant (NGNP), Nuclear Energy Research Initiative, U.S. Department of Energy, http://nuclear.energy.gov/neri/neNERIresearch.html
[RICHELS, et al] R. Richels, T. Rutherford, G. Blanford, and Leon Clarke, “Managing the Transition Climate Stabilization, AEI-Brookings Joint Center for Regulatory Studies, Working Paper 07-01.
[SS 2006] “Advancing the Efficiency of Electricity Utilization”, 2006 EPRI Summer Seminar Paper, www.epri.com

Electric Power Research Institute 3420 Hillview Avenue, Palo Alto, California 94304 • PO Box 10412, Palo Alto, California 94303 USA
800.313.3774 • 650.855.2121 • [email protected] • www.epri.com
© 2007 Electric Power Research Institute (EPRI), Inc. All rights reserved. Electric Power Research Institute and EPRI are registered service marks of the Electric Power Research Institute.
PrintedonrecycledpaperintheUnitedStatesofAmerica
The Electric Power Research Institute (EPRI),
with major locations in Palo Alto, California;
Charlotte, North Carolina; and Knoxville, Tennessee,
was established in 1973 as an independent, nonprofit
center for public interest energy and environmental
research. EPRI brings together members, participants,
the Institute’s scientists and engineers, and other
leading experts to work collaboratively on solutions to
the challenges of electric power. These solutions span
nearly every area of electricity generation, delivery,
and use, including health, safety, and environment.
EPRI’s members represent over 90% of the electricity
generated in the United States. International
participation represents nearly 15% of EPRI’s total
research, development, and demonstration program.
Together...Shaping the Future of Electricity